Skill Building Activity 2 Determining the Concentration of a Species using a Vernier Spectrometer
|
|
|
- Marshall Lucas
- 6 years ago
- Views:
Transcription
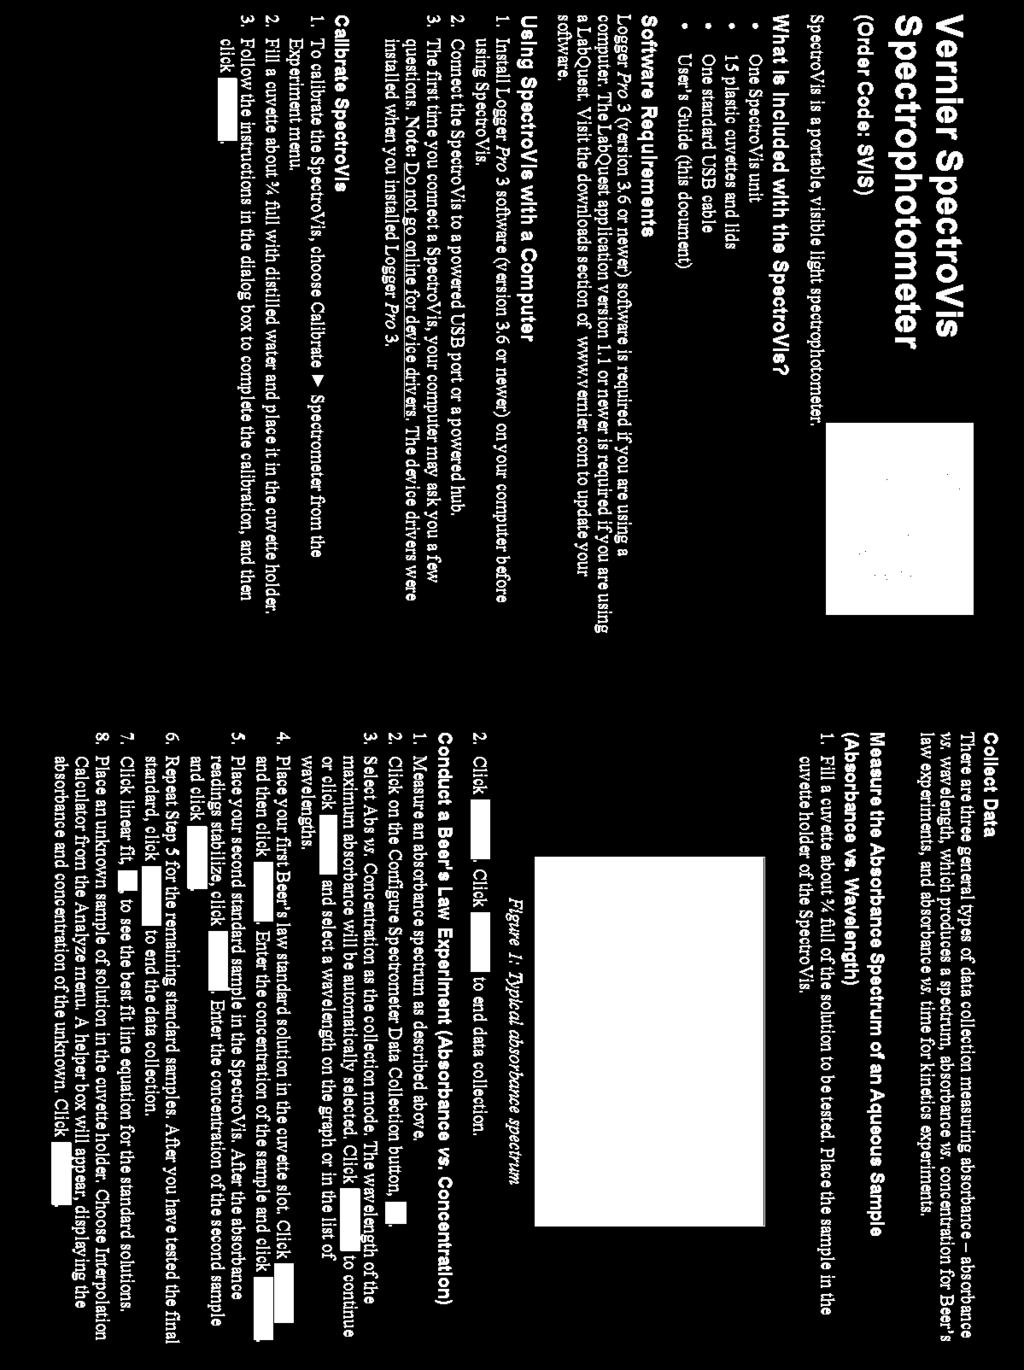
1 Skill Building Activity 2 Determining the Concentration of a Species using a Vernier Spectrometer Purpose To use spectroscopy to prepare a Beer s Law plot of known dilutions of copper(ii) sulfate so that the concentration of a saturated sample of aqueous copper(ii) sulfate can be determined. Background Spectroscopy is one of the most powerful analytical techniques in modern science. Before the advent of spectrophotometric techniques, a chemist interested in determining the amount of a particular substance present in a sample had to analyze the sample via a series of chemical reactions specific to that species and then carefully weigh the products (entire tomes exist detailing such analytical reactions and you will get to do some of these tests later in the semester). This process, however, is extremely time consuming, prone to error, and generally impractical for measuring trace amounts. Today, most routine assaying is done quickly and efficiently by means of spectroscopy. Spectroscopy works by relating the concentration of a species in solution to the amount of light it absorbs. In this experiment we will determine the quantity of copper(ii) sulfate using visible absorption spectroscopy. Because the wavelengths of light we will use are in the visible portion of the electromagnetic spectrum, our solutions will all be colored. However, this technique can also be used in other regions of the spectrum where the wavelength is not visible to our eyes, but can be measured using a photo-detector. In a solution containing a colored compound, the intensity of the color can be used to measure the concentration of the compound; the more intense the color, the higher the concentration. The spectrophotometer measures how much light is absorbed at a given wavelength. How a spectrometer works White light produced by the light source is transmitted off a diffraction grating through an aperture which narrows the beam before going through the sample. Adjusting the angle of the diffraction grating allows one to select the wavelength of the incident light which strikes with the sample. If light is absorbed by the sample, the intensity of the transmitted light exiting the sample (I) will be less than the intensity of the incident light (I o ). The ratio of transmitted light intensity to the incident light intensity is the transmittance, T: I T Equation 1 I 0 The extent to which the light is absorbed by the sample is due to the concentration of the sample, C. When the concentration is high, many absorbing molecules will be in the path of the light and will absorb it, and less light will be transmitted. When the concentration is low, fewer absorbing molecules will be struck by the light and little light will be absorbed; thus more light is transmitted in this case. Another factor that affects the intensity of the light exiting the sample is the path length, l, which is the distance the light travels through the sample. The greater the distance the light must travel through the solution (path length), the greater the number of absorbing molecules the light will strike. The relationship between transmittance, and those factors that directly affect the intensity, l and C, is expressed in the Beer-Lambert Law (or simply Beer s Law): log T A lc Equation 2 10 Figure 1 Diagram of a typical spectrometer Figure 1: Diagram of Typical Spectrometer where ε is a proportionality constant called the molar extinction coefficient (also known as the absorptivity) and A is the absorbance of light by the sample. The molar extinction coefficient SB2-1

2 depends on the structure of the species absorbing the light and the wavelength of the light absorbed. A larger extinction coefficient means that substance is better at absorbing light. Each pure substance has its own unique extinction coefficient. Experimental Considerations Two important questions to answer before using a spectrophotometer are: a) "What wavelength will I use to measure the absorption of my compounds?" and, b) "How will I calibrate my instrument to get accurate readings?" a) Choosing a wavelength The color of a substance depends on which wavelength of light it absorbs. If a substance absorbs red light only, it will appear green in color, green being the average color of all the unabsorbed wavelengths. The artist s wheel shown below becomes useful because the color a substance appears to be is directly across the wheel from the color of light that substances has absorbed. Many substances can be identified by their colors. For example, Co 2+ (aq) appears red because it absorbs primarily green light. On the other hand, Ni 2+ (aq) appears green indicating that a solution of Ni 2+ (aq) absorbs primarily red light. Figure 2 A color or artist s wheel Thus to answer the question, "What wavelength will I use to measure the absorption of my compounds?" it is important to choose a wavelength where the solution strongly absorbs light. For example when studying a red solution it would be far better to use green light (red's complement), which is strongly absorbed by the solution; rather than orange or red light because these colors would be less strongly absorbed. The stronger the absorption at a particular wavelength the more sensitive the instrument will be at that wavelength and the more accurate your results. Thus, for a red-colored sample a wavelength in the green would probably be best; conversely if a sample is blue, then a wavelength in the orange region would probably be best. In practice one selects one "best" wavelength for the experiment by measuring the absorption of the solution in question across this range of wavelengths and choosing the wavelength that gives the greatest absorption. For example, for the red solution described above, the experimenter might choose to measure the absorption of the sample at a range of wavelengths between 480nm and 560nm, and then narrow-in on the wavelength that gives the greatest numeric value of the absorbance. b) Calibrating the spectrometer Once the specific wavelength that will be used for the experiment is chosen, the experimenter needs to calibrate his or her spectrometer so that the absorbance readings can be converted into useful data such as molarity (or another unit of concentration) of the sample. As noted on the previous page, Beer s Law relates absorbance to concentration (molarity) of a sample. A =elc Equation 3 where A is the absorbance of the sample measured by the spectrophotometer, e is the molar absorptivity (or the molar extinction coefficient), l is the path length or distance the light travels through the sample, and C is the concentration of the solution. In most instruments, the path length, l, is a constant (1.0 cm in our experiment) and can therefore be factored into e. SB2-2
3 Thus the Beer s Law equation can be simplified as: A =ec y = m x which looks like an equation of a line with intercept of zero. The molar absorptivity, e, can therefore be determined by finding the slope of a plot of the absorbance as a function of concentration for a series of standard solutions of known concentrations. This is known as a calibration curve. Once e has been determined from the calibration curve, the Beer Law s equation can be used to determine the concentration of an unknown solution by measuring its absorbance under the same conditions. Preparing your known standards and unknown solution for analysis You will be preparing five copper(ii) sulfate solutions of known concentration (standard solutions) by diluting known volumes of a M CuSO 4 (aq) stock solution with deionized water. Copper(II) sulfate has an easily-identifiable vivid, bright blue color whose intensity is dependent on the solution s concentration and can be measured using spectroscopy. SB2-3
4 Procedure Safety: GENERAL SAFETY: Students must wear safety goggles at all times. WASTE DISPOSAL: All solutions used in this lab must be disposed in a waste container. Materials and Equipment You will need the following equipment: 8 small test tubes two cuvettes for the spectrophotometer one 1.00 ml volumetric pipette one 2.00 ml volumetric pipette one 3.00 ml volumetric pipette one 4.00 ml volumetric pipette Your instructor will provide you with the spectrophotometer, cuvettes, stock solution, volumetric flasks, pipettes, and unknowns. All other equipment is in your lab drawer. 1. Measure out approximately 20 ml of stock M CuSO 4 (aq) in a small beaker. 2. Rinse your pipette with deionized water followed by the stock solution. 3. Label six clean, dry, small test tubes 1, 2, 3, 4, 5, and 6. Fill Tube #1 approximately half-full with deionized water. Fill Tube #6 approximately half-full with stock solution. For Tubes #2-5, pipette the following volumes of stock solution and deionized water into each and mix well. Be sure to rinse the pipettes with deionized water and standard solution first. Calculate the concentration in molarity for Tubes #2-5. ml of M Tube ml of DI H CuSO 4 used 2 O added Concentration (M) Zero the instrument with Tube #1. 5. Use Tube #6 (stock solution) to find your wavelength to measure at by the directions for the Vernier Spectrometer a poor choice of wavelengths will result in poor data. See the introduction to this experiment for help in choosing a wavelength. If time is limited, your instructor may provide you with a specific wavelength to use. 6. Measure the absorbance of Tubes #2-6 at the wavelength found in Step 4 by filling the provided cuvettes ¾ of the way full with the solution and inserting in the Vernier Spectrometer and hitting Keep to record the molarity and absorbance. Be sure to clean the cuvettes with deionized water and dry them between each use. You will have six measured data points including the deionized water blank (which should have a zero absorbance if you properly zeroed the spectrometer). 7. Make a calibration curve using Excel by plotting the concentration of the six solutions on the x- axis and the absorbance of each on the y-axis. Your intercept should be at the origin (0,0) since your blank solution counts as one of the points. Calculate a trendline and report the equation and the R 2 value on your graph to include with your post-lab. Analyzing your saturated solution 8. Add 1.8 g of copper(ii) sulfate pentahydrate crystals to 3 ml of deionized water to a clean, dry SB2-4

5 small test tube. While it is not important to know the exact amount of solid and liquid, it is imperative that some solid remains undissolved in the beaker at all times. If at any point all the solid does dissolve, add increments of 0.2 g more until solid reappears. 9. Cool the beaker in an ice bath while mixing thoroughly. Record this temperature (it should be close to 0 C). 10. Allow the solid to settle to the bottom of the solution. Use a plastic dropper to carefully remove solution only to another clean, dry test tube, leaving the solid behind. Using a 1.00 ml volumetric pipette, carefully pipette solution out and into a new clean, dry small test tube labeled 7. Ensure that you do not pull up any solid into the pipette. Be sure to rinse the pipette with deionized water and stock solution first. Pipette accurately 4.00 ml of deionized water to the last test tube that contains the CuSO 4 (aq). 11. Using the same wavelength that you used to construct your standard curve in Step 5, measure the absorbance of this diluted solution. This should not be included on your graph, only recorded. You can now use the equation of your best-fit-line to determine the concentration of the dilution of saturated CuSO 4 (aq). 12. Because this is a diluted solution, you will now need to calculate backwards from this concentration to determine the actual concentration of copper(ii) sulfate in your original unknown sample, in molarity. 13. Report your concentration of saturated copper(ii) sulfate at your recorded temperature and compare to the CRC value at 0 C, in grams per 100 ml of water. A b s o r b a n c e Figure 1: Beer s Law Calibration Plot [CuSO 4 ] SB2-5
6 SB2-6
7 Lab Report for Measuring Copper(II) Sulfate Using Spectrophotometry Concentration of CuSO 4 (aq) stock solution from bottle: Wavelength chosen for analysis: M nm Justification for choice of wavelength: Calibration Standards Data Table: Solution Concentration (M) Absorbance Visual Appearance Cuvette (1) (pure water) Cuvette (2) Cuvette (3) Cuvette (4) Cuvette (5) Cuvette (6) (pure standard) Show calculations for the concentrations of cuvettes (2-5) in your notebook. You will need to use M 1 V 1 =M 2 V 2 Make a calibration curve by plotting concentration in molarity on the x-axis versus absorbance on the y-axis and attach it to your report. Being certain it goes through the origin because zeroing your instrument ensured that at zero concentration the absorbance was zero Saturated Solution Analysis: Temperature of ice bath: C Volume of saturated solution used Volume of deionized water added Observed color of saturated solution: Wavelength used to analyze saturated solution: Absorbance of saturated solution: Concentration of CuSO 4 5 H 2 O in diluted saturated solution: show calculations (hint: this is where you use the slope of your best-fit-line): ml ml nm M Concentration of CuSO 4 5 H 2 O(aq) in original undiluted saturated sample: show calculations: M Concentration of CuSO 4 5 H 2 O(aq) in g/100 ml water: g/100 ml show calculations: CRC value for solubility of CuSO 4 5 H 2 O(aq) in 100 ml of water at 0 C SB2-7
Experiment 18 - Absorption Spectroscopy and Beer s Law: Analysis of Cu 2+
 Experiment 18 - Absorption Spectroscopy and Beer s Law: Analysis of Cu 2+ Many substances absorb light. When light is absorbed, electrons in the ground state are excited to higher energy levels. Colored
Experiment#1 Beer s Law: Absorption Spectroscopy of Cobalt(II)
") : Absorption Spectroscopy of Cobalt(II) OBJECTIVES In successfully completing this lab you will: prepare a stock solution using a volumetric flask; use a UV/Visible spectrometer to measure an absorption
: Absorption Spectroscopy of Cobalt(II) OBJECTIVES In successfully completing this lab you will: prepare a stock solution using a volumetric flask; use a UV/Visible spectrometer to measure an absorption
Experiment 7A ANALYSIS OF BRASS
 Experiment 7A ANALYSIS OF BRASS FV 10/21/10 MATERIALS: Spectronic 20 spectrophotometers, 2 cuvettes, brass sample, 7 M HNO 3, 0.100 M CuSO 4, 2 M NH 3, two 50 ml beakers, 100 ml beaker, two 25 ml volumetric
Experiment 11 Beer s Law
 Experiment 11 Beer s Law OUTCOMES After completing this experiment, the student should be able to: determine the wavelength (color) of maximum absorbance for a solution. examine the relationship between
Experiment 11 Beer s Law
 Experiment 11 Beer s Law OUTCOMES After completing this experiment, the student should be able to: determine the wavelength (color) of maximum absorbance for a solution. examine the relationship between
Introduction to Spectroscopy: Analysis of Copper Ore
 Absorbance Introduction to Spectroscopy: Analysis of Copper Ore Introduction The goal of this lab is to determine the unknown concentration of two different copper solution samples, taken from fictitious
Introduction to Spectroscopy: Analysis of Copper Ore
 Introduction to Spectroscopy: Analysis of Copper Ore Introduction The goal of this lab is to determine the unknown concentration of two different copper solution samples, taken from fictitious mining sites
Introduction to Spectroscopy: Analysis of Copper Ore
 Introduction to Spectroscopy: Analysis of Copper Ore Thousands of years ago, copper was abundant enough in quantity that it could be found on the Earth s surface. Prospecting for copper then was relatively
Experiment 2: The Beer-Lambert Law for Thiocyanatoiron (III)
") Chem 1B Dr. White 11 Experiment 2: The Beer-Lambert Law for Thiocyanatoiron (III) Objectives To use spectroscopy to relate the absorbance of a colored solution to its concentration. To prepare a Beer s
Chem 1B Dr. White 11 Experiment 2: The Beer-Lambert Law for Thiocyanatoiron (III) Objectives To use spectroscopy to relate the absorbance of a colored solution to its concentration. To prepare a Beer s
Experiment 2: The Beer-Lambert Law for Thiocyanatoiron (III)
") Chem 1B Saddleback College Dr. White 1 Experiment 2: The Beer-Lambert Law for Thiocyanatoiron (III) Objectives To use spectroscopy to relate the absorbance of a colored solution to its concentration. To
Chem 1B Saddleback College Dr. White 1 Experiment 2: The Beer-Lambert Law for Thiocyanatoiron (III) Objectives To use spectroscopy to relate the absorbance of a colored solution to its concentration. To
Spectrophotometric Determination of an Equilibrium Constant
 Spectrophotometric Determination of an Equilibrium Constant v021214 Objective To determine the equilibrium constant (K c ) for the reaction of iron (III) ion with thiocyanate (SCN - ) to form the thiocyanatoiron(iii)
DETERMINATION OF K c FOR AN EQUILIBRIUM SYSTEM
 DETERMINATION OF K c FOR AN EQUILIBRIUM SYSTEM 1 Purpose: To determine the equilibrium constant K c for an equilibrium system using spectrophotometry to measure the concentration of a colored complex ion.
Introduction to Spectroscopy: Analysis of Copper Ore
 Introduction to Spectroscopy: Analysis of Copper Ore Using a Buret and Volumetric Flask: 2.06 ml of solution 2.47 ml of solution 50.00 ml delivered delivered Volumetric Flask Reading a buret: Burets are
Experiment 13H THE REACTION OF RED FOOD COLOR WITH BLEACH 1
 Experiment 13H 08/03/2017 AHRM THE REACTION OF RED FOOD COLOR WITH BLEACH 1 PROBLEM: Determine the rate law for the chemical reaction between FD&C Red Dye #3 and sodium hypochlorite. LEARNING OBJECTIVES:
EXPERIMENT #3 A Beer's Law Study
 OBJECTVES: EXPERMENT #3 A Beer's Law Study To operate a Spectronic 20 To convert from percent transmission to absorbance units To plot absorbance versus wavelength and find max To plot absorbance versus
Beer's- Lambert Law and Standard Curves. BCH 312 [Practical]
![Beer's- Lambert Law and Standard Curves. BCH 312 [Practical]](/thumbs/78/77692425.jpg "Beer's- Lambert Law and Standard Curves. BCH 312 [Practical]") Beer's- Lambert Law and Standard Curves BCH 312 [Practical] Spectrophotometer: Spectrophotometer can be used to measure the amount of light absorbed or transmitted by a solution. It consist of two parts:
Beer's- Lambert Law and Standard Curves BCH 312 [Practical] Spectrophotometer: Spectrophotometer can be used to measure the amount of light absorbed or transmitted by a solution. It consist of two parts:
Introduction to Spectroscopy: Analysis of Copper Ore
 Introduction to Spectroscopy: Analysis of Copper Ore Using a Buret and Volumetric Flask: 2.06 ml of solution delivered 2.47 ml of solution delivered 50.00 ml Volumetric Flask Reading a buret: Burets are
Spectrometric Determination of the Acid Dissociation Constant of an Acid-base Indicator
 Spectrometric Determination of the Acid Dissociation Constant of an Acid-base Indicator Learning Goals 1. Gain appreciation of the dynamics of perturbing a chemical equilibrium 2. Gain an understanding
Spectroscopy II Introduction: Spectrophotometry and Fluorometry
 Introduction: Spectrophotometry and Fluorometry In this experiment you will use the SpectroVis Plus (a small computer controlled Spectrophotometer + Fluorometer) to: Measure the Transmission and Absorbance
Experiment 13I THE REACTION OF RED FOOD COLOR WITH BLEACH 1
 Experiment 13I FV 1/11/16 THE REACTION OF RED FOOD COLOR WITH BLEACH 1 PROBLEM: Determine the rate law for the chemical reaction between FD&C Red Dye #3 and sodium hypochlorite. LEARNING OBJECTIVES: By
Experiment 6: Determination of the Equilibrium Constant for Iron Thiocyanate Complex
 Experiment 6: Determination of the Equilibrium Constant for Iron Thiocyanate Complex The data for this lab will be taken as a class to get one data set for the entire class. I. Introduction A. The Spectrophotometer
CHEM Lab 7: Determination of an Equilibrium Constant using Spectroscopy
 CHEM 0012 Lab 7: Determination of an Equilibrium Constant using Spectroscopy 1 Determination of the equilibrium constant of the following equilibrium system at room temperature. Fe 3+ (aq) + SCN- (aq)
Experimental Procedure Overview
 Lab 4: Determination of an Equilibrium Constant using Spectroscopy Determination of the equilibrium constant of the following equilibrium system at room temperature. Fe 3+ (aq) + SCN (aq) Fe(SCN) 2+ (aq)
Thermodynamics and the Solubility of Sodium Tetraborate Decahydrate
 Thermodynamics and the Solubility of Sodium Tetraborate Decahydrate In this experiment you, as a class, will determine the solubility of sodium tetraborate decahydrate (Na 2 B 4 O 7 10 H 2 O or Na 2 [B
Colorimetric analysis of aspirin content in a commercial tablet
 Colorimetric analysis of aspirin content in a commercial tablet v010214 Objective In this lab, you will prepare standard solutions, and use Beer s Law to construct a calibration curve. You will determine
MORE LIGHTS, COLOR, ABSORPTION!
 Name Partner(s) Section Date MORE LIGHTS, COLOR, ABSORPTION! PRE-LAB QUERIES 1. The terms absorption and transmittance are often used when describing the interaction of light with matter. Explain what
CHEMICAL KINETICS E + 2B 2C + D (1)
") CHEMICAL KINETICS Chemical kinetics is the branch of chemistry that is concerned with the study of the rates and mechanisms of chemical reactions. The rate of a reaction is a measure of its speed. Consider
CHEMICAL KINETICS Chemical kinetics is the branch of chemistry that is concerned with the study of the rates and mechanisms of chemical reactions. The rate of a reaction is a measure of its speed. Consider
2014 NJIT RET Program. MODULE TOPIC: Two Methods of Determining the Concentration of Soluble Compounds or Analytes..
 NJIT RET Summer program 2014 Lesson Module 2014 NJIT RET Program MODULE TOPIC: Two Methods of Determining the Concentration of Soluble Compounds or Analytes.. LESSON ONE TOPIC: Colorimetric Analysis of
Experiment 13. Dilutions and Data Handling in a Spreadsheet rev 1/2013
 Absorbance Experiment 13 Dilutions and Data Handling in a Spreadsheet rev 1/2013 GOAL: This lab experiment will provide practice in making dilutions using pipets and introduce basic spreadsheet skills
Determining the Concentration of a Solution: Beer s Law
 Determining the Concentration of a Solution: Beer s Law Vernier Spectrometer 1 The primary objective of this experiment is to determine the concentration of an unknown copper (II) sulfate solution. You
Lab Investigation 4 - How could you make more of this dye?
 Lab Investigation 4 - How could you make more of this dye? USING SPECTROSCOPY TO DETERMINE SOLUTION CON- CENTRATION Guiding Question How could you make more of this dye? INTRODUCTION A solution is a homogeneous
Determination of an Equilibrium Constant
 Last updated 1/29/2014 - GES Learning Objectives Students will be able to: Determine the numerical value of an equilibrium constant from measured concentrations of all reaction species. Use an absorption
Determining the Concentration of a Solution: Beer s Law
 Determining the Concentration of a Solution: Beer s Law The primary objective of this experiment is to determine the concentration of an unknown cobalt (II) chloride solution. You will use a Vernier SpectroVis
Chem 321 Lecture 18 - Spectrophotometry 10/31/13
 Student Learning Objectives Chem 321 Lecture 18 - Spectrophotometry 10/31/13 In the lab you will use spectrophotometric techniques to determine the amount of iron, calcium and magnesium in unknowns. Although
Chemistry 213. A KINETIC STUDY: REACTION OF CRYSTAL VIOLET WITH NaOH LEARNING OBJECTIVES
 Chemistry 213 A KINETIC STUDY: REACTION OF CRYSTAL VIOLET WITH NaOH The objectives of this experiment are to... LEARNING OBJECTIVES study the reaction rate of crystal violet with NaOH using a Spectronic
Determining the Rate Law and Activation Energy for the Methyl Blue Reaction:
 Experiment 4 Determining the Rate Law and Activation Energy for the Methyl Blue Reaction: Pre-lab Assignment Before coming to lab: Read the lab thoroughly. An exercise in experimental design Answer the
CHEMISTRY 135 General Chemistry II. Determination of an Equilibrium Constant
 CHEMISTRY 135 General Chemistry II Determination of an Equilibrium Constant Show above is a laboratory sample from chemistry, not phlebotomy. [1] Is the bloody-looking product the main component of this
CHM 152 updated May 2011 Lab 6: Experimentally Determining an Equilibrium Constant using Spectrophotometry
 CHM 152 updated May 2011 Lab 6: Experimentally Determining an Equilibrium Constant using Spectrophotometry Introduction In this lab you will experimentally determine the equilibrium constant with respect
DETERMINATION OF AN EQUILIBRIUM CONSTANT
 DETERMINATION OF AN EQUILIBRIUM CONSTANT In this experiment the equilibrium properties of the reaction between the iron(iii) ion and the thiocyanate ion will be studied. The relevant chemical equation
Spectrophotometric Determination of the Copper (II) Sulfate Pentahydrate Content in a Mixture
 Sulfate Pentahydrate Content in a Mixture") EXPERIMENT 7B Spectrophotometric Determination of the Copper (II) Sulfate Pentahydrate Content in a Mixture QUANTITATIVE ANALYSIS Quantitative analysis is a branch of analytical chemistry concerned with
EXPERIMENT 7B Spectrophotometric Determination of the Copper (II) Sulfate Pentahydrate Content in a Mixture QUANTITATIVE ANALYSIS Quantitative analysis is a branch of analytical chemistry concerned with
A Study of Beer s Law Prelab
 1. What is the purpose of this experiment? A Study of Beer s Law Prelab 2. Using the absorbance versus wavelength curve given in Figure I, determine the approximate value of max of the dye used to construct
Chemistry 112 SPECTROPHOTOMETRIC DETERMINATION OF AN EQUILIBRIUM CONSTANT
 Chemistry 112 SPECTROPHOTOMETRIC DETERMINATION OF AN EQUILIBRIUM CONSTANT INTRODUCTION The principle underlying a spectrophotometric method of analysis involves the interaction of electromagnetic radiation
Chemistry 1215 Experiment #11 Spectrophotometric Analysis of an Unknown Brass Sample
 Chemistry 1215 Experiment #11 Spectrophotometric Analysis of an Unknown Brass Sample Objective In this experiment you will use spectrophotometric measurements to determine the copper concentration of a
CH 112 Special Assignment #4 Chemistry to Dye for: Part C
 CH 112 Special Assignment #4 Chemistry to Dye for: Part C PRE-LAB ASSIGNMENT: Make sure that you read this handout and bring the essentials to lab with you. Review Light, energy and color (pp 17-18), Measuring
Determination of Orthophosphate Ion
 Determination of Orthophosphate Ion Introduction Phosphorous, in the form of phosphate, is one of several important elements in the growth of plants. Excessive algae growth in water is stimulated by the
Beer's Law and Data Analysis *
 OpenStax-CNX module: m15131 1 Beer's Law and Data Analysis * Mary McHale This work is produced by OpenStax-CNX and licensed under the Creative Commons Attribution License 2.0 1 Beer's Law and Data Analysis
Determining the Concentration of a Solution: Beer s Law. Evaluation copy. Figure 1
 Determining the Concentration of a Solution: Beer s Law Computer 17 The primary objective of this experiment is to determine the concentration of an unknown copper (II) sulfate solution. You will use a
CHM112 Lab Determination of an Equilibrium Constant Grading Rubric
 Name Team Name CHM112 Lab Determination of an Equilibrium Constant Grading Rubric Criteria Points possible Points earned Lab Performance Printed lab handout and rubric was brought to lab 3 Initial concentrations
Experiment 12: SPECTROSCOPY: EMISSION & ABSORPTION
 Sample Experiment 12: SPECTROSCOPY: EMISSION & ABSORPTION Purpose: Emission and absorption spectroscopy is to be explored from different perspectives in a multipart experiment. Part I: Certain elements
REVIEW OF LAB TECHNIQUES
 Experiment 1 REVIEW OF LAB TECHNIQUES Prepared by Masanobu M. Yamauchi and Ross S. Nord, Eastern Michigan University PURPOSE To review density calculations, Beer s Law and the use of electronic balances,
EXPERIMENT 23. Determination of the Formula of a Complex Ion INTRODUCTION
 EXPERIMENT 23 Determination of the Formula of a Complex Ion INTRODUCTION Metal ions, especially transition metal ions, possess the ability to form complexes (as shown below) with ions, organic and inorganic
Rate law Determination of the Crystal Violet Reaction Using the Isolation Method
 Rate law Determination of the Crystal Violet Reaction Using the Isolation Method Introduction A common challenge in chemical kinetics is to determine the rate law for a reaction with multiple reactants.
EXPERIMENT 14. ACID DISSOCIATION CONSTANT OF METHYL RED 1
 EXPERIMET 14. ACID DISSOCIATIO COSTAT OF METHYL RED 1 The acid dissociation constant, Ka, of a dye is determined using spectrophotometry. Introduction In aqueous solution, methyl red is a zwitterion and
Determination of Orthophosphate Ion
 Determination of Orthophosphate Ion Introduction Phosphorous, in the form of phosphate, is one of several important elements in the growth of plants. Excessive algae growth in water is stimulated by the
Experiment 10 Dye Concentration Using a UV-Vis Spectrophotometer
 Experiment 10 Dye Concentration Using a UV-Vis Spectrophotometer version 2 Lynta Thomas, Ph.D. and Laura B. Sessions, Ph.D. In this experiment, you will determine the concentration of Allura Red Dye (FD&C
VISIBLE SPECTROSCOPY
 INTRODUCTION SPECTROPHOTOMETRY OF Co 2+ (Revised: 1-24-93) In this experiment, the Beer-Lambert Law, A = åcl, will be applied to a series of aqueous solutions of CoCl 2. The pink color of the solutions
AIM To verify Beer - Lambert s law and to determine the dissociation constant (Ka) of methyl red, Spectrophotometrically.
 of methyl red, Spectrophotometrically.") C 141(Expt. No. ) NAME : ROLL No. : SIGNATURE : BATCH : DATE : VERIFICATION OF BEER - LAMBERT S LAW & DETERMINATION OF DISSOCIATION CONSTANT (Ka) OF METHYLRED, SPECTROPHOTOMETRICALLY AIM To verify Beer
C 141(Expt. No. ) NAME : ROLL No. : SIGNATURE : BATCH : DATE : VERIFICATION OF BEER - LAMBERT S LAW & DETERMINATION OF DISSOCIATION CONSTANT (Ka) OF METHYLRED, SPECTROPHOTOMETRICALLY AIM To verify Beer
MOLEBIO LAB #4: Using a Spectrophotometer
 Introduction: Spectrophotometry MOLEBIO LAB #4: Using a Spectrophotometer Many kinds of molecules interact with or absorb specific types of radiant energy in a predictable fashion. For example, when while
Experiment 8: DETERMINATION OF AN EQUILIBRIUM CONSTANT
 Experiment 8: DETERMINATION OF AN EQUILIBRIUM CONSTANT Purpose: The equilibrium constant for the formation of iron(iii) thiocyanate complex ion is to be determined. Introduction: In the previous week,
Experiment 12H, Parts A and B
 Experiment 12H, Parts A and B AHRM 8/17 PRINCIPLES OF EQUILIBRIUM AND THERMODYNAMICS MATERIALS: PURPOSE: 0.0200 M Fe(NO 3 ) 3 in 1 M HNO 3, 0.000200 M KSCN, 2.0 M HNO 3, solid Fe(NO 3 ) 3. 9H 2 O with
REVIEW OF LAB TECHNIQUES
 Experiment 1 REVIEW OF LAB TECHNIQUES Prepared by Masanobu M. Yamauchi and Ross S. Nord, Eastern Michigan University PURPOSE To review density calculations, Beer s Law and the use of electronic balances,
Bio 120 Lab 5: Quantitative Analysis
 Bio 120 Lab 5: Quantitative Analysis Remember from the measurement lab, concentration is the amount of a solute, also called an analyte, in a given amount of solution. We need a way to measure the concentration
K sp = [Pb 2+ ][I ] 2 (1)
![K sp = [Pb 2+ ][I ] 2 (1)](/thumbs/80/82192492.jpg "K sp = [Pb 2+ ][I ] 2 (1)") Chem 1B Saddleback College Dr. White 1 Experiment 11: Determination of K sp Objectives To determine the concentration of an unknown using a Beer- Lambert Plot. To determine the K sp for a relatively insoluble
Chem 1B Saddleback College Dr. White 1 Experiment 11: Determination of K sp Objectives To determine the concentration of an unknown using a Beer- Lambert Plot. To determine the K sp for a relatively insoluble
CHEM 254 EXPERIMENT 9. Chemical Equilibrium-Colorimetric determination of equilibrium constant of a weak acid
 CHEM 254 EXPERIMENT 9 Chemical Equilibrium-Colorimetric determination of equilibrium constant of a weak acid For a weak acid that can only partly dissociate the equilibrium constant is related to activities
Experiment #7. Determination of an Equilibrium Constant
 Experiment #7. Determination of an Equilibrium Constant Introduction It is frequently assumed that reactions go to completion, that all of the reactants are converted into products. Most chemical reactions
Experiment 8 Introduction to Volumetric Techniques I. Objectives
 Experiment 8 Introduction to Volumetric Techniques I Objectives 1. To learn the proper technique to use a volumetric pipette. 2. To learn the proper technique to use a volumetric flask. 3. To prepare a
Kinetics of Crystal Violet Fading AP Chemistry Big Idea 4, Investigation 11 An Advanced Inquiry Lab (adapted by Flinn Scientific, Inc.
 Introduction Kinetics of Crystal Violet Fading AP Chemistry Big Idea 4, Investigation 11 An Advanced Inquiry Lab (adapted by Flinn Scientific, Inc.) Crystal violet is a common, beautiful purple dye. In
#26 Preparation of Solutions
 #26 Preparation of Solutions Purpose: This experiment provides practical experience in preparing solutions using the concentration units of molarity and molality. Introduction Preparing solutions is one
Determination of an Equilibrium Constant
 7 Determination of an Equilibrium Constant Introduction When chemical substances react, the reaction typically does not go to completion. Rather, the system goes to some intermediate state in which the
CHEM 334 Quantitative Analysis Laboratory
 The Methods of Calibration Curve and Standard Addition Introduction One of the principle activities in the Quantitative Analysis Laboratory is the measurement of the concentration or total quantity of
EXPERIMENT 7 Reaction Stoichiometry and Percent Yield
 EXPERIMENT 7 Reaction Stoichiometry and Percent Yield INTRODUCTION Stoichiometry calculations are about calculating the amounts of substances that react and form in a chemical reaction. The word stoichiometry
aa + bb cc + dd Equation 1
 Experiment: The Determination of K eq for FeSCN 2+ Introduction For any reversible chemical reaction at equilibrium, the concentrations of all reactants and products are constant or stable. There is no
So, What Does it Indicate?
 So, What Does it Indicate? Introduction Phenolphthalein is a common indicator you may have used in a previous science course, such as Chemistry 184. In solutions with a ph of less then 8.3, this compound
Determination of the Equilibrium Constant for the Iron (III) thiocynate Reaction
 thiocynate Reaction") Lab 4. Determination of the Equilibrium Constant for the Iron (III) thiocynate Reaction Prelab Assignment Before coming to lab: After reading "Lab Notebook Policy and Format for Lab Reports" handout, complete
Lab 4. Determination of the Equilibrium Constant for the Iron (III) thiocynate Reaction Prelab Assignment Before coming to lab: After reading "Lab Notebook Policy and Format for Lab Reports" handout, complete
Spectrophotometry Materials
 Spectrophotometry Materials Item per Class per Bench Genesys 10UV Spectrophotometer 6 1 13 ml test tubes box 7 Test tube racks 6 1 1% Albumin solution 25 ml/one flask 2 ml 0.7% Albumin solution (unknown
EXPERIMENT 6 INTRODUCTION TO SPECTROSCOPY
 EXPERIMENT 6 INTRODUCTION TO SPECTROSCOPY INTRODUCTION Much of what we know about the structures of atoms and molecules has been learned through experiments in which photons (electromagnetic radiation
Investigating Transition Metal Complexes
 Exercise 4 Investigating Transition Metal Complexes 4 Introduction Colour is a well known property of the transition metals. The colour produced as parts of the visible spectrum are due to electron transitions
Experimental Procedure. Lab 406
 Experimental Procedure Lab 406 Overview This experiment is to be complete in cooperation with other chemists/chemist groups in the laboratory. In PART A, a standardized solution of hydrochloric acid is
So, What Does it Indicate?
 So, What Does it Indicate? Introduction Phenolphthalein is a common indicator you may have used in a previous science course, such as Chemistry 130 or Chemistry 170. In solutions with a ph of less then
Beer s Law 29 January 2019
 Beer s Law 29 January 2019 I like blue. Today we are going to learn a lot! about beer??? Objectives: To learn more about the visible spectrum of a colored solution and how concentration and color intensity
Spectrophotometric Determination of Iron
 Spectrophotometric Determination of Iron INTRODUCTION Many investigations of chemical species involve the interaction between light and matter. One class of these investigations, called absorbance spectrophotometry,
Laboratory Measurements and Procedures
 18 Introduction Measurements of masses, volumes, and preparation of chemical solutions of known composition are essential laboratory skills. The goal of this exercise is to gain familiarity with these
Chesapeake Campus Chemistry 111 Laboratory
 Chesapeake Campus Chemistry 111 Laboratory Objectives Calculate the density of a sugar solution. Evaluate lab sources of error and their effect on an experiment. Introduction The density of an object is
Solubility Product Constants
 Solubility Product Constants PURPOSE To measure the solubility product constant (K sp ) of copper (II) iodate, Cu(IO 3 ) 2. GOALS To measure the molar solubility of a sparingly soluble salt in water. To
Lab #12: Determination of a Chemical Equilibrium Constant
 Lab #12: Determination of a Chemical Equilibrium Constant Objectives: 1. Determine the equilibrium constant of the formation of the thiocyanatoiron (III) ions. 2. Understand the application of using a
Beer s Law: Determining the Concentration of a Solution
 Bellevue College CHEM& 161 Beer s Law: Determining the Concentration of a Solution Background Color additives are used in foods for a variety of reasons. Sometimes they are used to compensate for the natural
Introduction. The amount of radiation absorbed may be measured in a number of ways: Transmittance, T = P / P 0 % Transmittance, %T = 100 T
 Introduction Many compounds absorb ultraviolet (UV) or visible (Vis.) light. The diagram below shows a beam of monochromatic radiation of radiant power P 0, directed at a sample solution. Absorption takes
Chemistry 1B Experiment 17 89
 Chemistry 1B Experiment 17 89 17 Thermodynamics of Borax Solubility Introduction In this experiment, you will determine the values of H and S for the reaction which occurs when borax (sodium tetraborate
Lab 5: Calculating an equilibrium constant
 Chemistry 162 The following write-up is inaccurate for the particular chemicals we are using. Please have all sections up through and including the data tables ready before class on Wednesday, February
Chemical Equilibrium: Finding a Constant, Kc
 Lab12 Chemical Equilibrium: Finding a Constant, Kc The purpose of this lab is to experimentally determine the equilibrium constant, K c, for the following chemical reaction: Fe 3+ (aq) + SCN (aq) FeSCN
A COMPLEX IRON SALT & BEER S LAW
 A OMPLEX IRO SALT & BEER S LAW LABORATORY OTEBOOK Objectives, hemical & Equipment Tables, and Procedures & Observations should all be entered into your EL. All spectra files should be attached in the Procedures
Clinical Chemistry (CHE221) Professor Hicks Week 1. Statistics Made Slightly Less Boring and Introduction to Spectrophotometry. Accuracy vs Precision
 Professor Hicks Week 1. Statistics Made Slightly Less Boring and Introduction to Spectrophotometry. Accuracy vs Precision") Clinical Chemistry (CHE221) Professor Hicks Week 1 Statistics Made Slightly Less Boring and Introduction to Spectrophotometry 3 Accuracy vs Precision Precision is the consistency of a measurement made
Clinical Chemistry (CHE221) Professor Hicks Week 1 Statistics Made Slightly Less Boring and Introduction to Spectrophotometry 3 Accuracy vs Precision Precision is the consistency of a measurement made
Determination of the Solubility-Product Constant for a Sparingly Soluble Salt
 Determination of the Solubility-Product Constant for a Sparingly Soluble Salt To become familiar with equilibria involving sparingly soluble substances by determining the value of the solubility-product
Introduction to Chemistry Techniques Prelab (Week 1) 2. Determine the number of significant figures in each of the following numbers.
 2. Determine the number of significant figures in each of the following numbers.") Introduction to Chemistry Techniques Prelab (Week 1) Name Total /10 SHOW ALL WORK NO WORK = NO CREDIT 1. What is the purpose of this experiment? 2. Determine the number of significant figures in each of
Introduction to Chemistry Techniques Prelab (Week 1) Name Total /10 SHOW ALL WORK NO WORK = NO CREDIT 1. What is the purpose of this experiment? 2. Determine the number of significant figures in each of
Preparation of Standard Curves. Principle
 Preparation of Standard urves Principle Many laboratory tests require the measurement of concentration be evaluated or read in a photometer (colorimeter or spectrophotometer). Since these instruments are
Aspirin Lab By Maya Parks Partner: Ben Seufert 6/5/15, 6/8/15
 Aspirin Lab By Maya Parks Partner: Ben Seufert 6/5/15, 6/8/15 Abstract: This lab was performed to synthesize acetyl salicylic acid or aspirin from a carboxylic acid and an alcohol. We had learned in class
Experiment. Quantification of Ascorbic acid by Fluorescence Spectroscopy1
 Experiment. Quantification of Ascorbic acid by Fluorescence Spectroscopy Modified 10/2017 Experiment. Quantification of Ascorbic acid by Fluorescence Spectroscopy1 Objective: The goal of this experiment
Water Hardness and Softening (Bring a water sample from home) Minneapolis Community and Technical College Principles of Chemistry II, C1152 v.2.
 Minneapolis Community and Technical College Principles of Chemistry II, C1152 v.2.") Water Hardness and Softening (Bring a water sample from home) Minneapolis Community and Technical College Principles of Chemistry II, C1152 v.2.16 I. Introduction Hard Water and Water Softening Water that
Water Hardness and Softening (Bring a water sample from home) Minneapolis Community and Technical College Principles of Chemistry II, C1152 v.2.16 I. Introduction Hard Water and Water Softening Water that
Chemistry 118 Laboratory University of Massachusetts Boston Beer s Law
 Name: LEARNING GOALS: Chemistry 118 Laboratory University of Massachusetts Boston Beer s Law 1. Become familiar with the concept of concentration and molarity. 2. Become familiar with making dilutions
Photochemistry of Nitro-Polycyclic Aromatic Hydrocarbons. August 9, 2011
 Photochemistry of Nitro-Polycyclic Aromatic Hydrocarbons August 9, 2011 Photochemistry focuses on the absorption of light by atoms and molecules leading to chemical reactions. With the absorption of light,