Instrumentation development for coupling ion/ion reactions and ion mobility in biological mass spectrometry
|
|
|
- Garey Joshua Underwood
- 5 years ago
- Views:
Transcription

1 Graduate Theses and Dissertations Iowa State University Capstones, Theses and Dissertations 2008 Instrumentation development for coupling ion/ion reactions and ion mobility in biological mass spectrometry Matthew William Soyk Iowa State University Follow this and additional works at: Part of the Chemistry Commons Recommended Citation Soyk, Matthew William, "Instrumentation development for coupling ion/ion reactions and ion mobility in biological mass spectrometry" (2008). Graduate Theses and Dissertations This Dissertation is brought to you for free and open access by the Iowa State University Capstones, Theses and Dissertations at Iowa State University Digital Repository. It has been accepted for inclusion in Graduate Theses and Dissertations by an authorized administrator of Iowa State University Digital Repository. For more information, please contact
2 Instrumentation development for coupling ion/ion reactions and ion mobility in biological mass spectrometry by Matthew W. Soyk A dissertation submitted to the graduate faculty in partial fulfillment of the requirements for the degree of DOCTOR OF PHILOSOPHY Major: Analytical Chemistry Program of Study Committee: R. S. Houk, Major Professor Victor Shang-Yi Lin Nicola Pohl Emily Smith Hans Stauffer Iowa State University Ames, Iowa 2008 Copyright Matthew W. Soyk, All rights reserved.
3 ii TABLE OF CONTENTS CHAPTER 1. GENERAL INTRODUCTION 1 Biological Mass Spectrometry 1 Bottom-up Protein Analysis 2 Top-down Protein Analysis 4 High Resolution MS 6 Ion/Ion Reactions 8 Instrumentation for Ion/Ion Reactions 10 Ion Mobility Spectrometry 19 Ion Mobility Calculations 20 Protein IMS 21 Ion Mobility Instrumentation 22 Dissertation Objectives and Organization 24 References 25 Figures 34 CHAPTER 2. A LINEAR ION TRAP MASS SPECTOMETER WITH VERSATILE CONTROL AND DATA ACQUISITION FOR ION/ION REACTIONS 41 Abstract 41 Introduction 42 Experimental 43 Instrumentation 44 Vacuum System 44 Ion Sources and Ion Optics 45 Linear Ion Trap 45 Modifications for Ion/Ion Reactions with Dual Polarity Trapping 49
4 iii Ion/Ion Reactions in Transmission Mode and Ion Parking 50 Electronics 51 Results and Discussion 52 LIT Performance 52 Mass Spectra 53 Dual Polarity Trapping Mode Ion/Ion Reactions 55 Transmission Mode Ion/Ion Reactions 57 Ion Parking 57 Conclusions 58 Acknowledgements 59 References 60 Tables and Figures 63 CHAPTER 3. AN ION TRAP-ION MOBILITY-TIME OF FLIGHT MASS SPECTROMETER WITH THREE ION SOURCES FOR ION/ION REACTIONS 71 Abstract 71 Introduction 72 Experimental 74 Instrumentation 74 General 74 Ion Sources 75 Ion Trap 77 Drift Tube 78 Ion Funnel 78 Quadrupole-TOF 80 Results and Discussion 81 IM-TOF after Ion/Ion Reactions 81 CID on Intact Protein followed by Charge Reduction 83
5 iv Summary of the Instrument 85 Acknowledgements 86 References 86 Tables and Figures 91 CHAPTER 4. EFFECTS OF ION/ION REACTIONS ON CONFORMATION OF GAS-PHASE CYTOCHROME C IONS 100 Abstract 100 Introduction 101 Experimental 102 Results and Discussion 103 Effect of Charge Reduction Reactions on the Conformation of Cytochrome c Ions 103 Conformation of Ions Made by Ion/Ion Reaction Compared to Those Produced Directly by ESI 106 Conclusion 107 Acknowledgements 108 References 108 Tables and Figures 112 CHAPTER 5. GENERAL CONCLUSIONS 118 ACKNOWLEDGEMENTS 121
6 v ABSTRACT The development of mass spectrometry (MS) instrumentation for novel biological applications, specifically, the development of instrumentation that integrates ion/ion reaction capabilities in an ion trap (IT) with ion mobility-quadrupole-time-of-flight (IMS-q-TOF) analysis is presented. Chapter 1 provides a general introduction to protein analysis by MS, ion/ion reactions and ion/ion reaction instrumentation, and IMS techniques and IMS instrumentation. Chapter 2 describes the construction and performance of a linear ion trap (LIT) made with primarily commercially available components. The LIT has two ion sources for independent analyte ion and reagent ion formation. The LIT functions as a reaction vessel for gas-phase ion/ion reactions and as a mass spectrometer using mass-selective axial ejection. Initial experiments demonstrate the LIT s ability to perform both dual polarity storage mode and transmission mode proton transfer ion/ion reactions. Chapter 3 describes the construction and performance of an IT-IMS-q-TOF with three independent ion sources. This instrument is the first MS to combine ion/ion reaction capabilities with IMS-q-TOF analysis. Chapter 4 describes novel experiments performed on the IT-IMS-q-TOF instrument constructed in our lab. The gas phase conformation of cytochrome c ions in multiple different charge states is investigated using proton transfer ion/ion reactions and IMS-q-TOF analysis.
7 1 CHAPTER 1. General Introduction Biological Mass Spectrometry Over the last 15 to 20 years, mass spectrometry (MS) has become more important in the area of biological molecule identification [1]. Specifically, advances in MS instrumentation and analytical methods have improved the speed, specificity, and sensitivity of MS, making it an appealing technique for protein identification and structural characterization. Early experiments in protein analysis used fast atom bombardment (FAB) [2] and plasma desorption [3] to create gaseous peptide ions. These methods suffered from the limitation that they were able to ionize peptides, but not intact proteins. The development of two ionization techniques in the late 1980 s, namely electrospray ionization (ESI) [4] and matrix assisted laser desorption/ionization (MALDI) [5] had major impacts on the analysis of biological molecules. Electrospray and MALDI have since become the popular ionization methods for most biological molecules including peptides, proteins, oligonucleotides, and carbohydrates. Both ESI and MALDI typically create protonated ions i.e. protons are attached to the analyte molecule that carries the charge. Therefore, the mass-to-charge ratio (m/z) of the ion is the mass of the neutral molecule plus the mass of the proton(s) attached to the molecule divided by the total charge of the ion. In a MALDI experiment, the analyte ions created are predominantly singly charged [6]. When using MALDI for protein analysis, the m/z range of the mass analyzer must be considered. For example, cytochrome c is a small protein with molecular weight of The +1 charge state of cytochrome c generated by MALDI will have an m/z of Th.
8 2 The mass analyzer must have an m/z range above the mass of this ion; time-of-flight (TOF) is commonly used. Alternatively, ESI creates ions in a distribution of charge states that are usually highly multiply charged [4]. Using cytochrome c as an example again, an ESI spectrum of cytochrome c can have charge states ranging from ~+5 to ~+20 (m/z = 2447 to m/z = 612) depending on solution conditions. These higher charge states allow for the analysis of intact proteins using mass analyzers with lower m/z ranges such as quadrupoles. A very significant analog of ESI, known as nano-electrospray ionization or nanospray [7], has become a popular technique. There are several advantages of nano-esi over traditional ESI. Less sample is consumed with nano-esi the flow rate of nano-esi is ~10 nl/min opposed to ~10 µl/min. Nano-ESI is more sensitive than traditional ESI. The sample does not have to be pumped in nano-esi. A stable spray cannot be generated in ESI with a 100% water solution. An organic modifier, such as methanol, needs to be added to the ESI spray solution. Nano-ESI creates smaller initial droplets, therefore, it can create a spray with 100% water solution, so no organic modifier is needed [7]. There have been two general methods developed for protein identification and characterization known as bottom-up protein analysis and top-down protein analysis. Each of these techniques will be described below. Bottom-up Protein Analysis Bottom-up protein analysis is started by utilizing a one- or two-dimensional (2D) gel electrophoresis separation of a mixture of proteins. The individual spots are then extracted and subjected to proteolysis [1]. The peptides created from the digests are then measured
9 3 directly by MS. The masses of the peptides create a mass fingerprint that is characteristic of the original protein. The peptide masses are then used in a database search that identifies the protein [8, 9]. This technique is most useful for proteins from relatively pure samples. In the context of the bottom-up approach it is sometimes more useful to subject the peptides to tandem MS (MS/MS) analysis [10]. Briefly, MS/MS involves the isolation of a single m/z ion followed by fragmentation of the ion. The fragmentation is usually achieved by collision induced dissociation (CID), using collisions between the ions and a neutral buffer gas. The fragment ions are then mass analyzed. The MS/MS spectra of the peptides carry information on the amino acid sequence of the peptide and, in turn, the parent protein [11]. In bottom-up experiments there may be many isobaric peptides (peptides with the same m/z, but different amino acid sequence). A common technique used to address this problem is to perform a liquid chromatography (LC) separation after the digestion and before MS and MS/MS analysis. The isobaric peptides, while they appear at the same place in the mass spectrum may have different retention times in the LC separation, and are therefore separated. The separated peptides are then subjected to MS/MS experiments in which their sequence is identified. These LC separations greatly increase the number of proteins that can be identified in a single experiment [12-14], and they can be done either online with the MS, or fractions of the LC effluent can be collected and analyzed individually by MS. There are some very significant limitations to the bottom-up approach of protein analysis. Some proteins, such as hydrophobic membrane proteins, proteins at low abundance, and proteins with extremely high or low isoelectric points are poorly represented in gel electrophoresis separations [11, 15]. These effects are also overcome by utilizing LC
10 4 separation prior to MS. A second issue with the bottom-up approach is that when an unfractionated protein mixture is digested, it greatly increases the number of components to be analyzed by MS and complicates the isolation of individual diagnostic peptides or single parent peptides to be dissociated [11]. Third, even though only one unique peptide is needed to indentify a protein, a lot of time can be spent unnecessarily analyzing multiple peptides of the same protein, or the same peptide may be present in multiple LC peaks. Fourth, up to 25% of peptide MS/MS spectra are unassignable due to factors such as the spectrum being too complex, the peptide ions are too low in abundance, or there is no diagnostic ion for the protein [11, 16]. Therefore, there are proteins in the mixture that are not identified. Lastly, the proteins are digested before analysis, causing information about the proteins to be lost. For example, the molecular weight of the proteins is not measured, which can give information about possible post-translational modifications. Also, some peptides generated from protein digests are not represented in the mass spectrum, making complete protein structure analysis impossible. Due to these limitations of bottom-up protein analysis, new methods were developed to address the problems. Top-down Protein Analysis Top-down protein analysis was pioneered by McLafferty and co-workers [11, 17]. Protein primary structure (i.e. the amino acid sequence) can be identified from the direct measurement of the intact protein by MS and MS/MS experiments. In a typical top-down experiment, a mixture of intact proteins is transformed into gaseous ions by ESI and transferred into the MS. A mass spectrum of all the ions is taken, providing molecular weight information for all the proteins in the sample. Then, one by one, protein ions in a single
11 5 charge state are isolated and fragmented, and the fragment ions are mass analyzed. The combination of the protein molecular weight and partial sequence information from the MS/MS spectrum can provide enough information to identify the protein [18, 19]. The identification can be made by the sequence tag method [20-22], database searching of the fragment ion spectrum [23], or through de novo sequencing [24, 25]. There are several advantages of the top-down method. First, there is much less sample preparation in top-down analysis. There is no in-gel or solution phase digestion of the proteins prior to MS. Second, there is less of a need for multi-dimensional separation before the MS analysis [26]. A complex mixture of intact proteins can still have fewer total components than a mixture of peptides generated from a digest of a single protein. Third, intact protein masses from several proteins are spread over a wider m/z range than the peptide masses from a digest, making the spectra less complex. Fourth, redundant peptide identification is avoided. Fifth, by performing MS/MS on intact proteins, the entire sequence of the protein is available for analysis [11]. Therefore, the protein can be completely characterized more easily, including possible total primary structure and any posttranslational modification identities and locations [23, 27-29]. Even though there are major advantages to top-down protein analysis, there are also some challenges. The first challenge was overcome when ionization techniques were developed, namely ESI and MALDI, that can transform intact protein ions into the gas phase. The second challenge is the development of mass analyzers with the performance characteristics to generate significant structural information from intact protein ions. The voltage required to fragment an ion is inversely proportional to the ion s charge. Therefore, +1 protein ions are very difficult to fragment. Ions created by MALDI are primarily +1.
12 6 Conversely, ESI creates protein ions that are highly multiply charged, so the protein ions generated from ESI fragment more readily than those made with MALDI. An added difficulty with the interpretation of an MS/MS spectrum of a multiply charged intact protein ion formed via ESI is that the fragment ions will have charges ranging from +1 up to the charge of the precursor protein ion. It is possible for two fragment ions with different masses and different charges to appear at the same nominal mass in the MS/MS spectrum. Therefore, in order to interpret the fragment ion mass spectrum, the charge on each ion must be determined because the charge is not known beforehand. The best way to determine the charge state of an ion is to measure the isotopic distribution (mainly 13 C) of the protein fragment ions. The separation of the isotopic peaks is equal to 1/ion charge, so as the ion charge state increases the separation of the isotopic peaks decreases. Early MS/MS experiments with intact proteins were done on triple quadrupole instruments with limited mass resolution that could not resolve the isotopic peaks of the multiply charged fragment ions [30-35]. These experiments resulted in spectra in which the ion's charge states could not be identified completely, limiting the usefulness of the spectra to protein fingerprinting analysis [11, 32] a method that compares uninterpreted fragment ion spectra for protein identification. Two methods have been developed to overcome the product ion charge state ambiguity problem high resolution fragment ion analysis and fragment ion charge state manipulation. Each method will be discussed further below. High Resolution MS. High mass resolution instrumentation can be used to resolve the 13 C isotopic distribution of the multiply charged fragment ions. The first instruments used for these analyses were Fourier transform-ion cyclotron resonance (FT-ICR) [17, 20, 22-25,
13 7 27, 28, 36-40] mass spectrometers that have mass resolving power greater than and mass accuracies better than 10 ppm. FT-ICR instruments have suitable performance that allows for fragment ion charge state interpretation, so protein sequence information can readily be obtained from the MS/MS spectra of intact, multiply charged protein ions. Multiple ion activation techniques have been employed in FT-ICR instruments to fragment intact proteins: CID, also known as collisionally activated dissociation (CAD) [27, 36-41], infrared multi-photon dissociation (IRMPD) [42, 43], and blackbody infrared radiative dissociation [44]. Electron capture dissociation (ECD) [45-48] is a technique that gives complementary fragmentation to the methods stated above was developed by McLafferty and co-workers. An example of ECD of the intact protein cytochrome c followed by high resolution MS is shown in Figure 1 [48]. The multiply charged protein ion captures a low energy electron, creating an odd electron species that quickly dissociates via cleavage of the N αc bond of the protein or peptide backbone. The resulting fragment ions are referred to as c and z ions. These fragment ions are different than the b and y ions usually formed by the cleavage of the C N amide bond in CID. Labile post-translational modifications, such as phosphorylation and glycosylation, are usually dissociated from the protein in CID but not ECD, allowing for their identity and position along the protein backbone to be determined [28, 49]. More recently, the Orbitrap mass spectrometer [50] was developed for high resolution mass measurements. These instruments are capable of 150,000 mass resolution and 2-5 ppm mass accuracy.[50] An added advantage of the Orbitrap is that there is no superconducting magnet like in FT-ICR. The Orbitrap operates using only static DC voltages, so compared to the FT-ICR, it is simpler and less expensive to maintain.
14 8 Ion/Ion Reactions. Ion/ion reactions are gas phase reactions inside the mass spectrometer. Positive and negative ions are trapped simultaneously in the same volume, usually in an ion trap [11], and the electrostatic attraction of the ions creates an overlap of the ion clouds. The reaction occurs either via the creation of a long lived reaction complex, via a hopping mechanism, or via a coulombically bound orbit [51]. In either case, the multiple charging associated with ESI is advantageous because as the positive and negative ions react, there will still be a net charge associated with the reaction pair, allowing traditional ion optics to be used to control the reactants. The use of ion/ion reactions is the second method used to overcome the charge state ambiguity of multiply charged protein fragment ions. Specifically, proton transfer ion/ion reactions are used to reduce the fragment ion charge to primarily +1 [11, 21, 52-62]. The reagent ion is chosen to enable the stripping of protons from the protein fragment ions, thereby reducing the charge. Reducing the charge on the fragment ions to primarily +1 expands the ion population out on the m/z scale, creating more space between peaks and separating fragment ions that initially had different mass and different charge but the same m/z. It also lessens the requirements of the mass spectrometer resolving power and mass accuracy. With the use of proton transfer ion/ion reactions, structural information of multiply charged protein fragment ions can be obtained using mass analyzers with resolving powers of m/ m ~500 to 1000 [21, 59-62]. An example of proton transfer ion/ion reactions being used to identify fragment ions generated from CID of the intact protein ubiquitin is shown in Figure 2 [63].
15 9 Another type of ion/ion reaction that has recently been developed and studied is electron transfer dissociation (ETD) [64]. When using ion traps for protein analysis, ECD is not possible without adding a magnet to the instrument [65]. Ion traps have a low mass cutoff (LMCO), or a minimum m/z that can be trapped. Free electrons have an m/z that is much lower than that of even the lightest ion, therefore, they cannot be trapped by an ion trap. ETD is the ion/ion reaction equivalent to ECD. Positive protein or peptide ions are reacted with a reagent ion that acts as an electron donor. The electron is transferred from the reagent ion to the protein or peptide ion, which then dissociates to create the same c and z ions as ECD [64]. McLuckey and coworkers have discovered reagent ions that enable other types of ion/ion reactions. Cation switching reactions [66, 67] use protonated protein or peptide ions with a metal containing anion. For example, consider the reaction between a doubly protonated peptide [M+2H] 2+ and Na(NO 3 ) - 2. The products of this reaction are [M+Na] + and 2HNO 3. The cation has replaced the protons on the peptide as the charge carrier. The last type of ion/ion reaction that has been developed is a charge inversion reaction. Reagent ions have been found that can transfer multiple protons in a single step, so charge inversion reactions are possible without going through a neutral intermediate [68]. These reactions can transform a depronated, negatively charged ion into a prontated, positively charged ion and vice versa. Each of these reactions, proton transfer, ETD, cation switching, and charge inversion have useful properties for structural characterization of protein ions, but not every MS is capable of ion/ion reactions. The next section will discuss instrument capabilities needed for ion/ion reactions and a brief history of ion/ion reaction instrumentation development.
16 10 Instrumentation for Ion/Ion Reactions. Instruments capable of ion/ion reactions must have several key components. First, there needs to be a gas phase ion/ion reaction vessel that provides for physical overlap between the analyte and reagent ions. Second, there must be at least two distinct ion sources to create both polarities of ions in a single experiment. Third, the instrument should have MS/MS capabilities for protein structural analysis. Finally, there must be a mass analyzer. The gas phase reaction vessel has either been external to the MS vacuum system at near atmospheric pressure or inside the MS at pressures in the millitorr range [69]. The external reaction vessels used have been a y-tube reactor prior to quadrupole MS, using two ESI emitters[70] or one ESI and one atmospheric pressure chemical ionization (APCI) source [70, 71], and a charge reduction chamber prior to TOF MS, using one ESI source and either an α-particle source [72], or a corona discharge source [73]. The advantages of these techniques are ease of integration to various MS instruments, flexibility with the type of MS used for mass analysis, and no restriction of the reactions caused by trapping parameters [69]. Conversely, these reaction chambers are limited to reducing the charge of all ions created by the analyte ESI source with little control over any of the reactant or product ions, and there is no possibility of MS/MS experiments prior to the ion/ion reaction event [69]. More flexibility in the ion/ion reaction parameters has been achieved when using reaction vessels inside the MS. To date all ion/ion reaction experiments inside the MS have been done in electrodynamic ion traps [69], including 3d quadrupole traps based on the Paul trap [54] and linear ion traps based on linear quadrupoles [64, 74-76]. Ion traps have several characteristics
17 11 that make them attractive as gas phase reaction vessels. They provide simple methods for simultaneous storage of both positive and negative ions. They are capable of multi-stage MS measurements (MS n ) via tandem in time experiments [77], including ion/ion reaction steps in between stages of MS [69], satisfying the requirement for MS/MS for protein structure analysis. Finally, ion traps allow for separation of the ionization and ion/ion reaction events because ions can be created outside the ion trap and injected into the trap for reaction and mass analysis. The 3d ion trap (Figure 3 [78]) consists of a ring electrode between two endcap electrodes. It is able to trap both positive and negative ions simultaneously in all 3 dimensions using only the RF voltage applied to the ring electrode [79, 80]. A bath gas inside the ion trap, typically He at a pressure of ~1 mtorr, is used to cool the ions to the center of the trap. The cooling promotes spatial overlap of the ion clouds and minimizes the relative translational energy of the reactant pair [69], which affects the ion/ion reaction rate [81]. This bath gas is also beneficial for mass analysis in ion traps regardless of whether ion/ion reactions are performed or not [69]. Therefore, no modifications need to be made to 3d ion traps to enable ion/ion reactions. The multiple ion sources for ion/ion reactions using 3d ion traps have been configured in many different orientations. Early ion/ion reaction experiments in 3d ion traps utilized inter-ion trap ionization by electron impact ionization (EI) or chemical ionization (CI) with the electron beam coming through a hole machined in the ring electrode [80]. The second source was an ESI source used to create multiply negatively charged ions that were admitted to the ion trap through a hole one of the endcap electrodes. Both proton transfer [80, 82] and electron transfer reactions [83] of multiply charged anions were studied.
18 12 The first instrument used to study the reactions between multiply charged cations and singly charged anions was a 3d ion trap with an ESI source that admitted ions through an endcap electrode of the ion trap and an atmospheric sampling glow discharge ionization (ASGDI) source that admitted ion into the trap through a hole machined through the ring electrode of the ion trap [54]. This instrument was used primarily for the study of proton transfer ion/ion reactions of multiply charged proteins.ref Another instrument with a similar configuration was developed by the Glish group [84]. In these studies the ASGDI source was replaced with a laser desorption source for the study of reactions between multiply charged peptide or protein ions with either Fe + or FeCO - 2. Some significant disadvantages limit the usefulness of admitting ions through the ring electrode of 3d ion traps. Namely, the trapping efficiency of ions admitted through the ring electrode is lower than that for ions admitted through the endcap [69]. Also, the ions admitted through the ring electrode experience stronger fields than ions admitted through the endcap, causing more fragmentation [85]. Therefore, it was beneficial to develop instrumentation to admit both analyte and reagent ions through the endcap electrode. The dueling ESI ion trap mass spectrometer [86] was developed that integrates two ESI sources arranged 180 o from each other and 90 o from the main optical axis of the instrument. The ions are steered down the main optical axis of the instrument by a turning quadrupole. In order to sequentially fill the ion trap with positive and negative ions, the DC voltages on the turning quadrupole and the lenses between it and the ion trap are switched using computer controlled switches. This instrument was the first to allow ion/ion reaction experiments between opposite polarity, multiply charged ions created by ESI in an ion trap reaction vessel [87, 88].
19 13 The integration of multiple ion sources through a turning quadrupole led to more complex instrumentation that incorporated multiple different ion sources. Badman and coworkers developed an ion trap instrument with four independent ion sources; two ESI sources and one source for either ESI or ASGDI are integrated through the turning quadrupole and one ASGDI source is orthogonal to the ion trap that admits ions through the ring electrode of the ion trap [63]. This instrument is capable of creating multiple different reagent ions from distinct ion sources to enable different types of ion/ion reactions in a single experiment. For example, positive cytochrome c ions from one ESI source were reacted with negative cytochrome c ions from the second ESI source to create positive cytochrome c dimer ions. These first generation product ions were then charge reduced using PDCH ions generated at the orthogonal ASGDI source [63]. Several novel combinations of analyte/reagent ions have been reacted in sequential ion/ion reactions using this instrument [68, 89, 90]. The design of having three independent ion sources integrated to an ion trap through a turning quadrupole is the technique used in the instrumentation developed in our lab, the results of which are presented in chapters 2, 3, and 4 of this dissertation. Six years ago two new linear ion traps (LIT) [91, 92] were introduced. Both of these devices are based on linear quadrupoles that provide the trapping in the radial direction (x and y-directions ) using the RF voltages applied to the quadrupole rods, and the trapping in the axial direction (z-direction, i.e. the central axis of the quadrupole array) is provided by DC voltages on the entrance and exit lenses. However, there are significant differences between the two types of LITs. The Thermo Finnigan LTQ is made from a quadrupole rod array that is divided into three sections a short section 12 mm long at the front, the main rod section that is 37 mm
20 14 long, and a second short section 12 mm long at the back also known as a tri-filter configuration. A diagram of the LTQ is shown in Figure 4 [92]. Each rod section has the same RF voltage applied to it, but they all have independent DC bias voltages applied to them, allowing the ions to be moved from one section to another. The LTQ uses a radial ejection technique. Narrow slots are cut in the center section of one opposing set of rods. The ions are ejected from the LIT through these slots cut in the rods and are collected by an ion detector. The tri-filter configuration also helps the radial ion ejection event avoid the fringe fields near the ends of the rods [92]. The other type of LIT, the QTRAP developed by ABI /MDS Sciex (Figure 5)[91], is based on the ion path of a triple qudrupole MS. These instruments can use either quadrupole 2 (q2) or qudrupole 3 (Q3) as LITs. The LITs in this design are single section quadrupole rods without the tri-filter capabilities of the LTQ. They also employ a different ejection technique called mass selective axial ejection (MSAE) [93] that utilizes the fringe field coupling of the RF voltage applied to the LIT rods with the DC voltage applied to the exit lens of the LIT to eject the ions axially out of the LIT. Dual polarity trapping in LITs is not achieved when using DC trapping voltages on the entrance and exit lenses. Two methods have been developed to simultaneously trap both polarity ions in all three directions on these LITs. The first method is the addition of an auxiliary RF voltage to the containment lenses of the LIT to store both polarity of ions in all three dimensions as demonstrated by the Hunt group on a modified Finnigan LTQ linear ion trap [64]. These experiments take advantage of the tri-filter configuration of this LIT, as shown in Figure 6 [64]. During an ion/ion reaction experiment the analyte ions are injected and moved into the front (left) section of the LIT. The reagent ions are then injected into the
21 15 back (right) and/or center section of the LIT (the reagent ion source is at the back of the LIT, while the analyte ion source is at the front, see Figure 6). The reagent and analyte ions are mixed by simultaneously removing the DC bias between the rod sections, removing the DC bias between the rods and the containment lenses, and adding the auxiliary RF voltage to the containment lenses. Finally, the reaction is ended by simultaneously removing the auxiliary RF and adding the repulsive DC bias to the containment lenses. Segregating the ions prior to ion/ion reaction allows for isolation of a single reagent ion prior to the ion/ion reaction, giving an added level of control over the type of reaction that is enabled, especially if multiple reagent ions are generated by a single ion source [94]. A second method for dual polarity trapping in an LIT was developed by the McLuckey lab. This method employs an unbalanced RF field in the quadrupole rod array [74]. When the DC bias on the containment lenses and the rod array are equal, subtracting a portion of the RF amplitude from one pair of quadrupole rods and adding an equivalent portion of RF amplitude to the other quadrupole rod pair causes the ions to feel an axial RF field near the entrance and exit lens that is similar to applying the auxiliary RF voltage directly to the lenses as described above. Ion/ion reactions using this method were carried out in a prototype QTRAP mass spectrometer with Q3 (see Figure 5) as the ion/ion reaction vessel. However, the presence of an axial RF field detracts from the performance of the LIT, such as lowering the injection efficiency of the LIT and degrading the MSAE performance. Therefore, further experiments on these QTRAP instruments, using either q2 [95] or Q3[96] as the ion/ion reaction vessel, have used the addition of an auxiliary RF voltage on the containment lenses because the axial RF field can be turned off during analyte ion injection and MSAE steps.
22 16 A new method for ion/ion reactions in an LIT has been developed to avoid the need for dual polarity trapping. Transmission mode reactions [97, 98] are ion/ion reactions in which at least one polarity of ions participating in the reaction are not trapped during the reaction. There are essentially three methods for enabling transmission mode ion/ion reactions in an LIT. First, both polarity of ions can be passed through the LIT in opposite directions. This method has not been demonstrated yet. Second, the analyte ions can be trapped in the LIT, and the reagent ions are transmitted through the trapped analyte ions [97, 98]. Third, the reagent ions are trapped, and the analyte ions are passed through the trapped reagent ions [76, 97, 98]. An advantage of transmission mode reactions is that no additional electronics are required to superimpose the auxiliary RF on the containment lenses or to unbalance the RF on the quadrupole rod array. The ion source configurations for ion/ion reactions in LITs have also gone through several generations of instrumentation, depending greatly on the method of ejection from the ion trap. Radial ejection LITs, such as the Finnigan LTQ [92], have both ends of the LIT available for ion injection. Therefore, these LITs have two ion sources positioned at opposite ends of the LIT as seen in Figure 6 [64]. Recently, the LTQ-Orbitrap hybrid instrument [99] was shown to enable ETD reactions using two ion sources still positioned at opposite ends of the instrument. The difference is that the reagent ions must pass through multiple collision cells and the c-trap [100] before reaching the LIT. The other LIT ion ejection method, MSAE, differs from radial ejection in that the ions are ejected out of the end of the quadrupole array instead of radially through slots cut in the rods. The implication of MSAE on ion/ion reactions is that only one end of the LIT is available for ion injection. The first ion/ion reaction experiments on an LIT that employed
23 17 MSAE used two ion source interfaces with the LIT. The analyte ions were admitted to the LIT using an ESI source on the optical axis of the instrument, and the reagent ions were injected radially into the LIT by an ASGDI source mounted orthogonal to the LIT [76]. Radial injection of the reagent ions requires instrument hardware modification to add the atmosphere to vacuum interface and ion optics orthogonal to the LIT reaction vessel. In order to avoid these modifications, it was beneficial to develop methods to axially inject either positive or negative ions into the LIT. Two methods have been developed to axially inject either positive or negative ions into an axial ejection LIT sonic spray ionization and multiple pulsed ion sources. Sonic spray ionization (SSI) [101, 102] has been shown to create both positive and negative ions in a single spray. Using electronics that switch the voltages on the ion optics, ion/ion reaction experiments using a single SSI source as the ion source for both analyte and reagent ions has been investigated [103]. An advantage of SSI is that both polarity of ions are focused into the LIT using the same set of ion optics with different voltages applied to them and the same atmosphere to vacuum interface, simplifying the instrument hardware. Conversely, a drawback of SSI as the dual polarity source is that the analyte and reagent molecules must be sprayed from the same solution, presenting an increase in the probability of matrix suppression of the analyte or reagent ions [69]. A second method to axially inject either polarity of ions into the LIT, a pulsed dual ESI source, was developed by Mcluckey and co-workers [95]. Like SSI, the pulsed dual ESI source uses a single atmosphere to vacuum interface and one set of ion optics to inject both positive and negative ions into the LIT. The source consists of a nano-esi emitter for analyte ion formation and an ESI emitter for reagent ion formation. The nano-esi and ESI emitters
24 18 are pulsed on and off to sequentially inject positive and negative ions into the LIT. This arrangement overcomes the matrix suppression effects of SSI because the ionization of each reactant species can be independently optimized with distinct ESI emitters. This source was shown to enable proton transfer, charge inversion, and protein-protein complex formation [95]. A similar ion source was developed that incorporated one nano-esi and one APCI emitter that also operates in a pulsed fashion [104]. This source has been shown to enable proton transfer and ETD ion/ion reactions [104]. Using pulsed ion sources for ion/ion reactions is not limited to only two sources. A pulsed triple ionization source [96] was developed that utilizes a nano-esi emitter for analyte ion formation with an ESI emitter and either APCI or nano-esi for reagent ion formation. This pulsed triple ionization source can be used for sequential ion/ion reactions, such as sequential charge inversions to increase analyte ion charge state, sequential proton-transfer charge inversion and ETD of phophopeptides, and sequential ETD and proton transfer ion/ion reactions for ubiquitin identification [96]. The mass analysis of ion/ion reaction products created in ion traps has primarily been accomplished by scanning the product ions out of the ion trap. The advantages of using the ion trap for both the ion/ion reaction vessel and mass analyzer are that the instrument hardware is kept simple by not adding additional mass analyzers and that the m/z range for ion traps can be extended by resonance ejection at low q-values [54, 105]. Despite these advantages, other mass analyzers capable of higher resolution and mass accuracy are attractive for analysis of ion/ion reaction product ions. Recently, a quadrupole-tof instrument (QSTAR XL, Applied Biosystems/MDS Sciex) was modified to make the q2 collision cell into an LIT for ion/ion reactions [75]. Proton transfer reactions, ETD, and
25 19 parallel ion parking have been demonstrated using the LIT-TOF. Other novel experiments using this LIT-TOF include combining ion/ion reactions with beam-type CID for MS n [106]. Another mass analyzer that has been used to analyze ETD product ions is the Orbitrap [99, 107]. The ETD reactions are done in the LTQ portion of the hybrid LTQ-Orbitrap, and then the product ions are transferred to the Orbitrap for m/z analysis. Ion Mobility Spectrometry Ion Mobility Spectrometry (IMS) is the study of how rapidly an ion moves through a buffer gas in the presence of a uniform electric field [108]. Ion mobility measurements are performed in a drift tube consisting of alternating electrodes and insulating spacers and containing a neutral buffer gas. The electrodes are connected with a resistor chain used to create a uniform electric field down the length of the drift tube by applying DC voltages to the front and back plates of the drift tube. The electric field accelerates the ions down the drift tube, while collisions with the buffer gas slow the ions, resulting in a constant drift velocity down the length of the drift tube. The mobility of the ions, K, is the ratio of the drift velocity, υ D, to the electric field, E [108]. (1) The injected ion drift tube technique, developed by Hasted and co-workers [109], is the injection of a packet of m/z selected ions that are created external to the drift tube. As the ion packet travels down the drift tube, ions with different mobilities will be separated. For polyatomic ions, the mobility is determined by the ion s average collision cross section. Ions with smaller collision cross sections encounter fewer collisions with the buffer gas and travel faster through the drift cell, while ions with larger collision cross sections encounter more
26 20 collisions and travel more slowly through the drift cell. Thus, ion mobility is a method to separate ions based on differences in collision cross section [108]. Ion Mobility Calculations. Calculating the mobilities of ions traveling through the drift tube depends on several variables. Equation 1 does not take into account the experimental parameters of normal drift tube operation. The reduced mobility, K 0, calculated using experimental parameters and adjusting the number density of the buffer gas to standard temperature and pressure, is given by x. x (2) where L is the length of the drift tube, t D is the drift time (i.e. the time it takes for the ions to travel the length of the drift tube), V is the voltage drop across the drift tube, p is the pressure of the buffer gas in Torr, and T is the temperature [108]. Another important parameter that defines the energy of the ions inside the drift tube is the ratio of the electric field to the buffer gas number density (E/N). At low E/N, the drift velocity is small compared to thermal velocity, and the ions are said to be within the lowfield limit. Conversely, when the mobility is dependent on E/N and the drift velocity is high compared to thermal velocity, the ions are in the high-field limit. When IMS measurements are done within the low field limit, the calculated mobility is independent of the electric field strength [108]. In the low-field limit, the mobility is calculated by / / /, (3)
27 21 where m is the mass of the ion, m b is the mass of the buffer gas, z is the charge on the ion, T is the temperature, N is the buffer gas number density, and Ω, is the average collision cross section. Combining equations 2 and 3, and solving for Ω, gives the equation Ω, / / /. (4) used to calculate an ion s average collision cross section from the measured drift time and other experimental parameters [108]. Protein IMS. There are a couple of characteristics of IMS that are useful for protein analysis. Ion mobility separates ions based on cross section instead of m/z, providing an additional means of separation for ions with similar m/z but different collision cross sections. For example, it has been shown that IMS of multiply charged protein fragment ions disperses the ions in time prior to MS analysis [110]. This technique reduces the spectral congestion of the multiply charged fragment ions, helping charge state determination and ion identification. It was also shown that protein fragment ions that have a different number of residues and the same charge (i.e. a charge state family) will fall on a diagonal line in the mobility spectrum [110], giving another method to help identify the charge state of multiply charged protein fragment ions. The other characteristic of IMS useful for protein analysis is the ability to determine an ion's average collision cross section from the IMS experimental parameters. The gasphase conformations of protein ions can be studied by measuring the collision cross section [108, 111, 112]. Unfolded protein ions will have a larger collision cross section than folded protein ions. Studies on cytochrome c ions in charge states from [M+20H] 20+ to [M+3H] 3+
28 22 were conducted to calculate the collision cross sections. The higher charge states have larger collision cross sections, meaning the ions have more unfolded conformations. The low charge states have smaller collision cross sections, meaning the ions have more folded conformations. The [M+9H] 9+ to [M+5H] 5+ charge state have multiple resolvable peaks, corresponding to multiple different resolvable conformations [108]. These studies have also shown that the charge states with multiple conformations can be heated by increasing the drift tube injection energy. Heating the ions causes the more folded conformations to open up to the more unfolded conformations [108, 110]. The lowest three charge states in these studies, [M+5H] 5+ to [M+3H] 3+, were created by adding a neutral base to the desolvation region. Chapter 4 of this dissertation will discuss similar experiments investigating the gasphase conformations of cytochrome c at various charge states where ion/ion reactions are used to create the lower charge state ions. All of these studies are Ion Mobility Instrumentation. Injected ion drift tube instruments initially consisted of an ion source to generate ions, an MS to m/z select an ion, the drift tube, and a second MS with an ion detector. These instruments used several different ion sources including pulsed laser desorption [113], pulsed laser vaporization [114], MALDI [115], and ESI [112]. Clemmer and Valentine created an injection ion drift tube instrument that did not incorporate an MS prior to the drift tube [116]. This instrument had an ESI source, a desolvation region with the ability to add neutral base molecules for proton transfer ion/molecule reactions, a drift tube, and a quadrupole MS with ion detector. Chemical reactivity measurements, including H-D exchange of cytochrome c, collisional annealing and dissociation, and thermal annealing experiments were performed using this instrument [108, 116].
29 23 Following those studies, Clemmer and co-workers have made several advances in IMS instrumentation, several of which have been duplicated by other research groups. An important improvement was the replacement of the quadrupole MS after the drift tube with a TOF [117]. The disbursement of ions by IMS occurs on the 1 to 10 ms time scale, while TOF m/z analysis occurs on the microsecond time scale. Therefore, several m/z spectra are taken across each mobility peak. This technique is referred to as nested drift (flight) time measurements [117]. An example of a nested drift (flight) time spectrum is shown in Figure 7 [118]. Further advancements in IMS instrumentation have all been based on this initial ESI-IMS-TOF instrument. The addition of an ion trap before the drift tube as an ion accumulation/storage device improved the duty cycle of the IMS-TOF experiments [ ]. In previous instrument designs an ion gate was used to allow a short packet of ions from the continuous ESI source into the drift tube. With the addition of an ion trap, the mobility separation is started by pulsing the ions out of the ion trap into the drift tube. Another important advancement was the addition of a collision cell between the drift tube and TOF for mobility labeling experiments [118, 122]. In these experiments, ions are separated by IMS and are sequentially fragmented in the collision cell followed by TOF MS of the fragment ions. Each of the fragment ions appears at the same drift time as the parent ion in the nested drift (flight) time spectrum. Therefore, mobility labeling allows for parallel CID experiments [118]. A different type of IMS instrument was recently made commercially available. This instrument, the SYNAPT HDMS made by Waters Corp., uses a traveling wave technology instead of the weak uniform electric field in traditional IMS [123, 124]. Experiments have been done to compare the traveling wave technology to traditional IMS. The mobility
30 24 characteristics of protein ions in the traveling wave instrument are similar to traditional IMS, but the relationship between drift time and mobility is different. Some calibrations of the traveling wave instrument are needed with ions of known cross section to be able to use the traveling wave technology for cross section measurements [124]. More recent instrumentation advancements include the construction of IMS-IMS- TOF [125, 126] and IMS-IMS-IMS-TOF [126] instruments that are the IMS analogs of MS/MS and MS/MS/MS experiments. In between the stages of IMS, the ions are mobility selected (instead of being m/z selected in an MS/MS experiment) and activated to either unfold protein ions or fragment the ions prior to the next stage of IMS [125, 126]. These instruments also incorporate ion funnels [ ], developed by Smith and co-workers, at the end of each drift tube segment that re-focus the dispersed ion cloud near the end of the drift tube, increasing the sensitivity of IMS measurements[129]. An ion funnel placed before the drift tube is also used as an ion accumulation device in place of an ion trap [125, 126]. Dissertation Objectives and Organization This dissertation focuses on the continued development of MS instrumentation for novel biological applications, specifically, the development of instrumentation that integrates ion/ion reaction capabilities with IMS-q-TOF analysis. Chapter 2 is a manuscript that was accepted with revisions for publication in the Journal of the American Society for Mass Spectrometry. This manuscript describes the construction and performance of an LIT made with primarily commercially available components. The LIT has two ion source and ion/ion reaction capabilities in either dual polarity storage mode or transmission mode. Chapter 3 is a manuscript that is ready for submission to the Journal of the American Society for Mass
31 25 Spectrometry. This paper describes the construction and performance of an IT-IMS-q-TOF with three independent ion sources. This instrument is the first MS to combine ion/ion reaction capabilities with IMS-q-TOF analysis. Chapter 4 is also a manuscript ready for submission to the Journal of the American Society for Mass Spectrometry. This manuscript describes experiments performed on the IT-IMS-q-TOF instrument constructed in our lab. The gas phase conformation of cytochrome c ions in multiple different charge states is investigated using proton transfer ion/ion reactions and IMS. Chapter 5 summarizes the work presented in chapters 2, 3, and 4 and discusses future research directions. References 1. Aebersold, R.; Goodlett, D. R. Mass spectrometry in proteomics Chem. Rev. 2001, 101, Barber, M.; Bordoli, R. S.; Sedgwick, R. D.; Tyler, A. N. Fast Atom Bombardment of Solids (Fab) - a New Ion-Source for Mass-Spectrometry J. Chem. Soc.-Chem. Commun. 1981, Sundqvist, B.; Macfarlane, R. D. Cf-252 Plasma Desorption Mass-Spectrometry Mass Spectrom. Rev. 1985, 4, Fenn, J. B.; Mann, M.; Meng, C. K.; Wong, S. F.; Whitehouse, C. M. Electrospray Ionization for Mass-Spectrometry of Large Biomolecules Science 1989, 246, Karas, M.; Hillenkamp, F. Laser Desorption Ionization of Proteins with Molecular Masses Exceeding Daltons Anal. Chem. 1988, 60, Karas, M.; Gluckmann, M.; Schafer, J. Ionization in matrix-assisted laser desorption/ionization: singly charged molecular ions are the lucky survivors J. Mass Spectrom. 2000, 35, Wilm, M.; Mann, M. Analytical properties of the nanoelectrospray ion source Anal. Chem. 1996, 68, Yates, J. R.; Speicher, S.; Griffin, P. R.; Hunkapiller, T. Peptide Mass Maps - a Highly Informative Approach to Protein Identification Anal. Biochem. 1993, 214, Mann, M.; Hojrup, P.; Roepstorff, P. Use of Mass-Spectrometric Molecular-Weight Information to Identify Proteins in Sequence Databases Biol. Mass Spectrom. 1993, 22, Hunt, D. F.; Yates, J. R.; Shabanowitz, J.; Winston, S.; Hauer, C. R. Protein Sequencing by Tandem Mass-Spectrometry Proc. Natl. Acad. Sci. U. S. A. 1986, 83,
32 Reid, G. E.; McLuckey, S. A. 'Top down' protein characterization via tandem mass spectrometry J. Mass Spectrom. 2002, 37, Washburn, M. P.; Wolters, D.; Yates, J. R. Large-scale analysis of the yeast proteome by multidimensional protein identification technology Nat. Biotechnol. 2001, 19, Davis, M. T.; Beierle, J.; Bures, E. T.; McGinley, M. D.; Mort, J.; Robinson, J. H.; Spahr, C. S.; Yu, W.; Luethy, R.; Patterson, S. D. Automated LC-LC-MS-MS platform using binary ion-exchange and gradient reversed-phase chromatography for improved proteomic analyses Journal of Chromatography B 2001, 752, Wolters, D. A.; Washburn, M. P.; Yates, J. R. An automated multidimensional protein identification technology for shotgun proteomics Anal. Chem. 2001, 73, Gygi, S. P.; Corthals, G. L.; Zhang, Y.; Rochon, Y.; Aebersold, R. Evaluation of twodimensional gel electrophoresis-based proteome analysis technology Proc. Natl. Acad. Sci. U. S. A. 2000, 97, Simpson, R. J.; Connolly, L. M.; Eddes, J. S.; Pereira, J. J.; Moritz, R. L.; Reid, G. E. Proteomic analysis of the human colon carcinoma cell line (LIM 1215): Development of a membrane protein database Electrophoresis 2000, 21, Kelleher, N. L.; Lin, H. Y.; Valaskovic, G. A.; Aaserud, D. J.; Fridriksson, E. K.; McLafferty, F. W. Top down versus bottom up protein characterization by tandem high-resolution mass spectrometry J. Am. Chem. Soc. 1999, 121, VerBerkmoes, N. C.; Strader, M. B.; Smiley, R. D.; Howell, E. E.; Hurst, G. B.; Hettich, R. L.; Stephenson, J. L. Intact protein analysis for site-directed mutagenesis overexpression products: Plasmid-encoded R67 dihydrofolate reductase Anal. Biochem. 2002, 305, VerBerkmoes, N. C.; Bundy, J. L.; Hauser, L.; Asano, K. G.; Razumovskaya, J.; Larimer, F.; Hettich, R. L.; Stephenson, J. L. Integrating "top-down" and "bottom-up" mass spectrometric approaches for proteomic analysis of Shewanella oneidensis J. Proteome Res. 2002, 1, Mortz, E.; Oconnor, P. B.; Roepstorff, P.; Kelleher, N. L.; Wood, T. D.; McLafferty, F. W.; Mann, M. Sequence tag identification of intact proteins by matching tandem mass spectral data against sequence data bases Proc. Natl. Acad. Sci. U. S. A. 1996, 93, Cargile, B. J.; McLuckey, S. A.; Stephenson, J. L. Identification of bacteriophage MS2 coat protein from E-coli lysates via ion trap collisional activation of intact protein ions Anal. Chem. 2001, 73, Demirev, P. A.; Lin, J. S.; Pineda, F. J.; Fenselau, C. Bioinformatics and mass spectrometry for microorganism identification: Proteome-wide post-translational modifications and database search algorithms for characterization of intact H-pylori Anal. Chem. 2001, 73, Meng, F. Y.; Cargile, B. J.; Miller, L. M.; Forbes, A. J.; Johnson, J. R.; Kelleher, N. L. Informatics and multiplexing of intact protein identification in bacteria and the archaea Nat. Biotechnol. 2001, 19,
33 Horn, D. M.; Zubarev, R. A.; McLafferty, F. W. Automated de novo sequencing of proteins by tandem high-resolution mass spectrometry Proc. Natl. Acad. Sci. U. S. A. 2000, 97, Horn, D. M.; Zubarev, R. A.; McLafferty, F. W. Automated reduction and interpretation of high resolution electrospray mass spectra of large molecules J. Am. Soc. Mass Spectrom. 2000, 11, Stephenson, J. L.; McLuckey, S. A.; Reid, G. E.; Wells, J. M.; Bundy, J. L. Ion/ion chemistry as a top-down approach for protein analysis Curr. Opin. Biotechnol. 2002, 13, Fridriksson, E. K.; Beavil, A.; Holowka, D.; Gould, H. J.; Baird, B.; McLafferty, F. W. Heterogeneous glycosylation of immunoglobulin E constructs characterized by top-down high-resolution 2-D mass spectrometry Biochemistry 2000, 39, Shi, S. D. H.; Hemling, M. E.; Carr, S. A.; Horn, D. M.; Lindh, I.; McLafferty, F. W. Phosphopeptide/phosphoprotein mapping by electron capture dissociation mass spectrometry Analytical Chemistry 2001, 73, Reid, G. E.; Stephenson, J. L.; McLuckey, S. A. Tandem mass spectrometry of ribonuclease A and B: N-linked glycosylation site analysis of whole protein ions Analytical Chemistry 2002, 74, Loo, J. A.; Edmonds, C. G.; Udseth, H. R.; Smith, R. D. Collisional Activation and Dissociation of Large Multiply Charged Proteins Produced by Electrospray Ionization Anal. Chim. Acta 1990, 241, Loo, J. A.; Edmonds, C. G.; Smith, R. D. Primary Sequence Information from Intact Proteins by Electrospray Ionization Tandem Mass-Spectrometry Science 1990, 248, Smith, R. D.; Loo, J. A.; Barinaga, C. J.; Edmonds, C. G.; Udseth, H. R. Collisional Activation and Collision-Activated Dissociation of Large Multiply Charged Polypeptides and Proteins Produced by Electrospray Ionization J. Am. Soc. Mass Spectrom. 1990, 1, Loo, J. A.; Edmonds, C. G.; Smith, R. D. Tandem Mass-Spectrometry of Very Large Molecules - Serum-Albumin Sequence Information from Multiply Charged Ions Formed by Electrospray Ionization Anal. Chem. 1991, 63, Loo, J. A.; Edmonds, C. G.; Smith, R. D. Tandem Mass-Spectrometry of Very Large Molecules.2. Dissociation of Multiply Charged Proline-Containing Proteins from Electrospray Ionization Anal. Chem. 1993, 65, Lightwahl, K. J.; Loo, J. A.; Edmonds, C. G.; Smith, R. D.; Witkowska, H. E.; Shackleton, C. H. L.; Wu, C. S. C. Collisionally Activated Dissociation and Tandem Mass-Spectrometry of Intact Hemoglobin Beta-Chain Variant Proteins with Electrospray Ionization Biol. Mass Spectrom. 1993, 22, Speir, J. P.; Senko, M. W.; Little, D. P.; Loo, J. A.; McLafferty, F. W. High- Resolution Tandem Mass-Spectra of Kda Proteins J. Mass Spectrom. 1995, 30, Oconnor, P. B.; Speir, J. P.; Senko, M. W.; Little, D. P.; McLafferty, F. W. Tandem Mass-Spectrometry of Carbonic-Anhydrase (29-Kda) J. Mass Spectrom. 1995, 30, 88-93
34 Wood, T. D.; Chen, L. H.; Kelleher, N. L.; Little, D. P.; Kenyon, G. L.; McLafferty, F. W. Direct sequence data from heterogeneous creatine kinase (43 kda) by highresolution tandem mass spectrometry Biochemistry 1995, 34, Wood, T. D.; Chen, L. H.; White, C. B.; Babbitt, P. C.; Kenyon, G. L.; McLafferty, F. W. Sequence Verification of Human Creatine-Kinase (43 Kda) Isozymes by High- Resolution Tandem Mass-Spectrometry Proc. Natl. Acad. Sci. U. S. A. 1995, 92, Maier, C. S.; Yan, X. G.; Harder, M. E.; Schimerlik, M. I.; Deinzer, M. L.; Pasa- Tolic, L.; Smith, R. D. Electrospray ionization Fourier transform ion cyclotron resonance mass spectrometric analysis of the recombinant human macrophage colony stimulating factor beta and derivatives J. Am. Soc. Mass Spectrom. 2000, 11, Loo, J. A.; Quinn, J. P.; Ryu, S. I.; Henry, K. D.; Senko, M. W.; McLafferty, F. W. High-Resolution Tandem Mass-Spectrometry of Large Biomolecules Proc. Natl. Acad. Sci. U. S. A. 1992, 89, Little, D. P.; Speir, J. P.; Senko, M. W.; Oconnor, P. B.; McLafferty, F. W. Infrared Multiphoton Dissociation of Large Multiply-Charged Ions for Biomolecule Sequencing Anal. Chem. 1994, 66, Freitas, M. A.; Hendrickson, C. L.; Marshall, A. G. Determination of relative ordering of activation energies for gas-phase ion unimolecular dissociation by infrared radiation for gaseous multiphoton energy transfer J. Am. Chem. Soc. 2000, 122, Ge, Y.; Horn, D. M.; McLafferty, F. W. Blackbody infrared radiative dissociation of larger (42 kda) multiply charged proteins Int. J. Mass Spectrom. 2001, 210, Zubarev, R. A.; Kelleher, N. L.; McLafferty, F. W. Electron capture dissociation of multiply charged protein cations. A nonergodic process J. Am. Chem. Soc. 1998, 120, Zubarev, R. A.; Kruger, N. A.; Fridriksson, E. K.; Lewis, M. A.; Horn, D. M.; Carpenter, B. K.; McLafferty, F. W. Electron capture dissociation of gaseous multiply-charged proteins is favored at disulfide bonds and other sites of high hydrogen atom affinity J. Am. Chem. Soc. 1999, 121, Kruger, N. A.; Zubarev, R. A.; Carpenter, B. K.; Kelleher, N. L.; Horn, D. M.; McLafferty, F. W. Electron capture versus energetic dissociation of protein ions Int. J. Mass Spectrom. 1999, 183, Zubarev, R. A.; Horn, D. M.; Fridriksson, E. K.; Kelleher, N. L.; Kruger, N. A.; Lewis, M. A.; Carpenter, B. K.; McLafferty, F. W. Electron capture dissociation for structural characterization of multiply charged protein cations Anal. Chem. 2000, 72, Mirgorodskaya, E.; Roepstorff, P.; Zubarev, R. A. Localization of O-glycosylation sites in peptides by electron capture dissociation in a fourier transform mass spectrometer Anal. Chem. 1999, 71, Hu, Q. Z.; Noll, R. J.; Li, H. Y.; Makarov, A.; Hardman, M.; Cooks, R. G. The Orbitrap: a new mass spectrometer J. Mass Spectrom. 2005, 40, McLuckey, S. A. Gas-Phase Bio-Ion/Ion Reactions: The Hows and Whys of Reagent Selection,56th ASMS Conference on Mass Spectrometry and Applied Topics Denver, CO, June 1-5, 2008.
35 Stephenson, J. L.; McLuckey, S. A. Ion/ion proton transfer reactions for protein mixture analysis Anal. Chem. 1996, 68, Stephenson, J. L.; McLuckey, S. A. Ion/ion reactions in the gas phase: Proton transfer reactions involving multiply-charged proteins J. Am. Chem. Soc. 1996, 118, Stephenson, J. L.; McLuckey, S. A. Adaptation of the Paul Trap for study of the reaction of multiply charged cations with singly charged anions Int. J. Mass Spectrom. Ion Process. 1997, 162, Stephenson, J. L.; McLuckey, S. A. Simplification of product ion spectra derived from multiply charged parent ions via ion/ion chemistry Anal. Chem. 1998, 70, Stephenson, J. L.; McLuckey, S. A. Charge manipulation for improved mass determination of high- mass species and mixture components by electrospray mass spectrometry J. Mass Spectrom. 1998, 33, McLuckey, S. A.; Stephenson, J. L.; Asano, K. G. Ion/ion proton-transfer kinetics: Implications for analysis of ions derived from electrospray of protein mixtures Anal. Chem. 1998, 70, McLuckey, S. A.; Stephenson, J. L. Ion ion chemistry of high-mass multiply charged ions Mass Spectrom. Rev. 1998, 17, Wells, J. M.; Stephenson, J. L.; McLuckey, S. A. Charge dependence of protonated insulin decompositions Int. J. Mass Spectrom. 2000, 203, A1-A9 60. Reid, G. E.; Wu, J.; Chrisman, P. A.; Wells, J. M.; McLuckey, S. A. Charge-statedependent sequence analysis of protonated ubiquitin ions via ion trap tandem mass spectrometry Anal. Chem. 2001, 73, Newton, K. A.; Chrisman, P. A.; Reid, G. E.; Wells, J. M.; McLuckey, S. A. Gaseous apomyoglobin ion dissociation in a quadrupole ion trap: [M+2H](2+)-[M+21H](21+) Int. J. Mass Spectrom. 2001, 212, Chrisman, P. A.; Newton, K. A.; Reid, G. E.; Wells, J. M.; McLuckey, S. A. Loss of charged versus neutral heme from gaseous holomyoglobin ions Rapid Commun. Mass Spectrom. 2001, 15, Badman, E. R.; Chrisman, P. A.; McLuckey, S. A. A quadrupole ion trap mass spectrometer with three independent ion sources for the study of gas-phase ion/ion reactions Anal. Chem. 2002, 74, Syka, J. E. P.; Coon, J. J.; Schroeder, M. J.; Shabanowitz, J.; Hunt, D. F. Peptide and protein sequence analysis by electron transfer dissociation mass spectrometry Proc. Natl. Acad. Sci. U. S. A. 2004, 101, Silivra, O. A.; Kjeldsen, F.; Ivonin, I. A.; Zubarev, R. A. Electron capture dissociation of polypeptides in a three-dimensional quadrupole ion trap: Implementation and first results J. Am. Soc. Mass Spectrom. 2005, 16, Newton, K. A.; McLuckey, S. A. Generation and manipulation of sodium cationized peptides in the gas phase J. Am. Soc. Mass Spectrom. 2004, 15, Newton, K. A.; Amunugama, R.; McLuckey, S. A. Gas-phase ion/ion reactions of multiply protonated polypeptides with metal containing anions J. Phys. Chem. A 2005, 109,
36 He, M.; McLuckey, S. A. Two ion/ion charge inversion steps to form a doubly protonated peptide from a singly protonated peptide in the gas phase J. Am. Chem. Soc. 2003, 125, Xia, Y.; McLuckey, S. A. Evolution of instrumentation for the study of gas-phase ion/ion chemistry via mass spectrometry J. Am. Soc. Mass Spectrom. 2008, 19, Loo, R. R. O.; Udseth, H. R.; Smith, R. D. Evidence of Charge Inversion in the Reaction of Singly Charged Anions with Multiply Charged Macroions J. Phys. Chem. 1991, 95, Loo, R. R. O.; Udseth, H. R.; Smith, R. D. A New Approach for the Study of Gas- Phase Ion-Ion Reactions Using Electrospray Ionization J. Am. Soc. Mass Spectrom. 1992, 3, Scalf, M.; Westphall, M. S.; Smith, L. M. Charge reduction electrospray mass spectrometry Anal. Chem. 2000, 72, Frey, B. L.; Lin, Y.; Westphall, M. S.; Smith, L. M. Controlling gas-phase reactions for efficient charge reduction electrospray mass spectrometry of intact proteins J. Am. Soc. Mass Spectrom. 2005, 16, Yu, X.; Jin, W.; McLuckey, S. A.; Londry, F. A.; Hager, J. W. Mutual storage mode ion/ion reactions in a hybrid linear ion trap J. Am. Soc. Mass Spectrom. 2005, 16, Xia, Y.; Chrisman, P. A.; Erickson, D. E.; Liu, J.; Liang, X. R.; Londry, F. A.; Yang, M. J.; McLuckey, S. A. Implementation of ion/ion reactions in a quadrupole/time-offlight tandem mass spectrometer Anal. Chem. 2006, 78, Wu, J.; Hager, J. W.; Xia, Y.; Londry, F. A.; McLuckey, S. A. Positive ion transmission mode ion/ion reactions in a hybrid linear ion trap Anal. Chem. 2004, 76, Louris, J. N.; Brodbeltlustig, J. S.; Cooks, R. G.; Glish, G. L.; Vanberkel, G. J.; McLuckey, S. A. Ion Isolation and Sequential Stages of Mass-Spectrometry in a Quadrupole Ion Trap Mass-Spectrometer Int. J. Mass Spectrom. Ion Process. 1990, 96, March, R. E. An introduction to quadrupole ion trap mass spectrometry J. Mass Spectrom. 1997, 32, Mather, R. E.; Todd, J. F. J. The Quadrupole Ion Store (Quistor).7. Simultaneous Positive-Negative Ion Mass-Spectrometry Int. J. Mass Spectrom. Ion Process. 1980, 33, Herron, W. J.; Goeringer, D. E.; McLuckey, S. A. Ion-Ion Reactions in the Gas-Phase - Proton-Transfer Reactions of Protonated Pyridine with Multiply-Charged Oligonucleotide Anions J. Am. Soc. Mass Spectrom. 1995, 6, McLuckey, S. A.; Reid, G. E.; Wells, J. M. Ion parking during ion/ion reactions in electrodynamic ion traps Anal. Chem. 2002, 74, Herron, W. J.; Goeringer, D. E.; McLuckey, S. A. Product ion charge state determination via ion/ion proton transfer reactions Anal. Chem. 1996, 68, Herron, W. J.; Goeringer, D. E.; McLuckey, S. A. Gas-Phase Electron-Transfer Reactions from Multiply-Charged Anions to Rare-Gas Cations J. Am. Chem. Soc. 1995, 117,
37 Payne, A. H.; Glish, G. L. Gas-phase ion/ion interactions between peptides or proteins and iron ions in a quadrupole ion trap Int. J. Mass Spectrom. 2001, 204, Reid, G. E.; Wells, J. M.; Badman, E. R.; McLuckey, S. A. Performance of a quadrupole ion trap mass spectrometer adapted for ion/ion reaction studies Int. J. Mass Spectrom. 2003, 222, Wells, J. M.; Chrisman, P. A.; McLuckey, S. A. "Dueling" ESI: Instrumentation to study ion/ion reactions of electrospray-generated cations and anions J. Am. Soc. Mass Spectrom. 2002, 13, Wells, J. M.; Chrisman, P. A.; McLuckey, S. A. Formation of protein-protein complexes in vacuo J. Am. Chem. Soc. 2001, 123, Wells, J. M.; Chrisman, P. A.; McLuckey, S. A. Formation and characterization of protein-protein complexes in vacuo J. Am. Chem. Soc. 2003, 125, He, M.; McLuckey, S. A. Increasing the negative charge of a macroanion in the gas phase via sequential charge inversion reactions Anal. Chem. 2004, 76, Gunawardena, H. P.; McLuckey, S. A. Synthesis of multi-unit protein heterocomplexes in the gas phase via ion-ion chemistry J. Mass Spectrom. 2004, 39, Hager, J. W. A new linear ion trap mass spectrometer Rapid Commun. Mass Spectrom. 2002, 16, Schwartz, J. C.; Senko, M. W.; Syka, J. E. P. A two-dimensional quadrupole ion trap mass spectrometer J. Am. Soc. Mass Spectrom. 2002, 13, Londry, F. A.; Hager, J. W. Mass selective axial ion ejection from a linear quadrupole ion trap J. Am. Soc. Mass Spectrom. 2003, 14, Coon, J. J.; Ueberheide, B.; Syka, J. E. P.; Dryhurst, D. D.; Ausio, J.; Shabanowitz, J.; Hunt, D. F. Protein identification using sequential ion/ion reactions and tandem mass spectrometry Proc. Natl. Acad. Sci. U. S. A. 2005, 102, Xia, Y.; Liang, X. R.; McLuckey, S. A. Pulsed dual electrospray ionization for ion/ion reactions J. Am. Soc. Mass Spectrom. 2005, 16, Liang, X. R.; Han, H. L.; Xia, Y.; McLuckey, S. A. A pulsed triple ionization source for sequential ion/ion reactions in an electrodynamic ion trap J. Am. Soc. Mass Spectrom. 2007, 18, Liang, X. R.; McLuckey, S. A. Transmission mode ion/ion proton transfer reactions in a linear ion trap J. Am. Soc. Mass Spectrom. 2007, 18, Liang, X. R.; Hager, J. W.; McLuckey, S. A. Transmission mode Ion/Ion electrontransfer dissociation in a linear ion trap Anal. Chem. 2007, 79, McAlister, G.; Coon, J. J. A Dual Reaction Cell, ETD-Enabled Orbitrap Mass Spectrometer for Top-Down Proteomics,56th ASMS Conference on Mass Spectrometry and Applied Topics Denver, CO, June 1-5, Kholomeev, A.; Makarov, A.; Denisov, E.; Lange, O.; Balshun, W.; Horning, S. Squeezing a Camel through the Eye of a Needle: a Curved Linear Trap for Pulsed Ion Injection into Orbitrap Analyzer,54th ASMS Conference on Mass Spectrometry and Applied Topics Seattle, WA, May 28 - June 1, Hirabayashi, A.; Sakairi, M.; Koizumi, H. Sonic Spray Mass-Spectrometry Anal. Chem. 1995, 67,
38 Hirabayashi, A.; Sakairi, M.; Koizumi, H. Sonic Spray Ionization Method for Atmospheric-Pressure Ionization Mass-Spectrometry Anal. Chem. 1994, 66, Xia, Y.; Liang, X. R.; McLuckey, S. A. Sonic spray as a dual polarity ion source for ion/ion reactions Anal. Chem. 2005, 77, Liang, X. R.; Xia, Y.; McLuckey, S. A. Alternately pulsed nanoelectrospray ionization/atmospheric pressure chemical ionization for ion/ion reactions in an electrodynamic ion trap Anal. Chem. 2006, 78, Kaiser, R. E.; Cooks, R. G.; Stafford, G. C.; Syka, J. E. P.; Hemberger, P. H. Operation of a Quadrupole Ion Trap Mass-Spectrometer to Achieve High Mass Charge Ratios Int. J. Mass Spectrom. Ion Process. 1991, 106, Xia, Y.; Thomson, B. A.; McLuckey, S. A. Bidirectional ion transfer between quadrupole arrays: MSn ion/ion reaction experiments on a quadrupole/time-of-flight tandem mass spectrometer Anal. Chem. 2007, 79, McAlister, G. C.; Phanstiel, D.; Good, D. M.; Berggren, W. T.; Coon, J. J. Implementation of electron-transfer dissociation on a hybrid linear ion trap-orbitrap mass spectrometer Anal. Chem. 2007, 79, Clemmer, D. E.; Jarrold, M. F. Ion mobility measurements and their applications to clusters and biomolecules J. Mass Spectrom. 1997, 32, Kaneko, Y.; Megill, L. R.; Hasted, J. B. Study of Inelastic Collisions by Drifting Ions J. Chem. Phys. 1966, 45, 3741-& 110. Badman, E. R.; Myung, S.; Clemmer, D. E. Gas-phase separations of protein and peptide ion fragments generated by collision-induced dissociation in an ion trap Anal. Chem. 2002, 74, Badman, E. R.; Myung, S.; Clemmer, D. E. Evidence for Unfolding and Refolding of Gas-Phase Cytochrome c Ions in a Paul Trap J. Am. Soc. Mass Spectrom. 2005, 16, Clemmer, D. E.; Hudgins, R. R.; Jarrold, M. F. Naked Protein Conformations - Cytochrome-C in the Gas-Phase J. Am. Chem. Soc. 1995, 117, Hunter, J. M.; Fye, J. L.; Boivin, N. M.; Jarrold, M. F. C-120(+) Isomers from Laser- Ablation of Fullerene Films J. Phys. Chem. 1994, 98, Jarrold, M. F.; Bower, J. E.; Creegan, K. Chemistry of Semiconductor Clusters - a Study of the Reactions of Size Selected Si+N3-24 with C2h4 Using Selected Ion Drift Tube Techniques J. Chem. Phys. 1989, 90, Vonhelden, G.; Wyttenbach, T.; Bowers, M. T. Conformation of Macromolecules in the Gas-Phase - Use of Matrix-Assisted Laser-Desorption Methods in Ion Chromatography Science 1995, 267, Valentine, S. J.; Clemmer, D. E. H/D exchange levels of shape-resolved cytochrome c conformers in the gas phase J. Am. Chem. Soc. 1997, 119, Hoaglund, C. S.; Valentine, S. J.; Sporleder, C. R.; Reilly, J. P.; Clemmer, D. E. Three-dimensional ion mobility TOFMS analysis of electrosprayed biomolecules Anal. Chem. 1998, 70, Hoaglund-Hyzer, C. S.; Li, J. W.; Clemmer, D. E. Mobility labeling for parallel CID of ion mixtures Anal. Chem. 2000, 72,
39 Hoaglund, C. S.; Valentine, S. J.; Clemmer, D. E. An ion trap interface for ESI-ion mobility experiments Anal. Chem. 1997, 69, Henderson, S. C.; Valentine, S. J.; Counterman, A. E.; Clemmer, D. E. ESI/ion trap/ion mobility/time-of-flight mass spectrometry for rapid and sensitive analysis of biomolecular mixtures Anal. Chem. 1999, 71, Myung, S.; Lee, Y. J.; Moon, M. H.; Taraszka, J.; Sowell, R.; Koeniger, S.; Hilderbrand, A. E.; Valentine, S. J.; Cherbas, L.; Cherbas, P.; Kaufmann, T. C.; Miller, D. F.; Mechref, Y.; Novotny, M. V.; Ewing, M. A.; Sporleder, C. R.; Clemmer, D. E. Development of high-sensitivity ion trap ion mobility spectrometry time-of-flight techniques: A high-throughput nano-lc-ims-tof separation of peptides arising from a Drosophila protein extract Anal. Chem. 2003, 75, Hoaglund-Hyzer, C. S.; Clemmer, D. E. Ion trap/ion mobility/quadrupole/time of flight mass spectrometry for peptide mixture analysis Anal. Chem. 2001, 73, Kanu, A. B.; Dwivedi, P.; Tam, M.; Matz, L.; Hill, H. H. Ion mobility-mass spectrometry J. Mass Spectrom. 2008, 43, Pringle, S. D.; Giles, K.; Wildgoose, J. L.; Williams, J. P.; Slade, S. E.; Thalassinos, K.; Bateman, R. H.; Bowers, M. T.; Scrivens, J. H. An investigation of the mobility separation of some peptide and protein ions using a new hybrid quadrupole/travelling wave IMS/oa-ToF instrument Int. J. Mass Spectrom. 2007, 261, Koeniger, S. L.; Merenbloom, S. I.; Valentine, S. J.; Jarrold, M. F.; Udseth, H. R.; Smith, R. D.; Clemmer, D. E. An IMS-IMS analogue of MS-MS Anal. Chem. 2006, 78, Merenbloom, S. I.; Koeniger, S. L.; Valentine, S. J.; Plasencia, M. D.; Clemmer, D. E. IMS-IMS and IMS-IMS-IMS/MS for separating peptide and protein fragment ions Anal. Chem. 2006, 78, Shaffer, S. A.; Tang, K. Q.; Anderson, G. A.; Prior, D. C.; Udseth, H. R.; Smith, R. D. A novel ion funnel for focusing ions at elevated pressure using electrospray ionization mass spectrometry Rapid Commun. Mass Spectrom. 1997, 11, Him, T.; Tolmachev, A. V.; Harkewicz, R.; Prior, D. C.; Anderson, G.; Udseth, H. R.; Smith, R. D.; Bailey, T. H.; Rakov, S.; Futrell, J. H. Design and implementation of a new electrodynamic ion funnel Anal. Chem. 2000, 72, Tang, K.; Shvartsburg, A. A.; Lee, H. N.; Prior, D. C.; Buschbach, M. A.; Li, F. M.; Tolmachev, A. V.; Anderson, G. A.; Smith, R. D. High-sensitivity ion mobility spectrometry/mass spectrometry using electrodynamic ion funnel interfaces Anal. Chem. 2005, 77,
40 34 Figure 1. ECD spectrum of 15+ ions from cytochrome c. [48]
41 35 Figure 2. (a) Charge-reduced, tandem mass spectrum of [ubiquitin + Pt(CN) 6 + 7H] 5+. Ubiquitin cation injection time = 300 ms; Pt(CN) 6 2- injection time = 200 ms; ubiquitin/pt(cn) 6 reaction time = 200 ms; activation for 300 ms at 89.0 khz, 570 mv; PDCH anion injection time = 4 ms; PDCH/complex reaction time = 120 ms. Note: X = Pt(CN) 6, and the asterisk (*) denotes a small neutral molecule loss (NH 3 or H 2 O) from the ion. (b) Preion/ion MS/MS spectrum of the complex with the fragment ions labeled to shown the charge state of the fragments prior to charge reduction. [63]
42 Figure 3. The three electrodes of the quadrupole ion trap shown in open array. [78] 36
43 Figure 4. The overall instrument configuration along with typical operating voltages and pressures. [92] 37
44 38 Figure 5. Schematic portrayal of the experimental apparatus based on the ion path of a triple quadrupole mass spectrometer. The linear ion trap mass spectrometer was created using either q2 or Q3. [91]
45 39 Figure 6. Schematic of steps involved in the operation of the LTQ mass spectrometer for peptide sequence analysis by ETD. (A) Injection of multiply protonated peptide molecules (precursor ions) generated by ESI. (B) Application of a dc offset to move the precursor ions to the front section of the linear trap. (C) Injection of negatively charged reagent ions from the CI source into the center section of the linear trap. (D) Application of a supplementary dipolar broadband ac field to eject all ions except those within 3 mass-unit windows centered around the positively charged precursor ions and the negatively charged electron-donor reagent ions. (E) Removal of the dc potential well and application of a secondary RF voltage (100 V zero to peak, 600 khz) to the end lens plates of the linear trap to allow positive and negative ion populations to mix and react. (F) Termination of ion/ion reactions by axial ejection of negatively charged reagent ions while retaining positive ions in the center section of the trap. This is followed by mass-selective, radial ejection of positively charged fragment ions to record the resulting MS/MS spectrum. [64]
46 40 Figure 7. Two-dimensional contour plot of nested drift (flight) time data for a mixture of ions formed from electrosprayed [D-Ala 2,3 ]methionine enkephalin. These data were recorded with no gas in the octopole collision cell. The contours are shown on a 10-point scale; this removes all features that contain fewer than 10 ion counts. The distribution includes a series of a-, b-, and y-type fragment ions that are formed upon high-energy injection into the drift tube (see text). The drift time axis has been normalized to a helium pressure of 2.70 Torr. Also shown (left) is the time-of-flight mass spectrum obtained by integrating the flight time data over the drift time range. (Data are plotted on a normalized intensity scale so that peak heights can be compared directly with the data in Figure 3.) The resolving power along the flight time axis is typically 200 (m/ m of a peak for a singly charged ion, where m is determined at half-maximum). Along the drift time axis, the resolving power (t/ t, where t is determined at half-maximum) is between 20 and 30, for all peaks. [118]
47 41 CHAPTER 2. A Linear Ion Trap Mass Spectrometer with Versatile Control and Data Acquisition for Ion/Ion Reactions Matthew W. Soyk*, Qin Zhao*, R.S. Houk*, and Ethan R. Badman *Iowa State University, Department of Chemistry, Ames, IA USA Ames Laboratory, U. S. Department of Energy, Ames, IA USA Hoffman-La Roche Inc., Non-Clinical Safety, 340 Kingsland St., Nutley, NJ, USA A manuscript accepted for publication in the Journal of the American Society for Mass Spectrometry, 2008, published online DOI: /j.jasms Abstract A linear ion trap (LIT) with electrospray ionization (ESI) for top-down protein analysis has been constructed. An independent atmospheric sampling glow discharge ionization (ASGDI) source produces reagent ions for ion/ion reactions. The device is also meant to enable a wide variety of ion/ion reaction studies. To reduce the instrument s complexity and make it available for wide dissemination, only a few simple electronics components were custom built. The instrument functions as both a reaction vessel for gasphase ion/ion reactions, and a mass spectrometer using mass-selective axial ejection. Initial results demonstrate trapping efficiency of 70 to 90% and the ability to perform proton transfer reactions on intact protein ions, including dual polarity storage reactions, transmission mode reactions, and ion parking.
48 42 Introduction Linear quadrupole ion traps (LITs)[1] have been a subject of recent interest, primarily because of their higher performance compared to 3d ion traps. Until recently, LITs were mainly used as ion storage devices or as collision cells for tandem mass spectrometry (MS/MS) preceding another type of mass analyzer (e.g. TOF[2, 3] or FT-ICR[4, 5]). Compared to 3d traps, LITs offer higher injection efficiency ( <10% vs. almost 100%, respectively) and, because of their larger volume, higher ion storage capacity, while still maintaining the ability to perform MS N in a single device. More recently, two major innovations have led to widespread use of LITs as mass analyzers: radial[6] or axial[7] ejection methods. These LIT s still have high trapping efficiency and storage capacity, with the added benefits of mass analysis in a single device [8]. For top-down protein analysis, linear and 3d ion traps cannot achieve the ultrahigh mass resolution and accuracy of FT-ICR[9] or Orbitrap instruments[10] necessary to resolve and unambiguously identify the isotopic distributions of highly multiply-charged ions. However, traps are well-suited to ion/ion reactions [11-13] like proton transfer to simplify the resulting complex, overlapping product ion spectra. Electron transfer dissociation (ETD)[11] ion/ion reactions also provide an alternative tool for protein ion dissociation. Ion/ion reaction experiments have been carried out in both types of LITs, and although ETD capabilities are becoming more readily available on commercial ion traps, proton transfer reaction capabilities are not yet commercially available. In addition, many researchers would like greater control and flexibility over instrumental parameters than is typically available in commercial devices, especially for
49 43 fundamental experiments and development of new methods. Here we discuss the development of an electrospray ionization (ESI)-linear ion trap mass spectrometer that has been constructed to enable complete control over all functions of the device. Mass scanning by radial ejection requires machining an exit slit and channel in at least one of the quadrupole rods. To simplify measurement of mass spectra and allow the future addition of subsequent components, e.g., ion mobility and time of flight analysis, this device is operated using mass-selective axial ejection (MSAE) [14]. Commercially available components were used primarily to reduce the complexity of the development and allow wide dissemination of this device to other researchers. Initial performance characteristics for MS and gas phase ion/ion reactions are described, as well as future uses for this device in bioanalytical MS and as a source for ion mobility-tof instruments. McLuckey and co-workers have demonstrated the great value of commercial LITs with multiple pulsed ion sources, e.g. positive ESI for analyte ion formation plus negative ESI,[15-18] negative atmospheric pressure chemical ionization,[16, 18-21] or negative atmospheric sampling glow discharge ionization (ASGDI)[12, 22] for reagent ion formation. The present paper demonstrates the first work using an LIT with multiple continuous ion sources interfaced through a turning quadrupole that has proven valuable with 3d ion traps [23, 24]. Experimental Cytochrome c, ubiquitin and trypsin were purchased from Sigma-Aldrich (St. Louis, MO) and were used without further purification. Solutions of proteins were prepared at 20 to 30 µm in 1% aqueous acetic acid solutions for positive nano-esi. Nano-ESI ionization
50 44 emitters were pulled from glass capillaries (1.5 mm o.d., 0.86 mm i.d.) with a micropipette puller (Model P-97, Sutter Instruments, Novato, CA). The nano-esi voltage was +1 kv to +1.2 kv applied to a stainless steel wire through the back of the capillary. Perfluoro-1, 3- dimethylcyclohexane (PDCH) was purchased from Sigma-Aldrich (St. Louis, MO) and was used as the reagent ion for proton transfer ion/ion reactions. The PDCH was ionized using an ASGDI source identical to that described by Zhao and co-workers [25]. Instrumentation Figure 1 shows a schematic diagram of the LIT with two ion sources: one ESI and one pulsed ASGDI source that are interfaced to the LIT through a quadrupole deflector. It should be noted that a third ion source could be added to the blank flange of the ion source cube shown in Figure 1. The LIT is a standard quadrupole mass filter modified to enable LIT functionality. Ions are detected with a conversion dynode/electron multiplier. Instrument control is via a commercially available ion trap controller and software. Figure 2 shows a schematic diagram of how the ion trap controller and software communicate with and control all components of the LIT. Details about each part of the instrument are given below. Vacuum System. The two ion sources and ion optics are housed in an 8 conflat cube, and the LIT is housed in an 8 conflat 5-way cross. One turbo pump (Turbo-V550 MacroTorr, 550 l/s N 2, Varian Inc., Palo Alto, CA) is attached to the top of the cube that houses the ion sources, and a second, identical turbo pump is attached to the 5-way cross that houses the LIT. The turbo pump on the source cube is backed by a SD-301 mechanical pump (Varian Inc., Palo Alto, CA), and the turbo pump on the LIT 5-way cross is backed by an
51 45 E2M40 mechanical pump (BOC Edwards, Wilmington, MA). The chamber pressure is measured by a Micro-Ion Gauge (Helix Technology, Longmont, CO). The baseline pressure of the system is ~5 x 10⁻⁷ mbar. Ion Sources and Ion Optics. Both ion sources have been described [24, 25]. Typical pressures in the ion source interface regions (i.e. behind the first 254 µm aperture to atmosphere and before the second 381 µm aperture to the high vacuum region) are 0.90 mbar and 0.80 mbar for the nano-esi and ASGDI source, respectively. Each is pumped by a separate E2M40 mechanical pump. The pulsed ASGDI was initiated via a -400 V high voltage pulse supplied via a power supply (Model 556, Ortec, Oak Ridge, TN) through a fast pulser (Model PVX4150, Directed Energy Inc., Fort Collins, CO). Voltages for the interfaces and the first three lenses are supplied via 9 output power supplies (Model TD9500, Spectrum Solutions, Russelton, PA). The voltages on the quadrupole deflector (Model 81989, Extrel CMS, Pittsburgh, PA) and on the three lenses between the quadrupole deflector and the LIT are supplied via additional 9 output power supplies, but are switched using a computercontrolled fast relay switch to enable ions from each source to be focused separately to the LIT as required. The ASGDI source is the default ion source. A single TTL trigger is used to switch the optics to allow ESI ions to enter the trap, and a second TTL trigger is used to pulse on the ASGDI discharge. Linear Ion Trap. The LIT is a commercially available tri-filter quadrupole in a collision cell housing (r 0 = 9.5 mm, Extrel CMS, Pittsburgh, PA). The rf trapping voltage is supplied by a standard Extrel 300 W rf only power supply providing 3600 V 0-p (pole to
52 46 ground) at 880 khz. In order to operate the quadrupole as an LIT, and perform MSAE [14] and MS/MS experiments, modifications were made to the quadrupole and rf electronics. As described by Paul,[26] additional waveforms can be added to quadrupole rods to resonantly excite ions. Douglas and coworkers [2, 3] add dipolar excitation across a pair of opposite quadrupole rods to excite trapped ions for collision-induced dissociation and MS/MS. We implemented dipolar excitation by cutting the connections between one set of rods and add an extra rf post and hole through the collision cell housing. To add the dipolar excitation voltage to the rf trapping voltage on one set of rods, a toroidal transformer was used. The toroid (Model , Fair-Rite, Wallkill, NY) was housed in a metal casing outside the vacuum chamber. The turn ratio between the primary and secondary was 1:1 using 16 turns of 22 gauge magnet wire (Belden Corporation, Chicago, IL). One of the outputs of the rf power supply was connected to the center tap of the secondary. The outputs of the secondary are then fed to the quadrupole rods through rf feedthroughs (Model , Extrel CMS, Pittsburgh, PA). One side of the primary was grounded, and the other was connected to the waveform generator. The MSAE and MS/MS waveforms were generated from the ion trap controller. The original 5 V 0-p was amplified to 35.5 V 0-p using a custom amplifier (PA09 op-amp, Apex Microtechnology, Tucson, AZ) and applied to the primary of the transformer through a 50 Ω, 51 W resistor. Two additional modifications to the quadrupole were required for effective trapping and m/z analysis. The post-filter was removed, and the pre-filter was shorted to the center quad section. The center rod section is the only section that is aligned with high precision. Therefore, removing the post-filter ensures that the fringe fields necessary for MSAE occur
53 47 between the optimally-aligned center rod section and the exit aperture IQ2. Shorting the front and center sections together applies the full rf voltage to the entire trapping length and minimizes ion loss (from unequal potential well depths) as ions are trapped. This modification is especially important during charge reduction ion/ion reactions. As ions with a lower z and correspondingly higher m/z are formed, they will reside in increasingly shallower potential wells. Without the full rf voltage on both the center and the pre-filter section, ions at high m/z are no longer trapped and are lost. DC voltages (0-4 V) from an Argos ion trap controller (described in detail below) are amplified to ± 200 V (PA97 op-amp, Apex Microtechnology, Tucson, AZ), and controlled in the scan function with the ion trap controller. These dc voltages are applied to the entrance and exit lenses (IQ1, IQ2) and LIT rods (Q). The IQ1 and IQ2 lenses are 8 mm diameter and both are covered with nickel mesh (90% transparency, 70 lines per inch, InterNet Inc., Anoka, MN) on the interior side of the lenses. The distance from the IQ1 lens to the end of the quadrupole rods is ~5 mm. The IQ2 lens was modified to make the distance from the lens to the end of the quadrupole rods ~2 mm. In order to fully resonate the rf power supply after adding the toroidal transformer and changing the arrangement of the quad sections, the overall capacitance of the load was reduced by the following measures. 1) The original rf cable between the power supply and the transformer was shortened by 53 cm, from cm to cm. 2) the magnet wire used in the toroidal transformer was covered with Teflon tubing (1.7 mm O.D., 1.1 mm I.D.). 3) A 3 pf capacitor in the rf power supply near the output on both the toroid and non-toroid sides was removed. 4) The tap of the rf coil was moved to remove 2.25 turns on the toroid
54 48 side and 1 turn on the non-toroid side. By performing these steps, the power supply could generate nearly the maximum original rf voltage, as read by the internal feedback circuit. To make sure similar rf voltages were applied to each of the quadrupole rods, two duplicate rf detector circuits identical to those used by the Extrel power supply were built. These devices convert the rf voltage to a current that can be read with a digital multimeter. Using this method, the two sides of the rf output could be tuned to be within 1.99 ± 0.25% of each other, limited by the accuracy of the digital multimeter. The nitrogen buffer gas pressure in the LIT is adjusted using a variable leak valve (Model 203, Helix Technology, Longmont, CO) and measured by the pressure in the main chamber using the Micro-Ion Gauge. During a typical experiment, the chamber pressure is maintained at ~1.3x10⁻⁴ mbar with both sources open and nitrogen gas added to the LIT. Of course, the pressure inside the LIT is higher than that measured by the ion gauge. From the sizes of the IQ1 and IQ2 lenses (8 mm diameter), the 90% mesh covering the lenses, the measured pressure in the vacuum chamber (1.3x10⁻⁴ mbar), and the pumping speed (550 l/s), the pressure inside the LIT is estimated to be 5x10⁻³ mbar, assuming effusive flow out of IQ1 and IQ2. Mass spectra are acquired using MSAE by ramping the rf voltage while applying a dipolar resonance excitation frequency and a small, constant, repulsive voltage to IQ2 (typically +1 to +3 V for positive ions), while the dc voltage on the LIT rods is kept at ground. Ejected ions are detected with an electron multiplier with conversion dynode (402A- H, Detector Technology Inc., Palmer, MA). Scans were measured only in the forward direction, from low m/z to high m/z.
55 49 Modifications for Ion/Ion Reactions with Dual Polarity Trapping. In order to perform dual polarity storage mode ion/ion reactions, and store both positive and negative ions simultaneously, AC voltages are applied to IQ1 and IQ2 during PDCH injection and subsequent reaction time [11]. This axial trapping voltage is generated via a multifunction PC card (Model 6251, National Instruments, Austin TX) with custom software written in Labview 8.0. The frequency and amplitude are set in the software and are, therefore, fixed during an experiment and the waveform is switched on and off via a TTL trigger (1 µs delay). The initial 0-5 V 0-p sine wave is amplified via a custom amplifier (PA90, Apex Microtechnology, Tucson, AZ) up to 175 V 0-p and split into two 180 out-of-phase signals. The ac voltages are added to the dc voltage for IQ1 and IQ2 using a simple mixer circuit. Typically, the waveform is applied at 100 khz, with an amplitude of ~50 V 0-p, empirically determined to minimize ion loss during the reaction period. The amplitude and frequency of this waveform are lower than those used by McLuckey and coworkers [17]. In the first scan function segment of a dual polarity trapping ion/ion reaction, three processes are done simultaneously the dc potentials on the IQ1 and IQ2 lenses are set to 0V (the same potential as the quadrupole rods), the axial trapping waveform is turned on, and the ASGDI source is pulsed on. In the second segment, the ASGDI source is turned off, and the analyte and reagent ions are allowed to react. To end the reaction, the axial trapping waveform is turned off and the dc potentials on the IQ1 and IQ2 lenses are, simultaneously, set to repel (i.e., trap) the positive analyte ions, while excess negative reagent ions are ejected out both ends of the LIT.
56 50 Ion/Ion Reactions in Transmission Mode and Ion Parking. Another method for enabling ion/ion reactions, transmission mode reactions, has been described previously [15, 19]. Transmission mode reactions are enabled by trapping the analyte ions using small repulsive dc voltages (typically 2 to 5 V) on the IQ1 and IQ2 lenses and passing the reagent ions, continuously generated by the ASGDI source during the reaction time, through the population of trapped analyte ions. Any unreacted reagent ions pass completely through the LIT and are lost. Ending the transmission mode reactions simply requires turning off the ASGDI source, thus turning off the reagent ion beam. The reaction product ions remain trapped in the LIT because they are the same polarity as the unreacted analyte ions. Ion/ion reactions carried out using this method do not require the use of the axial trapping waveform, and there is only one scan segment for the reaction period. Therefore, the scan function for transmission mode ion-ion reactions is simpler than that for dual polarity trapping ion-ion reactions. Additionally, the electronics required to add the dual polarity trapping waveform to the containment lenses are not required, making the LIT hardware for transmission mode reactions much simpler than that for dual polarity storage mode reactions. Ion parking [27] is a technique that was developed by McLuckey and co-workers in which the rate of reaction for ions at a single m/z value [27] or multiple m/z values [28, 29] are selectively reduced. Increasing the relative velocity of reactant ions, which reduces the ion/ion reaction capture cross section, during an exothermic ion/ion reaction decreases the rate of reaction between those ions [27]. To enable ion parking, a low amplitude auxiliary sine wave (~1V 0-p, ~ 40 khz for the ions chosen here) is added to the x-rods of the LIT during the ion/ion reaction period. The auxiliary sine wave resonantly excites a particular product ion formed during the ion/ion reaction. The frequency and amplitude of the sine
57 51 wave are chosen so that the ion being parked is excited enough to inhibit the reaction rate but not so much that it is ejected from the LIT. These values are fine-tuned empirically to produce the desired results. As the reaction proceeds and the ion chosen to be parked is formed, it is resonantly excited by the applied auxiliary sine wave. The velocity of the excited ion relative to the reagent anion increases, thereby reducing its ion/ion reaction rate and minimizing further reaction. For the proton transfer ion/ion reactions on intact protein ions studied here, the result of an ion parking experiment is the concentration of most of the ions into a single charge state below that of the original ions. Electronics. An Argos ion trap controller (Griffin Analytical Technology, West Lafayette, IN) controls the entire instrument and acquires data. The scan function is generated by the Argos software. TTL pulses ( relays ) trigger the ASGDI source, switch the fast relay switch to enable injection of oppositely-charged ions, and toggle on the ion/ion trapping voltage. The two waveform outputs control the rf level (0-10 V control V 0-p of rf) and generate MS/MS waveforms, respectively. Different from previous versions of the Argos software, this version provides time dependent dc voltages (0-4 V registers ) that control the voltages applied to IQ1, IQ2, and the LIT rods. Data are acquired using the Argos data input (at a 250 khz sampling rate), but as a result, the data acquisition time is limited to 250 ms or less. Primarily, this limits the ability to perform slow mass scans over a wide mass range.
58 52 Results and Discussion LIT Performance. Initial characterization of the LIT includes determination of trapping efficiency, ion capacity, mass analysis efficiency, and measurement of mass accuracy. To determine the trapping efficiency, ions are gated into the trap for a specified time, cooled, and then dumped to the detector (in a non-mass selective manner) by dropping the IQ2 voltage. The response from the trapped ions is then compared to the response acquired during operation of the quadrupole as an rf-only ion guide for the same time as the trap fill time at the same rf level. Table 2 shows trapping efficiencies at 4 different fill times for positive ions of cytochrome c and trypsin generated by ESI. Efficiencies average 83% with a range from 68 to 92%. These values agree with those determined previously from other LIT instruments [6, 7]. Figure 3 shows a plot of total ion current (TIC) vs. LIT fill time for cytochrome c that is used to measure the ion capacity of the LIT. The response is nearly linear from 5 to 40 ms, after which the signal levels off. The ion current on IQ1 was then measured with all LIT and ion detector voltages turned off using a picoammeter (Model 6485, Keithley Instruments, Cleveland, OH) to determine the real number of ions delivered to the trap. It was assumed that the rate of ions that strike the wires of the Ni mesh covering IQ1, after accounting for the 90% transmission, approximates the rate at which ions are delivered to the LIT during the fill step of a trapping experiment. Using the average measured ion current from the IQ1 Ni mesh (7.97 pa), the correction for the 90% transmission, the fill time at which the response levels off (40 ms), the measured trapping efficiency (83%), and the average charge state of the cytochrome c ions used for the measurement (+8.5), it was
59 53 determined that approximately 1.9x10 6 ions can be trapped in the LIT. The maximum total charge in the LIT is thus ~ 1.6x10 7 charges. In order to avoid space charge effects, the LIT is not filled to this capacity during normal operation. Mass Spectra. A typical protein mass spectrum taken using MSAE is shown in Figure 4. The inset of Figure 4 shows the peak shape for the +9 charge state of cytochrome c. This peak has a full-width at half maximum (fwhm) of 1.11 Th, corresponding to a resolution of The measured fwhm from the LIT is about 1.4x larger than the calculated width of the isotopic envelope (0.77 Th, fwhm). Of course, resolving the isotopic distribution of this peak requires resolution in excess of ~18000 (50% valley). Table 1 shows the trapping voltages and ejection conditions used to take the spectrum shown in Figure 4. These operating conditions are typical for mass spectra taken with the LIT. The spectrum in Figure 4 shows adduct or impurity peaks at 54 Da, 90 Da, and 130 Da above each protein peak. The scan function used to generate this spectrum includes a heating ramp in which a 1.9 V 0-p, 150 khz sine wave is applied to the x-rods while the rf amplitude is ramped to bring the protein ions into resonance with the applied sine wave. Thus the ions are heated, and the adducts/impurities are dissociated. Without this heating ramp, the overall protein peak is very wide, encompassing the protein and all the adduct/impurity ions into a single wide peak. The adduct/impurity peaks could not be totally eliminated without severely reducing the intensity of the protein peak. It should also be noted that these same adduct peaks are seen from the same protein samples on another home-built MS in our lab [25].
60 54 The mass analysis efficiency is measured using a similar procedure as the trapping efficiency measurement. Protein ions are gated into the LIT for a specified time, cooled, and non-mass selectively emptied to the detector by dropping the potential on IQ2. In a second experiment, protein ions are gated into the LIT for the same specified time ensuring that the number of ions inside the trap is approximately the same for both experiments cooled, and mass analyzed using MSAE. The ratio of the TIC of the ions ejected under MSAE conditions to the TIC of all the ions trapped (measured by non-mass selectively ejecting ions) yields an average measured MSAE efficiency of 7.4±2.2%. Using the average measured MSAE efficiency and the overall length of the LIT (18.7 cm), it was calculated that the extraction region is 18.7 x = 1.4 cm long. The measured efficiency and extraction region length are less than the results obtained by Hager [7] at similar LIT pressure. Conversely, the measured MSAE efficiency is slightly higher than recent results obtained by Douglas and coworkers [30]. Our measured efficiency may be higher due to higher pressure in the LIT and the lower spectral resolution than in the results recorded by Douglas. Table 2 shows MSAE efficiency measurements for different fill times of cytochrome c and trypsin. The data shows that as fill time increases the MSAE efficiency decreases. Space charge effects may degrade the MSAE efficiency at longer fill times. Mass accuracy was determined by spraying a 50:50 mixture of cytochrome c and ubiquitin. The peak maxima for [M+9H] 9+ and [M+8H] 8+ of the cytochrome c ions (m/z ~ 1360 and 1530) were used to calibrate the m/z axis and the m/z at the peak maxima of [M+7H] 7+ and [M+6H] 6+ ions of ubiquitin (m/z ~ 1224 and 1429) were measured. Measured mass accuracies range from 900 to 2200 ppm. The accuracy limitations are likely due to voltage stability for the rf trapping voltage, resonance excitation voltage, and/or IQ2 dc
61 55 voltage. The use of calibrant ions in a m/z window that span that of the analyte may also improve mass measurement accuracy. To illustrate the performance of the LIT as a mass analyzer at moderate m/z values, a spectrum of the PDCH reagent anions from the glow discharge source is shown in Figure 5a. These ions are a mixture of [M-F] - and M -. [31]. The inset shows the peak shape and resolution for the [M-F] - ion. The 13 C isotope peak is cleanly resolved from the main peak at m/z 381. The nominal resolution value m/ m = ~1080 at fwhm. It should be noted that nonlinear resonance ejection peaks can be seen under certain conditions. These ghost peaks [32] occur at a q z value of 0.64 (β=0.5 or 220 khz in this system) consistent with octopolar field ejection [33]. Use of resonance ejection frequencies near this nonlinear resonance can produce asymmetric or split peaks. Therefore, the resonance ejection frequency is selected to avoid this nonlinear resonance value. Dual Polarity Trapping Mode Ion/Ion Reactions. The application of the dual polarity storage mode waveform used for ion/ion reactions is similar to that described previously [11]. The dual polarity storage mode proton transfer ion/ion reaction scan function consists of the following steps: filling the trap with protein cations, a cooling segment, a heating ramp to eliminate adduct peaks from the protein, another cooling segment, a PDCH fill segment, an additional reaction segment, a final cooling segment, and mass analysis. The results of such a dual polarity storage mode reaction between trypsin positive ions and negative PDCH ions are shown in Figure 5. The mass spectrum of the trypsin ions formed directly from ESI is shown in Figure 5b. The main ions observed under these sample and source conditions are the [M+11H] 11+ and [M+10H] 10+ charge states, with small amounts
62 56 of the [M+9H] 9+ and [M+12H] 12+ charge states. In the subsequent parts of Figure 5, the LIT is also filled with negative ions from PDCH (Figure 5a) for either 15 or 20 ms. The PDCH fill step is followed by a period of dual polarity storage where the positive trypsin ions and negative PDCH ions are allowed to react further. The amplitude of the LIT rf voltage during the ion/ion reaction periods is set at 360 V 0-p, leaving the most abundant PDCH ion ([M-F] - ) at q=0.74. This amplitude rf was empirically chosen to maximize the amount of high mass product ions that are trapped while still trapping the PDCH reagent ion. The dual polarity trapping waveform added to IQ1 and IQ2 during the ion/ion reaction periods is a 100 khz sine wave with an amplitude of 50 V 0-p. A PDCH fill time of 15 ms and additional reaction time of 100 ms converts the trypsin ions shown in Figure 5a to the [M+3H] 3+, [M+2H] 2+, and [M+H] + charge states (Figure 5c). Continuing the reaction for times in excess of 100 ms does not result in further conversion of trypsin ions to lower charge states (data not shown). Thus, all the PDCH anions that were trapped in a 15 ms fill time have been reacted after a 100 ms reaction. Figure 5d results when this dual polarity storage mode reaction experiment is repeated with a PDCH fill time of 20 ms and an additional reaction time of 100 ms. The multiply charged trypsin ions from Figure 5b are converted to primarily [M+H] +, m/z = ~24,000. The fwhm of the peak for this ion is 673 Th, and the resolution is 34. At this time, the [M+H] + ion of trypsin is the highest m/z ion created and ejected from this LIT. To achieve the mass range extension required to eject the [M+H] + ion of trypsin, a 35 khz sine wave was added to the LIT rods during the mass scan. The amplitude of this resonant excitation sine wave was ramped from 8.9 V 0-p to 24.8 V 0-p. The dc voltage on the IQ2 lens was set to be 2.5 V relative to the LIT rod bias (0 V dc).
63 57 Transmission Mode Ion/Ion Reactions. Results of proton transfer ion/ion reactions of multiply charged ubiquitin cations with PDCH anions are shown in Figure 6. During the transmission mode reaction period, the amplitude of the LIT rf voltage is set at 360 V 0-p, leaving the most abundant PDCH ion ([M-F] - ) at q=0.74, an equivalent value to dual polarity trapping mode experiments. Also, injecting reagent anions at high q-values results in the greatest spatial overlap between the analyte and reagent ions, maximizing the ion/ion reaction rate [15, 19]. The dc voltages on IQ1 and IQ2 were set at 3 V repulsive relative to the rod dc bias (0 V). Figure 6a shows the mass spectrum of ubiquitin obtained directly from ESI. The solution and ESI source conditions yield ubiquitin ions primarily in the [M+6H] 6+ to [M+8H] 8+ charge states. As shown in Figure 6b, transmission mode reaction with PDCH anions for 40 ms converts approximately half these ions to the [M+3H] 3+ to [M+5H] 5+ charge states, while the other half of the ions are lost. Extending the reaction period to 70 ms converts the ions to roughly equal amounts of [M+H] + and [M+2H] 2+ (Figure 6c). In the latter experiment, continuing the reaction long enough to reduce the ions to [M+H] + and [M+2H] 2+ results in peaks that are only ~10% as high as those for the original spectrum. Most of this is due to ion losses from the ion/ion reaction, but some is attributed to loss in detector response for ions with lower charge. The same effect is seen in Figure 5 for trypsin in dual polarity storage mode. Others also report ion losses of similar magnitude as a consequence of ion/ion reactions, in either 3d ion traps or LITs [15, 27]. Ion Parking. Ion parking should alleviate some of the ion losses during proton transfer reactions. Results from such an experiment involving cytochrome c ions are shown
64 58 in Figure 7. Here the vertical scales have been kept constant so the signals can be compared more easily. The pre-ion/ion reaction spectrum of cytochrome c (Figure 7a) shows mostly the [M+9H] 9+ and [M+8H] 8+ charge states. A transmission mode reaction enabled by passing PDCH anions through the population of trapped cytochrome c ions for 20 ms yields a variety of peaks from [M+7H] 7+ to [M+4H] 4+, all with low abundances (Figure 7b). In Figure 7c, a waveform selected to excite the [M+7H] 7+ ion (1.8 V 0-p and 42 khz) is applied to the x-rods during the transmission mode reaction period. With ion parking enabled, most of the resulting product ions remain in the [M+7H] 7+ charge state; about 20% react further to form [M+6H] 6+ and a small amount of [M+5H] 5+. The signal in the [M+7H] 7+ charge state after the reaction with ion parking (Figure 7c) is about half of the total ion signal present in the [M+9H] 9+ and [M+8H] 8+ charge states created directly from the ESI source (Figure 7a), which is a much less severe compromise of signal than that shown for ion/ion reactions without ion parking in Figures 5 and 6. Conclusion A research-grade LIT with multiple ion sources was designed and constructed using primarily commercially available components. Preliminary experiments show that its trapping efficiency is similar to that of commercial LITs and its performance as a mass spectrometer is good compared to the theoretical peak width of the cytochrome c charge states. Ion/ion reaction capabilities in both dual polarity storage mode and transmission mode were also demonstrated. The device operates under versatile computer control that should facilitate application to various schemes for ion/ion reactions and other ways to manipulate ions.
65 59 Future plans for this instrument include: enabling top-down protein analysis, including both collision induced dissociation followed by proton transfer ion/ion reactions as well as electron transfer dissociation (ETD) [11]. A second plan for this instrument is writing a data acquisition program in Labview 8.0 to enable data acquisition with the National Instruments multifunction PC card mentioned earlier. This modification should allow measurement times longer than the 250 ms limit of the Argos data acquisition system. Another future use for this instrument is to replace the 3d ion trap as the source for an ion mobility-time-of-flight (IMS-TOF) device that was built in our lab [25]. Acknowledgments The authors acknowledge the following individuals: Chris Doerge and Don Douglas for helpful discussions and advice on construction of the toroidal transformer; Gregg Schieffer for help with testing of the custom electronics; Dick Egger, the late Steve Lee, and Terry Soseman (ISU Chemistry Machine Shop) for precision machining; Charlie Burg (Ames Lab ESG) for vacuum welding; Lee Harker (Ames Lab ESG) and Chuck Reese (ISU Chemistry) for custom electronics design, construction, and maintenance; Brian Regel and Brian Lippert at Extrel CMS for helpful discussion about the rf electronics; Brent Knecht, Brent Rardin and Mitch Wells (Griffin Analytical Technologies) for development and testing of the LIT software; Scott McLuckey for the plans for the computer-controlled fast relay switch; and James Hager, MDS Sciex, for discussions about improving the performance of the LIT. This work was funded by a grant from the Iowa State University Vice Provost for Research. MS acknowledges Extrel CMS for the Richard A. Schaeffer Memorial Travel Award to present this work at the 2006 ASMS Conference. MS also acknowledges the
66 60 Velmer A. and Mary K. Fassel Fellowship (Iowa State University, ), the Conoco- Phillips Fellowship (Iowa State University, ), and the GAANN Fellowship (Iowa State University, 2008) for financial support. References 1. Douglas, D. J.; Frank, A. J.; Mao, D. M. Linear ion traps in mass spectrometry Mass Spectrom. Rev. 2005, 24, Campbell, J. M.; Collings, B. A.; Douglas, D. J. A new linear ion trap time-of-flight system with tandem mass spectrometry capabilities Rapid Commun. Mass Spectrom. 1998, 12, Collings, B. A.; Campbell, J. M.; Mao, D. M.; Douglas, D. J. A combined linear ion trap time-of-flight system with improved performance and MSn capabilities Rapid Communications in Mass Spectrometry 2001, 15, Harkewicz, R.; Belov, M. E.; Anderson, G. A.; Pasa-Tolic, L.; Masselon, C. D.; Prior, D. C.; Udseth, H. R.; Smith, R. D. ESI-FTICR mass spectrometry employing datadependent external ion selection and accumulation J. Am. Soc. Mass Spectrom. 2002, 13, Syka, J. E. P.; Marto, J. A.; Bai, D. L.; Horning, S.; Senko, M. W.; Schwartz, J. C.; Ueberheide, B.; Garcia, B.; Busby, S.; Muratore, T.; Shabanowitz, J.; Hunt, D. F. Novel linear quadrupole ion trap/ft mass spectrometer: Performance characterization and use in the comparative analysis of histone H3 post-translational modifications J. Proteome Res. 2004, 3, Schwartz, J. C.; Senko, M. W.; Syka, J. E. P. A two-dimensional quadrupole ion trap mass spectrometer J. Am. Soc. Mass Spectrom. 2002, 13, Hager, J. W. A new linear ion trap mass spectrometer Rapid Commun. Mass Spectrom. 2002, 16, Jonscher, K. R.; Yates, J. R. The quadrupole ion trap mass spectrometer - A small solution to a big challenge Anal. Biochem. 1997, 244, Reid, G. E.; McLuckey, S. A. 'Top down' protein characterization via tandem mass spectrometry J. Mass Spectrom. 2002, 37, Hu, Q. Z.; Noll, R. J.; Li, H. Y.; Makarov, A.; Hardman, M.; Cooks, R. G. The Orbitrap: a new mass spectrometer J. Mass Spectrom. 2005, 40, Syka, J. E. P.; Coon, J. J.; Schroeder, M. J.; Shabanowitz, J.; Hunt, D. F. Peptide and protein sequence analysis by electron transfer dissociation mass spectrometry Proc. Natl. Acad. Sci. U. S. A. 2004, 101,
67 Yu, X.; Jin, W.; McLuckey, S. A.; Londry, F. A.; Hager, J. W. Mutual storage mode ion/ion reactions in a hybrid linear ion trap J. Am. Soc. Mass Spectrom. 2005, 16, Stephenson, J. L.; McLuckey, S. A. Simplification of product ion spectra derived from multiply charged parent ions via ion/ion chemistry Anal. Chem. 1998, 70, Londry, F. A.; Hager, J. W. Mass selective axial ion ejection from a linear quadrupole ion trap J. Am. Soc. Mass Spectrom. 2003, 14, Liang, X. R.; McLuckey, S. A. Transmission mode ion/ion proton transfer reactions in a linear ion trap J. Am. Soc. Mass Spectrom. 2007, 18, Liang, X. R.; Han, H. L.; Xia, Y.; McLuckey, S. A. A pulsed triple ionization source for sequential ion/ion reactions in an electrodynamic ion trap J. Am. Soc. Mass Spectrom. 2007, 18, Xia, Y.; Liang, X. R.; McLuckey, S. A. Pulsed dual electrospray ionization for ion/ion reactions J. Am. Soc. Mass Spectrom. 2005, 16, Xia, Y.; Chrisman, P. A.; Erickson, D. E.; Liu, J.; Liang, X. R.; Londry, F. A.; Yang, M. J.; McLuckey, S. A. Implementation of ion/ion reactions in a quadrupole/time-offlight tandem mass spectrometer Anal. Chem. 2006, 78, Liang, X. R.; Hager, J. W.; McLuckey, S. A. Transmission mode Ion/Ion electrontransfer dissociation in a linear ion trap Anal. Chem. 2007, 79, Liang, X. R.; Xia, Y.; McLuckey, S. A. Alternately pulsed nanoelectrospray ionization/atmospheric pressure chemical ionization for ion/ion reactions in an electrodynamic ion trap Anal. Chem. 2006, 78, Han, H. L.; Xia, Y.; McLuckey, S. A. Ion trap collisional activation of c and z(center dot) ions formed via gas-phase ion/ion electron-transfer dissociation J. Proteome Res. 2007, 6, Wu, J.; Hager, J. W.; Xia, Y.; Londry, F. A.; McLuckey, S. A. Positive ion transmission mode ion/ion reactions in a hybrid linear ion trap Anal. Chem. 2004, 76, Wells, J. M.; Chrisman, P. A.; McLuckey, S. A. "Dueling" ESI: Instrumentation to study ion/ion reactions of electrospray-generated cations and anions J. Am. Soc. Mass Spectrom. 2002, 13, Badman, E. R.; Chrisman, P. A.; McLuckey, S. A. A quadrupole ion trap mass spectrometer with three independent ion sources for the study of gas-phase ion/ion reactions Anal. Chem. 2002, 74, Zhao, Q.; Soyk, M. W.; Schieffer, G. M.; Houk, R. S.; Badman, E. R.; Fuhrer, K.; Gonin, M. An Ion Trap-Ion Mobility-Time of Flight Mass Spectrometer with Three Ion Sources for Ion/Ion Reactions J. Am. Soc. Mass Spectrom. 2008, Submitted
68 Paul, W.; Reinhard, H. P.; Vonzahn, U. The Electric Mass Filter as Mass Spectrometer and Isotope Separator. Zeitschrift Fur Physik 1958, 152, McLuckey, S. A.; Reid, G. E.; Wells, J. M. Ion parking during ion/ion reactions in electrodynamic ion traps Anal. Chem. 2002, 74, Chrisman, P. A.; Pitteri, S. J.; McLuckey, S. A. Parallel ion parking: Improving conversion of parents to first-generation products in electron transfer dissociation Anal. Chem. 2005, 77, Chrisman, P. A.; Pitteri, S. J.; McLuckey, S. A. Parallel ion parking of protein mixtures Anal. Chem. 2006, 78, Moradian, A.; Douglas, D. J. Mass selective axial ion ejection from linear quadrupoles with added octopole fields J. Am. Soc. Mass Spectrom. 2008, 19, Stephenson, J. L.; McLuckey, S. A. Adaptation of the Paul Trap for study of the reaction of multiply charged cations with singly charged anions Int. J. Mass Spectrom. Ion Process. 1997, 162, Mo, W.; Langford, M. L.; Todd, J. F. J. Investigation of 'Ghost' Peaks Caused by Non-Linear Fields in the Ion Trap Mass Spectrometer Rapid Commun. Mass Spectrom. 1995, 9, Franzen, J.; Gabling, R. H.; Schubert, M.; Wang, Y. In Practical Aspects of Ion Trap Mass Spectrometry; March, R. E.;Todd, J. F. J., Eds.; CRC Press: Boca Raton, FL, 1995; Vol. 1, pp
69 63 Table 1. Typical LIT conditions used to trap and eject ions over m/z range. Scan Step IQ1 (V) IQ2 (V) RF Amplitude (V 0-p ) Resonance Amplitude (V 0-p ) Resonance Frequency (khz) Scan Rate (Da/s) Fill (10-20 ms) Cool (30 ms) Heating Ramp to ,300 (100 ms) 1260 (q=0.46) Cool (30 ms) Mass Scan (250 ms) to to (q=0.75) 3000 Table 2. Trapping efficiency and MSAE efficiency at various ion fill times for cytochrome c and trypsin ions. Uncertainties represent the standard deviations of four to six such measurements. Fill Time (ms) Trapping Efficiency (%) MSAE Efficiency (%) ± ± ± ± ± ± ± ± 0.86
70 64 ESI IQ1 Linear ion trap (LIT) IQ2 ASGDI Quadrupole deflector Electron multiplier with conversion dynode Figure 1. Instrument hardware schematic drawn to scale.
71 65 Solid Line: control electronics Dashed Line: instrument hardware Griffin System Software--Ion Trap Control Software Computer Labview 8.0 Mass Spectrum Argos IT Controller Analog Register Amplifier NI DAQ 6251 Multifunction PC Card 8-Channel TTL Driver Quad RF Power Supply MS/MS Waveform Amplifier Mutual Storage Waveform Amplifier Switch 1 HV Pulser Toroidal Transformer AC and DC Voltage Mixer Circuit Ion Source Power Supplies X1-Quad Rod Source-Switching Lenses ASGDI X2-Quad Rod IQ1 IQ2 Ion Detector Y-Quad Rods Figure 2. Instrument communication and control diagram.
72 TIC (Arbitrary Units) Fill Time (ms) Figure 3. Plot of total ion current vs fill time used to measure the ion capacity of the LIT.
73 [M+9H] Ion Signal Intensity [M+8H] 8+ FWHM=1.11 R= m/z Figure 4. Cytochrome c mass spectrum. A heating ramp (100 ms, 540 to 1260 V 0-p rf, 1.9 V 0-p, 150 khz sine wave) reduced the intensity of the adduct peaks that are visible at 54 Da, 90 Da, and 130 Da above each protein peak.
74 (a) Resolution = 1080 Scan Speed = 680 Th/s [M-F] (b) [M+11H] 11+ [M+10H] 10+ Ion Signal Intensity (c) 350 [M+2H] 2+ M (d) [M+H] [M+3H] 3+ [M+H] + [M+2H] m/z Figure 5. Mass spectra taken from dual polarity storage mode proton transfer ion/ion reactions of intact protein trypsin. (a) Negative ion mode spectrum of the proton transfer reagent ion, PDCH. (b) Pre-ion/ion reaction spectrum of trypsin ions generated directly from ESI. (c) Post-ion/ion reaction spectrum of ions shown in (a) and (b) with a 15 ms PDCH fill and 100 ms reaction. (d) Post-ion/ion reaction spectrum of ions shown in (a) and (b) with a 20 ms PDCH fill and 100 ms reaction.
75 [M+8H] 8+ [M+7H] 7+ (a) 1000 [M+6H] 6+ Ion Signal Intensity [M+7H] 7+ (b) [M+5H] 5+ [M+3H] [M+2H] 2+ [M+H] + (c) m/z Figure 6. Mass spectra taken from transmission mode proton transfer ion/ion reactions of intact protein ubiquitin. (a) Pre-ion/ion reaction spectrum of ubiquitin ions generated directly from ESI. (b) Mass spectrum resulting from a transmission mode proton transfer ion/ion reaction enabled by passing PDCH anions through the population of trapped ubiquitin ions from (a) for 40 ms. (c) Mass spectrum resulting from a transmission mode proton transfer ion/ion reaction enabled by passing PDCH anions through the population of trapped ubiquitin ions from (a) for 70 ms.
76 70 [M+9H] 9+ [M+8H] (a) Intensity [M+7H] (b) [M+7H] 7+ [M+5H] 5+ [M+6H]6+ [M+4H] [M+7H] 7+ (c) [M+6H] m/z Figure 7. Mass spectra taken from an ion parking experiment during a transmission mode proton transfer ion/ion reaction. (a) Pre-ion/ion reaction spectrum of cytochrome c ions generated directly from ESI. (b) Mass spectrum resulting from a transmission mode proton transfer ion/ion reaction enabled by passing PDCH anions through the population of trapped cytochrome c from (a) for 20 ms. (c) Mass spectrum resulting from a transmission mode proton transfer ion/ion reaction enabled by passing PDCH anions through the population of trapped cytochrome c ion from (a) for 20 ms, during which a 1.8 V 0-p, 42 khz sine wave was added to the x-rods of the LIT, enabling the [M+7H] 7+ ion to be parked.
77 71 CHAPTER 3. An Ion Trap - Ion Mobility Time of Flight Mass Spectrometer with Three Ion Sources for Ion-Ion Reactions Qin Zhao*, Matthew W. Soyk*, Gregg M. Schieffer*, R.S. Houk*, Ethan R. Badman *Iowa State University, Department of Chemistry, Ames, IA, USA Ames Laboratory, U. S. Department of Energy, Ames, IA USA Hoffman-La Roche Inc., Non-Clinical Safety, 340 Kingsland St., Nutley, NJ, USA Katrin Fuhrer, Marc Gonin TOFWerk AG, Feuerwerkerstrasse 39, CH-3602 Thune, Switzerland A manuscript to be submitted to the Journal of the American Society for Mass Spectrometry, Abstract The instrument described here combines the capabilities of ion-ion reactions with ion mobility (IM) and time-of-flight (TOF) measurements for conformation studies and topdown analysis of large biomolecules. Ubiquitin ions from either of two electrospray ionization (ESI) sources are combined in a 3D ion trap with negative ions from atmospheric sampling glow discharge ionization (ASGDI). The ion-ion reaction products are then separated by IM and analyzed via a TOF mass analyzer. Alternatively, protein ions are fragmented by collision-induced dissociation (CID) in the 3D ion trap, followed by ion-ion
78 72 reactions to reduce the charge states of the CID product ions, thus simplifying the tandem mass spectrum. Instrument characteristics and the use of a new ion trap controller and software modifications to control the entire instrument are described. Introduction Despite the widespread use of mass spectrometry (MS) for biological analyses, further improvements in MS instrumentation are desirable, particularly in areas like proteomics [1] and characterization of large macromolecular complexes [2, 3]. These instrumentation improvements provide analytical capabilities that enable new biological studies not envisioned previously. Ion mobility (IM) [4, 5] has become a very useful technique for analysis of biological ions in the gas phase. IM provides information about ion size and structure [6], as it rapidly separates ions based on collision cross-section, rather than just m/z ratio. The use of IM to disperse a mixture of ions in time prior to analysis via a time-of-flight (TOF) MS, i.e, nested drift (flight) time measurements, is an important recent advance. These experiments [7] were pioneered by Clemmer and coworkers in the mid-1990 s and have now been used by several other groups [8, 9]. In a series of instrumental designs, the Clemmer group has made various modifications to the initial ESI-IM-TOF, including the insertion of a collision cell between the IM drift tube and the TOF for mobility labeling experiments [10, 11], and the addition of an ion trap prior to the mobility drift tube to improve the duty cycle from the continuous ESI source [12, 13]. One publication demonstrated MS/MS capabilities with an ion trap prior to IM-TOF [14], but not with the entire instrument under computer control. Therefore, only relatively simple experiments were possible.
79 73 IM has been used to analyze the products of ion-molecule reactions [15] including proton transfer [16, 17], H/D exchange [18], and salvation [19-22]. In these studies the desired reactions take place either in the atmospheric pressure ion source interface region or in the drift tube itself. Thus, only long reaction times and certain reagent ions can be used. In addition, performing reactions in the IM cell can make spectral interpretation difficult because the fragmentation and chemistry occur at the same time. In the current experiments, the ion/ion reaction chemistry is decoupled from the subsequent mobility and mass analysis. Therefore, the reaction time and chemistry of reagent ions are controlled more effectively, including a wider selection of reagent ions from independent ion sources. Gas-phase ion-ion reactions provide another dimension for gas-phase bioanalysis. Pioneering work by Smith and coworkers [23, 24] were followed by a continuing series of experiments by McLuckey s group [25]. Ion-ion reactions are rapid, versatile, and can be controlled via various ion manipulation schemes. To date, the most common type of reaction has been proton-transfer to manipulate the charge states of multiply-charged ions [26] and simplify complex MS/MS spectra [27, 28]. Use of product ions in low charge states can improve mass accuracy and resolution, especially with low resolution mass analyzers. Other useful reactions include electron transfer, most notably electron transfer dissociation (ETD) [29-31], electron capture dissociation (ECD) [32, 33], and complex formation [34, 35]. Ionion reactions can also be used to measure chemical properties of gas-phase biomolecules. Various instruments specifically for ion-ion reactions include two [29, 36-38], three[39], or four [40] independent ion sources arranged around an ion trap, although use of pulsed sources and a single ion extraction system is also possible [41, 42].
80 74 Here, we describe the first instrument to include capabilities for both ion-ion reactions and IM-TOF-MS measurements. Initial experiments and instrument characteristics are described, including use of a new ion trap controller and software to control the entire instrument. Experimental Bovine ubiquitin (Sigma-Aldrich, St. Louis, MO) was used without further purification. Protein solutions were 20 to 30 µm in 1% aqueous acetic acid for positive ion mode. Nano-ESI emitters were pulled from glass capillaries (1.5 mm o.d., 0.86 mm i.d.) by a micropipette puller (P-97, Sutter Instruments, Novato, CA). Nano-ESI was performed by applying +1 kv to +1.2 kv to the protein solution via a stainless steel wire through the back of the sample capillary. Negative ions from perfluoro-1,3-dimethylcyclohexane (PDCH, Sigma-Aldrich, St. Louis, MO) were used as the proton acceptor reagent. Instrumentation General. The instrument is shown to scale in Figure 1. It contains three independent ion sources: two for ESI and one for ASGDI [43]. Ions from these sources are stored in the 3D quadrupole IT for reaction. The products are separated by the IM drift tube, followed by a quadrupole-time-of-flight mass spectrometer (q-tof). The vacuum chamber consists of an 8 Conflat cube, which houses the three ion sources, ion optics, and turning quadrupole deflector (TQ, Extrel, Pittsburgh, PA). The cube is evacuated by a turbo pump (Turbo-V550 MacroTorr, 550 l/s N 2, Varian Inc., Palo Alto, CA) backed by a mechanical pump (SD-30, Varian, Palo Alto, CA) and is attached to a
81 75 custom built rectangular chamber (304 stainless steel, 35.6 cm wide 76.2 cm long 33.0 cm high) that also houses the IT, drift tube, and quadrupole collision cell. The TOF is in an aluminum housing (8.90 cm 25.4 cm 66.7 cm) attached to the back of the chamber; the TOF tube is oriented vertically. The main vacuum chamber is evacuated by two diffusion pumps (Diffstak 250/2000M and 160/700M, BOC Edwards) backed by mechanical pumps (E2M40 and RV12, respectively, BOC Edwards, Wilmington, MA). The TOF is pumped by a turbomolecular pump (Turbo-V550 MacroTorr, 550 l/s N 2, Varian Inc., Palo Alto, CA), backed by a mechanical pump (RV12, BOC Edwards). Convectron and ion gauges (Series 375 and 358, Helix Technology Corporation, Mansfield, MA) measure the ion source and chamber pressures (all are uncorrected). The base pressures are mbar in the main chamber and mbar in the TOF when the sources are closed. In normal operation, one ESI source and the ASGDI source are open, and helium is added to the drift tube (~1.3 to 2.0 mbar) through a precision leak valve (Model 203, Granville Phillips, Boulder, CO). The main chamber pressure is then ~ mbar and the pressure in the TOF region is mbar. Ion Sources. The basic design for a three ion source interface has been described previously [40]. The three sources are arranged around three faces of the 8 Conflat cube; one source is on the ion optical axis of the instrument, and the other two are orthogonal to it. The two ESI sources are identical in design. The interface region, which is 5.08 cm in diameter and 1.59 cm deep, is machined out of an 8 ConFlat flange. A 254 µm diameter aperture separates the interface region from atmosphere, and a 381 µm diameter aperture separates the interface region from the high vacuum region. Two lenses between the
82 76 apertures focus ions through the interface region. Negative ions from perfluoro-1,3- dimethylcyclohexane (PDCH, Sigma-Aldrich, St. Louis, MO) were used as the proton acceptor reagent. Each ESI interface region operates at ~1 mbar during the experiment and is pumped by a mechanical pump (E2M40, BOC Edwards). The nano-esi voltages are provided by 5 kv power supplies (ORTEC 659, Oak Ridge, TN). The ASGDI source interface region has the same design and dimensions as the ESI sources but without the interface lenses. It is pumped by a mechanical pump (E2M40, BOC Edwards). PDCH headspace vapors are sampled via a 0.64 cm diameter Nylon tube connecting the sample container and the outer aperture plate. The source pressure (~0.786 mbar) is regulated by a bellows valve (SS-4BMW, Swagelok) inserted in the tubing between the compound headspace and the source region. The ASGDI source uses a 3 kv power supply (ORTEC 556, Oak Ridge, TN) and a high voltage pulser (PVX-4150, Directed Energy Corp., Fort Collins, CO) that is trigged by a TTL pulse from the Argos IT controller (Griffin Analytical Technologies, West Lafayette, IN), to apply a ~420 V pulse between the outer and inner (grounded) aperture plates. This ASGDI pulse lasts for the time required to add reagent anions to the IT, typically 5 to 20 ms. Each ion source has three lenses attached to the vacuum side of the flange to focus the ions from the exit aperture of the source into the TQ. The second lens is split and serves as a deflector for direction focusing. The TQ was modified by severing the electrical connection between diagonally opposing rods and by applying four independent DC potentials to the four TQ rods. This allows ions to either be deflected 90 o onto the axis of the instrument or to be passed straight through.
83 77 After the TQ, three lenses focus the ions into the IT. Two home-built high-voltage switches, controlled by TTL signals from the Argos IT controller, switch the voltages applied to the TQ and three subsequent lenses to allow ions from the desired ion source into the IT. Six nine-channel DC power supplies (±500 V, TD9500, Spectrum Solutions, Russellton, PA) generate the potentials for the ion optics from the sources to the ion trap. Ion Trap. The 3D quadrupole IT (ideal geometry, r 0 = 1.0 cm, z 0 = cm, RM Jordan, Grass Valley, CA) is attached to the drift tube; the exit is mounted cm from the front plate of the drift tube. The end caps are at ground, and the DC potential on the ring electrode is zero to prevent any asymmetric fields during ion trapping. The 665 khz ion trapping voltage is generated by a home-built LC circuit that provides up to 5000 V 0p. The maximum low mass cutoff value is ~m/z 1220 (calculated assuming an ideal ion trap geometry). A 0 to 10 V dc control signal from the Argos IT controller determines the rf trapping voltage. A custom control generates the initial low-level rf voltage, measures feedback to stabilize the rf voltage, and contains calibration data. The initial rf voltage is first amplified to 0 to 200 V 0p by a 50 W commercial amplifier (AG1020, T&C Power Conversion Inc., Rochester, NY) and finally by the custom LC circuit to the full 0 to 5000 V 0p. Measured stabilities of the full rf voltage are better than ±1%. A TTL input allows the rf wave to be shut off in ~15 µs at any rf amplitude. The shutoff is not locked to the rf phase. The ion trap timing and voltages are controlled by an Argos IT controller and software (Figure 2). The Argos provides the master clock for the entire instrument, as well as two independent arbitrary waveform outputs, digital TTL triggers, and analog control outputs (0-4 V). One arbitrary waveform output provides the 0-10 V dc control signal for the ion
84 78 trap rf; the other is applied to the front endcap electrode (after being amplified by x17 to 85 V p-p ) to perform mass selection and resonance excitation. The TTL triggers are used to start the ASGDI source, control the high voltage switches for the ion sources, and start the ion injection pulse for the mobility experiment. A custom 8-channel driver is used to increase the power of the TTL signals to enable them to trigger 50 Ω loads. The ion injection TTL pulse also enables the high voltage pulser (PVX-4150, Directed Energy Corp., Fort Collins, CO, applied to the exit endcap) to eject ions from the ion trap. Typically this ejection pulse is 80 to 400V applied for 3 to 5 µs. Two analog signals are used to control the quadrupole collision cell, described below. Drift Tube. The drift tube (modified from a design provided by Valentine et al [44, 45]) consists of alternating 12.7 cm diameter 304 stainless steel lenses (0.16-cm thick, cm o.d cm i.d.) and Delrin insulating rings (1.27 cm thick, 12.7 cm o.d., 8.26 cm i.d.). The drift tube is cm long (together with the ion funnel) with a 0.5 mm diameter entrance aperture. A chain of 2 MΩ resistors connects the lenses, creating an electric field (typically 11 to 13 V/cm) down the drift tube. The voltage applied to the front of the drift tube is typically 30 to 100 V lower for positive ions than that of the ion trap. A capacitance manometer (690A13TRC, MKS Instrument, Methuen, MA) measures the He pressure inside the drift tube, which is typically ~1.33 to 2.00 mbar, controlled via another precision leak valve. Ion Funnel. To improve ion transmission efficiency, an ion funnel [45, 46] is integrated into the back of the drift tube (Figure 1). The funnel is based on the device
85 79 described by the Smith [46] and Jarrold groups [47]. After the last ring of the drift tube, a series of 25 stainless steel electrodes ( cm thick, 12.7 cm o.d.) with circular apertures whose inner diameters decrease linearly from to cm is attached. The ion funnel electrodes are sealed together using cm thick Delrin spacers and Viton o-rings giving a funnel length of cm. Thus, the helium pressure in the drift tube and ion funnel are the same. The electrodes are connected to each other with a series of resistors (Vishay, 500 kω, 0.6 W, ±1%). One voltage applied to the entrance of the drift tube, and a second voltage is applied to the exit of the ion funnel to set the axial electric field down the drift tube-ion funnel assembly. In the ion funnel, alternate lenses are capacitively coupled (Vishay, 1000 pf, 1.5 kv rms, ±20%) to form two lens chains. RF voltages (Ardara Technologies, North Huntingdon, PA) that are 180 degrees out of phase from each other are applied to each chain with amplitudes ~90 V pp at 360 khz. A capacitor to ground decouples the RF voltage from the drift tube lenses. There is one DC electrode after the exit of the ion funnel with a pressurelimiting aperture (1.0 mm diam). In this instrument, the ion funnel increases the overall total ion signal by a factor of ~7. Here, the basis of comparison is the same number of electrodes at the end of the drift tube all with the same ID and no rf voltage. In this experiment, signal is measured by extracting ions from the TOF source directly to the TOF microchannel plate (MCP) detectors. Another set of three lenses behind the drift tube-ion funnel focuses ions into the quadrupole collision cell (Figure 1). The voltages supplied to the ion funnel dc lens, the lenses before the collision cell, the entrance and exit lenses of the collision cell, and the
86 80 lenses between the collision cell and the TOF are floated on the drift tube exit voltage using a nine-output floating power supply (TD9500HV, Spectrum Solutions Inc., Russellton, PA). Quadrupole-TOF. The quadrupole collision cell (Figure 1) transmits ions from the ion funnel to the TOF. It also provides for CID of ions labeled by mobility (i.e., a pseudo MS/MS step) [10, 11], although this capability is not shown in this paper. The quadrupole (r 0 = 9.5 mm, 880 khz, 3600 V 0p per pole, Extrel, Pittsburgh, PA) is followed by an orthogonal W-reflectron TOF (TOFWerk, Thun, Switzerland). The collision cell and its electronics are floated using an isolation transformer (SIT , Stangenes Industries Inc., Palo Alto, CA). The collision cell is mounted to the vacuum side of an 8 conflat flange that is attached to the back of the main vacuum chamber. A capacitance manometer (Model 690A01TRC, MKS Instrument, Methuen, MA) measures the pressure inside the collision cell, which is typically He at ~ mbar of He and is controlled via another precision leak valve. The Argos IT controller (Figure 2) supplies two 0 to 4 V analog signals that are amplified to 0 to 10 and -200 to 200 V, respectively, and used by the quadrupole power supply to control the rf amplitude and to supply the dc bias to the collision cell rods to set the collision energy. After the ions exit the collision cell, they are focused into the source region of the TOF by a series of 10 lenses mounted in the hole machined out of the 8 conflat flange between the collision cell and the TOF, which is mounted vertically on the air side of the flange. One lens is split into half-plates for vertical direction focusing. The ions are pulsed upwards into the TOF drift region by a 2 µs pulse, and are then accelerated into the drift region by ~5800V. The voltages on the TOF electrodes and detector are controlled by the TOF software, which communicates directly with the TOF power supply. The TOF has a W-
87 81 reflectron configuration and can be operated in V-mode or in W-mode. Only the V-mode is used in this paper; the effective flight path is ~1.5 m. The ion detector is an eight-anode microchannel plate (MCP, Ionwerks, Houston, TX) that has post acceleration voltage of ~6000 V. The signal is amplified 100 by two fourchannel preamplifiers (XCD quad amplifier/discriminator, Ionwerks, Houston, TX) and then sent to an 8 channel time-to-digital converter (TDC 8, Ionwerks, Houston, TX). The TOF software reads the data from the TDC to create 2D data that contain both mobility time and mass spectral information. The timing of the TOF data acquisition is similar to methods described previously[7, 12]. As shown by the bottom three traces in Figure 3, the TOF timing controller gets signals from the software and an external trigger and sends TTL triggers to the TDC 8 and to the TOF pulser. The mobility acquisition is started by the ion injection pulse (a trigger from the Argos), after which the TOF timing controller starts sending TTL triggers at specific intervals depending on the mass range being acquired simultaneously to the TDC 8 and the TOF extraction lenses. In a typical experiment 100 mass spectra are taken within each 10 ms mobility spectrum, up to a maximum m/z value of Results and Discussion IM-TOF after Ion/Ion Reactions. In early research on proton transfer reactions with IM, a basic gas was introduced into the source region to create lower charge state ions through an in-source proton transfer reaction. In the present instrument, the total reaction time and reagent ion identity can be controlled. The experimental timing diagram (Figure 3) is similar to those previously shown for ion/ion reactions [40], except the usual ion trap mass
88 82 analysis step is replaced by injection of product ions into the IM drift tube. The experiment scan function shown in Figure 3 includes acquisition of nested flight time - mobility data. These capabilities are illustrated using charge reduction reactions of multiply charged ubiquitin ions with PDCH anions. The spectrum of the anions from the ASGDI is shown in Figure 4; note that the main reagent ions are [M-F] -. and [M-CF 3 ] -.. Charge reduction reactions can be used to produce ions in lower charge states than the usual ions generated solely by the ESI process. Additionally, by reducing the charge states of the protein ions, the IM resolution for ions in different charge states can be improved. Figure 5a shows a 3D mobility-m/z spectrum of ubiquitin before proton transfer reactions. The main charge states observed for ubiquitin under these solution and source conditions are +8 and +9. The mass resolution shown is m/ m = 930 at m/z Mass accuracies are within 28 ppm, using an external calibration. For a typical ion/ion reaction-im experiment, ubiquitin ions are injected for 50 to 100 ms, PDCH - ions are injected for 20 to 40 ms, and both polarity ions are trapped in the IT to react for 50 to 150 ms depending on the product ion charge states desired. A 3 to 5 µs pulse at -100V is then applied to the back endcap of the ion trap to inject ions into the drift tube. For the IM separation the He pressure in the drift tube is 1.3 to 1.8 mbar, and the applied voltages are -150V on the entrance of the drift tube and -700 V on the last electrode of the ion funnel. Figure 5b and 5c show spectra after ion/ion charge reduction reaction of ubiquitin with PDCH. Ubiquitin ions are converted to lower charge states, and the +1, +2 and +3 ubiquitin ions can now be resolved in the IM dimension. Previous attempts at analysis of
89 83 protein mixtures by CID after IM separation suffered because higher charge states of the proteins were not resolved in the mobility separation [48]. Thus, mobility labeling for proteins is not as useful as for peptides. Ion/ion reaction combined with IM separations provides a new technique to make mobility labeling (for on-the-fly MS/MS) possible for intact proteins. The capability to effectively fragment proteins behind the drift tube, especially at these lower charge states, is still under development. Of course, ion cross-sections can be determined from the IM drift times:[49] Ω = (18π ) 16 1/ 2 ( k b ze T ) 1/ 2 1 m i + 1 m b 1/ 2 1 N t D L E 760 P T where z is the charge state of ions, m i is the mass of ions, m b is the mass of the buffer gas, E is the electric field through the drift cell, L is the length of the drift cell, t D is the flight time through the drift cell, P is the pressure of the buffer gas, and T is the temperature of the buffer gas. Such cross-section measurements for ubiquitin ions are listed in Table 1. These data show that reducing charge state from +8 through +4 induces folding, i.e., lower measured cross sections. Further charge reduction from +4 to +1 does not change the cross sections appreciably, as if the protein then remains in a folded state. The effects of ion-ion reactions and charge state on measured cross sections and folding are discussed in more detail in other papers [50, 51]. CID on Intact Proteins followed by Charge Reduction. Figure 6a shows a spectrum obtained after storing only the +7 charge state of ubiquitin. Additional peaks are seen at m/z
90 84 values above that of the protein. The abundances of these extra ions vary from day to day. They are also observed at similar abundances when the same sample is analyzed on a commercial triple quadrupole instrument, so we believe they are mainly impurities in the sample, rather than adducts formed inside the instrument. We discriminate against these extra ions by trapping only the +7 ubiquitin ions in the results presented below. The +7 ubiquitin ions can readily be fragmented in the ion trap (Figure 6b). These CID product ions are in a variety of relatively high charge states and are only moderately resolved in the IM dimension. Thus, it is not easy to assign them at first. Figure 6c shows the spectrum resulting from charge reduction of the fragment ions in the ion trap after CID. The spectrum shifts to higher m/z, and the dispersion in the IM dimension is greatly improved. Many of the charge-reduced CID fragments can now be assigned by comparing the observed m/z values with that of fragments generated from the known sequence of ubiquitin. The assumption that the fragment ions in Figure 6c are in low charge states greatly simplifies these assignments. Most of the fragments observed here are b and y ions, in agreement with those found in other studies [40, 52]; a few c ions may be present. The IM plot for the charge-reduced fragments (Figure 6c) shows distinct groups that fall along slanted lines of different slopes for peptide fragment ions in +1, +2 and +3 charge states, as noted by Clemmer and co-workers. This phenomenon provides additional evidence to help assign charge states. These groups merge closer together at higher charge states (Figure 6b)[13], which is one reason they are poorly resolved in Figure 6a. Armed with the identities of the charge-reduced fragments (Figure 6c), many of the original, more highly charged fragments in Figure 6b can now be assigned. For example,
91 85 y is in the charge-reduced spectrum, so a more highly charged version (y in this case) should appear in the original CID spectrum (Figure 6b). Here we assume that the peptide fragment ions do not dissociate further during the charge reduction reactions, as shown by McLuckey [27]. A number of other, similar cases are identified in Figure 6b. The unusual c and c ions tentatively identified in the charge reduced spectrum can also be found in higher charge states in the original CID spectrum, which helps validate their assignment. Summary of the Instrument: From the above instrumentation description and result demonstration, this instrument combines ion mobility and ion/ion reaction capabilities, and it can be operated in variety of ways for different purposes. Firstly, it is very powerful to manipulate charge state and study the conformation change (folding and unfolding) of the large biomolecules. We have done work on this, and a publication will follow this instrument paper. Secondly, multiple stage MS/MS with charge reduction reaction makes top down analysis more efficient because it helps to assign fragments by both ion mobility dispersion and charge reduction. Thirdly, other types of ion/ion reaction (ETD, protein and metal ions, protein complexes formation) can also be done on this instrument. There is a lot of room for instrument development, such as replacing the 3-D ion trap with a linear ion trap, exploring the w-mode of the time-of-flight, and performing one more step of CID or adding a high-energy CID collision cell after ion mobility separation. Though the sensitivity of this instrument is not very high, we believe it is a start of a new research area and will open a broad space to explore.
92 86 Acknowledgements The authors acknowledge helpful discussions with Steve Valentine (Indiana Univ.); Scott McLuckey for the design of high-voltage switches; Brent Knecht, Garth Patterson, Brent Rardin, and Mitch Wells (Griffin Analytical) for assistance with the Argos and software; David Prior (Pacific Northwest National Lab) for design of the IT rf amplifier; and Randy Pedder (Ardara Technologies, North Huntingdon, PA) for advice on use of the rf supply for the ion funnel. Other custom electronics were designed and constructed by Lee Harker (Ames Lab Engineering Services Group); vacuum welding by Charlie Burg (Ames Lab); precision machining by Richard Egger, the late Steve Lee, and Terry Soseman (ISU Chemistry Machine Shop). Derrick Morast analyzed the ubiquitin sample with another ESI instrument to help determine the origin of the extra peaks. ERB acknowledges funding from Waters Corp. via an ASMS Research Award. Funding from Iowa State University: College of Liberal Arts and Sciences, Office of Biotechnology, Plant Sciences Institute, and the Carver Trust are gratefully acknowledged. References 1. Pandey, A.; Mann, M. Proteomics to study genes and genomes Nature 2000, 405, Loo, J. A.; Berhane, B.; Kaddis, C. S.; Wooding, K. M.; Xie, Y. M.; Kaufman, S. L.; Chernushevich, I. V. Electrospray ionization mass spectrometry and ion mobility analysis of the 20S proteasome complex J. Am. Soc. Mass Spectrom. 2005, 16, Sobott, F.; McCammon, M. G.; Hernandez, H.; Robinson, C. V. The flight of macromolecular complexes in a mass spectrometer Philos. Trans. R. Soc. Lond. Ser. A-Math. Phys. Eng. Sci. 2005, 363, St Louis, R. H.; Hill, H. H. Ion Mobility Spectrometry in Analytical-Chemistry Crit. Rev. Anal. Chem. 1990, 21,
93 87 5. Collins, D. C.; Lee, M. L. Developments in ion mobility spectrometry-mass spectrometry Anal. Bioanal. Chem. 2002, 372, Jarrold, M. F. Peptides and proteins in the vapor phase Annu. Rev. Phys. Chem. 2000, 51, Hoaglund, C. S.; Valentine, S. J.; Sporleder, C. R.; Reilly, J. P.; Clemmer, D. E. Three-dimensional ion mobility TOFMS analysis of electrosprayed biomolecules Anal. Chem. 1998, 70, Stone, E.; Gillig, K. J.; Ruotolo, B.; Fuhrer, K.; Gonin, M.; Schultz, A.; Russell, D. H. Surface-induced dissociation on a MALDI-ion mobility-orthogonal time-of-flight mass spectrometer: Sequencing peptides from an "in-solution" protein digest Anal. Chem. 2001, 73, Steiner, W. E.; Clowers, B. H.; English, W. A.; Hill, H. H. Atmospheric pressure matrix-assisted laser desorption/ionization with analysis by ion mobility time-offlight mass spectrometry Rapid Commun. Mass Spectrom. 2004, 18, Hoaglund-Hyzer, C. S.; Li, J. W.; Clemmer, D. E. Mobility labeling for parallel CID of ion mixtures Anal. Chem. 2000, 72, Hoaglund-Hyzer, C. S.; Clemmer, D. E. Ion trap/ion mobility/quadrupole/time of flight mass spectrometry for peptide mixture analysis Anal. Chem. 2001, 73, Henderson, S. C.; Valentine, S. J.; Counterman, A. E.; Clemmer, D. E. ESI/ion trap/ion mobility/time-of-flight mass spectrometry for rapid and sensitive analysis of biomolecular mixtures Anal. Chem. 1999, 71, Myung, S.; Lee, Y. J.; Moon, M. H.; Taraszka, J.; Sowell, R.; Koeniger, S.; Hilderbrand, A. E.; Valentine, S. J.; Cherbas, L.; Cherbas, P.; Kaufmann, T. C.; Miller, D. F.; Mechref, Y.; Novotny, M. V.; Ewing, M. A.; Sporleder, C. R.; Clemmer, D. E. Development of high-sensitivity ion trap ion mobility spectrometry time-of-flight techniques: A high-throughput nano-lc-ims-tof separation of peptides arising from a Drosophila protein extract Anal. Chem. 2003, 75, Badman, E. R.; Myung, S.; Clemmer, D. E. Gas-phase separations of protein and peptide ion fragments generated by collision-induced dissociation in an ion trap Anal. Chem. 2002, 74, Green, M. K.; Lebrilla, C. B. Ion-molecule reactions as probes of gas-phase structures of peptides and proteins Mass Spectrom. Rev. 1997, 16, Valentine, S. J.; Counterman, A. E.; Clemmer, D. E. Conformer-dependent protontransfer reactions of ubiquitin ions J. Am. Soc. Mass Spectrom. 1997, 8, Valentine, S. J.; Anderson, J. G.; Ellington, A. D.; Clemmer, D. E. Disulfide-intact and -reduced lysozyme in the gas phase: Conformations and pathways of folding and unfolding J. Phys. Chem. B 1997, 101, Valentine, S. J.; Clemmer, D. E. H/D exchange levels of shape-resolved cytochrome c conformers in the gas phase J. Am. Chem. Soc. 1997, 119,
94 Woenckhaus, J.; Mao, Y.; Jarrold, M. F. Hydration of gas phase proteins: Folded +5 and unfolded +7 charge states of cytochrome c J. Phys. Chem. B 1997, 101, Fye, J. L.; Woenckhaus, J.; Jarrold, M. F. Hydration of folded and unfolded gas-phase proteins: Saturation of cytochrome c and apomyoglobin Journal of the American Chemical Society 1998, 120, Woenckhaus, J. Drift time mass spectrometric protein hydration experiments Int. J. Mass Spectrom. 2002, 213, Wyttenbach, T.; Liu, D. F.; Bowers, M. T. Hydration of small peptides International Journal of Mass Spectrometry 2005, 240, Loo, R. R. O.; Udseth, H. R.; Smith, R. D. Evidence of Charge Inversion in the Reaction of Singly Charged Anions with Multiply Charged Macroions J. Phys. Chem. 1991, 95, Loo, R. R. O.; Udseth, H. R.; Smith, R. D. A New Approach for the Study of Gas- Phase Ion-Ion Reactions Using Electrospray Ionization J. Am. Soc. Mass Spectrom. 1992, 3, Pitteri, S. J.; McLuckey, S. A. Recent developments in the ion/ion chemistry of highmass multiply charged ions Mass Spectrom. Rev. 2005, 24, Stephenson, J. L.; McLuckey, S. A. Ion/ion proton transfer reactions for protein mixture analysis Anal. Chem. 1996, 68, Stephenson, J. L.; McLuckey, S. A. Simplification of product ion spectra derived from multiply charged parent ions via ion/ion chemistry Anal. Chem. 1998, 70, McLuckey, S. A.; Reid, G. E.; Wells, J. M. Ion parking during ion/ion reactions in electrodynamic ion traps Anal. Chem. 2002, 74, Syka, J. E. P.; Coon, J. J.; Schroeder, M. J.; Shabanowitz, J.; Hunt, D. F. Peptide and protein sequence analysis by electron transfer dissociation mass spectrometry Proc. Natl. Acad. Sci. U. S. A. 2004, 101, Pitteri, S. J.; Chrisman, P. A.; Hogan, J. M.; McLuckey, S. A. Electron transfer ion/ion reactions in a three-dimensional quadrupole ion trap: Reactions of doubly and triply protonated peptides with SO2 center dot Anal. Chem. 2005, 77, Chrisman, P. A.; Pitteri, S. J.; Hogan, J. M.; McLuckey, S. A. SO2- electron transfer ion/ion reactions with disulfide linked polypeptide ions J. Am. Soc. Mass Spectrom. 2005, 16, Breuker, K.; Oh, H. B.; Lin, C.; Carpenter, B. K.; McLafferty, F. W. Nonergodic and conformational control of the electron capture dissociation of protein cations Proc. Natl. Acad. Sci. U. S. A. 2004, 101, Ge, Y.; Lawhorn, B. G.; ElNaggar, M.; Strauss, E.; Park, J. H.; Begley, T. P.; McLafferty, F. W. Top down characterization of larger proteins (45 kda) by electron capture dissociation mass spectrometry J. Am. Chem. Soc. 2002, 124,
95 Wells, J. M.; Chrisman, P. A.; McLuckey, S. A. Formation of protein-protein complexes in vacuo J. Am. Chem. Soc. 2001, 123, Newton, K. A.; McLuckey, S. A. Generation and manipulation of sodium cationized peptides in the gas phase J. Am. Soc. Mass Spectrom. 2004, 15, Stephenson, J. L.; McLuckey, S. A. Adaptation of the Paul Trap for study of the reaction of multiply charged cations with singly charged anions Int. J. Mass Spectrom. Ion Process. 1997, 162, Reid, G. E.; Wells, J. M.; Badman, E. R.; McLuckey, S. A. Performance of a quadrupole ion trap mass spectrometer adapted for ion/ion reaction studies Int. J. Mass Spectrom. 2003, 222, Wu, J.; Hager, J. W.; Xia, Y.; Londry, F. A.; McLuckey, S. A. Positive ion transmission mode ion/ion reactions in a hybrid linear ion trap Anal. Chem. 2004, 76, Xia, Y.; Liang, X.; McLuckey, S. A. Pulsed Dual Electrospray Ionization for Ion/Ion Reactions Journal of the American Society for Mass Spectrometry 2005, 16, Badman, E. R.; Chrisman, P. A.; McLuckey, S. A. A quadrupole ion trap mass spectrometer with three independent ion sources for the study of gas-phase ion/ion reactions Anal. Chem. 2002, 74, Liang, X. R.; Xia, Y.; McLuckey, S. A. Alternately pulsed nanoelectrospray ionization/atmospheric pressure chemical ionization for ion/ion reactions in an electrodynamic ion trap Analytical Chemistry 2006, 78, Liang, X. R.; Han, H. L.; Xia, Y.; McLuckey, S. A. A pulsed triple ionization source for sequential ion/ion reactions in an electrodynamic ion trap Journal of the American Society for Mass Spectrometry 2007, 18, McLuckey, S. A.; Glish, G. L.; Asano, K. G.; Grant, B. C. Atmospheric Sampling Glow-Discharge Ionization Source for the Determination of Trace Organic- Compounds in Ambient Air Analytical Chemistry 1988, 60, Valentine, S. J.; Koeniger, S. L.; Clemmer, D. E. A split-field drift tube for separation and efficient fragmentation of biomolecular ions Anal. Chem. 2003, 75, Him, T.; Tolmachev, A. V.; Harkewicz, R.; Prior, D. C.; Anderson, G.; Udseth, H. R.; Smith, R. D.; Bailey, T. H.; Rakov, S.; Futrell, J. H. Design and implementation of a new electrodynamic ion funnel Anal. Chem. 2000, 72, Tang, K.; Shvartsburg, A. A.; Lee, H. N.; Prior, D. C.; Buschbach, M. A.; Li, F. M.; Tolmachev, A. V.; Anderson, G. A.; Smith, R. D. High-sensitivity ion mobility spectrometry/mass spectrometry using electrodynamic ion funnel interfaces Analytical Chemistry 2005, 77,
96 Julian, R. R.; Mabbett, S. R.; Jarrold, M. F. Ion funnels for the masses: Experiments and simulations with a simplified ion funnel Journal of the American Society for Mass Spectrometry 2005, 16, Badman, E. R.; Hoaglund-Hyzer, C. S.; Clemmer, D. E. Dissociation of different conformations of ubiquitin ions J. Am. Soc. Mass Spectrom. 2002, 13, Clemmer, D. E.; Jarrold, M. F. Ion mobility measurements and their applications to clusters and biomolecules J. Mass Spectrom. 1997, 32, Rachel R. Ogorzalek Loo, B. E. W., and Richard D. Smith Proton Transfer Reaction Studies of Multiply Charged Proteins in a High Mass-to-Charge Ratio Quadrupole Mass Spectrometer Journal of American Society for Mass Spectrometry 1994, 5, Stephen J. Valentine, J. G. A., Andrew D. Ellington, and David E. Clemmer Disulfide-Intact and -Reduced Lysozyme in the Gas Phase: Conformations and Pathways of Folding and Unfolding Journal of Physical Chemestry B 1997, 101, Xia, Y.; Liang, X. R.; McLuckey, S. A. Ion trap versus low-energy beam-type collision-induced dissociation of protonated ubiquitin ions Analytical Chemistry 2006, 78,
97 91 Table 1. Measured cross-sections for ubiquitin ions in different charge states. Charge state m/z Cross-section (Å 2 )
98 92 Figure 1. Scale diagram showing overall instrument, including two ESI and one ASGDI sources, ion optics, quadrupole deflector, IT, IM drift tube with ion funnel and q-tof. q
99 93 Computer Ion Trap Software TOF Software Argos IT Controller 8-Channel TTL Driver HV Pulser HV Pulser Amplifier Quad RF Quad Bias TOF Timing Controller TOF Lenses TOF Extraction TOF Power Supply MCP Amplifier TDC TTL Inverter Ion Trap Front Endcap Electrode Ion Trap RF Power Supply Source Power Supplies Switch 1 ASGDI Switch 2 Quad RF Power Supply Ion Trap Back Endcap Electrode - RF rod electrodes + RF rod electrodes Ion Trap Ring Electrode Ion Source Lenses Figure 2. Block diagram of instrument control electronics (see text for details). The solid lines indicate instrument control electronics, and the dashed lines indicate hardware in the vacuum chamber.
100 94 Positive Ion Injection Negative Ion Injection RF Amplitude IT WF Ion Injection Pulse Ion Mobility TOF Pulses Ion/Ion rxn. Eject anions CID, isolation, ion parking, etc. Drift time ms RF off 2µs 3-5µs Figure 3. A generic scan function for an ion/ion reaction followed by nested flight time/ion mobility experiment. The top and second plots show the time during which positive and negative ions are injected. The third plot shows the amplitude of the rf trapping voltage applied to the ring electrode of the ion trap. The lower three plots show the times when ions after ion/ion reaction are injected into the drift tube, ion mobility data acquisition and TOF extraction pulses.
101 95 Figure 4. Mass spectrum of PDCH reagent ions from ASGDI.
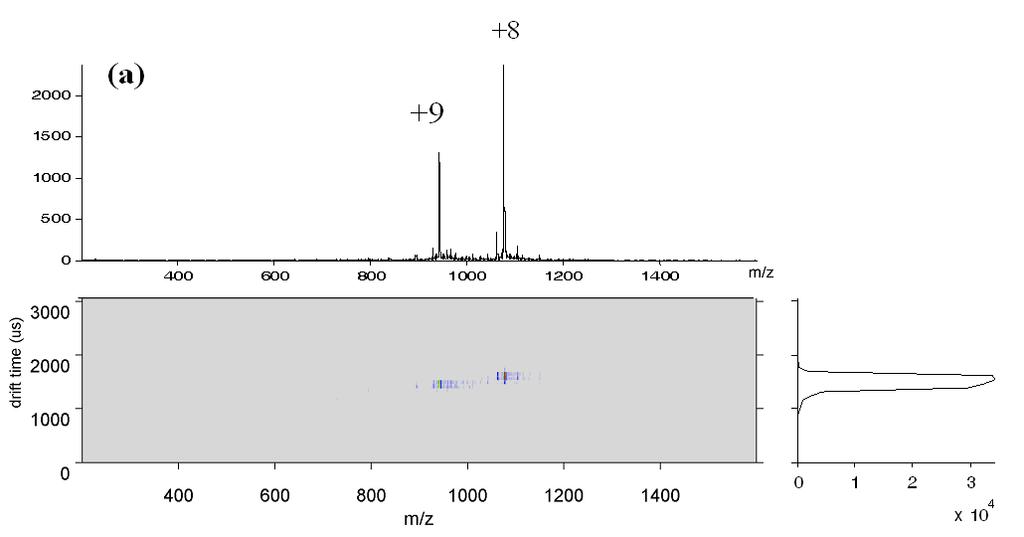
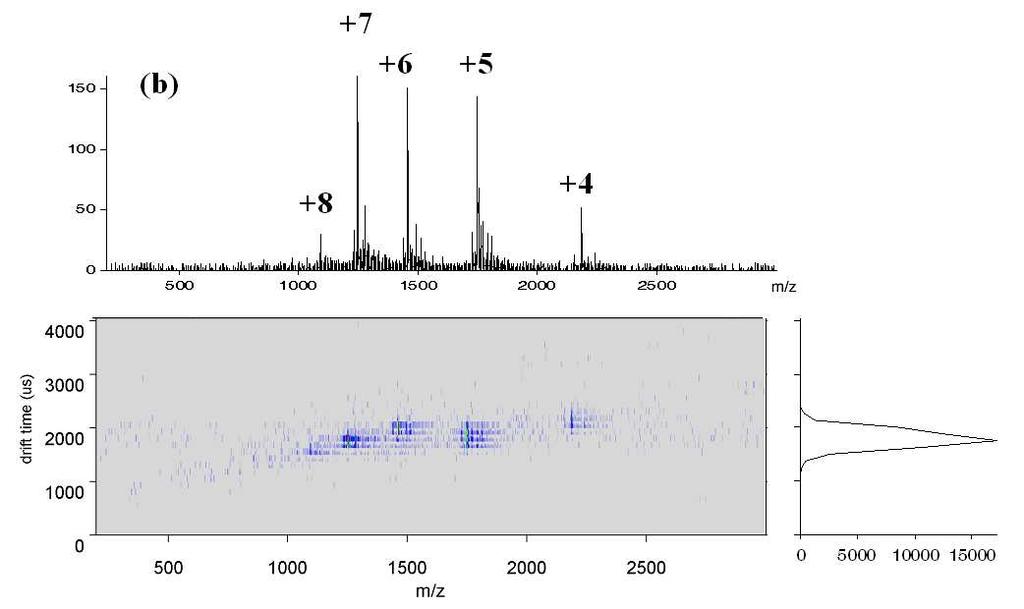
102 96

103 97 Figure 5. a) 3D mobility mass spectrum of ubiquitin; b) 3D mobility mass spectrum of ubiquitin after ion/ion reaction with PDCH negative ions for 20 ms; and c) spectrum after reaction for 200 ms. The ions in lower charge states are more readily resolved by IM. Conditions: 0.30mg/ml ubiquitin aqueous solution with 1% acetic acid, drift voltage -150V to -700V, drift pressure Torr, IT fill time 50 ms for ubiquitin.
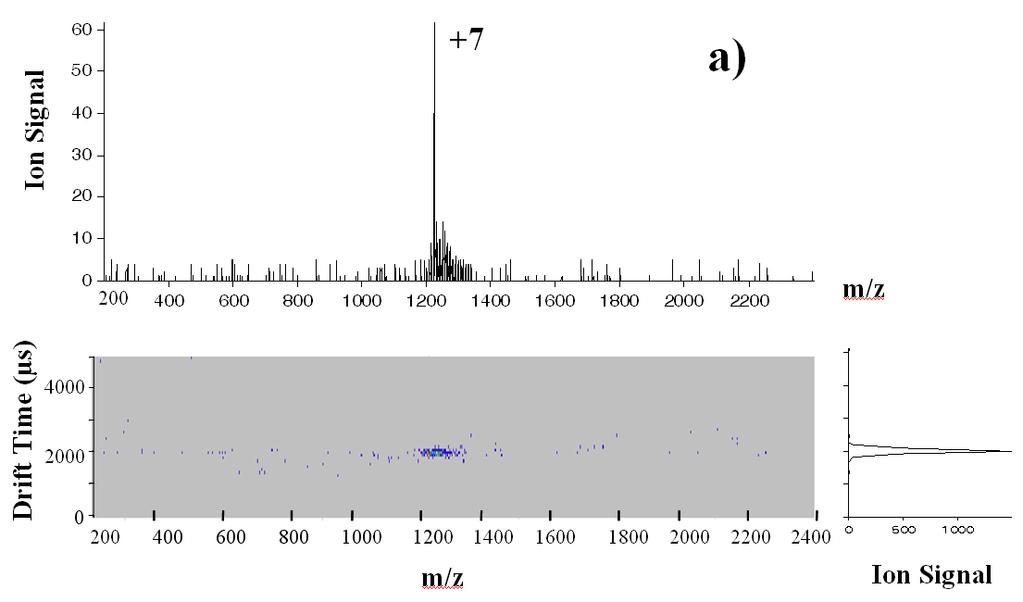
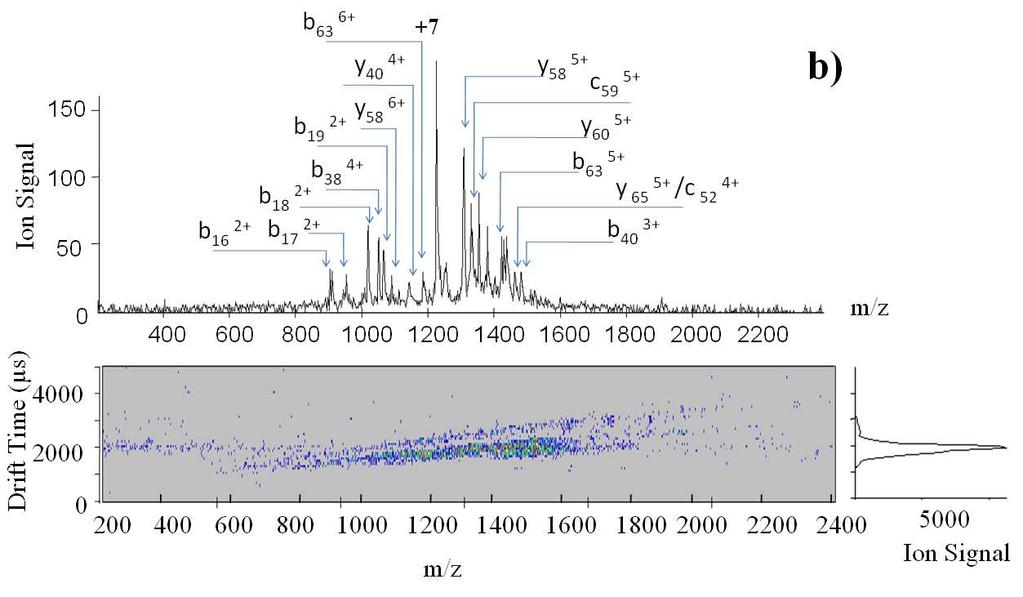
104 98
 3-D ion mobility spectrum of isolated ubiquitin +7 ions from 3-D ion trap; b) CID fragments from ubiquitin +7 ions")
105 99 Figure 6. a) 3-D ion mobility spectrum of isolated ubiquitin +7 ions from 3-D ion trap; b) CID fragments from ubiquitin +7 ions generated in 3-D ion trap; c) CID fragments from ubiquitin +7 ions after charge reduction with PDCH ions for 30 ms.
(Refer Slide Time 00:09) (Refer Slide Time 00:13)
 (Refer Slide Time 00:13)") (Refer Slide Time 00:09) Mass Spectrometry Based Proteomics Professor Sanjeeva Srivastava Department of Biosciences and Bioengineering Indian Institute of Technology, Bombay Mod 02 Lecture Number 09 (Refer
(Refer Slide Time 00:09) Mass Spectrometry Based Proteomics Professor Sanjeeva Srivastava Department of Biosciences and Bioengineering Indian Institute of Technology, Bombay Mod 02 Lecture Number 09 (Refer
MASS ANALYSER. Mass analysers - separate the ions according to their mass-to-charge ratio. sample. Vacuum pumps
 ION ANALYZERS MASS ANALYSER sample Vacuum pumps Mass analysers - separate the ions according to their mass-to-charge ratio MASS ANALYSER Separate the ions according to their mass-to-charge ratio in space
TANDEM MASS SPECTROSCOPY
 TANDEM MASS SPECTROSCOPY 1 MASS SPECTROMETER TYPES OF MASS SPECTROMETER PRINCIPLE TANDEM MASS SPECTROMETER INSTRUMENTATION QUADRAPOLE MASS ANALYZER TRIPLE QUADRAPOLE MASS ANALYZER TIME OF FLIGHT MASS ANALYSER
Mass Spectrometry and Proteomics - Lecture 2 - Matthias Trost Newcastle University
 Mass Spectrometry and Proteomics - Lecture 2 - Matthias Trost Newcastle University matthias.trost@ncl.ac.uk Previously: Resolution and other basics MALDI Electrospray 40 Lecture 2 Mass analysers Detectors
Introduction to the Q Trap LC/MS/MS System
 www.ietltd.com Proudly serving laboratories worldwide since 1979 CALL +1.847.913.0777 for Refurbished & Certified Lab Equipment ABI Q Trap LC/MS/MS Introduction to the Q Trap LC/MS/MS System The Q Trap
Types of Analyzers: Quadrupole: mass filter -part1
 16 Types of Analyzers: Sector or double focusing: magnetic and electric Time-of-flight (TOF) Quadrupole (mass filter) Linear ion trap Quadrupole Ion Trap (3D trap) FTICR fourier transform ion cyclotron
Mass Analyzers. Principles of the three most common types magnetic sector, quadrupole and time of flight - will be discussed herein.
 Mass Analyzers After the production of ions in ion sources, the next critical step in mass spectrometry is to separate these gas phase ions according to their mass-to-charge ratio (m/z). Ions are extracted
Fundamentals of Mass Spectrometry. Fundamentals of Mass Spectrometry. Learning Objective. Proteomics
 Mass spectrometry (MS) is the technique for protein identification and analysis by production of charged molecular species in vacuum, and their separation by magnetic and electric fields based on mass
Lecture 8: Mass Spectrometry
 intensity Lecture 8: Mass Spectrometry Relative abundance m/z 1 Ethylbenzene CH 2 CH 3 + m/z = 106 CH 2 + m/z = 91 C 8 H 10 MW = 106 CH + m/z = 77 + 2 2 What information can be obtained from a MS spectrum?
Lecture 8: Mass Spectrometry
 intensity Lecture 8: Mass Spectrometry Relative abundance m/z 1 Ethylbenzene experiment CH 2 CH 3 + m/z = 106 CH 2 + m/z = 91 C 8 H 10 MW = 106 CH + m/z = 77 + 2 2 What information can we get from MS spectrum?
for the Novice Mass Spectrometry (^>, John Greaves and John Roboz yc**' CRC Press J Taylor & Francis Group Boca Raton London New York
 Mass Spectrometry for the Novice John Greaves and John Roboz (^>, yc**' CRC Press J Taylor & Francis Group Boca Raton London New York CRC Press is an imprint of the Taylor & Francis Croup, an informa business
Translational Biomarker Core
 Translational Biomarker Core Instrumentation Thermo Scientific TSQ Quantum Triple Quadrupole Mass Spectrometers. There are two TSQ Quantum Ultra AM instruments available in the TBC. The TSQ Quantum Ultra
Mass Analyzers. mass measurement accuracy/reproducibility. % of ions allowed through the analyzer. Highest m/z that can be analyzed
 Mass Analyzers Double Focusing Magnetic Sector Quadrupole Mass Filter Quadrupole Ion Trap Linear Time-of-Flight (TOF) Reflectron TOF Fourier Transform Ion Cyclotron Resonance (FT-ICR-MS) Mass Analyzers
MS Goals and Applications. MS Goals and Applications
 MS Goals and Applications 3 Several variations on a theme, three common steps Form gas-phase ions choice of ionization method depends on sample identity and information required Separate ions on basis
Atomic masses. Atomic masses of elements. Atomic masses of isotopes. Nominal and exact atomic masses. Example: CO, N 2 ja C 2 H 4
 High-Resolution Mass spectrometry (HR-MS, HRAM-MS) (FT mass spectrometry) MS that enables identifying elemental compositions (empirical formulas) from accurate m/z data 9.05.2017 1 Atomic masses (atomic
Thermo Scientific LTQ Orbitrap Velos Hybrid FT Mass Spectrometer
 IET International Equipment Trading Ltd. www.ietltd.com Proudly serving laboratories worldwide since 1979 CALL +847.913.0777 for Refurbished & Certified Lab Equipment Thermo Scientific LTQ Orbitrap Velos
Mass Spectrometry. Hyphenated Techniques GC-MS LC-MS and MS-MS
 Mass Spectrometry Hyphenated Techniques GC-MS LC-MS and MS-MS Reasons for Using Chromatography with MS Mixture analysis by MS alone is difficult Fragmentation from ionization (EI or CI) Fragments from
Tendenze nell innovazione della strumentazione in spettrometria di massa:
 Tendenze nell innovazione della strumentazione in spettrometria di massa: Trappola lineare, orbitrap, ion mobility e nuova strumentazione René Magritte La Condition Humaine 1 Ion Trap Mass Spectrometry
Mass Spectrometry. What is Mass Spectrometry?
 Mass Spectrometry What is Mass Spectrometry? Mass Spectrometry (MS): The generation of gaseous ions from a sample, separation of these ions by mass-to-charge ratio, and measurement of relative abundance
1. The range of frequencies that a measurement is sensitive to is called the frequency
 CHEM 3 Name Exam 1 Fall 014 Complete these problems on separate paper and staple it to this sheet when you are finished. Please initial each sheet as well. Clearly mark your answers. YOU MUST SHOW YOUR
Chemistry 311: Topic 3 - Mass Spectrometry
 Mass Spectroscopy: A technique used to measure the mass-to-charge ratio of molecules and atoms. Often characteristic ions produced by an induced unimolecular dissociation of a molecule are measured. These
Chemistry Instrumental Analysis Lecture 37. Chem 4631
 Chemistry 4631 Instrumental Analysis Lecture 37 Most analytes separated by HPLC are thermally stable and non-volatile (liquids) (unlike in GC) so not ionized easily by EI or CI techniques. MS must be at
MS/MS .LQGVRI0606([SHULPHQWV
 0DVV6SHFWURPHWHUV Tandem Mass Spectrometry (MS/MS) :KDWLV0606" Mass spectrometers are commonly combined with separation devices such as gas chromatographs (GC) and liquid chromatographs (LC). The GC or
M M e M M H M M H. Ion Sources
 Ion Sources Overview of Various Ion Sources After introducing samples into a mass spectrometer, the next important step is the conversion of neutral molecules or compounds to gas phase ions. The ions could
GRADUATE COURSE IN MASS SPECTROMETRY: LECTURE 2
 DEPARTMENTS OF CHEMISTRY AND BIOCHEMISTRY GRADUATE COURSE IN MASS SPECTROMETRY: LECTURE 2 Mass Analysers Shabaz Mohammed October 20, 2015 High Vacuum System Turbo pumps Diffusion pumps Rough pumps Rotary
Mass spectrometry gas phase transfer and instrumentation
 Objectives of the Lecture spectrometry gas phase transfer and instrumentation Matt Renfrow January 15, 2014 1. Make ions 2. Separate/Analyze 3. Detect ions 4. What is mass resolution and mass accuracy?
Analysis of Polar Metabolites using Mass Spectrometry
 Analysis of Polar Metabolites using Mass Spectrometry TransMed Course: Basics in Clinical Proteomics and Metabolomics. Oct 10-19, 2012 dd.mm.yyyy Vidya Velagapudi, Ph.D, Adjunct Professor Head of the Metabolomics
Identification of Human Hemoglobin Protein Variants Using Electrospray Ionization-Electron Transfer Dissociation Mass Spectrometry
 Identification of Human Hemoglobin Protein Variants Using Electrospray Ionization-Electron Transfer Dissociation Mass Spectrometry Jonathan Williams Waters Corporation, Milford, MA, USA A P P L I C AT
Computational Methods for Mass Spectrometry Proteomics
 Computational Methods for Mass Spectrometry Proteomics Eidhammer, Ingvar ISBN-13: 9780470512975 Table of Contents Preface. Acknowledgements. 1 Protein, Proteome, and Proteomics. 1.1 Primary goals for studying
Week 5: Fourier Tranform-based Mass Analyzers: FT-ICR and Orbitrap
 Week 5: Fourier Tranform-based Mass Analyzers: FT-ICR and Orbitrap 1 Last Time Mass Analyzers; CAD and TOF mass analyzers: 2 Fourier Transforms A transform is when you change your analytical space without
MS Goals and Applications. MS Goals and Applications
 MS Goals and Applications 1 Several variations on a theme, three common steps Form gas-phase ions choice of ionization method depends on sample identity and information required Separate ions on basis
20.2 Ion Sources. ions electrospray uses evaporation of a charged liquid stream to transfer high molecular mass compounds into the gas phase as MH n
 20.2 Ion Sources electron ionization produces an M + ion and extensive fragmentation chemical ionization produces an M +, MH +, M +, or M - ion with minimal fragmentation MALDI uses laser ablation to transfer
Lecture 15: Introduction to mass spectrometry-i
 Lecture 15: Introduction to mass spectrometry-i Mass spectrometry (MS) is an analytical technique that measures the mass/charge ratio of charged particles in vacuum. Mass spectrometry can determine masse/charge
Instrumental Analysis. Mass Spectrometry. Lecturer:! Somsak Sirichai
 303351 Instrumental Analysis Mass Spectrometry Lecturer:! Somsak Sirichai Mass Spectrometry What is Mass spectrometry (MS)? An analytic method that employs ionization and mass analysis of compounds in
Fourier Transform Ion Cyclotron Resonance Mass Spectrometry (FT-ICR-MS)
") Fourier Transform Ion Cyclotron Resonance Mass Spectrometry (FT-ICR-MS) The first steps along the way to FT- ICR-MS date back to the 1930s, when Ernest Lawrence, at the University of California - Berkeley,
Fourier Transform Ion Cyclotron Resonance Mass Spectrometry (FT-ICR-MS) The first steps along the way to FT- ICR-MS date back to the 1930s, when Ernest Lawrence, at the University of California - Berkeley,
Chemistry Instrumental Analysis Lecture 34. Chem 4631
 Chemistry 4631 Instrumental Analysis Lecture 34 From molecular to elemental analysis there are three major techniques used for elemental analysis: Optical spectrometry Mass spectrometry X-ray spectrometry
CEE 772 Lecture #27 12/10/2014. CEE 772: Instrumental Methods in Environmental Analysis
 Updated: 10 December 2014 Print version CEE 772: Instrumental Methods in Environmental Analysis Lecture #21 Mass Spectrometry: Mass Filters & Spectrometers (Skoog, Chapt. 20, pp.511 524) (Harris, Chapt.
CEE 772: Instrumental Methods in Environmental Analysis
 Updated: 10 December 2014 Print version CEE 772: Instrumental Methods in Environmental Analysis Lecture #21 Mass Spectrometry: Mass Filters & Spectrometers (Skoog, Chapt. 20, pp.511-524) (Harris, Chapt.
This is the total charge on an ion divided by the elementary charge (e).
.") 12.2 Fundamentals and general terms Accelerator mass spectrometry An ultra-sensitive technique using tandem accelerators employed mainly for the study of long-lived radioisotopes, and stable isotopes at
12.2 Fundamentals and general terms Accelerator mass spectrometry An ultra-sensitive technique using tandem accelerators employed mainly for the study of long-lived radioisotopes, and stable isotopes at
Chemistry Instrumental Analysis Lecture 35. Chem 4631
 Chemistry 4631 Instrumental Analysis Lecture 35 Principle components: Inlet Ion source Mass analyzer Ion transducer Pumps Signal processor Mass analyzers Quadrupole Time of Flight Double Focusing Ion
LECTURE-11. Hybrid MS Configurations HANDOUT. As discussed in our previous lecture, mass spectrometry is by far the most versatile
 LECTURE-11 Hybrid MS Configurations HANDOUT PREAMBLE As discussed in our previous lecture, mass spectrometry is by far the most versatile technique used in proteomics. We had also discussed some of the
Ionization Techniques Part IV
 Ionization Techniques Part IV CU- Boulder CHEM 5181 Mass Spectrometry & Chromatography Presented by Prof. Jose L. Jimenez High Vacuum MS Interpretation Lectures Sample Inlet Ion Source Mass Analyzer Detector
Proudly serving laboratories worldwide since 1979 CALL for Refurbished & Certified Lab Equipment
 www.ietltd.com Proudly serving laboratories worldwide since 1979 CALL +1.847.913.0777 for Refurbished & Certified Lab Equipment Applied Biosystems QStar Pulsar i Features of the API QSTAR Pulsar i The
LC-MS Based Metabolomics
 LC-MS Based Metabolomics Analysing the METABOLOME 1. Metabolite Extraction 2. Metabolite detection (with or without separation) 3. Data analysis Metabolite Detection GC-MS: Naturally volatile or made volatile
Introduction to LC-MS
 Wednesday April 5, 2017 10am Introduction to LC-MS Amy Patton, MS Laboratory Manager, Pinpoint Testing, LLC Little Rock, AR DESCRIPTION: Amy Patton, laboratory manager for Pinpoint Testing, will begin
Harris: Quantitative Chemical Analysis, Eight Edition
 Harris: Quantitative Chemical Analysis, Eight Edition CHAPTER 21: MASS SPECTROMETRY CHAPTER 21: Opener 21.0 Mass Spectrometry Mass Spectrometry provides information about 1) The elemental composition of
Mass Spectrometry. Electron Ionization and Chemical Ionization
 Mass Spectrometry Electron Ionization and Chemical Ionization Mass Spectrometer All Instruments Have: 1. Sample Inlet 2. Ion Source 3. Mass Analyzer 4. Detector 5. Data System http://www.asms.org Ionization
MASS SPECTROMETRY. Topics
 MASS SPECTROMETRY MALDI-TOF AND ESI-MS Topics Principle of Mass Spectrometry MALDI-TOF Determination of Mw of Proteins Structural Information by MS: Primary Sequence of a Protein 1 A. Principles Ionization:
LIQUID CHROMATOGRAPHY-MASS SPECTROMETRY (LC/MS) Presented by: Dr. T. Nageswara Rao M.Pharm PhD KTPC
 Presented by: Dr. T. Nageswara Rao M.Pharm PhD KTPC") LIQUID CHROMATOGRAPHY-MASS SPECTROMETRY (LC/MS) Presented by: Dr. T. Nageswara Rao M.Pharm PhD KTPC INTRODUCTION Principle: LC/MS is a technique that combines physical separation capabilities of liquid
LIQUID CHROMATOGRAPHY-MASS SPECTROMETRY (LC/MS) Presented by: Dr. T. Nageswara Rao M.Pharm PhD KTPC INTRODUCTION Principle: LC/MS is a technique that combines physical separation capabilities of liquid
Tandem MS = MS / MS. ESI-MS give information on the mass of a molecule but none on the structure
 Tandem MS = MS / MS ESI-MS give information on the mass of a molecule but none on the structure In tandem MS (MSMS) (pseudo-)molecular ions are selected in MS1 and fragmented by collision with gas. collision
Accurate, High-Throughput Protein Identification Using the Q TRAP LC/MS/MS System and Pro ID Software
 www.ietltd.com Proudly serving laboratories worldwide since 1979 CALL +1.847.913.0777 for Refurbished & Certified Lab Equipment ABI Q Trap Pro LC/MS/MS Accurate, High-Throughput Protein Identification
Mass Spectrometry in MCAL
 Mass Spectrometry in MCAL Two systems: GC-MS, LC-MS GC seperates small, volatile, non-polar material MS is detection devise (Agilent 320-MS TQ Mass Spectrometer) Full scan monitoring SIM single ion monitoring
Interazioni di ioni con elettroni (ECD, ETD) e fotoni (Ion spectroscopy) Gianluca Giorgi. via Aldo Moro Siena
 e fotoni (Ion spectroscopy) Gianluca Giorgi. via Aldo Moro Siena") Interazioni di ioni con elettroni (ECD, ETD) e fotoni (Ion spectroscopy) Gianluca Giorgi Università degli Studi di Siena Dipartimento di Biotecnologie, Chimica e Farmacia via Aldo Moro 53100 Siena e-mail:
Interazioni di ioni con elettroni (ECD, ETD) e fotoni (Ion spectroscopy) Gianluca Giorgi Università degli Studi di Siena Dipartimento di Biotecnologie, Chimica e Farmacia via Aldo Moro 53100 Siena e-mail:
Mass spectrometry of proteins, peptides and other analytes: principles and principal methods. Matt Renfrow January 11, 2008
 Mass spectrometry of proteins, peptides and other analytes: principles and principal methods Matt Renfrow January 11, 2008 Objectives of the Lecture 1. Make ions 2. Separate/Analyze/Detect ions 3. What
Mass Spectroscopy. Base peak. Molecular Ion peak. The positively charged fragments produced are separated, based on their mass/charge (m/z) ratio. M+.
 ratio. M+.") Mass spectrometry is the study of systems causing the formation of gaseous ions, with or without fragmentation, which are then characteried by their mass to charge ratios (m/) and relative abundances.
Mass spectrometry is the study of systems causing the formation of gaseous ions, with or without fragmentation, which are then characteried by their mass to charge ratios (m/) and relative abundances.
Powerful Scan Modes of QTRAP System Technology
 Powerful Scan Modes of QTRAP System Technology Unique Hybrid Triple Quadrupole Linear Ion Trap Technology Provides Powerful Workflows to Answer Complex Questions with No Compromises While there are many
Auxiliary Techniques Soft ionization methods
 Auxiliary Techniques The limitations of the structural information in the normal mass spectrum can be partly offset by special mass-spectral techniques. Although a complete description of these is beyond
Ion traps. Quadrupole (3D) traps. Linear traps
 traps. Linear traps") Ion traps Quadrupole (3D) traps Linear traps 3D-Ion traps A 3D-ion trap can be considered the tridimensional analogue of the linear quadrupole mass analyzer: B A C D The central ring electrode of the 3D-ion
Ion traps Quadrupole (3D) traps Linear traps 3D-Ion traps A 3D-ion trap can be considered the tridimensional analogue of the linear quadrupole mass analyzer: B A C D The central ring electrode of the 3D-ion
Ion trap. 3D Quadrupole Trap. -Mass spectrometer -Ion trap (Quadrupol Ion Storage, Quistor) 18. April
 18. April") Ion trap 3D Quadrupole Trap -Mass spectrometer -Ion trap (Quadrupol Ion Storage, Quistor) 18. April 011 1 The trajectories of the ions can be given: They form Mathieu differential equations: with r + Ion
Ion trap 3D Quadrupole Trap -Mass spectrometer -Ion trap (Quadrupol Ion Storage, Quistor) 18. April 011 1 The trajectories of the ions can be given: They form Mathieu differential equations: with r + Ion
Molecular Mass Spectrometry
 Molecular Mass Spectrometry Mass Spectrometry: capable of providing information about (1) Elemental composition of samples of matter: atomic mass (2) Structures of inorganic, organic, and biological molecules
The 4-Source Ion Trap
 Introduction ur research program is devoted to the study of gaseous macro-ions applied within the context of mass spectrometry to challenging analysis prolems. ur work involves instrument development,
Electron Transfer Dissociation of N-linked Glycopeptides from a Recombinant mab Using SYNAPT G2-S HDMS
 Electron Transfer Dissociation of N-linked Glycopeptides from a Recombinant mab Using SYNAPT G2-S HDMS Jonathan P. Williams, Jeffery M. Brown, Stephane Houel, Ying Qing Yu, and Weibin Chen Waters Corporation,
Choosing the metabolomics platform
 GBS 748 Choosing the metabolomics platform Stephen Barnes, PhD 4 7117; sbarnes@uab.edu So, I have my samples what s next? You ve collected your samples and you may have extracted them Protein precipitation
CHAPTER D4 ORTHOGONAL TIME OF FLIGHT OPTICS
 Back to Basics Section D: Ion Optics CHAPTER D4 ORTHOGONAL TIME OF FLIGHT OPTICS TABLE OF CONTENTS QuickGuide...413 Summary...415 Introduction...417 The physical basis of orthogonal TOF....... 419 Pulsedmainbeamsofions...421
Thermo Finnigan LTQ. Specifications
 IET International Equipment Trading Ltd. www.ietltd.com Proudly serving laboratories worldwide since 1979 CALL +847.913.0777 for Refurbished & Certified Lab Equipment Thermo Finnigan LTQ Specifications
Mass Analyzers. Ion Trap, FTICR, Orbitrap. CU- Boulder CHEM 5181: Mass Spectrometry & Chromatography. Prof. Jose-Luis Jimenez
 Mass Analyzers Ion Trap, FTICR, Orbitrap CU- Boulder CHEM 5181: Mass Spectrometry & Chromatography Prof. Jose-Luis Jimenez Last Update: Oct. 014 Some slides from Dr. Joel Kimmel (007) MS Interpretation
Mass spectrometry has been used a lot in biology since the late 1950 s. However it really came into play in the late 1980 s once methods were
 Mass spectrometry has been used a lot in biology since the late 1950 s. However it really came into play in the late 1980 s once methods were developed to allow the analysis of large intact (bigger than
What is a mass spectrum?
 EMBnet course 28.1.-1.2.28 Day 1 Mass spectrometry in proteomics Outline Mass spectrometry, general introduction What is a mass spectrum What are the constituents of a mass spectrometer How the instruments
Quattro Micro - How does it work?
 Quattro Micro - How does it work? 1 Introduction This document is designed to familiarise you with the principles behind how the Quattro Micro works. The level of this document is designed as Level One
Mass Spectrometry. Quantitative Mass Spectrometry Chiral Mass Spectrometry
 Mass Spectrometry Quantitative Mass Spectrometry Chiral Mass Spectrometry Quantitation by MS Goal is to develop methodology to sensitively, specifically, accurately and rapidly measure one or more compounds
Chemical Aspects of Mass Spectrometry
 Chemical Aspects of Mass Spectrometry Abraham Badu Chemistry and Biochemistry, OSU July 12, 217 Spread of MS by Discipline https://masspec.scripps.edu/ mass spectrometry 2 1 Current Challenges in Mass
Finnigan LCQ Advantage MAX
 www.ietltd.com Proudly serving laboratories worldwide since 1979 CALL +847.913.0777 for Refurbished & Certified Lab Equipment Finnigan LCQ Advantage MAX The Finnigan LCQ Advantage MAX ion trap mass spectrometer
Chapter 5. Complexation of Tholins by 18-crown-6:
 5-1 Chapter 5. Complexation of Tholins by 18-crown-6: Identification of Primary Amines 5.1. Introduction Electrospray ionization (ESI) is an excellent technique for the ionization of complex mixtures,
CHROMATOGRAPHY AND MASS SPECTROMETER
 22 CHROMATOGRAPHY AND MASS SPECTROMETER 22.1 INTRODUCTION We know that the biochemistry or biological chemistry deals with the study of molecules present in organisms. These molecules are called as biomolecules
Mass Selective Ejection by Axial Resonant Excitation from a Linear Ion Trap
 Mass Selective Ejection by Axial Resonant Excitation from a Linear Ion Trap Yuichiro Hashimoto, Hideki Hasegawa, Takashi Baba, and Izumi Waki Central Research Laboratory, Hitachi, Ld., Tokyo, Japan We
Chem 550, Spring, 2012 Part I: OVERVIEW OF MASS SPECTROMETRY:
 Chem 550, Spring, 2012 Part I: OVERVIEW OF MASS SPECTROMETRY: I. BASIC ELEMENTS OF A MASS SPECTROMETER Inlet System or Chromatograph Ion Source Mass Analyzer Detector Computer II. ION SOURCES A. Electron
LECTURE-13. Peptide Mass Fingerprinting HANDOUT. Mass spectrometry is an indispensable tool for qualitative and quantitative analysis of
 LECTURE-13 Peptide Mass Fingerprinting HANDOUT PREAMBLE Mass spectrometry is an indispensable tool for qualitative and quantitative analysis of proteins, drugs and many biological moieties to elucidate
Selecting an LC/MS Interface Becky Wittrig, Ph.D.
 Selecting an LC/MS Interface Becky Wittrig, Ph.D. RESTEK CORPORATION LC/MS Interfaces I. Background of LC/MS I. Historical Perspective II. Reasons for use II. Interfaces I. Transport devices II. Particle
Traditional Herbal Medicine Structural Elucidation using SYNAPT HDMS
 Traditional Herbal Medicine Structural Elucidation using SYNAPT HDMS with Time-Aligned Parallel (TAP) Fragmentation Kate Yu, Jose Castro-Perez, and John Shockcor Waters Corporation, Milford, MA, U.S. INTRODUCTION
Mass Spectrometry for Chemists and Biochemists
 Erasmus Intensive Program SYNAPS Univ. of Crete - Summer 2007 Mass Spectrometry for Chemists and Biochemists Spiros A. Pergantis Assistant Professor of Analytical Chemistry Department of Chemistry University
Mass spectrometry.
 Mass spectrometry Mass spectrometry provides qualitative and quantitative information about the atomic and molecular composition of inorganic and organic materials. The mass spectrometer produces charged
Thermo Fisher Scientific, San Jose, CA; 2 Kelleher Lab, Northwestern University, Evanston, IL; 3
 Second-Generation Electron Transfer Dissociation (ETD) on the Thermo Scientific Orbitrap Fusion Mass Spectrometer with Improved Functionality, Increased Speed, Christopher Mullen, 1 Lee Earley, 1 Jean-Jacques
Mass Spectrometry. A truly interdisciplinary and versatile analytical method
 Mass Spectrometry A truly interdisciplinary and versatile analytical method MS is used for the characterization of molecules ranging from small inorganic and organic molecules to polymers and proteins.
Mass Spectrometry. General Principles
 General Principles Mass Spectrometer: Converts molecules to ions Separates ions (usually positively charged) on the basis of their mass/charge (m/z) ratio Quantifies how many units of each ion are formed
Mass Spectrometry: Introduction
 Mass Spectrometry: Introduction Chem 8361/4361: Interpretation of Organic Spectra 2009 Andrew Harned & Regents of the University of Minnesota Varying More Mass Spectrometry NOT part of electromagnetic
Mass spectrometry: forming ions, to identifying proteins and their modifications Stephen Barnes, PhD
 Mass spectrometry: forming ions, to identifying proteins and their modifications Stephen Barnes, PhD 4-7117 sbarnes@uab.edu Introduction to mass spectrometry Class 1 - Biology and mass spectrometry Why
Courtesy of ESS and TheRGA web pages part of a series of application and theory notes for public use which are provided free of charge by ESS.
 ESS The RGA freenotes Theory page 1 of 14 RGA Theory Notes Courtesy of ESS and TheRGA web pages part of a series of application and theory notes for public use which are provided free of charge by ESS.
Mass spectrometry: forming ions, to identifying proteins and their modifications Stephen Barnes, PhD
 Mass spectrometry: forming ions, to identifying proteins and their modifications Stephen Barnes, PhD 4-7117 sbarnes@uab.edu Introduction to mass spectrometry Class 1 - Biology and mass spectrometry Why
BST 226 Statistical Methods for Bioinformatics David M. Rocke. January 22, 2014 BST 226 Statistical Methods for Bioinformatics 1
 BST 226 Statistical Methods for Bioinformatics David M. Rocke January 22, 2014 BST 226 Statistical Methods for Bioinformatics 1 Mass Spectrometry Mass spectrometry (mass spec, MS) comprises a set of instrumental
Analytical Technologies in Biotechnology Prof. Dr. Ashwani K. Sharma Department of Biotechnology Indian Institute of Technology, Roorkee
 Analytical Technologies in Biotechnology Prof. Dr. Ashwani K. Sharma Department of Biotechnology Indian Institute of Technology, Roorkee Module - 6 Spectroscopic Techniques Lecture - 6 Atomic Spectroscopy
Development of ion mobility mass spectrometry coupled with ion/ion reactions:
 Graduate Theses and Dissertations Graduate College 2009 Development of ion mobility mass spectrometry coupled with ion/ion reactions: Qin Zhao Iowa State University Follow this and additional works at:
Chapter 1. Introduction
 Chapter 1. Introduction 1-1 1.1. Overview In the past twenty years, charged droplets and strong electric fields have quietly revolutionized chemistry. In combination with an atmospheric-sampling mass spectrometer,
De Novo Metabolite Chemical Structure Determination. Paul R. West Ph.D. Stemina Biomarker Discovery, Inc.
 De Novo Metabolite Chemical Structure Determination Paul R. West Ph.D. Stemina Biomarker Discovery, Inc. As a part of non targeted metabolomic analysis, when peaks in the mass spectra are thought to be
Protein analysis using mass spectrometry
 Protein analysis using mass spectrometry Michael Stadlmeier 2017/12/18 Literature http://www.carellgroup.de/teaching/master 3 What is Proteomics? The proteome is: the entire set of proteins in a given
Mass spectrometry and elemental analysis
 Mass spectrometry and elemental analysis A schematic representation of a single-focusing mass spectrometer with an electron-impact (EI) ionization source. M: + e _ M +. + 2e _ Ionization and fragmentation
Molecular Mass Spectrometry
 Molecular Mass Spectrometry Mass Spectrometry: capable of providing information about (1) Elemental composition of samples of matter: atomic mass (2) Structures of inorganic, organic, and biological molecules
CHAPTER D3 TOF ION OPTICS
 Back to Basics Section D: Ion Optics CHAPTER D3 TOF ION OPTICS TABLE OF CONTENTS QuickGuide...399 Summary...401 Background...403 EquationsofMotionofIons...403 Resolution...405 Reflectron...407 Comparison
Mass Spectrometry (MS)
") Mass Spectrometry (MS) Alternative names: Mass spectrometric (selective) detector (MSD) Spectrometry - methods based on interaction of matter and radiation Mass spectrometry - method based on formation
Mass Spectrometry (MS) Alternative names: Mass spectrometric (selective) detector (MSD) Spectrometry - methods based on interaction of matter and radiation Mass spectrometry - method based on formation
Introduction to GC/MS
 Why Mass Spectrometry? Introduction to GC/MS A powerful analytical technique used to: 1.Identify unknown compounds 2. Quantify known materials down to trace levels 3. Elucidate the structure of molecules
BIOINF 4120 Bioinformatics 2 - Structures and Systems - Oliver Kohlbacher Summer Systems Biology Exp. Methods
 BIOINF 4120 Bioinformatics 2 - Structures and Systems - Oliver Kohlbacher Summer 2013 14. Systems Biology Exp. Methods Overview Transcriptomics Basics of microarrays Comparative analysis Interactomics: