IMA Metrology WG. Version 1. Date: April 2015
|
|
|
- Cameron Terry
- 5 years ago
- Views:
Transcription
1 IMA Metrology WG Version 1 Date: April 2015 Guidance for industrial minerals on the implementation of the European Commission recommendation of 18 October 2011 on the definition of nanomaterial (2011/696/EU) 1/27
2 2/27
3 Contents Page Foreword... 4 Introduction Scope Normative references Terms and definitions Techniques for evaluation Method for the implementation of the EC recommended definition of nanomaterial on bulk materials... 7 Annexes A- Evaluation techniques identified as not applicable for the quantitative determination of nanomaterials in industrial minerals B - Detailed description of number particle size distribution C - Dispersion conditions for quartz and cristobalite products D - Dispersion conditions for Kaolins and Kaolinitic Clays E - Dispersion conditions for other Minerals which may be treated in a similar way to Kaolins / Kaolinitic Clays F - Dispersion conditions for Diatomaceous Earth (DE) G- Dispersion conditions for feldspar products H - Dispersion conditions for Calcium carbonate I - Dispersion conditions for Lime J - Dispersion conditions for Bentonite (option A) K - Dispersion conditions for Bentonite (option B) /27
4 Foreword This document has been prepared by the Industrial Minerals Association, IMA-Europe ( 4/27
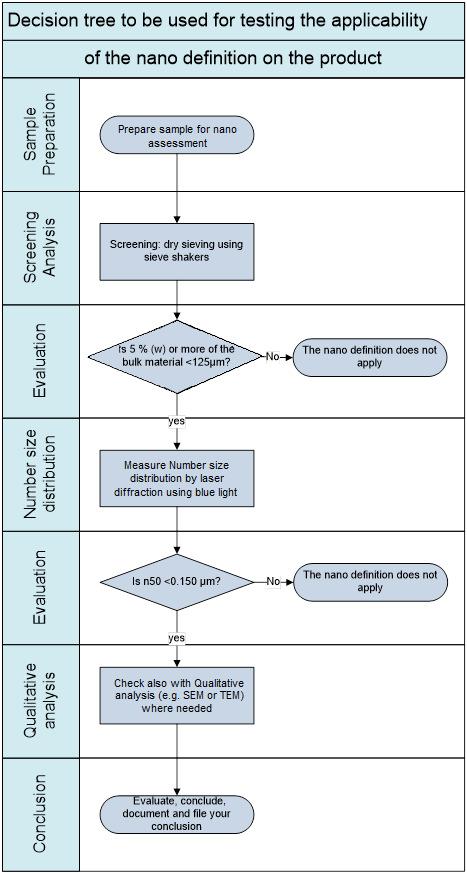
5 Introduction This guidance describes in a standardised way the procedure to determine whether industrial minerals fall under the European Commission recommendation of 18 October 2011 on the definition of nanomaterial (2011/696/EU). According to this definition, nanomaterial means a natural, incidental or manufactured material containing particles, in an unbound state or as an aggregate or as an agglomerate and where, for 50 % or more of the particles in the number size distribution, one or more external dimensions is in the size range 1nm-100 nm. Evaluating bulk materials using this guidance will help to identify if the material needs to be considered as a nanomaterial. At this stage, the guidance is designed mainly for minerals not intentionally manufactured in the nano range. The result of the test will help to check compliance with the EC definition of nanomaterials and with some (national) laws. This guidance describes techniques like dry sieving with a shaking table, laser diffraction and electron microscopy. These techniques can be used in combination for evaluation. The results cannot be used for the evaluation of exposure to nanomaterials at the workplace. 5/27
6 1 Scope This guidance specifies techniques which can be used for the evaluation of bulk materials considering the European Commission (EC) recommendation of 18 October 2011 on the definition of nanomaterial. It gives the ability to decide whether or not an industrial mineral falls under the scope of the EC definition. The described techniques will help expressing the relative content of particles in bulk materials that, based on the number particle size distribution, should be considered as nanomaterials. At this stage, the guidance is designed mainly for minerals not intentionally manufactured in the nano range. 2 Normative references ISO : 2001 Determination of particle size distribution by gravitational liquid sedimentation methods Part 1: General principles and guidelines. ISO : 2001 Determination of particle size distribution by gravitational liquid sedimentation methods Part 2: Fixed pipette method ISO 14887: 2000 Sample preparation Dispersing procedures for powders in liquids ISO 29301: 2010 Microbeam analysis analytical transmission electron microscopy methods for calibrating image magnification by using reference materials having periodic structures ISO to -6: Representation of results of particle size analysis ISO 13320: 2009 Particle Size analysis laser diffraction methods ISO/DIS : 2014 Test Sieves Technical requirements and testing Part 1: Test sieves of metal wire cloth ISO 565: 1990 Test sieves; metal wire cloth, perforated metal plate and electroformed sheet; nominal sizes of openings ISO : 1988 Test sieving Methods using test sieves of woven wire cloth and perforated metal plate 3 Terms and definitions In this industry guidance, the terms and definitions given in the EC recommendation of 18 October 2011 on the definition of nanomaterial apply. nanomaterial means a natural, incidental or manufactured material containing particles, in an unbound state or as an aggregate or as an agglomerate and where, for 50 % or more of the particles in the number size distribution, one or more external dimensions is in the size range 1nm-100 nm. See annex B for a detailed description of the term number size distribution. 6/27
7 4 Techniques for evaluation Annex A contains a list of techniques not to use. 4.1 Screening of coarse and medium sized products by sieving In fine products, the potential occurring nanoparticles can be measured with modern laser diffraction devices (cf. chapter 4.2 and 5.2). Since even coarse and medium sized products can possibly contain nano sized particles in their fines, an easy and quick investigation by sieving with a sieving machine is recommended. The main purposes of this sieving is to: 1) Check if there is a relevant content of fine fraction which could possibly contain nanoparticles 2) Separate the fine fraction for further analysis by laser diffraction and by electron microscopy (SEM/TEM). 4.2 Technical requirements to determine the number size distribution by laser diffraction using blue light source Characterise the particle size distribution as best as possible with currently available equipment. The best equipment should have the shortest wavelength available (currently known as blue source). To cover the whole size distribution range, equipment is required which employs both short (around 400 nm) and long (around 700 nm) wavelengths. To determine the number size distribution, including small particles in the nano range, the instrument should be equipped with a light source (e.g. blue laser or light emitting diode (LED)) with sufficient wavelength and the range of analysis of the equipment should extend to below 0.1 µm. Care should be taken on the preparation of the sample and the dispersion conditions of the material which are described in the annexes C to K for each mineral. The particle size analysis by laser diffraction is well described in the standard ISO 13320: Electron Microscopy Scanning Electron Microscopy (SEM) or Transmission Electron Microscopy (TEM) can be used to visualize the particle size, shape and agglomeration/aggregation status. Although electron microscopy is a very useful visualisation tool, it is not suitable for fully quantitative particle size measurement of particulate material with broad size distribution (above 3-4 orders of magnitude). 5 Method for the implementation of the EC recommended definition of nanomaterial on bulk materials To determine if certain materials will need further investigation for the implementation of the EC recommended definition of nanomaterial, the first step consists of a screening of the material by sieving. Following internal investigations within IMA-Europe on a wide range of powders from the mineral industry, it has been concluded that if less than 5 mass % of the bulk material is below 125 µm, the material does not need further investigation. If this is not the case, the material will be measured by laser diffraction and complementary qualitative information from electron microscopy to evaluate if the definition applies to the material. 7/27
8 8/27
9 For micronised materials with a d97 below 125 µm, clause 5.1 is not applicable and clause 5.2 directly applies. 5.1 Screening by sieving: separation of the fine fraction The used sieving procedure depends on the kind of product analysed and its grain size distribution. As lower limit for sieving, a nominal size of mm is recommended since it is a common mesh size in the mineral industries to determine fines. If there is a relevant fine fraction for the nanomaterial, the passing fraction will be of sufficient quantity to be easily handled for further investigation by laser diffraction and SEM/TEM. Coarse products (> 4mm) In the case of some coarse products it may be necessary to split the very coarse part from the finer fraction (by hand sieving) before further sieving with a sieve machine. By doing so, the fine fraction will be enriched and a better statistical evaluation can be achieved. Medium size particles (0.2-4mm) For products with a particle size distribution from 0.2 to 4 mm, usually a one-step sieving with a dry sieve machine is sufficient. Usually the material should be in a dry and flowable condition for analysis. The dry-sieve screening is performed by the use of a (vibratory) sieve shaker. If you dispose of a reliable standard operation procedure (SOP) to estimate and select the passing of a mm sieve, you can use your SOP. If this is not the case, a general procedure for dry-sieve screening using a (vibratory) sieve shaker is described below for guidance (cf. ISO ): Selection of test sieves Select a set of test sieves with mesh size between mm and the maximum grain size of the material. The number of sieves used in the test should be sufficient to split the sample in a way that the permitted maximum volume after sieving is not exceeded. The mesh sizes should follow ISO 565. Use a dry sieve pan (without an outlet) to collect the fines (< mm) for further investigation. A dry sieving head should also be used to avoid sample loss on the top sieve. Determination of the initial weights of the bulk material The acceptable initial weight of the bulk material depends on the range of grain sizes and the bulk density of the material. If this is not known from previous examinations, the initial weight of charge has to be estimated in a pre-test. The advised restrictions of ISO are listed in the table below. Nominal aperture size Bulk volume of material Approximate volume of charge Maximum volume of residue Nominal aperture size Bulk volume of material Approximate volume of charge Maximum volume of residue [mm] [cm 3 ] [cm 3 ] [mm] [cm 3 ] [cm 3 ] Table 1: Guide to quantify the material for test sieving on a 200 mm diameter round sieve. The masses of materials can be determined by multiplying the specified volume values by the apparent bulk density, in grams per cubic centimetre, of the material to be sieved (ISO :1988). 9/27
10 Sieving time The sieving time has to be estimated by a pre-test and is defined by the sieving endpoint. The dry sieving endpoint for non-friable materials is reached when the passing through the sieve(s) in 1 minute is less than 1% by weight. To shorten the sieving time, sieving aids can be placed in every sieve with mesh sizes larger than 125µm. During sieving, the balls impact on the sieved and accelerate the removal of the substance being sieved. The following can be used as sieving aid: Agate balls: 10 mm Ø: 10 balls per sieve, or Rubber balls: 20 mm Ø: 5 balls per sieve Amplitude of vibratory sieving The adjustable amplitudes of vibratory sieve machines usually range from 0 up to 3 mm. To achieve the target amplitude of 3 mm (full amplitude), at least 3 sieves in addition to the collecting vessel and a sieve cover must be fastened to the sieve shaker. If fewer sieves are used, it may not be possible to achieve the target amplitude of 3 mm (full amplitude). In this case, the regulation of the sieve shaker can no longer attain the optimal operating point; the sieve shaker will vibrates at a lower amplitude and frequency. The target amplitude must in this case be lowered accordingly. Once the machine has warmed up, the target value can under some circumstances be increased accordingly. Typical values of sieving parameters estimated by the above mentioned guidance are listed in Table 2. Product type Coarse Medium Fine PSD of main fractions 4 to > 100 mm 0.2 to 4 mm < 0.2 mm / 0.18 / 0.25 Set of Sieves 4 / 5.6 / 8 / 16 / / 0.5 / 0.71 / 1 mesh size in mm 31.5 / 45 / 63 / 90 / / 2 / 2.8 / 4 use laser diffraction Initial weight of bulk material > 200 g 50 to 200 g Sieving time 3 to 20 min 5 to 30 min Amplitude 2.5 to 3 1 to 2.5 Table 2: Typical ranges of the above mentioned sieving parameters. The division in coarse, medium and fine follows the classification of T. Allen, 1993 Due to electrostatic and cohesive properties, especially in bulk materials containing a high portion of fines, a wet method can be used for removal of the fines. Afterwards, the fines (< m) of the material have to be collected in a vessel during sieving with a wet-sieving machine or by hand sieving. Fine particles (<0.2 mm) If the product has a maximum grain size below 0.2 mm, it can directly be measured by laser diffraction. Evaluation of sieving If more than 5% by weight of the bulk material is below 125 µm, the separated fine material needs further investigation by laser diffraction (and SEM/TEM). Keep in mind that the result of laser diffraction must be related to the whole bulk material. 5.2 Measuring the number size distribution by laser diffraction The particle size distribution as measured by laser diffraction can be calculated based on several models, most often as a volume/mass but also as a number distribution. The EC recommended definition is expressed in number size distribution which is not commonly used in the mineral industry but can be recalculated out of the volume/mass particle size distribution obtained from laser diffraction assuming that a particle is spherical. The procedure to follow for measuring the number size distribution by laser diffraction using blue LED is described below: 10/27
11 - For sample preparation, optimum dispersion conditions should be taken into account and details are provided in the annexes (C. to K.) for each individual mineral. - Measure the particle size distribution using the ISO 13320: Use the Mie theory: Perform measurements at different particle concentrations to determine the optimal concentration (obscuration) range in order to obtain an acceptable signal-to-noise and to avoid multiple scattering. This concentration must be of maximal 5%. Smaller the particles are, lower the mass concentration (obscuration) must be. In any case the weighted residual must be below 1.5 % Information on the Refractive index can be found in ISO 13320:2009 Annex D - Determine the number size distribution of the material using the software; - Check if the n50 is < 0.150µm. If yes, your material needs further investigation. Go to clause 5.3 for qualitative analysis. - If not, then the material is not considered as falling under the EC recommended definition. NOTE: Although the definition indicates 100 nm, we strongly recommend a cut-off point of around 150 nm as a safety margin for error. NOTE: At this stage, no indication is given on the following parameters of the equipment, but care should be taken that they can influence the results: obscuration level/light intensity, model used for distribution (general or single model), shape of the particles, weighted residual/goodness of fit, pump speed. 5.3 Qualitative analysis by Electron Microscopy (SEM or TEM) Samples come in all types, shapes and sizes. Therefore, techniques have to be found to cope with all variations and deviations from the perfect sample, a naturally conducting regular solid providing high emission of electrons. There are many ways in which a sample can be prepared for electron microscopy. The exact choice of sample preparation would be determined by the type of mineral. The results of the electron microscopy can be used to qualitatively validate the laser diffraction results. 11/27
12 Annexes 12/27
13 A- Evaluation techniques identified as not applicable for the quantitative determination of nanomaterials in industrial minerals Techniques STEM - Scanning Transmission Electron Microscopy TEM - Transmission Electron Microscopy AFM - Atomic Force Microscopy STM - Scanning Tunneling Electron Microscopy FFF - Field Flow Fractionation HDC - Hydrodynamic Chromatography SEC - Size Exclusion Chromatography CFF - Cross-Flow Filtration UC - Ultracentrifugation CFUF - Cross Flow Ultrafiltration SPMS - Single Particle Mass Spectrometry SAXS - Small-Angle X-ray Scattering UCPC - Ultrafine Condensation Particle Counter Comments Limit of detection is <0.1 nm resolution Low concentration at ppm level and is therefore not representative for bulk material Sample preparation (HVac) The technique is not applicable for minerals with a broad size distribution, and not widely available in the mineral industry The technique might be applicable for intentionally manufactured nanomaterials and not for broad particle size distributions like in the mineral industry The technique might be applicable for intentionally manufactured nanomaterials and not for broad particle size distributions like in the mineral industry The technique is restricted to sizes from 1 nm to 1 µm for the Flow FFF, and from 50 nm to 1 µm for Sed FFF and not relevant for broad particle size distributions like in the mineral industry The technique is restricted to sizes from 5 nm to 1200 nm and not relevant for broad particle size distributions like in the mineral industry The technique is widely used for polymer characterisation and is not relevant for minerals The technique is restricted to sizes from 7 nm to 2 µm and not relevant for broad particle size distributions like in the mineral industry This technique is more qualitative than quantitative and does not measure number size distribution. The technique is restricted to sizes from 1 nm to 1 µm and not relevant for broad particle size distributions like in the mineral industry The technique is restricted to sizes from 3 nm to 1 µm and not relevant for broad particle size distributions like in the mineral industry The technique is restricted to sizes from 5-25 nm and not relevant for broad particle size distributions like in the mineral industry The technique is restricted to sizes from 2-10 nm and not relevant for the definition as it is used for measuring exposure at the workplace 13/27
14 XRD SMPS - Single Particle Mass Spectrometry DLS Dynamic Light Scattering DMA - Differential Mobility Analyzer FIFFF - Flow Field-Flow Fractionation This technique is used to determine the crystal structure and is more qualitative than quantitative and cannot be used for number size distribution. Nevertheless, XRD is a standard technique to check whether nanoforms have other diffraction patterns as compared to the bulk material. The technique is restricted to sizes from 3 nm to 1 µm and not relevant for the definition as it is used for measuring exposure at the workplace The technique is not relevant for polydispersed broad particle size distributions like in the mineral industry The technique is not relevant for the definition as it is used for measuring exposure at the workplace The technique is restricted to sizes from 1 nm to 1 µm, is mostly used for environmental and biological samples and is not relevant for minerals 14/27


15 B - Detailed description of number particle size distribution The easiest way to understand a number distribution is to consider measuring particles using a microscope. The observer assigns a size value to each particle inspected. This approach builds a number distribution each particle has equal weighting once the final distribution is calculated. As an example, consider the nine particles shown left in Figure 1. Three particles are 1 μm, three are 2 μm, and three are 3 μm in size (diameter). Building a number distribution for these particles will generate the result shown on the right part of Figure 1, where each particle size accounts for one third of the total. If this same result were converted to a volume distribution, the result would appear as shown in Figure 2 where 75 % of the total volume comes from the 3 μm particles, and less than 3 % comes from the 1 μm particles. Figure 1: Particles of 1, 2, and 3 micron (left) with their Number- and volume distributions (right) When presented as a volume distribution it becomes more obvious that the majority of the total particle mass or volume comes from the 3 μm particles. Nothing changes between the left and right graph except for the basis of the distribution calculation. Another way to visualize the difference between number and volume distributions is supplied by courtesy of the City of San Diego Environmental Laboratory. In this case beans are used as the particle system. Figure 2 shows a population where there are 13 beans in each of three size classes, equal on a number basis. The same figure shows these beans placed in volumetric cylinders where it becomes apparent that the larger beans represent a much larger total volume than the smaller ones. Figure 2: (Click to enlarge) Equivalent number of beans Figure 3 shows a population of beans where it may not be intuitively obvious, but there is an equal volume of each size, despite the wide range of numbers present. It becomes apparent that when the beans are placed in volumetric cylinders that each volumes are equal. 15/27


16 Figure 3: Equivalent volume of beans Transforming Results Results from number based systems, such as microscopes or image analyzers construct their beginning result as a number distribution. Results from laser diffraction construct their beginning result as a volume distribution. The software for many of these systems includes the ability to transform the results from number to volume or vice versa. It is perfectly acceptable to transform image analysis results from a number to volume basis. In fact the pharmaceutical industry has concluded that it prefers results be reported on a volume basis for most applications (ref. 1). On the other hand, converting a volume result from laser diffraction to a number basis can lead to undefined errors and is only suggested when comparing to results generated by microscopy. Figure 4 below shows an example where a laser diffraction result is transformed from volume to both a number and a surface area based distribution. Notice the large change in median from μm to 0.30 μm when converted from volume to number. Figure 4: A volume distribution converted to area and number will include conversion errors Source for Annex B: 16/27
17 C - Dispersion conditions for quartz and cristobalite products C.1 Scope This instruction applies to quartz and cristobalite products to prepare the sample for laser diffraction. C.2 Equipment Standard laboratory glassware and the following supplies: 1) Glass beaker 2) Demineralised (deionised) water 3) Analytical balance with an accuracy of grams 4) Ultrasonic bath or shaker. 5) Dispersant or deflocculant, when required C.3 Preparation of the sample The following steps should be executed to achieve optimum dispersion conditions of a sample: 1) Take a sample of the material of approx. 5.0 g. 2) Determine the weight M of the sample with a precision of g. 3) Disperse the sample in 50 ml of sedimentation liquid in a 100 ml pre-weighed, dry and clean beaker. The weight of the beaker should also be determined with a precision of g. 4) Treat the sample in an ultrasonic bath or a shaker until completely deagglomerated. 5) If necessary, add a suitable dispersant or deflocculant to keep the particles from flocculating or coagulating. 6) When using a dispersant or deflocculant this should be clearly identified in your report on the results. C.4 Particle Size Distribution Use this prepared sample to measure the Particle Size Distribution with Laser diffraction capable to identify nano particles, using your standard operation procedure (SOP). Mie parameters: Real part (n p) Imaginary part (k p) Quartz Cristobalite When using a different strategy of sample preparation, this should be clearly identified in your report on the results. 17/27
18 D - Dispersion conditions for Kaolins and Kaolinitic Clays D.1 Scope This instruction applies to most kaolins and kaolinitic clays and may be adapted for other coarse to fine-grained materials for which water is generally a good medium for separation by sedimentation. Water is a suitable separation medium provided the following conditions are met: The particles in the sample must be completely de-agglomerated The particles in the sample should not dissolve, swell or disintegrate The particles in the sample should not react The method is therefore not particularly suitable to bentonite type minerals or kaolins / kaolinitic clays that contain significant bentonite or other swelling minerals. D.2 Equipment This method requires standard laboratory equipment and some additional items as described below. Beakers (preferably glass) or similar containers to hold ~ 3 litres by volume Water bath with temperature control (+/- 1ºC) to accommodate the 3 litre glass beakers (a bath that holds 3-4 beakers gives a good compromise between taking up too much bench space and adversely affecting sample throughput). Demineralised (deionised) water Analytical balance with an accuracy of g Ultrasonic bath or shaker Dispersant e.g. sodium hexametaphosphate (Calgon), sodium polyacrylate etc., when required Dilute (~10 %) Sodium carbonate solution for ph adjustment Dilute (~10 %) Sulphuric acid for ph adjustment D.3 Preparation of the sample Weigh out on a clean and dry dish or weighing boat approximately 40 g of the sample material to be analysed with a precision of g. Add approximately 300 ml of deionised water (ideally - that has been pre-heated to 25 ºC in a beaker in the water bath) to a 600 ml clean glass beaker and then add dispersant if desired at an appropriate dosage for the type / particle size range of the mineral to be sedimented. The optimum dose of dispersant will depend on the particle size distribution (surface area) of the material under test. The finer (higher surface area) materials will require a higher dosage of dispersant. Typically, for kaolins, a dispersant dose of between 0.1 wt.% and 0.3wt.% on the equivalent dry-weight should suffice. E.g. 6g (mls) of 1 wt.% dispersant on 40 g dry-weight of kaolin would be equivalent to 0.15wt % active dispersant. Carefully add the pre-weighed sample material into the water/dispersant and gently mix until fully wetted-out. Ensure that the entire sample is transferred to the mixture by either brushing or washing out with deionised water. Full dispersion of the sample may then be achieved by using an ultrasonic probe or placing the beaker of slurry into an ultrasonic bath for a specified time. The ph of the slurry should also be checked and adjusted as necessary by the addition of a few drops of sodium carbonate solution (to raise ph) or dilute sulphuric acid (to lower ph). The optimum ph will depend on the dispersant type used, e.g. for sodium hexametaphosphate (Calgon) a ph of around 7 is optimum. If a polyacrylate dispersant is used then a higher ph around is preferred. 18/27
19 D.4 Particle Size Distribution Use this prepared sample to measure the Particle Size Distribution with Laser diffraction or capable to identify nano particles, using your standard operation procedure (SOP). Mie parameters: Real part (n p) Imaginary part (k p) Kaolin / Calcined Kaolin When using a different strategy of sample preparation, this should be clearly identified in your report on the results. 19/27
20 E - Dispersion conditions for other Minerals which may be treated in a similar way to Kaolins / Kaolinitic Clays E.1 Scope The general methodology developed for kaolins and kaolinitic clays may also be used for the following minerals: Andalusite, Mica, Vermiculite and Talc. E.2 Equipment Standard laboratory glassware and the following supplies: 1. Glass beaker 2. Demineralised (deionised) water 3. Beakers (preferably glass) or similar containers to hold ~ 3 litres by volume 4. Analytical balance with an accuracy of grams 5. 1 mm screen 6. Oven with an automatic temperature control set to ~ 100 o C 7. Magnetic stirrer 8. Ultrasonic bath 9. Dispersant or deflocculant: Triton X100, Calgon (Sodium metaphosphate) or Sodium polyacrylate (e.g. 0.1% Daxad 30), when required E.3 Preparation of the sample E.3.1 Andalusite Andalusite is a blocky, coarse alumina-silicate mineral but some products may contain fine particles. Generally, Andalusite products are very coarse (> 1 mm) and the procedure described below should be followed. 1. Take approximately 100 g of dry product and accurately weigh to 2 decimal places (weight A). Water-wash the 100 g of product through a 1 mm screen and collect the < 1 mm fraction (the portion passing through the screen) and the > 1 mm fraction (the portion remaining on the screen) separately. 2. Dry, to constant weight, the >1 mm fraction in an oven at ~ 100 C (weight B). 3. Calculate the weight percentage of > 1 mm fraction (weight% C). Weight % of >1 mm fraction C = weight B/weight A x 100% 4. If the weight % of > 1 mm is greater than then no further action is required. (If weight % >1 mm is > then wt.% < 1 mm will be <1 wt.%). 5. If the weight % of > 1 mm is less than then screen sufficient product to carry out a sedimentation analysis as detailed for kaolins and kaolinitic Clays. E.3.2 Mica Mica is a platey mineral with similar particle shape to kaolins but generally a coarser particle size. For very coarse mica products an initial pre-screening should be carried out to determine whether the full sedimentation procedure is required (see C.3.1 Andalusite). 20/27
21 E.3.3 Vermiculite Vermiculite, in its unexpanded form, is another platy mineral similar to a mica and kaolin but even coarser particle size. Because of the coarse nature of Vermiculite, especially when expanded, it should be given the same pre-screening process as for coarse micas and Andalusite (see C.3.1 Andalusite). E.3.4 Talc Talc is a platy mineral, it exhibits some degree of hydro-phobicity which means that a suitable surfactant should be added to the talc / water suspension in order to thoroughly wet-out the mineral particles and give a fully dispersed and deflocculated suspension. Add 2 ml of Triton X100 to 500 mg of Calgon (Sodium metaphosphate) or Sodium polyacrylate in a 2000 ml beaker, complete to 2000 ml with demineralised water and mix it during 45 min using a magnetic stirrer. a) Take a sample of the material to be analysed of approx. 5 g b) Determine the weight M of the sample to be analysed with a precision of g. c) Disperse the sample in 80 ml of dispersant in a 175 ml dry and clean beaker. NOTE: To avoid the presence of foam, introduce the demineralised water and the dispersant in several steps in order to obtain a pastry and then a liquid mixture. d) Place the sample in an ultrasonic bath during 4 minutes. E.4 Particle Size Distribution Use this prepared sample to measure the Particle Size Distribution with Laser diffraction capable to identify nano particles, using your standard operation procedure (SOP). Mie parameters: Real part (n p) Imaginary part (k p) Andalusite Mica Vermiculite Talk When using a different strategy of sample preparation, this should be clearly identified in your report on the results. 21/27
22 F - Dispersion conditions for Diatomaceous Earth (DE) F.1 Scope This instruction applies to diatomaceous earth (DE) products to prepare the sample for laser diffraction. The DE are classified in three categories of product: natural, calcined and flux-calcined. F.2 Equipment 1. Particle size analyser (blue laser) according to ISO (laser diffraction) 2. Demineralised (deionised) water 3. Ultrasonic bath or shaker F.3 Preparation of the sample Particle size distribution of the sample is determined by laser diffraction, in liquid (demineralised water), with a pre-sonication during 20s F.4 Particle Size Distribution Use this prepared sample to measure the Particle Size Distribution with Laser diffraction capable to identify nano particles, using your standard operation procedure (SOP) and the following Mie model parameters: Real part (n p) Imaginary part (k p) Diatomaceous Earth When using a different strategy of sample preparation, this should be clearly identified in your report on the results. 22/27
23 G- Dispersion conditions for feldspar products G.1 Scope This instruction applies to coarse to fine-grained material samples (maximum 100 µm), for which water is generally a good medium for separation by sedimentation. Water is suitable as a separation medium provided the following conditions are met: the particles in the sample must be completely de-agglomerated the particles in the sample should not dissolve, swell or disintegrate the particles in the sample should not react e.g. clays or cement should not be analysed in water G.2 Equipment Standard laboratory glassware and the following supplies: 6) Jar and glass beaker 7) Demineralised (deionised) water 8) Sodium hexametaphosphate (NaPO3)6 9) Analytical balance with an accuracy of grams 10) Ultrasonic bath or shaker. 11) Desiccator 12) Oven with an automatic temperature control set to 103 ± 5 o C G.3 Preparation of the sample Weigh in a sample jar approximately 5 g of the sample material to be analysed with a precision of gram. Prepare a small glass beaker of approximately 50 ml capacity by heating in the oven at 103 ± 5 o C for 1 hour. Let the glass beaker cool down for 15 minutes in a desiccator and weigh it to within gram accuracy. Add approximately 20 ml demineralised water to the sample jar to prepare a slurry. Add 2.5 ml of sodium hexametaphosphate 50g/l (0.05%). Place the sample jar in an ultrasonic bath for about 5 minutes, or for 1 hour in a shaker. G.4 Particle Size Distribution Use this prepared sample to measure the Particle Size Distribution with Laser diffraction capable to identify nano particles, using your standard operation procedure (SOP). Mie parameters: Real part (n p) Imaginary part (k p) Feldspar When using a different strategy of sample preparation, this should be clearly identified in your report on the results. 23/27
24 H - Dispersion conditions for Calcium carbonate H.1 Scope This instruction applies to fine-grained calcium carbonate powder products to prepare the sample for laser diffraction. H.2 Equipment 4. Demineralised (deionised) water 5. Ultrasonic bath or shaker 6. Analytical balance with an accuracy of 0.001g 7. Sodium pyrophosphate (Na4O7P2, purity >/= 95%, CAS-No ) 8. Photo-Flo (Kodak CAT ), when required (for coated material) 9. Erlenmeyer plastic flask 200 ml 10. High-speed blender (e.g., Polytron PT 3100) H.3 Preparation of the sample The following steps should be executed to achieve optimum dispersion conditions of a fine-grained uncoated calcium carbonate powder sample: 1. Water down 8 g powder with 100 ml sodium pyrophosphate (Na4O7P2, purity >/= 95%, CAS- No ) solution 0.1% in demineralised water (m/v) 2. Disperse sample by means of a high-speed blender (e.g., Polytron PT 3100) at 10'000 rpm for about 3 min in a plastic Erlenmeyer flask 200 ml 3. Place the sample for 10 min in an ultrasonic bath (approx. 90 W) Whenever possible, it is recommended to avoid coated products and use the uncoated equivalent instead. However, for a fine-grained coated calcium carbonate powder sample, the following steps should be executed to achieve optimum dispersion conditions: 1. Remove the surface treatment thermally in a muffle furnace at 430 C for 1 hour prior to analysis. The samples having their surface coating thermally removed should then be analyzed following the procedure for uncoated samples described above. H.4 Particle Size Distribution Use this prepared sample to measure the Particle Size Distribution with Laser diffraction capable to identify nano particles; using your standard operation procedure (SOP). Mie parameters: Real part (n p) Imaginary part (k p) Calcite No value Aragonite No value Carbonate / Dolomite When using a different strategy of sample preparation, this should be clearly identified in your report on the results. 24/27
25 I - Dispersion conditions for Lime I.1 Scope This instruction applies to lime products to prepare the sample for laser diffraction. I.2 Equipment ml cylinder 12. Analytical balance with an accuracy of 0.001g 13. Ultrasonic bath or shaker ml isopropanol (the used isopropanol has to be absolutely waterfree). I.3 Preparation of the sample The following steps should be executed to achieve optimum dispersion conditions of a sample: 1. Weigh the sample into a 250 ml cylinder and add 20 ml isopropanol. The isopropanol used has to be absolutely waterfree. 2. Place the cylinder into an ultrasonic bath for 5 min to disperse the material, made up to 250 ml with isopropanol and covered. I.4 Particle Size Distribution Use this prepared sample to measure the Particle Size Distribution with Laser diffraction capable to identify nano particles, using your standard operation procedure (SOP). Mie parameters: Real part (n p) Imaginary part (k p) Quicklime No value Slaked lime No value When using a different strategy of sample preparation, this should be clearly identified in your report on the results. 25/27
26 J - Dispersion conditions for Bentonite (option A) J.1 Scope This instruction applies to bentonite products to prepare the sample for laser diffraction. J.2 Equipment 1. De-ionised Water 2. Overhead stirrer capable of running at 2000 rpm or greater 3. Glass Beaker 1litre 4. Balance able to measure to 2 decimal places J.3 Preparation of the sample The following steps should be executed to achieve optimum dispersion conditions of a sample: 1. Weigh 8 g of bentonite, add to 400 ml deionised water. 2. Allow bentonite to hydrate for 24 hours 3. Stir the bentonite slurry for 5 min to disperse the material at a peripheral speed of approximately 10 m/sec. J.4 Particle Size Distribution Use this prepared sample to measure the Particle Size Distribution with Laser diffraction capable to identify nano particles, using your standard operation procedure (SOP). When using a different strategy of sample preparation, this should be clearly identified in your report on the results. 26/27
27 K - Dispersion conditions for Bentonite (option B) K.1 Scope This instruction applies to bentonite products to prepare the sample for laser diffraction. K.2 Equipment 1. De ionised Water 2. IKA Ultra-Turrax or similar homogenizer ml Glass Beaker 4. Balance able to measure to 2 decimal places K.3 Preparation of the sample The following steps should be executed to achieve optimum dispersion conditions of a sample: 4. Weigh 2% of bentonite to deionised water e.g. add 8 g of bentonite in 400 ml water. 5. Allow bentonite to hydrate for 24 hours 6. Place the Homogenizer into the bentonite slurry for 10 min to disperse the material, at rpm. K.4 Particle Size Distribution Use this prepared sample to measure the Particle Size Distribution with Laser diffraction capable to identify nano particles, using your standard operation procedure (SOP). When using a different strategy of sample preparation, this should be clearly identified in your report on the results. 27/27
Particle size analysis -Chapter 3
 Particle size analysis -Chapter 3 Importance of PSA Size and hence surface area of particles affect: The rate of drug dissolution and release from dosage forms Flow properties of granules and powders.
Dr. L. I. N. de Silva. Student Name Registration Number: Assessed By: Lecturers Remarks
 Module - CE 2042 Soil Mechanics and Geology-1 Assignment Tests for Particle Size Distribution Analysis Marks 10% Learning Ability to conduct particle size distribution analysis of soils Outcome Ability
TESTING of AGGREGATES for CONCRETE
 TESTING of AGGREGATES for CONCRETE The properties of the aggregates affect both the fresh and hardened properties of concrete. It is crucial to know the properties of the aggregates to be used in the making
SOIL SURVEY STANDARD TEST METHOD PARTICLE SIZE ANALYSIS
 Department of Sustainable Natural Resources SOIL SURVEY STANDARD TEST METHOD PARTICLE SIZE ANALYSIS ABBREVIATED NAME PSA TEST NUMBER P7 TEST METHOD TYPE B VERSION NUMBER 3 RECORD OF AMENDMENTS Version
SOUTH AFRICAN NATIONAL STANDARD
 ISBN 978-0-626-30857-5 SOUTH AFRICAN NATIONAL STANDARD Particle and relative densities of aggregates WARNING This document references other documents normatively. Published by SABS Standards Division 1
BIO & PHARMA ANALYTICAL TECHNIQUES. Chapter 5 Particle Size Analysis
 BIO & PHARMA ANALYTICAL TECHNIQUES Chapter 5 by Dr Siti Umairah Mokhtar Faculty of Engineering Technology umairah@ump.edu.my Chapter Description Aims Discuss theory, principles and application of analytical
Tex-620-J, Determining Chloride and Sulfate Contents in Soil
 Contents in Soil Contents: Section 1 Overview...2 Section 2 Sample Preparation...3 Section 3 Ion Chromatography Method...5 Section 4 Wet Chemical Method...9 Section 5 Archived Versions...15 Texas Department
Protocol Particle size distribution by centrifugal sedimentation (CPS)
") Protocol Particle size distribution by centrifugal sedimentation (CPS) 1. Method The CPS Disc Centrifuge separates particles by size using centrifugal sedimentation in a liquid medium. The sedimentation
Protocol Particle size distribution by centrifugal sedimentation (CPS) 1. Method The CPS Disc Centrifuge separates particles by size using centrifugal sedimentation in a liquid medium. The sedimentation
The analysis of organic acid content of additives, premix, feed, and water.
 The analysis of organic acid content of additives, premix, feed, and water. Contents Foreword Introduction Warnings 1. Scope 2 1.1 LOD and LOQ 3 2. Normative References 3 3. Definitions 3 3.1 Feed (or
Characterisation of nanomaterials for REACH dossiers - best practice 30 October 2012
 Characterisation of nanomaterials for REACH dossiers - best practice 30 October 2012 Abdelqader Sumrein Evaluation Directorate ECHA Outline Nanomaterials under REACH: reflections from 2010 registrations
STANDARD PROCEDURE: NWSP R2 (15) Polyacrylate Superabsorbent Powders Determination of the Particle Size Distribution by Sieve Fractionation
 Polyacrylate Superabsorbent Powders Determination of the Particle Size Distribution by Sieve Fractionation") 1. Scope STANDARD PROCEDURE: Polyacrylate Superabsorbent Powders Determination of the Particle Size Distribution by Sieve Fractionation This test method specifies a method for measuring particle size distributions
1. Scope STANDARD PROCEDURE: Polyacrylate Superabsorbent Powders Determination of the Particle Size Distribution by Sieve Fractionation This test method specifies a method for measuring particle size distributions
Sample Preparation. Laser Particle Sizer "analysette 22" for the. Proper Sampling. Sample Dividing. Sample Preparation. Dispersion.
 Sample Preparation for the Laser Particle Sizer "analysette 22" Proper Sampling Sample Dividing Sample Preparation Dispersion Tips and Tricks Materials and Suitable Measurement Liquids U.Gerber August
429 LIGHT DIFFRACTION MEASUREMENT OF PARTICLE SIZE
 Search USP29 429 LIGHT DIFFRACTION MEASUREMENT OF PARTICLE SIZE Light diffraction is one of the most widely used techniques for measuring the size of a wide range of particles from very fine to very coarse.
Test Method: CPSC-CH-E
 UNITED STATES CONSUMER PRODUCT SAFETY COMMISSION DIRECTORATE FOR LABORATORY SCIENCES DIVISION OF CHEMISTRY 10901 DARNESTOWN RD GAITHERSBURG, MD 20878 Test Method: CPSC-CH-E1001-08 Standard Operating Procedure
Method Development. Creating the Perfect Standard Operating Procedure (SOP) 2007 HORIBA, Ltd. All rights reserved.
 2007 HORIBA, Ltd. All rights reserved.") Method Development Creating the Perfect Standard Operating Procedure (SOP) Method Development Goal: Reproducible method that tracks product performance Choose measurement approach (dry vs. suspension)
Method Development Creating the Perfect Standard Operating Procedure (SOP) Method Development Goal: Reproducible method that tracks product performance Choose measurement approach (dry vs. suspension)
IV. EQUIPMENT a. Horiba LA 950 main unit b. Dry sample unit that has a silencer behind it c. Cell slide unit that holds
 STANDARD OPERATING PROCEDURE No of pages 7 No: METH 006 Version: 1 Date: 05-06- 2011 Title: Particle Size Distribution Analysis by Laser Diffraction method with HORIBA LA 950 in wet mode I. SCOPE AND APPLICATION
Joint Research Centre
 Joint Research Centre the European Commission's in-house science service Serving society Stimulating innovation Supporting legislation The EU Commission's definition of nanomaterial: implementation and
CEINT/NIST PROTOCOL REPORTING GUIDELINES FOR THE PREPARATION OF AQUEOUS NANOPARTICLE DISPERSIONS FROM DRY MATERIALS. Ver. 2.0
 CEINT/NIST PROTOCOL REPORTING GUIDELINES FOR THE PREPARATION OF AQUEOUS NANOPARTICLE DISPERSIONS FROM DRY MATERIALS Ver. 2.0 July 8, 2010 Protocol Contributors: J. S. Taurozzi 1, V. A. Hackley 1, M. R.
University of Pécs Institute of Pharmaceutical Technology and Biopharmacy
 University of Pécs Institute of Pharmaceutical Technology and Biopharmacy Particle Definition In a continuous phase the particle is an (mostly in gaseous or liquid material) existing, dispersed, interface
next generation Welcome to the Dispersion options Smarter particle sizing Your sample, expertly processed and prepared Particle size
 Particle size Welcome to the next generation Your sample, expertly processed and prepared Dispersion options 3000 detailed specification sheets from Getting your sample preparation right The US Pharmacopeia
MECHANICAL SIZE ANALYSIS OF SEDIMENTS
 MECHANICAL SIZE ANALYSIS OF SEDIMENTS I. Introduction The study of sediments is concerned with 1. the physical conditions of a sediment, whether glacial, fluvial, marine, etc; 2. the time of formation
It is important to recognize two distinct but overlapping uses of the term "clay":
 Soil Texture (Particle Size Analysis or Mechanical Analysis) Introduction Texture, or size distribution of mineral particles (or its associated pore volume), is one of the most important measures of a
CE330L Student Lab Manual Mineral Aggregate Properties
 Mineral Aggregate Properties Introduction In this lab module several characteristics of aggregates are determined. Tests will be conducted on both coarse and fine aggregates. The results of some of these
ASTM Designation: D Standard Test Method for Determination of Iodine Number of Activated Carbon
 ASTM Designation: D4607-94 Standard Test Method for Determination of Iodine Number of Activated Carbon 1. Scope 1.1 This test method covers the determination of the relative activation level of unused
Nanodefinition and Nanoanalytics: The NanoDefine Project
 Nanodefinition and Nanoanalytics: The NanoDefine Project Hubert Rauscher European Commission Joint Research Centre www.jrc.ec.europa.eu Serving society Stimulating innovation Supporting legislation The
Geotechnical investigation and testing Laboratory testing of soil. Part 4: Determination of particle size distribution
 Provläsningsexemplar / Preview INTERNATIONAL STANDARD ISO 17892-4 First edition 2016-11-01 Geotechnical investigation and testing Laboratory testing of soil Part 4: Determination of particle size distribution
Test Method Development and Validation as Pertaining to Microtrac Particle Size Measuring Instruments
 Test Method Development and Validation as Pertaining to Microtrac Particle Size Measuring Instruments Philip E. Plantz, PhD Application Note SL AN 17 Rev B Provided By: Microtrac, Inc. Particle Size Measuring
Ti-Pure TITANIUM DIOXIDE. DETERMINATION OF PARTICLE SIZE DISTRIBUTION OF RPS ( Horiba (LA-900) Procedure) METHOD: T WP
 Procedure) METHOD: T WP") Ti-Pure TITANIUM DIOXIDE DETERMINATION OF PARTICLE SIZE DISTRIBUTION OF RPS ( Horiba (LA-900) Procedure) METHOD: T4400.274.03WP 1 TITANIUM DIOXIDE (Ti-Pure ) Determination of Particle Size Distribution
Ti-Pure TITANIUM DIOXIDE DETERMINATION OF PARTICLE SIZE DISTRIBUTION OF RPS ( Horiba (LA-900) Procedure) METHOD: T4400.274.03WP 1 TITANIUM DIOXIDE (Ti-Pure ) Determination of Particle Size Distribution
Basic Aggregates Study Guide
 Basic Aggregates Study Guide General Conversions 1) There are pounds in one ton. 2) There are grams in one pound. 3) One kilogram consists of grams. 4) The linear distance that one station covers is feet.
Anethole. Gas chromatograhpy determination of trans-anethole in Spirit srinks of viti-vinicultural origin
 OIVMABS15 Anethole. Gas chromatograhpy determination of transanethole in Type II method SCOPE This method is suitable for the determination of transanethole in aniseedflavoured spirit drinks using capillary
ABSTRACT I. INTRODUCTION II. BACKGROUND OF STUDY
 2017 IJSRST Volume 3 Issue 3 Print ISSN: 2395-6011 Online ISSN: 2395-602X Themed Section: Science and Technology Preparation and Experimental Investigation of CUO Nanoparticles Based Engine OILS Sk Salman
WACEL AGGREGATE LABORATORY TESTING TECHNICIAN
 STUDY GUIDE WACEL AGGREGATE LABORATORY TESTING TECHNICIAN August 2016 Study Guide Aggregate Laboratory Testing General: An aggregate laboratory technician shall have sufficient training, education, and
Freezing point depression (Item No.: P )
") Freezing point depression (Item No.: P3021101) Curricular Relevance Area of Expertise: Chemistry Education Level: University Topic: General Chemistry Subtopic: Solutions and Mixtures Experiment: Freezing
Freezing point depression (Item No.: P3021101) Curricular Relevance Area of Expertise: Chemistry Education Level: University Topic: General Chemistry Subtopic: Solutions and Mixtures Experiment: Freezing
INSTRUCTIONS FOR WRITING CIPAC METHODS
 INSTRUCTIONS FOR WRITING CIPAC METHODS Introduction CIPAC methods are intended to be used by many people whose native language is not English. Writers of methods should keep this in mind and should use
Density of an Unknown
 Experiment 3 Density of an Unknown Pre-Lab Assignment Before coming to lab: Read the lab thoroughly. Answer the pre-lab questions that appear at the end of this lab exercise. Purpose The density of an
METHANOL REFERENCE SPECIFICATIONS
 IMPCA INTERNATIONAL METHANOL PRODUCERS & CONSUMERS ASSOCIATION Avenue de Tervuren 149 1150 Brussels, Belgium Tel : (32/2) 7418683 Fax : (32/2) 7418684 e-mail : impca@epca.be IMPCA METHANOL REFERENCE SPECIFICATIONS
IDENTIFICATION TESTS FOR DURACOR TABLETS
 PAGE 1 OF 8 IDENTIFICATION TESTS FOR DURACOR TABLETS PAGE 2 OF 8 PROTOCOL APPROVALS Norvin Pharma Inc. Signature and Date Author Analytical Laboratory Approver Analytical Laboratory Group Leader Approver
Characterization of Low-Level, Oversize Particles in Abrasive Powders
 Characterization of Low-Level, Oversize Particles in Abrasive Powders T.F. Dumm Diamond Innovations Abstract Abrasive powders are used in fine grinding and polishing applications many of which require
PARTICLE MEASUREMENT IN CLEAN ROOM TECHNOLOGY
 WHITEPAPER ENGLISH PARTICLE MEASUREMENT IN CLEAN ROOM TECHNOLOGY PARTICLE MEASUREMENT Particle measurement in cleanrooms. WP1508006-0100-EN, V1R0, 2015-08 PARTICLE MEASUREMENT IN CLEAN ROOM TECHNOLOGY
DustMon A Standard Operating Procedure From the Microtrac Particle Analysis Laboratory (PAL) SL-AN-44 Revision C
 SL-AN-44 Revision C") DustMon A Standard Operating Procedure From the Microtrac Particle Analysis Laboratory (PAL) SL-AN-44 Revision C Introduction This operating procedure is provided to assist the user of the Dustmon in obtaining
DustMon A Standard Operating Procedure From the Microtrac Particle Analysis Laboratory (PAL) SL-AN-44 Revision C Introduction This operating procedure is provided to assist the user of the Dustmon in obtaining
--> Buy True-PDF --> Auto-delivered in 0~10 minutes. GB Translated English of Chinese Standard: GB5009.
 Translated English of Chinese Standard: GB5009.17-2014 www.chinesestandard.net Sales@ChineseStandard.net NATIONAL STANDARD OF GB THE PEOPLE S REPUBLIC OF CHINA National Food Safety Standard-Determination
1 Millimeter. 1 Micron. 1 Nanometer. 1 Angstrom ELECTRON SEPARATION PROCESS COMMON MATERIALS PARTICLE SIZE LOG SCALE MAGNETIC RANGE SPECTRUM
 HANDOUT 3. Millimeter Micron Nanometer Angstrom 00 APPROX. MOLEC. WT. 0 000 00 0 000 00 0 8 7 6 5 4 3 2 0 Radio waves Infrared Ultraviolet Visible X-rays MACRO MICRO MOLECULAR IONIC MOLECULE MACRO 200k
Fundamentals of Particle Counting
 Fundamentals of Particle Counting 1 Particle Counting: Remains the most significant technique for determining the cleanliness level of a fluid Useful as a tool for qualification and monitoring cleanroom
AM11: Diagnostics for Measuring and Modelling Dispersion in Nanoparticulate Reinforced Polymers. Polymers: Multiscale Properties.
 AM11: Diagnostics for Measuring and Modelling Dispersion in Nanoparticulate Reinforced Polymers Polymers: Multiscale Properties 8 November 2007 Aims Provide diagnostic tools for quantitative measurement
Your partner in Science!
 Your partner in Science! Your partner in Science! Laser Diffraction Particle Size Distribution Analyzer LA-960 Simple, Powerful, Reliable 10 nm - 5 mm The LA-960 features intuitive software, unique accessories,
Experiment 24. Chemical recycling of poly(ethylene) terephthalate (PET)
 terephthalate (PET)") Methods of pollution control and waste management Experiment 24 Chemical recycling of poly(ethylene) terephthalate (PET) Manual Department of Chemical Technology The aim of this experiment is to gain knowledge
Methods of pollution control and waste management Experiment 24 Chemical recycling of poly(ethylene) terephthalate (PET) Manual Department of Chemical Technology The aim of this experiment is to gain knowledge
SOUTH AFRICAN NATIONAL STANDARD
 ISBN 978-0-626-33085-9 SOUTH AFRICAN NATIONAL STANDARD Water Free and saline ammonia content Published by SABS Standards Division 1 Dr Lategan Road Groenkloof Private Bag X191 Pretoria 0001 Tel: +27 12
Setting Attainable and Practical Particle Size Specifications
 Setting Attainable and Practical Particle Size Specifications Mark Bumiller HORIBA Scientific mark.bumiller@horiba.com Why Set Specifications? Product release (quality) Communicate grade to buyers Internal
AGGREGATE STABILITY P1.84. The sample material is weighed. The samples are pre-moistened with water vapour, using a very fine plant sprayer.
 AGGREGATE STABILITY The aggregate stability of a soil is the resistance of soil structure against mechanical or physicochemical destructive forces. Soil structure is one of the main factors controlling
EXPERIMENT 7: THE LIMITING REACTANT
 EXPERIMENT 7: THE LIMITING REACTANT PURPOSE To find the ratio of moles of a reactant to moles of a product of a chemical reaction. To relate this ratio to the coefficients of these substances in the balanced
Basic Equipments and Instruments used in Chemistry laboratory: Balance: It is an instrument for measuring mass.
 Basic Equipments and Instruments used in Chemistry laboratory: Balance: It is an instrument for measuring mass. Pipettes: They are used to transfer of known volumes of liquids from one container to another.
Experiment 2: THE DENSITY OF A SOLID UNKNOWN AND CALIBRATION WITH DATASTUDIO SOFTWARE
 Experiment 2: THE DENSITY OF A SOLID UNKNOWN AND CALIBRATION WITH DATASTUDIO SOFTWARE Concepts: Density Equipment Calibration Approximate time required: 90 minutes for density 90 minutes for two thermometers
Thermodynamics and the Solubility of Sodium Tetraborate Decahydrate
 Thermodynamics and the Solubility of Sodium Tetraborate Decahydrate In this experiment you, as a class, will determine the solubility of sodium tetraborate decahydrate (Na 2 B 4 O 7 10 H 2 O or Na 2 [B
Review: ISO Colloidal systems Methods for zeta potential determination
 Review: ISO 13099 Colloidal systems Methods for zeta potential determination Mark Bumiller mark.bumiller@horiba.com www.horiba.com/particle New ISO Standards www.iso.org Outline ISO standards Zeta potential
Total sulphur content
 Accepted 1996 Black liquors Total sulphur content 1 Scope This SCAN-test Method describes two methods for determining the total sulphur content in black liquors having a dry matter content exceeding 8
Prof. B V S Viswanadham, Department of Civil Engineering, IIT Bombay
 05 Clay particle-water interaction & Index properties Electrical nature of clay particles a) Electrical charges i) The two faces of all platy particles have a negative charge. Resulting due to isomorphous
Sarutt Sripetchr 1* and Surachai Thachepan 2
 Characterization of Potential Reactivity to Alkalis of Thailand Aggregates by Chemical Method Sarutt Sripetchr 1* and Surachai Thachepan 2 ABSTRACT The best way to prevent Alkali-Silica Reaction (ASR)
SST3005 Fundamentals of Soil Science LAB 5 LABORATORY DETERMINATION OF SOIL TEXTURE: MECHANICAL ANALYSIS
 LAB 5 LABORATORY DETERMINATION OF SOIL TEXTURE: MECHANICAL ANALYSIS Learning outcomes The student is able to: 1. Separate soil particles : sand, silt and clay 2. determine the soil texture class using
White Paper Optimization of Dry Powder Particle Size Analysis
 -------------------------------------------------------------------White Paper Optimization of Dry Powder Particle Size Analysis Reprinted with permission from VertMarkets, Inc Optimization of Dry Powder
Total Carboxylic Acid Group Content Applicable Products: Carbopol * Polymers and Pemulen * Polymeric Emulsifiers
 LUBRIZOL TEST PROCEDURE TP-1318-A Edition: August, 2010 Total Carboxylic Acid Group Content Applicable Products: Carbopol * Polymers and Pemulen * Polymeric Emulsifiers Scope: This procedure is used for
Minneapolis Community and Technical College. Separation of Components of a Mixture
 Minneapolis Community and Technical College Chemistry Department Chem1020 Separation of Components of a Mixture Objectives: To separate a mixture into its component pure substances. To calculate the composition
SOIL ORGANIC CONTENT USING UV-VIS METHOD
 Test Procedure for SOIL ORGANIC CONTENT USING UV-VIS METHOD TxDOT Designation: Tex-148-E Effective Date: March 2016 1. SCOPE 1.1 This method determines the soil organic content based on the amount of humic
The Nitrofurantoin Capsules Revision Bulletin supersedes the currently official monograph.
 Nitrofurantoin Capsules Type of Posting Revision Bulletin Posting Date 25 May 2018 Official Date 01 Jun 2018 Expert Committee Chemical Medicines Monographs 1 Reason for Revision Compliance In accordance
637. Thiamethoxam. HPLC method
 637. Thiamethoxam HPLC method CIPAC Collaborative Trial according to CIPAC Information Sheet N o 293 Dr. Sven Adolph Syngenta Crop Protection Münchwilen AG CH-4333 Münchwilen Switzerland May 212 page 1
SAND ANALYSIS EXERCISE
 SAND ANALYSIS EXERCISE Step 1: Taking Beach Sediment Samples Equipment: Sample cups; three(3) per profile Permanent ink marker A. Take one sand sample from the foredune, berm top, and beachface areas.
GRIGNARD REACTION Synthesis of Benzoic Acid
 1 GRIGNARD REACTION Synthesis of Benzoic Acid In the 1920 s, the first survey of the acceleration of chemical transformations by ultrasound was published. Since then, many more applications of ultrasound
Acid-Base Titration. M M V a
 Acid-Base Titration Pre-Lab Discussion In the chemistry laboratory, it is sometimes necessary to experimentally determine the concentration of an acid solution or a base solution. A procedure for making
Total Organic Carbon Analysis of Solid Samples for Environmental and Quality Control Applications
 Application Note 35140710 Total Organic Carbon Analysis of Solid Samples for Environmental and Quality Control Applications Keywords 1030S Solids Module Aurora 1030 TOC Analyzer High Temperature Catalytic
Title: Gravimetric verification of chloride concentration from a precipitate of silver nitrate.
 Title: Gravimetric verification of chloride concentration from a precipitate of silver nitrate. Introduction: Gravimetric analysis is a method of quantitative chemical analysis used to determine the concentration
Practical 1 Procedure Iron by Titrimetry
 Practical 1 Procedure Iron by Titrimetry Introduction This experiment quantifies Fe 2+, ferrous iron, by reacting it with ceric sulphate in a 1:1 reaction, i.e. one mole of ferrous iron reacts with one
Determination of Nutrients. Determination of total phosphorus. Extraktion with aqua regia, reflux method. Introduction
 Determination of Nutrients Determination of total phosphorus Extraktion with aqua regia, reflux method Introduction This document is developed in the project Horizontal. It is the result of desk studies
The Synthesis and Analysis of Aspirin
 The Synthesis and Analysis of Aspirin Computer 22 Aspirin, the ubiquitous pain reliever, goes by the chemical name acetylsalicylic acid. One of the compounds used in the synthesis of aspirin is salicylic
Measuring Lysozyme Monomer at 0.1 mg/ml Concentration. Equipment used : Sample Preparation and Measurement :
 Application Report #001 Measuring Lysozyme Monomer at 0.1 mg/ml Concentration Equipment used : ALV-NIBS / HPPS High Sensitivity Version, Lysozyme (MERCK), 0.1 molar Sodium-Acetate buffer (ph 4.25), syringe
Solution-processable graphene nanomeshes with controlled
 Supporting online materials for Solution-processable graphene nanomeshes with controlled pore structures Xiluan Wang, 1 Liying Jiao, 1 Kaixuan Sheng, 1 Chun Li, 1 Liming Dai 2, * & Gaoquan Shi 1, * 1 Department
Development and validation of the test guideline on agglomeration behavior of nanomaterials in different aquatic media.
 Development and validation of the test guideline on agglomeration behavior of nanomaterials in different aquatic media. Report on the validation of nanomaterials agglomeration behavior in various aquatic
Procedure for the Determination of Permanganate Oxidizable Carbon
 Procedure for the Determination of Permanganate Oxidizable Carbon Overview: Steve Culman, Mark Freeman, Sieglinde Snapp Kellogg Biological Station, Michigan State University, Hickory Corners, MI, 49060
Substances and Mixtures:Separating a Mixture into Its Components
 MiraCosta College Introductory Chemistry Laboratory Substances and Mixtures:Separating a Mixture into Its Components EXPERIMENTAL TASK To separate a mixture of calcium carbonate, iron and sodium chloride
Recommendations by Experts on the Required Parameters for Microplastics Monitoring in the Ocean As of 12 June 2018
 Recommendations by Experts on the Required Parameters for Microplastics Monitoring in the Ocean As of 12 June 2018 The following table shows recommendations on procedures for monitoring microplastics in
EFfCI Guidance Paper on Nanomaterials in Cosmetics Practical Recommendation for Particle Size Assessment
 15 July 2015 EFfCI Guidance Paper on Nanomaterials in Cosmetics Practical Recommendation for Particle Size Assessment 1. Introduction and Purpose 2 2. Definitions 2 2.1. Definition of Nanomaterial 2 2.1.1.
Lab Activity 3: Factors Affecting Reaction Rate
 Chemistry 3202 Lab #3 factors affecting Reaction Rate Page 1 of 5 Lab Activity 3: Factors Affecting Reaction Rate Introduction Several factors influence how fast a reaction proceeds. In this activity,
Very low temperature CO oxidation over colloidally deposited gold nanoparticles on Mg(OH) 2 and MgO
 2 and MgO") Supporing Information Very low temperature CO oxidation over colloidally deposited gold nanoparticles on Mg(OH) 2 and MgO Chun-Jiang Jia, Yong Liu, Hans Bongard, Ferdi Schüth* Max-Planck-Institut für Kohlenforschung,
Supporing Information Very low temperature CO oxidation over colloidally deposited gold nanoparticles on Mg(OH) 2 and MgO Chun-Jiang Jia, Yong Liu, Hans Bongard, Ferdi Schüth* Max-Planck-Institut für Kohlenforschung,
AP Chemistry Lab #5- Synthesis and Analysis of Alum (Big Idea 1 & 2)
") www.pedersenscience.com AP Chemistry Lab #5- Synthesis and Analysis of Alum (Big Idea 1 & 2) 1.A.1: Molecules are composed of specific combinations of atoms; different molecules are composed of combinations
www.pedersenscience.com AP Chemistry Lab #5- Synthesis and Analysis of Alum (Big Idea 1 & 2) 1.A.1: Molecules are composed of specific combinations of atoms; different molecules are composed of combinations
The Coulter Principle for Outlier Detection in Highly Concentrated Solutions
 The Coulter Principle for Outlier Detection in Highly Concentrated Solutions Particle Characterization Application Note Abstract This application note will benefit chemical and material manufacturers concerned
Product Safety Reference Manual. Book 5 - Laboratory Policies and Procedures C
 Book 5 - Laboratory Policies and Procedures C03-1 2009-06-15 1 Scope 1.1 This method describes a general procedure for the determination of leachable arsenic, selenium, cadmium, antimony, and barium in
maect PRODUCTION SOP M/1 JUNE 2007 version page: 1 Preparation of 2 liters of 10x concentrated PBS stock solution (phosphate buffered saline)
") maect PRODUCTION SOP M/1 JUNE 2007 version page: 1 Preparation of 2 liters of 10x concentrated PBS stock solution (phosphate buffered saline) Intended use: Storage: Safety: After 1:10 dilution of the PBS
maect PRODUCTION SOP M/1 JUNE 2007 version page: 1 Preparation of 2 liters of 10x concentrated PBS stock solution (phosphate buffered saline) Intended use: Storage: Safety: After 1:10 dilution of the PBS
6. Common Laboratory Techniques
 6. Common Laboratory Techniques This chapter explains the proper manner in which to carry out rudimentary chemistry laboratory techniques. More specialized techniques associated with particular analyses
Particle Characterization of Pharmaceutical Products by Dynamic Image Analysis
 WHITE PAPER Particle Characterization of Pharmaceutical Products by Dynamic Image Analysis Retsch Technology GmbH Retsch-Allee 1-5 42781 Haan, Germany Phone: +49 24/2333-0 E-Mail: technology@retsch.com
ph Titration Curves You will need about 10 ml of ~6M NaOH solution and about 40 ml of each acid solution and about 1.5 grams of KHP.
 ph Titration Curves In this experiment you will generate titration curves for the titration of a monoprotic strong acid, a monoprotic weak acid, and a diprotic weak acid. From the titration curves you
Controlled self-assembly of graphene oxide on a remote aluminum foil
 Supplementary Information Controlled self-assembly of graphene oxide on a remote aluminum foil Kai Feng, Yewen Cao and Peiyi Wu* State key Laboratory of Molecular Engineering of Polymers, Department of
Method validation for laser diffraction measurements
 Method validation for laser diffraction measurements Introduction When undertaking particle size measurements it is important to validate the analysis method to ascertain both its robustness and integrity.
Chapter 12 Tex-617, Determining Chloride in Concrete
 Chapter 12 Tex-617, Determining Chloride in Contents: Section 1 Overview... 12-2 Section 2 Apparatus... 12-3 Section 3 Preparing Solutions... 12-4 Section 4 Procedures... 12-5 Section 5 Calculations...
Chemistry Determination of Mixed Acids
 Chemistry 3200 Acid-base titration is one of the most common operations in analytical chemistry. A solution containing an unknown amount of ionizable hydrogen can be titrated with a solution of standard
A. GENERAL NOTICES. Ninth Edition, which may be abbreviated as JSFA-IX.
 A. GENERAL NOTICES A. GENERAL NOTICES 1. The title of this book is Japan s Specifications and Standards for Food Additives, Ninth Edition, which may be abbreviated as JSFA-IX. 2. Unless otherwise specified,
SPECIFIC GRAVITY AND ABSORPTION OF COARSE AGGREGATE FOP FOR AASHTO T 85
 SPECIFIC GRAVITY AND ABSORPTION OF COARSE AGGREGATE FOP FOR AASHTO T 85 Scope This procedure covers the determination of specific gravity and absorption of coarse aggregate in accordance with AASHTO T
Holographic Characterization of Agglomerates in CMP Slurries
 Holographic Characterization of Agglomerates in CMP Slurries Total Holographic Characterization (THC) Comparison of THC to other technologies Dynamic Light Scattering (DLS) Scanning Electron Microscopy
METHOD 9040B. ph ELECTROMETRIC MEASUREMENT
 METHOD 9040B ph ELECTROMETRIC MEASUREMENT 1.0 SCOPE AND APPLICATION 1.1 Method 9040 is used to measure the ph of aqueous wastes and those multiphase wastes where the aqueous phase constitutes at least
Sulfotepp impurities in Chlorpyrifos EC formulations
 Page 1 of 16 Method DAS-AM-01-058 Sulfotepp impurities in Chlorpyrifos EC formulations A. ABSTRACT Method DAS-AM-01-058 has been validated for the analysis of the relevant impurity sulfotepp in chlorpyrifos
Final Report. Characterisation of Sample Report. Job No 2016/11/12-34 AS No. 1234A. Client Example Contact Sample. Signed Date 2017.
 Final Report Title Characterisation of Job No 2016/11/12-34 AS No. 1234A Client Contact Sample Author report Signed Date 2017 Easy Reach Report 2017 v2.docx 1 of 33 Contents 1. Study Summary Page 3 2.
Particle Size and Shape Analysis in PHARMACEUTICAL INDUSTRY.
 Particle Size and Shape Analysis in PHARMACEUTICAL INDUSTRY Generalities Many analytical methods exist for the characterization of products manufactured in the pharmaceutical industry. Measuring the size
This protocol is a modified version of the DuBois assay (DuBois et al. 1956) for the quantification of total carbohydrate content of a sample.
 for the quantification of total carbohydrate content of a sample.") Carbohydrate Analysis 1. Purpose This protocol is a modified version of the DuBois assay (DuBois et al. 1956) for the quantification of total carbohydrate content of a sample. 2. Principle Sulphuric acid
Carbohydrate Analysis 1. Purpose This protocol is a modified version of the DuBois assay (DuBois et al. 1956) for the quantification of total carbohydrate content of a sample. 2. Principle Sulphuric acid