Outline of Recombinant DNA technology. Application of UV spectroscopy in recombinant DNA technology
|
|
|
- Annabel Jones
- 5 years ago
- Views:
Transcription

1 NIKHIL.K.POTDUKHE

2 Outline of UV spectrophotometer Outline of Recombinant DNA technology Application of UV spectroscopy in recombinant DNA technology References
3 Lambert law: When a beam of light is allowed to pass through a transparent medium, the rate of decrease of intensity with the thickness of medium is directly proportional to the intensity of the light. Beer law: The intensity of beam of monochromatic light decreases exponentially with the increase in concentration of the absorbing substance arithmetically.

4 A = abc or A = ξbc A: absorbance b : Sample Path length C : Sample Concentration a : Absorbance Constant ξ : Molecular Absorbance Constant
5 Deviations in absorptivity coefficients At high concentrations (>0.01M) due to electrostatic interactions between molecules in close proximity Scattering of light due to particulates in the sample Fluorescence or Phosphorescence of the sample Changes in refractive index at high analysis concentration Shifts in chemical equilibria as a function of concentration

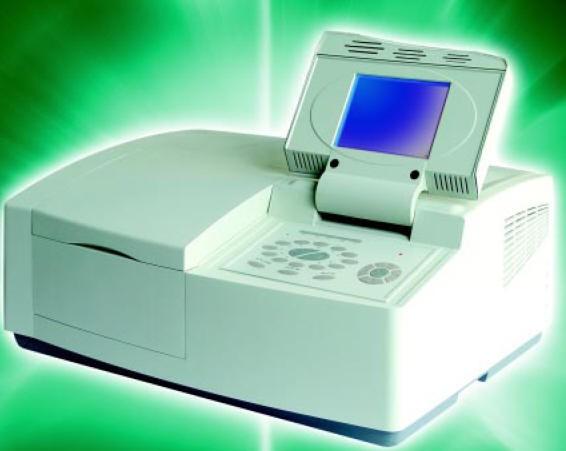
6 The recorder assembly The spectrometer itself this houses the lamps, mirrors, prisms and detector. The spectrometer splits the beam of radiation into two and passes one through a sample and one through a reference solution (that is always made up of the solvent in which you have dissolved the sample). The detector measures the difference between the sample and reference readings and communicates this to the recorder. The samples are dissolved in a solvent which is transparent to UV light and put into sample cells called cuvettes. The cells themselves also have to be transparent to UV light and are accurately made in all dimensions. They are normally designed to allow the radiation to pass through the sample over a distance of 1cm
7 Cont.. Spectrometric instruments have a common set of general features. Here we look at specific features for the UV/Visible experiment. Sources: D2 lamp, W filament (halogen lamp), and Xe arc lamp. Wavelength Selectors: Filters and Monochromators. Sample Containers: Fused silica, quartz, and glass. Detectors: Phototube, PMT, photodiode, photodiode array,ccd array


8 Strike a low voltage DC arc in a lamp filled with D2. Gives continuum emission from 160 to 400 nm.
 but does redeposit on filament")
9 Reflecting focusing assembly Lamp Condenser Lens A heated W filament, gives off blackbody radiation. Add a small amount of a halogen gas. Sublimated W reacts with halogen to form tungsten halide; does not deposit on quartz cover (no blackening) but does redeposit on filament (extends life).

10 Tube filled with Xe (or sometimes a mixture of Hg and Xe), invented in 1940, commercialized in 1961 by Osram. Pass a low voltage DC current to excite Xe. The broad spectral output closely resembles natural daylight, and is often used in projection systems (e.g. 15 kw IMAX systems) 150 Watt Xe lamp

11 A filter is device that allows the required wavelength to pass but absorb of other wavelength wholly or partially. Filters are of two type Absorption filter It work by selective absorption of unwanted light. Absorption filter is solid sheet of glass colored by pigment which is dispersed in glass. Interference filter - It work by reflection of unwanted light. A semitransparent metal film is deposited on a plate of glass. Then it is coated with dielectric material. When ray of light incident on it part of light reflects back whereas remaining light is transmitted

12 A monochromator is an optical device that transmits a mechanically selectable narrow band of wavelengths of light or other radiation chosen from a wider range of wavelengths available at the input. Accepts polychromatic input light from a lamp and outputs monochromatic light. Components : Entrance slit, Dispersion device, Exit slit Entrance slit provides narrow source light to avoid overlapping of monochromatic light. Exit slit select narrow band of dispersed spectrum for observation of detector.

13 Diffraction grating is an optical component with a regular pattern, which splits (diffracts) light into several beams traveling in different directions. Grating consist of large number of parallel lines ruled on highly polished surface such as alumina. The directions of these beams depend on the spacing of the grating and the wavelength of the light so that the grating acts as a dispersive element.
14 Prism is a transparent optical element with flat, polished surfaces that refract light. The prism disperse the light radiation in to individual colors or wavelength. Prisms are typically made out of glass, but can be made from any material that is transparent to the wavelengths for which they are designed. The resolution depends upon the size and refractive index. Prisms have higher dispersion in the UV region.
15 Successful spectroscopy requires that all materials in the beam path other than the analyte should be as transparent to the radiation as possible. Also, the geometries of all components in the system should be such as to maximize the signal and minimize the scattered light. Polystyrene nm Methacrylate nm Glass nm Suprasil Quartz nm Keep the cuvette clean. Don t clean with paper products (Kim-wipe); use optical paper. Store dry. Don t get finger prints on them. Store carefully and gently.
16 Detectors : Phototube Photomultiplier tube Photodiode Channeltron

17 Phototube: Detector is composed of : Photo cathode- It is coated with elements of high atomic volume like Potassium or silver oxide. Collector anode Photo cathode liberates electron towards anode when light incident on it


18 Photomultiplier tube: It is most sensitive of all detector. In this detector multiplication of photoelectron by secondary emission of electron achieved by using photo diode and series of anode (dynodes) Up to 10 dynodes are used, maintained at V higher than preceding one It can detect very week signal. light dynodes anode electrons photocathode voltage divider network high voltage
19 Photodiode: A photodiode is formed by sandwiching an undoped layer of Si between a heavily doped p-layer and a heavily doped n-layer. Photons whose wavelength is between 400 nm and 1100 nm can be absorbed in the intrinsic layer, producing an electron-hole pair. The bias potential sweeps these carriers to the opposite regions, producing a current in the external circuit. Photodiodes are more sensitive than phototubes, but far less sensitive than PMT s, since they only generate ~1 electron-hole pair per photon. On the other hand they are about the size of a transistor and require no high voltage support.

20 A continuous dynode chain is built into a single unit. Excellent and widely used electron multiplier. If the front end is a photo emissive surface then you have a compact PMT. Channeltrons require high vacuum to operate.
21 Mechanism:
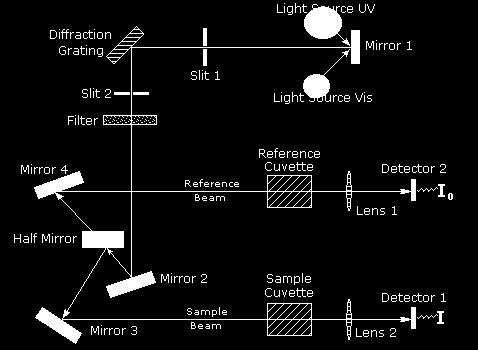
22 Cont. A beam of light from a visible and/or UV light source is separated into its component wavelengths by a prism or diffraction grating. Each monochromatic (single wavelength) beam in turn is split into two equal intensity beams by a half-mirrored device. One beam, the sample beam, passes through a small transparent container (cuvette) containing a solution of the compound being studied in a transparent solvent. The other beam, the reference (colored blue), passes through an identical cuvette containing only the solvent. The intensities of these light beams are then measured by electronic detectors and compared. The ultraviolet (UV) region scanned is normally from 200 to 400 nm, and the visible portion is from 400 to 800 nm.
23 Single beam spectrophotometer: This consist of tungsten lamp as source of light. This light radiation focused on slit by using concave mirror. This light passes through simple absorption filter where the only required wavelength of light passed through it and passed through it and falls on the sample cell where the solution to be analyzed is present. The sample or standard solution absorbs apart of the radiation and rest is transmitted. The intensity of transmitted light is determined by photovoltaic cell.
24 Double beam spectrophotometer: It is similar to that of single beam instrument. Here the light beam after passing through filter is split into sample beam and reference beam by using beam splitter. These beam pass through sample and reference solution and fall onto detector separately The final read out is in absorbance or transmittance, obtained after electronic manipulation of 2 detectors.
25 DNA is the keeper of the all the information needed to recreate an organism. All DNA is made up of a base consisting of sugar, phosphate and one nitrogen base. There are four nitrogen bases, adenine (A), thymine (T), guanine (G), and cytosine (C). The nitrogen bases are found in pairs, with A & T and G & C paired together. The sequence of the nitrogen bases can be arranged in an infinite ways, and their structure is known as the famous "double helix".
26 The sugar used in DNA is deoxyribose. The four nitrogen bases are the same for all organisms. The sequence and number of bases is what creates diversity. DNA does not actually make the organism, it only makes proteins. The DNA is transcribed into mrna and mrna is translated into protein, and the protein then forms the organism.

27 Recombinant DNA is the general name for taking a piece of one DNA and combining it with another strand of DNA. Thus, the name recombinant! Recombinant DNA is also sometimes referred to as "chimera."
28
29 Determining the Concentration of Double-Stranded DNA Determining the Concentration of Single-Stranded DNA Molecules Molecular Weight of DNA Oligonucleotide Quantitation To determine the purity of Nucleic acid
. Absorbance at 320 nm is used to detect any insoluble light-scattering components.")
30 Quantitation is typically performed by taking absorbance measurements at 260 nm, 280 nm, and 320 nm. Absorbance at 260 nm is used to specifically detect the nucleic acid component of a solution. Absorbance at 280 nm is used to detect the presence of protein (since tryptophan residues absorb at this wavelength). Absorbance at 320 nm is used to detect any insoluble light-scattering components. A spectrophotometer capable of providing a scan from 200 to 320 nm will yield maximum relevant information

31 Each of the four nucleotide bases has a slightly different absorption spectrum, and the spectrum of DNA is the average of them.

32 To determine the concentration of single-stranded DNA (ssdna) as a µg/ml amount, the following conversion factor is used: 1 OD of ssdna - 33µg /ml
33 The average molecular weight of a DNA base is approximately 330 Daltons (or 330 grams/mole). The average molecular weight of a DNA base pair is twice this, approximately 660 Daltons (or 660 grams/mole). These values can be used to calculate how much DNA is present in any biological source. For small singlestranded DNA molecules, such as synthetic Oligonucleotide, the molecular weight of the individual nucleotides can be added to determine the strand's total molecular weight (MW) according to the following formula: MW = (n A x 335.2) + (n c x 311.2) + (n c x 351.2) + (n T x 326.2) + P where n x is the number of nucleotides of A, C, G, or T in the Oligonucleotide and P is equal to for dephosphorylated (lacking an end phosphate group) or 40.0 for phosphorylated Oligonucleotide.
34 An amount of an Oligonucleotide express in terms of optical density (OD) units. An OD unit is the amount of Oligonucleotide dissolved in 1.0 ml giving an A260 of 1.00 in a cuvette with a 1-cm light path length. It is calculated by the equation: OD units = (A260 ) x (Oligonucleotide volume) x (dilution factor)
35 Certain of the subunits of nucleic acids (purines) have an absorbance maximum slightly below 260 nm while others (pyrimidines) have a maximum slightly above 260 nm. An A260/A280 ratio of 2.0 is characteristic of pure RNA An A260/A280 ratio of 1.8 is characteristic of pure DNA An A260/A280 of 0.6 is characteristic of pure protein A ratio of less than 1.7 means there is probably a contaminant in the solution, usually either protein or phenol. DNA Purity (A260/A280) = (A260 reading A320 reading) (A280 reading A320
36 William Kemp(1991), Organic Spectroscopy,3rd edition, MACMILAN, Canada. Kori S.S., Halkai M.A. (2000), Pharmaceutical Biotechnology, First Edition, Vallabh Prakashan, Efficient Offset Printers, Delhi. Robert M. Silverstein, Francis x. Webster, David J. Kiemle (2005), Spectrometric Identification of Organic Compound, 7th Edition, John Wiley and Sons, USA
37 Questions?


38
Spectroscopy: Introduction. Required reading Chapter 18 (pages ) Chapter 20 (pages )
 Chapter 20 (pages )") Spectroscopy: Introduction Required reading Chapter 18 (pages 378-397) Chapter 20 (pages 424-449) Spectrophotometry is any procedure that uses light to measure chemical concentrations Properties of Light
Spectroscopy: Introduction Required reading Chapter 18 (pages 378-397) Chapter 20 (pages 424-449) Spectrophotometry is any procedure that uses light to measure chemical concentrations Properties of Light
25 Instruments for Optical Spectrometry
 25 Instruments for Optical Spectrometry 25A INSTRUMENT COMPONENTS (1) source of radiant energy (2) wavelength selector (3) sample container (4) detector (5) signal processor and readout (a) (b) (c) Fig.
Spectroscopy. Page 1 of 8 L.Pillay (2012)
") Spectroscopy Electromagnetic radiation is widely used in analytical chemistry. The identification and quantification of samples using electromagnetic radiation (light) is called spectroscopy. Light has
Spectroscopy Electromagnetic radiation is widely used in analytical chemistry. The identification and quantification of samples using electromagnetic radiation (light) is called spectroscopy. Light has
Reference literature. (See: CHEM 2470 notes, Module 8 Textbook 6th ed., Chapters )
") September 17, 2018 Reference literature (See: CHEM 2470 notes, Module 8 Textbook 6th ed., Chapters 13-14 ) Reference.: https://slideplayer.com/slide/8354408/ Spectroscopy Usual Wavelength Type of Quantum
September 17, 2018 Reference literature (See: CHEM 2470 notes, Module 8 Textbook 6th ed., Chapters 13-14 ) Reference.: https://slideplayer.com/slide/8354408/ Spectroscopy Usual Wavelength Type of Quantum
Because light behaves like a wave, we can describe it in one of two ways by its wavelength or by its frequency.
 Light We can use different terms to describe light: Color Wavelength Frequency Light is composed of electromagnetic waves that travel through some medium. The properties of the medium determine how light
2001 Spectrometers. Instrument Machinery. Movies from this presentation can be access at
 2001 Spectrometers Instrument Machinery Movies from this presentation can be access at http://www.shsu.edu/~chm_tgc/sounds/sound.html Chp20: 1 Optical Instruments Instrument Components Components of various
Compact Knowledge: Absorbance Spectrophotometry. Flexible. Reliable. Personal.
 L A B O R A T O R Y C O M P E T E N C E Compact Knowledge: Absorbance Spectrophotometry Flexible. Reliable. Personal. The interaction of light with molecules is an essential and well accepted technique
Chemistry Instrumental Analysis Lecture 19 Chapter 12. Chem 4631
 Chemistry 4631 Instrumental Analysis Lecture 19 Chapter 12 There are three major techniques used for elemental analysis: Optical spectrometry Mass spectrometry X-ray spectrometry X-ray Techniques include:
Chapter 13 An Introduction to Ultraviolet/Visible Molecular Absorption Spectrometry
 Chapter 13 An Introduction to Ultraviolet/Visible Molecular Absorption Spectrometry 13A Measurement Of Transmittance and Absorbance Absorption measurements based upon ultraviolet and visible radiation
Course Details. Analytical Techniques Based on Optical Spectroscopy. Course Details. Textbook. SCCH 211: Analytical Chemistry I
 SCCH 211: Analytical Chemistry I Analytical Techniques Based on Optical Spectroscopy Course Details September 22 October 10 September 22 November 7 November 17 December 1 Topic Period Introduction to Spectrometric
Ultraviolet/ Visible Absorption Spectroscopy
 CHEM*3440 Ultraviolet/ Visible Absorption Spectroscopy Widely used in Chemistry. Perhaps the most widely used in Biological Chemistry. Easy to do. Very easy to do wrong. Understand your experiment. CHEM
Instrumental Analysis: Spectrophotometric Methods
 Instrumental Analysis: Spectrophotometric Methods 2007 By the end of this part of the course, you should be able to: Understand interaction between light and matter (absorbance, excitation, emission, luminescence,fluorescence,
10/2/2008. hc λ. νλ =c. proportional to frequency. Energy is inversely proportional to wavelength And is directly proportional to wavenumber
 CH217 Fundamentals of Analytical Chemistry Module Leader: Dr. Alison Willows Electromagnetic spectrum Properties of electromagnetic radiation Many properties of electromagnetic radiation can be described
Analytical Technologies in Biotechnology Prof. Dr. Ashwani K Sharma Department of Biotechnology Indian Institute of Technology, Roorkee
 Analytical Technologies in Biotechnology Prof. Dr. Ashwani K Sharma Department of Biotechnology Indian Institute of Technology, Roorkee Module - 6 Spectroscopic Techniques Lecture - 2 UV-Visible Spectroscopy
Design and Development of a Smartphone Based Visible Spectrophotometer for Analytical Applications
 Design and Development of a Smartphone Based Visible Spectrophotometer for Analytical Applications Bedanta Kr. Deka, D. Thakuria, H. Bora and S. Banerjee # Department of Physicis, B. Borooah College, Ulubari,
CHEM*3440. Photon Energy Units. Spectrum of Electromagnetic Radiation. Chemical Instrumentation. Spectroscopic Experimental Concept.
 Spectrum of Electromagnetic Radiation Electromagnetic radiation is light. Different energy light interacts with different motions in molecules. CHEM*344 Chemical Instrumentation Topic 7 Spectrometry Radiofrequency
Spectrophotometry. Dr. Shareef SHAIK ASST. PROFESSOR Pharmacology
 Spectrophotometry Dr. Shareef SHAIK ASST. PROFESSOR Pharmacology Content Introduction Beer-Lambert law Instrument Applications Introduction 3 Body fluids such as blood, csf and urine contain organic and
Spectrophotometry. Introduction
 Spectrophotometry Spectrophotometry is a method to measure how much a chemical substance absorbs light by measuring the intensity of light as a beam of light passes through sample solution. The basic principle
Analytical Spectroscopy Review
 Analytical Spectroscopy Review λ = wavelength ν = frequency V = velocity = ν x λ = 2.998 x 10 8 m/sec = c (in a vacuum) ν is determined by source and does not change as wave propogates, but V can change
Overview of Spectroscopy
 Overview of Spectroscopy A. Definition: Interaction of EM Radiation with Matter We see objects because they remit some part of the light falling on them from a source. We function as reflection/ transmission
Chemistry 311: Instrumentation Analysis Topic 2: Atomic Spectroscopy. Chemistry 311: Instrumentation Analysis Topic 2: Atomic Spectroscopy
 Topic 1: Atomic Spectroscopy Text: Chapter 12,13 & 14 Rouessac (~2 weeks) 1.0 Review basic concepts in Spectroscopy 2.0 Atomic Absorption and Graphite Furnace Instruments 3.0 Inductively Coupled Plasmas
Chem 310 rd. 3 Homework Set Answers
 -1- Chem 310 rd 3 Homework Set Answers 1. A double line labeled S 0 represents the _ground electronic_ state and the _ground vibrational_ state of a molecule in an excitation state diagram. Light absorption
R O Y G B V. Spin States. Outer Shell Electrons. Molecular Rotations. Inner Shell Electrons. Molecular Vibrations. Nuclear Transitions
 Spin States Molecular Rotations Molecular Vibrations Outer Shell Electrons Inner Shell Electrons Nuclear Transitions NMR EPR Microwave Absorption Spectroscopy Infrared Absorption Spectroscopy UV-vis Absorption,
Chem 155 Midterm Exam Page 1 of 10 Spring 2010 Terrill
 Chem 155 Midterm Exam Page 1 of 10 ame Signature 1. Mercury (Hg) is is believed to be hazardous to human neurological health at extremely low concentrations. Fortunately EPA Method 45.7 cold vapor atomic
World Journal of Pharmaceutical Research SJIF Impact Factor 8.074
 SJIF Impact Factor 8.074 Volume 7, Issue 11, 1170-1180. Review Article ISSN 2277 7105 DEVELOPMENT AND OPTIMIZATION OF UV-VIS SPECTROSCOPY - A REVIEW Govinda Verma* and Dr. Manish Mishra Shri Guru Ram Rai
MOLEBIO LAB #4: Using a Spectrophotometer
 Introduction: Spectrophotometry MOLEBIO LAB #4: Using a Spectrophotometer Many kinds of molecules interact with or absorb specific types of radiant energy in a predictable fashion. For example, when while
9/28/10. Visible and Ultraviolet Molecular Spectroscopy - (S-H-C Chapters 13-14) Valence Electronic Structure. n σ* transitions
 Valence Electronic Structure. n σ* transitions") Visible and Ultraviolet Molecular Spectroscopy - (S-H-C Chapters 13-14) Electromagnetic Spectrum - Molecular transitions Widely used in chemistry. Perhaps the most widely used in Biological Chemistry.
Visible and Ultraviolet Molecular Spectroscopy - (S-H-C Chapters 13-14) Electromagnetic Spectrum - Molecular transitions Widely used in chemistry. Perhaps the most widely used in Biological Chemistry.
COLORIMETER AND LAMBERT S-BEER S LAW. Shingala vaishali Sandha prafulla Tiwari Kuldeep
 COLORIMETER AND LAMBERT S-BEER S LAW Shingala vaishali Sandha prafulla Tiwari Kuldeep TOPIC What is colorimeter? Use of colorimeter. Component & It s function. Function of colorimeter. The principle of
levels. The signal is either absorbance vibrational and rotational energy levels or percent transmittance of the analyte
 1 In this chapter, absorption by molecules, rather than atoms, is considered. Absorption in the ultraviolet and visible regions occurs due to electronic transitions from the ground state to excited state.
C101-E111. Talk Letter. Vol.2 February 2009
 C101-E111 UV Talk Letter Vol.2 February 2009 UV Talk Letter UV Talk Letter The Structure of a Spectrophotometer Vol.2 February 2009 1.The Measurement Principle Used by a Spectrophotometer The basic measurement
UNIT I COLORIMETER AND SPECTROPHOTOMETERS PART A
 UNIT I COLORIMETER AND SPECTROPHOTOMETERS PART A 1. List any four elements used in spectrophotometers. 1.Radiant source 2.wavelength selector 3.photodetector 4.sample 2. What is meant by flame emission
Chapter 4 Scintillation Detectors
 Med Phys 4RA3, 4RB3/6R03 Radioisotopes and Radiation Methodology 4-1 4.1. Basic principle of the scintillator Chapter 4 Scintillation Detectors Scintillator Light sensor Ionizing radiation Light (visible,
Lecture 0. NC State University
 Chemistry 736 Lecture 0 Overview NC State University Overview of Spectroscopy Electronic states and energies Transitions between states Absorption and emission Electronic spectroscopy Instrumentation Concepts
Clinical Chemistry (CHE221) Professor Hicks Week 1. Statistics Made Slightly Less Boring and Introduction to Spectrophotometry. Accuracy vs Precision
 Professor Hicks Week 1. Statistics Made Slightly Less Boring and Introduction to Spectrophotometry. Accuracy vs Precision") Clinical Chemistry (CHE221) Professor Hicks Week 1 Statistics Made Slightly Less Boring and Introduction to Spectrophotometry 3 Accuracy vs Precision Precision is the consistency of a measurement made
Clinical Chemistry (CHE221) Professor Hicks Week 1 Statistics Made Slightly Less Boring and Introduction to Spectrophotometry 3 Accuracy vs Precision Precision is the consistency of a measurement made
Microplate Spectrophotometer
 Microplate Spectrophotometer Features Benefits Applications Bali, October 1999 Optical System Xenon Flashing Lamp Order Sorting Filters Monochromator Data Light collection Light Transfer Why are these
JABLONSKI DIAGRAM INTERACTIONS BETWEEN LIGHT AND MATTER LIGHT AS A WAVE LIGHT AS A PARTICLE 2/1/16. Photoelectric effect Absorp<on Emission ScaDering
 INTERACTIONS BETWEEN LIGHT AND MATTER LIGHT AS A WAVE Diffrac
UV-Vis spektrometrie. Brno 2016, Dominik Heger, Ústav chemie a RECETOX, MU
 UV-Vis spektrometrie Brno 2016, Dominik Heger, http://hegerd.sci.muni.cz/ Ústav chemie a RECETOX, MU Sluneční světlo What is UV-VIS spectroscopy measuring? Electronic transitions. l / nm 185-200 Vacuum-UV
Course: M.Sc (Chemistry) Analytical Chemistry Unit: III
 Analytical Chemistry Unit: III") Course: M.Sc (Chemistry) Analytical Chemistry Unit: III Syllabus: Principle of spectrophotometry Types of spectrophotometer Applications - Dissociation constants of an indicator simultaneous spectrophotometric
Course: M.Sc (Chemistry) Analytical Chemistry Unit: III Syllabus: Principle of spectrophotometry Types of spectrophotometer Applications - Dissociation constants of an indicator simultaneous spectrophotometric
Skoog Chapter 6 Introduction to Spectrometric Methods
 Skoog Chapter 6 Introduction to Spectrometric Methods General Properties of Electromagnetic Radiation (EM) Wave Properties of EM Quantum Mechanical Properties of EM Quantitative Aspects of Spectrochemical
Ultraviolet-Visible Spectroscopy
 Ultraviolet-Visible Spectroscopy Introduction to UV-Visible Absorption spectroscopy from 160 nm to 780 nm Measurement of transmittance Conversion to absorbance * A=-logT=εbc Measurement of transmittance
INTERNATIONAL JOURNAL OF INSTITUTIONAL PHARMACY AND LIFE SCIENCES
 International Journal of Institutional Pharmacy and Life Sciences 5(5): September-October 2015 INTERNATIONAL JOURNAL OF INSTITUTIONAL PHARMACY AND LIFE SCIENCES Pharmaceutical Sciences Review Article!!!
II. Spectrophotometry (Chapters 17, 19, 20)
") II. Spectrophotometry (Chapters 17, 19, 20) FUNDAMENTALS (Chapter 17) Spectrophotometry: any technique that uses light to measure concentrations (here: U and visible - ~190 800 nm) c = 2.99792 x 10 8 m/s
II. Spectrophotometry (Chapters 17, 19, 20) FUNDAMENTALS (Chapter 17) Spectrophotometry: any technique that uses light to measure concentrations (here: U and visible - ~190 800 nm) c = 2.99792 x 10 8 m/s
RINCIPLE OF COLORIMETER AND SPECTOPHOTOMETER AND VARIOUS TYPE OF ANALYSER USED IN CLINICAL BIOCHEMISTRY
 RINCIPLE OF COLORIMETER AND SPECTOPHOTOMETER AND VARIOUS TYPE OF ANALYSER USED IN CLINICAL BIOCHEMISTRY COLORIMETER What is colorimeter? Colorimetry. Principle of colorimeter. Beer's and Lambert's law.
FLAME PHOTOMETRY AIM INTRODUCTION
 FLAME PHOTOMETRY AIM INTRODUCTION Atomic spectroscopy is based on the absorption, emission or fluorescence process of light by atoms or elementary ions. Information for atomic scale is obtained in two
If you like us, please share us on social media. The latest UCD Hyperlibrary newsletter is now complete, check it out.
 Sign In Forgot Password Register username username password password Sign In If you like us, please share us on social media. The latest UCD Hyperlibrary newsletter is now complete, check it out. ChemWiki
Single Photon detectors
 Single Photon detectors Outline Motivation for single photon detection Semiconductor; general knowledge and important background Photon detectors: internal and external photoeffect Properties of semiconductor
Electronic Excitation by UV/Vis Spectroscopy :
 SPECTROSCOPY Light interacting with matter as an analytical tool III Pharm.D Department of Pharmaceutical Analysis SRM College Of Pharmacy,Katankulathur Electronic Excitation by UV/Vis Spectroscopy : X-ray:
Photoelectron spectroscopy Instrumentation. Nanomaterials characterization 2
 Photoelectron spectroscopy Instrumentation Nanomaterials characterization 2 RNDr. Věra V Vodičkov ková,, PhD. Photoelectron Spectroscopy general scheme Impact of X-ray emitted from source to the sample
UNIT 2 UV-VISIBLE SPECTROMETRY
 Molecular Spectroscopic Methods-I UNIT 2 UV-VISIBLE SPECTROMETRY Structure 2.1 Introduction Objectives 2.2 Origin and Characteristics of UV-VIS Spectrum Origin of UV-VIS spectrum Characteristics of UV-VIS
Chemistry 311: Instrumentation Analysis Topic 2: Atomic Spectroscopy. Chemistry 311: Instrumentation Analysis Topic 2: Atomic Spectroscopy
 Topic 2b: X-ray Fluorescence Spectrometry Text: Chapter 12 Rouessac (1 week) 4.0 X-ray Fluorescence Download, read and understand EPA method 6010C ICP-OES Winter 2009 Page 1 Atomic X-ray Spectrometry Fundamental
Absorption spectrometry summary
 Absorption spectrometry summary Rehearsal: Properties of light (electromagnetic radiation), dual nature light matter interactions (reflection, transmission, absorption, scattering) Absorption phenomena,
Fundamentals of modern UV-visible spectroscopy
 Fundamentals of modern UV-visible spectroscopy Primer Tony Owen Copyright Agilent Technologies 2000 All rights reserved. Reproduction, adaption, or translation without prior written permission is prohibited,
Chemistry Instrumental Analysis Lecture 8. Chem 4631
 Chemistry 4631 Instrumental Analysis Lecture 8 UV to IR Components of Optical Basic components of spectroscopic instruments: stable source of radiant energy transparent container to hold sample device
AS 101: Day Lab #2 Summer Spectroscopy
 Spectroscopy Goals To see light dispersed into its constituent colors To study how temperature, light intensity, and light color are related To see spectral lines from different elements in emission and
Chapter 18. Fundamentals of Spectrophotometry. Properties of Light
 Chapter 18 Fundamentals of Spectrophotometry Properties of Light Electromagnetic Radiation energy radiated in the form of a WAVE caused by an electric field interacting with a magnetic field result of
Absorption photometry
 The light Absorption photometry Szilvia Barkó University of Pécs, Faculty of Medicines, Dept. Biophysics February 2011 Transversal wave E Electromagnetic wave electric gradient vector wavelength The dual
Complete the following. Clearly mark your answers. YOU MUST SHOW YOUR WORK TO RECEIVE CREDIT.
 CHEM 322 Name Exam 3 Spring 2013 Complete the following. Clearly mark your answers. YOU MUST SHOW YOUR WORK TO RECEIVE CREDIT. Warm-up (3 points each). 1. In Raman Spectroscopy, molecules are promoted
Fundamentals of UV-visible spectroscopy
 Fundamentals of UV-visible spectroscopy A Primer Tony Owen Copyright Hewlett-Packard Company, 1996. All rights reserved. Reproduction, adaption, or translation without prior written permission is prohibited,
Reference. What is spectroscopy? What is Light? / EMR 11/15/2015. Principles of Spectroscopy. Processes in Spectroscopy
 Chapter 2 Principles of Spectroscopy EST 3203 Instrumental Analysis Rezaul Karim Environmental Science and Technology Jessore Science and Technology University Principles of Spectroscopy Electromagnetic
Chem Homework Set Answers
 Chem 310 th 4 Homework Set Answers 1. Cyclohexanone has a strong infrared absorption peak at a wavelength of 5.86 µm. (a) Convert the wavelength to wavenumber.!6!1 8* = 1/8 = (1/5.86 µm)(1 µm/10 m)(1 m/100
MOLECULAR AND ATOMIC SPECTROSCOPY
 MOLECULAR AND ATOMIC SPECTROSCOPY 1. General Background on Molecular Spectroscopy 3 1.1. Introduction 3 1.2. Beer s Law 5 1.3. Instrumental Setup of a Spectrophotometer 12 1.3.1. Radiation Sources 13 1.3.2.
Reflection = EM strikes a boundary between two media differing in η and bounces back
 Reflection = EM strikes a boundary between two media differing in η and bounces back Incident ray θ 1 θ 2 Reflected ray Medium 1 (air) η = 1.00 Medium 2 (glass) η = 1.50 Specular reflection = situation
Molecular spectroscopy in the ultraviolet and visible range
 Molecular spectroscopy in the ultraviolet and visible range Contents 1 The spectrum of electromagnetic radiation 2 The origin of UV/VIS spectra 3 The Beer-Lambert law 4 Design of UV/VIS spectrophotometers
Practical 1P4 Energy Levels and Band Gaps
 Practical 1P4 Energy Levels and Band Gaps What you should learn from this practical Science This practical illustrates some of the points from the lecture course on Elementary Quantum Mechanics and Bonding
Beer's Law and Data Analysis *
 OpenStax-CNX module: m15131 1 Beer's Law and Data Analysis * Mary McHale This work is produced by OpenStax-CNX and licensed under the Creative Commons Attribution License 2.0 1 Beer's Law and Data Analysis
Practical 1P4 Energy Levels and Band Gaps
 Practical 1P4 Energy Levels and Band Gaps What you should learn from this practical Science This practical illustrates some of the points from the lecture course on Elementary Quantum Mechanics and Bonding
SPECTROPHOTOMETRY AND SPECTROMETRY - CONCEPT AND APPLICATIONS
 SPECTROPHOTOMETRY AND SPECTROMETRY - CONCEPT AND APPLICATIONS Renjini A 1, Dani Dileep 2 1 Assistant Professor, Department of ECE, Rajadhani Institute of Engineering and Technology, Kerala, India 2 PG
GE Healthcare Life Sciences. Spectrophotometry. Handbook
 GE Healthcare Life Sciences Spectrophotometry Handbook Contents Spectrophotometry basics 3 What is spectrophotometry? 3 Definition 3 Lambert s Law 4 Beer s Law 4 Nucleic acid applications 6 Direct UV measurement
Introduction to Spectroscopic methods
 Introduction to Spectroscopic methods Spectroscopy: Study of interaction between light* and matter. Spectrometry: Implies a quantitative measurement of intensity. * More generally speaking electromagnetic
ATOMIC SPECROSCOPY (AS)
") ATOMIC ABSORPTION ANALYTICAL CHEMISTRY ATOMIC SPECROSCOPY (AS) Atomic Absorption Spectroscopy 1- Flame Atomic Absorption Spectreoscopy (FAAS) 2- Electrothermal ( Flame-less ) Atomic Absorption Spectroscopy
ATOMIC ABSORPTION ANALYTICAL CHEMISTRY ATOMIC SPECROSCOPY (AS) Atomic Absorption Spectroscopy 1- Flame Atomic Absorption Spectreoscopy (FAAS) 2- Electrothermal ( Flame-less ) Atomic Absorption Spectroscopy
The ROXI Colorimeter & Fluorimeter. Laboratory Application I. Colorimetric measurements via Beer s Law.
 The ROXI Colorimeter & Fluorimeter. Laboratory Application I. Colorimetric measurements via Beer s Law. Required Supplies & Costs: RGB LED; $1.95 Light Sensors; $3.95 ea 3-way switch; $6.54 3 ohm resistor;
2101 Atomic Spectroscopy
 2101 Atomic Spectroscopy Atomic identification Atomic spectroscopy refers to the absorption and emission of ultraviolet to visible light by atoms and monoatomic ions. It is best used to analyze metals.
Atomic Absorption Spectroscopy (AAS)
") Atomic Absorption Spectroscopy (AAS) Alex Miller ABC s of Electrochemistry 3/8/2012 Contents What is Atomic Absorption Spectroscopy? Basic Anatomy of an AAS system Theory of Operation Practical Operation
Atomic Absorption Spectroscopy (AAS) Alex Miller ABC s of Electrochemistry 3/8/2012 Contents What is Atomic Absorption Spectroscopy? Basic Anatomy of an AAS system Theory of Operation Practical Operation
GENERAL PHARMACOPOEIA MONOGRAPH
 MINISTRY OF HEALTH OF THE RUSSIAN FEDERATION GENERAL PHARMACOPOEIA MONOGRAPH Spectrophotometry in the ultraviolet GPM.1.2.1.1.0003.15 and visible spectral regions Replaces the SPRF X GPM, SPRF XI GPM,
Cork Institute of Technology. Summer 2005 Instrumental Analysis (Time: 3 Hours) Section A
 Section A") Cork Institute of Technology Higher Certificate in Science in Applied Biology Award (National Certificate in Science in Applied Biology Award) Answer FIVE questions; answer Section A, TWO questions from
Cork Institute of Technology Higher Certificate in Science in Applied Biology Award (National Certificate in Science in Applied Biology Award) Answer FIVE questions; answer Section A, TWO questions from
3 - Atomic Absorption Spectroscopy
 3 - Atomic Absorption Spectroscopy Introduction Atomic-absorption (AA) spectroscopy uses the absorption of light to measure the concentration of gas-phase atoms. Since samples are usually liquids or solids,
Analytical Chemistry II
 Analytical Chemistry II L4: Signal processing (selected slides) Computers in analytical chemistry Data acquisition Printing final results Data processing Data storage Graphical display https://www.creativecontrast.com/formal-revolution-of-computer.html
Spectroscopy Problem Set February 22, 2018
 Spectroscopy Problem Set February, 018 4 3 5 1 6 7 8 1. In the diagram above which of the following represent vibrational relaxations? 1. Which of the following represent an absorbance? 3. Which of following
FLS980 Series Reference Guide
 FLS980 Series Reference Guide Integrating Sphere for Measurements of Fluorescence Quantum Yields and Spectral Reflectance Revision 1 Copyrights Copyright 2016 Edinburgh Instruments Ltd. All rights reserved.
Spectrochemical methods
 Spectrochemical methods G. Galbács The interactions of radiations and matter are the subject of spectroscopy py or spectrochemical methods (also called spectrometry). Spectrochemical methods usually measure
Instrumental Technique: Cuvette. Md Rabiul Islam
 Instrumental Technique: Cuvette Md Rabiul Islam 16-7-2016 What is cuvette? A cuvette is a small tube of circular or square cross section, sealed at one end, made of plastic, glass, or fused quartz (for
JABLONSKI DIAGRAM 2/15/16
 INDICATE THE EXCITED AND GROUND SINGLET AND TRIPLET STATES. INDICATE THE FOLLOWING TRANSITIONS: ABSORPTION, FLUORESCENCE, PHOSPHORESCENCE, NONRADIATIVE DECAY, INTERNAL CONVERSION AND INTERSYSTEM CROSSING.
two slits and 5 slits
 Electronic Spectroscopy 2015January19 1 1. UV-vis spectrometer 1.1. Grating spectrometer 1.2. Single slit: 1.2.1. I diffracted intensity at relative to un-diffracted beam 1.2.2. I - intensity of light
very high temperature for excitation not necessary generally no plasma/arc/spark AAS
 Atomic Absorption Spectrometry (Chapter 9) AAS intrinsically more sensitive than AES similar atomization techniques to AES addition of radiation source high temperature for atomization necessary flame
X-Ray Photoelectron Spectroscopy (XPS)
") X-Ray Photoelectron Spectroscopy (XPS) Louis Scudiero http://www.wsu.edu/~scudiero; 5-2669 Fulmer 261A Electron Spectroscopy for Chemical Analysis (ESCA) The basic principle of the photoelectric effect
X-Ray Photoelectron Spectroscopy (XPS) Louis Scudiero http://www.wsu.edu/~scudiero; 5-2669 Fulmer 261A Electron Spectroscopy for Chemical Analysis (ESCA) The basic principle of the photoelectric effect
Astronomy. Optics and Telescopes
 Astronomy A. Dayle Hancock adhancock@wm.edu Small 239 Office hours: MTWR 10-11am Optics and Telescopes - Refraction, lenses and refracting telescopes - Mirrors and reflecting telescopes - Diffraction limit,
Model Answer (Paper code: AR-7112) M. Sc. (Physics) IV Semester Paper I: Laser Physics and Spectroscopy
 M. Sc. (Physics) IV Semester Paper I: Laser Physics and Spectroscopy") Model Answer (Paper code: AR-7112) M. Sc. (Physics) IV Semester Paper I: Laser Physics and Spectroscopy Section I Q1. Answer (i) (b) (ii) (d) (iii) (c) (iv) (c) (v) (a) (vi) (b) (vii) (b) (viii) (a) (ix)
Model Answer (Paper code: AR-7112) M. Sc. (Physics) IV Semester Paper I: Laser Physics and Spectroscopy Section I Q1. Answer (i) (b) (ii) (d) (iii) (c) (iv) (c) (v) (a) (vi) (b) (vii) (b) (viii) (a) (ix)
Chemistry Instrumental Analysis Lecture 18. Chem 4631
 Chemistry 4631 Instrumental Analysis Lecture 18 Instrumentation Radiation sources Hollow cathode lamp Most common source Consist of W anode and a cathode sealed in a glass tube filled with Ne or Ar. Hollow
Atomization. In Flame Emission
 FLAME SPECTROSCOPY The concentration of an element in a solution is determined by measuring the absorption, emission or fluorescence of electromagnetic by its monatomic particles in gaseous state in the
INTRODUCTION Atomic fluorescence spectroscopy ( AFS ) depends on the measurement of the emission ( fluorescence ) emitted from gasphase analyte atoms
 depends on the measurement of the emission ( fluorescence ) emitted from gasphase analyte atoms") INTRODUCTION Atomic fluorescence spectroscopy ( AFS ) depends on the measurement of the emission ( fluorescence ) emitted from gasphase analyte atoms that have been excited to higher energy levels by absorption
INTRODUCTION Atomic fluorescence spectroscopy ( AFS ) depends on the measurement of the emission ( fluorescence ) emitted from gasphase analyte atoms that have been excited to higher energy levels by absorption
Questions on Instrumental Methods of Analysis
 Questions on Instrumental Methods of Analysis 1. Which one of the following techniques can be used for the detection in a liquid chromatograph? a. Ultraviolet absorbance or refractive index measurement.
Basics of UV-Visible Spectroscopy *
 OpenStax-CNX module: m34525 1 Basics of UV-Visible Spectroscopy * Brittany L. Oliva-Chatelain Andrew R. Barron This work is produced by OpenStax-CNX and licensed under the Creative Commons Attribution
Diffractometer. Geometry Optics Detectors
 Diffractometer Geometry Optics Detectors Diffractometers Debye Scherrer Camera V.K. Pecharsky and P.Y. Zavalij Fundamentals of Powder Diffraction and Structural Characterization of Materials. Diffractometers
Chapter 15 Molecular Luminescence Spectrometry
 Chapter 15 Molecular Luminescence Spectrometry Two types of Luminescence methods are: 1) Photoluminescence, Light is directed onto a sample, where it is absorbed and imparts excess energy into the material
(i) Show that the energy of a single photon is about 3 x J.
 Show that the energy of a single photon is about 3 x J.") 1(a) A helium-neon laser emits red light of wavelength 6.3 x 10 7 m. (i) Show that the energy of a single photon is about 3 x 10 19 J. [2] The power of the laser beam is 1.0 mw. Show that about 3 x 10
1(a) A helium-neon laser emits red light of wavelength 6.3 x 10 7 m. (i) Show that the energy of a single photon is about 3 x 10 19 J. [2] The power of the laser beam is 1.0 mw. Show that about 3 x 10
Far UV Performance of the LAMBDA 850/950 UV/Vis and UV/Vis/NIR Research Spectrophotometers
 Far UV Performance of the LAMBDA 850/950 UV/Vis and UV/Vis/NIR Research Spectrophotometers UV/VIS AND UV/VIS/NIR SPECTROSCOPY A P P L I C A T I O N N O T E Summary The far UV region (generally covering
LC-4: Photoelectric Effect
 LC-4: Photoelectric Effect Lab Worksheet Name In this lab you investigate the photoelectric effect, one of the experiments whose explanation by Einstein forced scientists into accepting the ideas of quantum
Atomic Spectroscopy. Absorption and Emission Spectra. Lodovico Lappetito. SpettroscopiaAtomica - 15/07/2015 Pag. 1
 Atomic Spectroscopy Absorption and Emission Spectra Lodovico Lappetito SpettroscopiaAtomica - 15/07/2015 Pag. 1 Table of Contents Atomic Spectra... 3 Diffraction Grating Spectrometer... 4 Spectral Lamps...
ARC SPECTRUM OF IRON /COPPER / BRASS
 ARC PECTRUM OF IRON /COPPER / BRA Aim : To determine the wavelength of prominent lines in the emission spectrum of iron/ copper/ brass. Apparatus : Constant deviation spectrometer, dc voltage source, metal
Investigating Transition Metal Complexes
 Exercise 4 Investigating Transition Metal Complexes 4 Introduction Colour is a well known property of the transition metals. The colour produced as parts of the visible spectrum are due to electron transitions