Establishment of signaling interactions with cellular resolution for. every cell cycle of embryogenesis
|
|
|
- Kevin Logan
- 6 years ago
- Views:
Transcription
1 Genetics: Early Online, published on March 22, 2018 as /genetics Establishment of signaling interactions with cellular resolution for every cell cycle of embryogenesis Long Chen 1#, Vincy Wing Sze Ho 2#, Ming-Kin Wong 2#, Xiaotai Huang 3#, Lu-yan Chan 2, Hon Chun Kaoru Ng 2, Xiaoliang Ren 2, Hong Yan 1 & Zhongying Zhao 2,4* 1 Department of Electronic Engineering, City University of Hong Kong, Hong Kong, China; 2 Department of Biology, Hong Kong Baptist University, Hong Kong, China; 3 School of Computer Science and Technology, Xidian University, Xi'an, China; 4 State Key Laboratory of Environmental and Biological Analysis, Hong Kong Baptist University, Hong Kong, China # Co-first author * Corresponding author Zhongying Zhao, Ph. D. Department of Biology State Key Laboratory of Environmental and Biological Analysis Hong Kong Baptist University, Hong Kong zyzhao@hkbu.edu.hk Phone: Running title: Establishment of signaling interactions with cellular resolution Keywords: Cell contact, Notch signaling, Cell lineage, C. elegans, division asymmetry 1 Copyright 2018.
2 Abstract Intercellular signaling interaction plays a key role in breaking fate symmetry during animal 33 development. Identification of the signaling interaction at cellular resolution is technically 34 challenging, especially in a developing embryo. Here we develop a platform that allows 35 automated inference and validation of signaling interaction for every cell cycle of C. elegans 36 embryogenesis. This is achieved by generation of a systems-level cell contact map that consists of 37 1,114 highly confident intercellular contacts by modeling analysis and is validated through cell 38 membrane labeling coupled with cell lineage analysis. We apply the map to identify cell pairs 39 between which a Notch signaling interaction takes place. By generating expression patterns for 40 two ligands and two receptors of Notch signaling pathway with cellular resolution using 41 automated expression profiling technique, we are able to refine existing and identify novel Notch 42 interactions during C. elegans embryogenesis. Targeted cell ablation followed by cell lineage 43 analysis demonstrates the roles of signaling interactions over cell division in breaking fate 44 symmetry. We finally develop a website that allows online access to the cell-cell contact map for 45 mapping of other signaling interaction in the community. The platform can be adapted to establish 46 cellular interaction from any other signaling pathways. 47 2
3 48 49 Introduction Symmetry breaking in cell division timing and cell fate specification has long been a focus of 50 developmental biology. Intercellular signaling plays a key role in breaking these symmetries 51 (Yochem et al. 1988; Sawa 2012; Clevers and Nusse 2012; Greenwald 2013; Zacharias et al ) although maternal control is critical for establishing polarity during early development 53 (Rose and Gonczy 2014). For example, a Notch signaling interaction is necessary for fate 54 asymmetry between cells ABa and ABp (Mickey et al. 1996; Priess 2005); whereas a Wnt 55 interaction is required for both fate asymmetry and division asynchrony between cells EMS and 56 P2 in a four-cell Caenorhabditis elegans embryo(rocheleau et al. 1997). The Notch interaction is 57 achieved by a contact between the P2 that expresses a Notch ligand, apx-1, and the ABp but not 58 the ABa cell, although both the later cells express Notch receptor, glp-1 (Mickey et al. 1996). This 59 demonstrates that a contact between cells is essential for triggering a signaling interaction to drive 60 differential fate specification (Good et al. 2004). A similar scenario is observed for the Wnt 61 interaction between the EMS and the P2 cells, which is necessary for asymmetric division of the 62 former into MS and E cells during C. elegans embryogenesis (Goldstein 1992; Rocheleau et al ). Notably, the two pathways are used repeatedly throughout development in a cellular 64 context-dependent fashion to establish further asymmetries in fate specification or division timing 65 (Huang et al. 2007; Zacharias et al. 2015). For example, in a 12-cell C. elegans embryo, the four 66 great-granddaughters of AB express Notch receptor, GLP-1, but only two of them, i.e., ABalp and 67 ABara, are in contact with a Notch ligand-expressing cell, MS, leading to their differential 3
4 68 differentiation into mesodermal and ectodermal fates, respectively (Hutter and Schnabel 1994; 69 Shelton and Bowerman 1996). Importantly, signaling interactions from the same pathway may 70 have an opposite consequence depending on their timing or cellular context. For example, the first 71 Notch interaction inactivates its targets, tbx-37/38 (Good et al. 2004); whereas the second one 72 activates its targets including PHA-4, a FoxA transcription factor required for pharynx 73 organogenesis (Priess 2005). These time-dependent signaling events indicate that dissecting 74 signaling interactions with precise spatial and temporal resolution would be essential for a 75 thorough understanding of symmetry breaking during metazoan development. 76 One of the biggest challenges in defining a signaling interaction during embryogenesis is the 77 establishment of cell identity, especially in an embryo with a large number of cells (Keller et al ; Zacharias and Murray 2016). Another challenge is that one must have access to the cellular 79 expression patterns of signaling molecules for each cell cycle. These requirements inhibit 80 functional characterization of cellular signaling during rapid development. This is because 81 defining a signaling interaction requires knowledge on the identities of cell pairs that are in 82 contact with each other, with one expressing a ligand and the other a receptor. 83 The development of cell-tracking techniques using time-lapse 3D (hereafter referred to as 4D) 84 microscopy has greatly facilitated cell lineage analysis (Schnabel et al. 1997, 2006, Zhao et al , 2010b; Muzzey and van Oudenaarden 2009). In particular, a recently developed automated 86 lineaging technique allows routine tracing of cell division and single-cell expression profiling in a 87 C. elegans embryo up to 350 cells within approximately half an hour and up to the last round of 4
5 88 cell division of embryogenesis in about one day (Bao et al. 2006; Murray et al. 2008; Richards et 89 al. 2013; Du et al. 2014; Shah et al. 2017). This technique makes it possible to infer signaling 90 interaction at cellular resolution for every cell cycle (Fig. 1) because the output of automated 91 lineaging contains quantitative positional information for nuclei of all cells for every minute 92 during embryogenesis, thus allowing systematic modelling of cell contacts with exceptional 93 spatial and temporal resolution. A cell contact map up to the ~150-cell stage was reported for the 94 C. elegans embryo purely based on Voronoi modeling (Hench et al. 2009). However, the map 95 suffers from several caveats. First, it was generated using a single composite embryo assembled 96 from six different embryos, each of which was partially resolved for cell lineage. Given the 97 variability in embryo size, shape, and developmental timing (Hara and Kimura 2009; Greenan et 98 al. 2010; Moore et al. 2013; Ho et al. 2015), it would be problematic to superimpose the six 99 embryos into a single embryo for modeling of cell contact. Second, a thorough validation of the 100 modeling results was not performed. Many cell contacts that are brief in duration and/or have a 101 minimal contact area may not be consequential. As a result, a relatively high false-positive rate is 102 unavoidable without taking these issues into account. Finally, the map covers only the ~150-cell 103 stage, but a C. elegans embryo does not hatch until it develops into 558 cells (Sulston et al. 1983). 104 Therefore, a more reliable cell contact map that covers cells born at a later stage of embryogenesis 105 is necessary for dissecting cell signaling. Here, we present a platform that allows the automated 106 inference of cellular signaling for every cell cycle up to the ~350-cell C. elegans embryo. 107 Applying the platform to Notch signaling pathway demonstrated a consecutive signaling events 5
6 108 over cell cycles for breaking cell fate symmetry Results A time-lapse cell-contact map from 4- to 350-cell C. elegans embryo 112 To facilitate the precise assignment of cell pairs between which a potentially functional signaling 113 interaction takes place, we performed modeling analysis of cell-cell contact over the proliferative 114 stage of C. elegans embryogenesis from 4 to 350 cells. Specifically, 4D coordinates from wild-type embryos generated previously by automated lineaging (Ho et al. 2015) were 116 individually used as an input for the Voronoi algorithm to model cell surfaces, from which the 117 contacting area is computed between a cell pair (see Materials and Methods). Instead of using 118 partial 4D coordinates from different embryos, as in a previous study (Hench et al. 2009), the coordinate sets used here were each derived from single intact embryos, which minimizes the 120 issues associated with normalization steps for cell size, embryo shape and developmental timing. 121 It is conceivable that many cell contacts may not be relevant to cell signaling due either to their 122 short duration or small contact area. To increase the modeling accuracy, we adopted the following 123 criteria to define an effective cell contact, which is referred to as cell contact hereafter for 124 simplicity unless stated otherwise. First, a contact area is required to be at least 6.5% of the 125 average cell surface areas of all cells present at the same time point (Fig. 2A). Second, this 126 criterion must be satisfied for at least two consecutive time points (approximately 1.5 minutes per 127 time point) (Fig. 2C, see details below). Third, these two criteria must be reproducible in at least 6
7 128 95% of the 91 wild-type embryos (i.e., in 87 of 91 embryos; Fig. 2B). As a result, we predicted a 129 total of 1,114 cell contacts from the 4- to 350-cell stage (Table S1). The predicted contact areas 130 were highly reproducible among the 91 embryos with a Pearson correlation coefficient (r) of at 131 least 0.8 between any two independent embryos (Fig. 2D). The predicted cell contact can be 132 readily validated via ubiquitous and simultaneous labeling of cell membranes and nuclei with 133 resolved cell identities (Fig. 2E). 134 We adopted the criterion of a 6.5% contact area based on the well-established 2 nd Notch 135 interactions in the C. elegans embryo (Mickey et al. 1996). This interaction occurs between a 136 Notch ligand-expressing cell MS and two Notch receptor-expressing cells ABalp and ABara in a cell embryo, but not in their sisters (ABala and ABarp), which leads to specification of their 138 pharyngeal fate. We first individually computed the contact areas between MS and each of the 139 four AB descendants for the 91 wild-type embryos. Given the variability in contact area between 140 the embryos, we next plotted the occurrence of the four contacts (any contact with a contacting 141 area > 0) in the 91 embryos against the ratio of actual contact area relative to average cell surface 142 areas of all cells present at the current time point. Occurrence distributions of both individual (Fig. 143 S1) and aggregated (Fig. 2A) plots demonstrated a normal distribution. We observed a clear 144 demarcation between cell pairs with (between MS and ABala or ABarp) and without (between 145 MS and ABalp or ABara) a functional contact at a ratio of approximately 6.5% of the actual 146 contact area relative to the average cell surface area of all cells at the current time point (Fig. 2A). 147 We therefore used the ratio of 6.5% as a cutoff for defining an effective contact. Variability in 7
8 148 actual cell contact was observed not only between MS and the four AB descendants, but also in 149 other cells from cells in the 91 embryos (Fig. 2B). Therefore, we require that only if a 150 contact is reproducibly observed in 95% of all the 91 embryos, it can be defined as an effective 151 contact. To further reduce our false-positive rate in calling an effective cell contact, we require a 152 contact that lasts for at least two consecutive time points (approximately 3 minutes). We set this 153 filter because our temporal resolution is 1.5 minutes, meaning that the duration of any contact 154 shorter than this will be assigned as 1.5 minutes. This temporal requirement ensures that an 155 effective cell contact lasts for at least 1.5 minutes. 156 A previous study suggested the substantial effect of pressure applied to an embryo during imaging 157 on the prediction of cell-cell contact (Hench et al. 2009). We tested the effect of such pressure by 158 examining whether the hatching rates are similar between pressured (mounted) and unpressurized 159 (unmounted) embryos (those laid freely on an NGM plate). If the hatching rates are comparable, 160 after the hatched larvae grow up, whether their brood sizes are comparable. We found that all 161 mounted and unmounted embryos with 25 each hatched, and the brood sizes are also comparable 162 between the mounted and unmounted embryos (Fig. S2), suggesting that pressure applied on the 163 embryos for mounting was unlikely to have affects the important cell contacts during C. elegans 164 embryogenesis Comparison of performance between our and a previous contact map 167 A previous cell contact map was generated with a modeling algorithm similar to that used here 8
9 168 but using a single composite embryo assembled from six different embryos(hench et al. 2009). 169 The cell lineage for each embryo was partially resolved owing to the difficulty in establishing cell 170 identities on both sides of an embryo. Notably, the cell contact was defined mainly based on 171 whether there is any physical contact regardless of the size and duration of a contact, making it 172 prone to a relatively high false-positive rate. The spatial and temporal constrains we used for 173 modeling are expected to reduce the rate of false positives. 174 To compare the performances between our and the previous contact maps, we contrasted a subset 175 of cell contacts relevant to well-established Notch signaling interactions (Table 1). It was 176 expected that our modeling contacts would agree well with the contacts based on the 2 nd Notch 177 interactions because they were used as a training set for our contact modeling. Notably, nearly one 178 half of the cell contacts predicted previously were false positive when compared with the 179 experimentally verified ones whereas our predictions agreed well with the experimental data from 180 multiple Notch interactions (Table 1), indicating that our modeling method substantially 181 outperforms the previous method in terms of accuracy Lineal expression of Notch receptors and ligands derived from a single-copy transgene 184 Knowledge of the time-lapse expression of a ligand and its receptor of a signal pathway at the 185 cellular level with high temporal resolution is critical for assigning a cell pair between which a 186 signaling interaction takes place. However, such knowledge is either absent or present at poor 187 spatiotemporal resolution especially during the proliferative stage of embryogenesis, thus 9
10 188 preventing effective assignment of a signaling interaction. For example, existing expression 189 patterns on Notch pathway components in C. elegans were obtained through either a transgenic 190 study or antibody staining or their combination (Mello et al. 1994; Mickey et al. 1996; 191 Moskowitz and Rothman 1996). Most of the transgenic assays are based on extrachromosomal 192 arrays (Moskowitz and Rothman 1996) or biolistic bombardment (Murray et al. 2012). The 193 expression patterns generated from these transgenic strains may suffer from increased perdurance 194 of fluorescent reporter by extra copy of transgenes or uncertainty in regulatory sequences 195 incorporated into host cells. 196 To generate the embryonic expression pattern of a Notch component that more likely mimics its 197 native expression at cellular resolution for each cell cycle, we first produced multiple independent 198 transgenic strains carrying a single copy of a fusion between GFP and a promoter sequence from a 199 Notch component using the minimos technique (Frokjaer-Jensen et al. 2014), including two 200 functionally redundant receptors, lin-12 and glp-1, and two ligands, apx-1 and lag-2. A single 201 strain that showed consistent expression with at least one another transgenic copy was used to 202 map the reporter s lineal expression using automated lineaging and expression profiling 203 technology (Murray et al. 2008). glp-1 shows specific expression in the descendants of ABarpap 204 and ABplaaa (Fig. 3A, B, G and J). These will generate hypodermal cells found in the head 205 (Sulston et al. 1983). Dim expression was also observed in the descendants of MSaa and MSpa 206 (Fig. S2A, F). Notably, our expression patterns are roughly comparable with those derived from 207 the transgenic strains generated with biolistic bombardment in AB (Murray et al. 2012), but 10
11 208 expression was observed in more cells in the bombardment strains. Because the promoter 209 sequences are similar in size, it remains likely that the expression conferred by the single-copy 210 transgene may be too dim to be seen. Expression of the other Notch receptor, lin-12, is mainly 211 observed in the descendants of ABplp, ABprp and ABplaaa (Fig. 3C, D, H, J). No expression was 212 observed in the P1 sublineage (Fig. S3B, G). One Notch ligand, apx-1, showed expression mainly 213 in the descendants of ABala, ABpl(r)apaa (Fig. 3E, F, I, J), MSppapp and MSppppp (Fig. S3C, H). 214 We did not observe the expression of lag-2 in the ABalap descendants, as reported previously 215 (Moskowitz and Rothman 1996). A complete list of cell expressing Notch ligands and receptors 216 are shown in Table S2. When combined with the cell contact map, the lineal expression of these 217 Notch components at a 1.5-minute interval over development will not only allow validation of 218 existing Notch signaling interactions, especially at a stage with tens to hundreds of cells, but it 219 also holds promise for the identification of novel cell pairs between which a signaling interaction 220 may take place. We illustrate the applications in detail below Refinement of the proposed cell pairs for 3 rd Notch interaction in C. elegans embryo 223 The 3 rd Notch signaling between signaling cell ABalapp and signal-receiving cell ABplaaa was 224 proposed mainly based on the expression timing of a Notch ligand, lag-2, in ABalapp and a Notch 225 receptor, lin-12, in the ABplaaa (Moskowitz and Rothman 1996). To confirm the signaling 226 interaction and examine its functional redundancy, we took advantage of our time-lapse cellular 227 expression patterns of both Notch receptors and two different ligands and aligned them against 11
12 228 our modeled cell contacts. If a cell contact is observed between two cells with one expressing a 229 ligand and the other a receptor, it is plausible that a signaling interaction takes place between the 230 two. In addition to lag-2 (Moskowitz and Rothman 1996), we observed the expression of another 231 Notch ligand, apx-1, in the descendants of ABala (Fig. 3E). Our reporter assay revealed that both 232 Notch receptors, lin-12 and glp-1, are expressed in the left head precursor, ABplaaa (Fig. 3B, D). 233 Despite the expression of apx-1 in all of the descendants of ABala (Fig. 3E), only one of the 234 ABala daughters, ABalap, had cell contact with the left-head precursor, ABplaa, based on our 235 modeling results (Table S1), suggesting a specific signaling interaction between the two, which is 236 consistent with previous cell-ablation results (Hutter and Schnabel 1995; Moskowitz and 237 Rothman 1996). Notably, expression of the Notch ligand lag-2 and the Notch receptor lin-12 by 238 LacZ-based transgenic assay suggested the signaling interaction at a later stage (i.e., between 239 ABalapp and ABplaaa) (Moskowitz and Rothman 1996). However, our cell contact data suggest 240 that ABalapa may play a bigger role than ABalapp in signaling the left head precursor (Fig. 4). 241 The three cells stay in different z planes (Fig. 4A-C). Both daughters of ABalap express apx-1, 242 but the relative contact area with ABplaaa is much greater for ABalapa (16.6%) than for ABalapp 243 (5%) (Table S1). In addition, the daughters of ABalapa, but not those of ABalapp, are in contact 244 with those of the daughters of the left head precursor (Movie S1), which further supports the more 245 important role of ABalapa in signaling ABplaaa than ABalapp. These results suggest that the 246 signaling effect in cell fate specification is achieved through consecutive signaling in multiple 247 generations. It remains possible that two cells signal ABplaaa redundantly. Our reporter assay also 12
13 248 showed that both Notch receptors may be redundantly involved in the signaling event, refining the 249 previous finding that only a single ligand and receptor are involved in the third signaling event 250 (Moskowitz and Rothman 1996) Functional validation of the proposed cell pairs for the 3 rd Notch interaction 253 To experimentally validate the 3 rd Notch interaction, we first used cell membrane labeling 254 coupled with cell lineage analysis (see Materials and Methods). Specifically, we performed 4D 255 live-cell imaging of a C. elegans embryo ubiquitously expressing a nuclear and a membrane 256 marker from the 4-cell stage up to the desired stage as estimated by wild-type lineaging trees (Ho 257 et al. 2015). We then took a single 3D stack consisting of 110 focal planes for both GFP (nuclear) 258 and mcherry (membrane) channels, which were rendered as a 3D projection (Fig. 4D). The 4D 259 images allowed manual or automated tracing of cell identities, whereas the 3D projection 260 permitted establishment of cell boundaries (Fig. 4 A-C). In agreement with our modeling results, 261 the cell membrane labeling showed a higher confidence of contact with the left-head precursor by 262 cell ABalapa than by cell ABplapp (Fig. 4D-E). The contact seems not obvious in modeled cell 263 boundaries (Fig. 4F). This may be mainly due to the positional differences across the z axis. 264 We next verified whether the predicted signaling cell functions as expected using cell ablation 265 technique. Given that apx-1 is expressed in all ABala descendants, we decided to test whether the 266 signaling interaction takes place in multiple generations as stated above by a combination of cell 267 ablation and Notch target expression. We first ablated the cell ABala and examined the expression 13
14 268 of a Notch target, ref-1, that is known to be expressed in the precursors of both the left and right 269 heads (Neves and Priess 2005; Murray et al. 2012) (Fig. 4 G-H, Fig. S4A). As expected, ablation 270 of the cell led to the specific loss of ref-1 expression in the left-head precursor (Fig. 4H, Fig. S4A, 271 4A), demonstrating that the ligands expressed in this cell or its daughters are responsible for the 272 signaling interaction. We next ablated the posterior daughter of ABala, ABalap, and re-examined 273 the expression of ref-1. Interestingly, ablation of the cell abolished the ref-1 expression in the 274 posterior but not in the anterior descendants of ABplaaa (Fig. 4I and not shown), suggesting that 275 some other signaling cell is responsible for the ref-1 expression in the anterior descendants, or that 276 the lost function in ABalap may be compensated by other ligand-expressing cells. We finally 277 ablated the two daughters of ABalap (i.e., ABalapa and ABalapp). The former was proposed to be 278 the signaling cell for ABlpaaa (Moskowitz and Rothman 1996), whereas our modeling and 279 membrane labeling data supported a more important role for the latter in signaling ABplaaa (Fig A-E). Unexpectedly, we observed that the ref-1 expression in ABplaaa descendants after either 281 ablation was comparable to that of the wild type (Fig. 4J and data not shown, Figs. S4, S5C-E, 282 S6). Taken together, our results suggest that the induction of left-head specification is achieved by 283 a multiple round of signaling from consecutive cell cycles, which is especially true during the late 284 stage of embryogenesis. The results also suggest redundant features of Notch signaling in 285 regulating fate specification Identification of the proposed cell pairs for the 4 th Notch signaling in C. elegans embryo 14
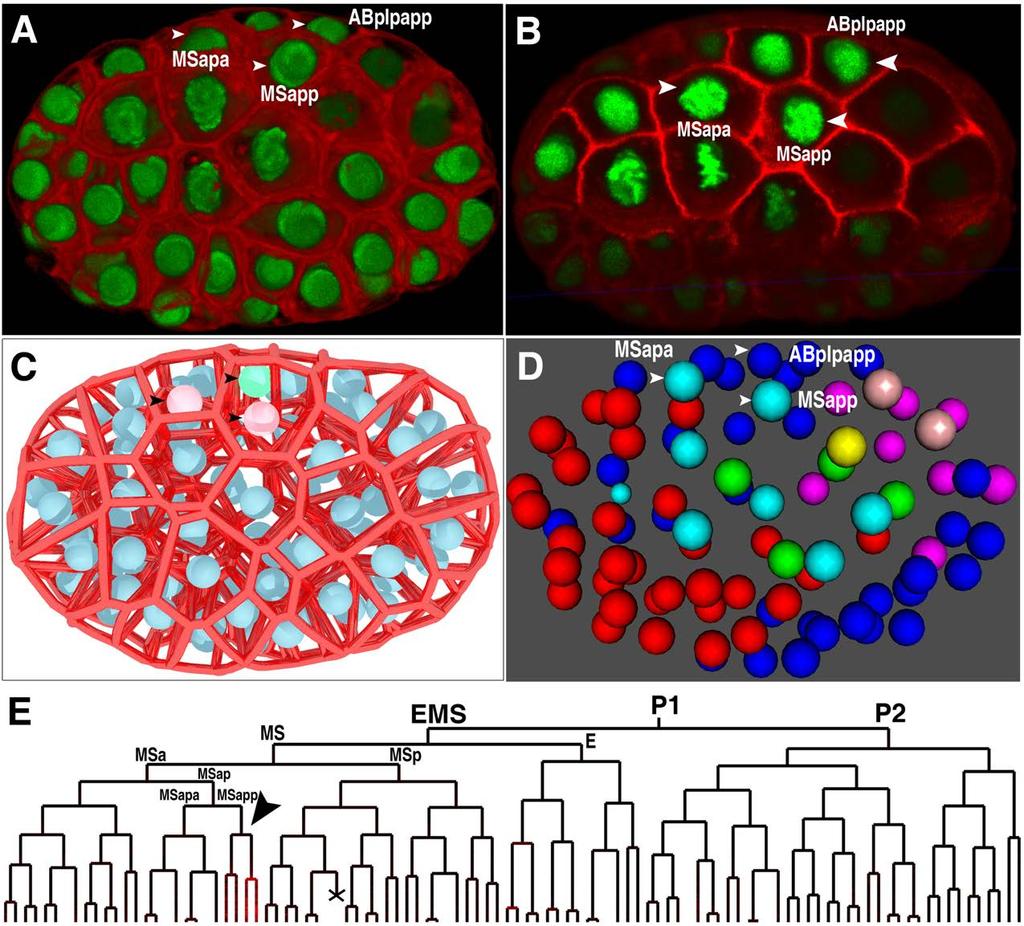
15 288 Previous studies suggested that one or both of the MSap daughters are the signaling cell(s) for 289 fate specification of ABplpapp, the great-grandparent of the excretory cell (a functional equivalent 290 of the human kidney), but the exact identities of the signaling cells remain elusive (Moskowitz 291 and Rothman 1996; Priess 2005). To establish the identity of the signaling cell, we first examined 292 our modeling results on cell contact, which suggest that only one of the MSap daughters (i.e, 293 MSapp but not MSapa) is in contact with the excretory cell precursor (Fig. 5, Table S1). 294 Consistent with this, a 3D projection of labeled cell membranes showed that it is MSapp but not 295 MSapa that is in contact with the ABplpapp cell (Fig. 5A-D, Movie S2). To further validate the 296 interaction between the two cells, we examined the lineal expression of both Notch ligands and 297 receptors. We observed that one Notch receptor, lin-12, was expressed in all descendants of 298 ABplp, the great-grandparent of ABplpapp (Fig. 3D). Consistent with our modeling results, the 299 GFP reporter of one Notch ligand, lag-2, was specifically expressed in MSapp but not in MSapa 300 (Fig. 5E, Fig. S3 D-E, I-J), further supporting that MSapp is the signaling cell for ABplpapp. 301 Notably, one daughter of MSapp, MSappa, was also in contact with ABplpapp, indicating that the 302 signaling interaction is further relayed in the next cell cycle Evidences of Notch signaling in later AB descendants 305 The transcription factor pal-1 is expressed in ABplppppp, the grandparent of the anal depressor 306 muscle and an intestinal muscle, and appears to be a direct target of Notch signaling required for 307 rectal development (Edgar et al. 2001). The signaling cells for this interaction appear to be 15
16 308 descendants of MSapa or MSapp (Priess 2005), but the exact identities of the signaling cells 309 remain elusive. Our modeling results predicted a reproducible cell contact between MSappp and 310 ABplpppp, the parent of ABplppppp (Fig. 6D, Table S1). Cell membrane labeling and a 311 space-filling model support the contact between the two cells (Fig. 6A-D), but not between 312 MSapa daughters and ABplpppp (Table S1), demonstrating that MSappp is more likely to be the 313 signaling cell for ABplpppp that is required for pal-1 expression in ABplppppp. 314 In a wild-type embryo of approximately the 300-cell stage, a contact between two bilaterally 315 symmetric AB descendants, ABplpapppp and ABprpapppp, appears to be required for a Notch 316 interaction for the former to develop into a neuron and a rectal epithelial cell (Bowerman et al ). Our modeling results predicted a contact between the two cells with a high level of 318 confidence (Table S1). Lineal expression of a Notch receptor, lin-12, was observed in 319 ABplpapppp (Fig. 3D) although that expression of both of our Notch ligands was not observed in 320 ABprpapppp, suggesting other Notch ligands may be involved in the interaction A web-based utility for access to the cell-cell contact data over C. elegans embryogenesis 323 To facilitate the intuitive use of our cell contact map, we developed a webpage that allows online 324 query and navigation of cell contacts over embryogenesis (Fig. S7). One can access the contacts 325 relevant to their cell of interest by searching for the cell name or by navigating through a lineage 326 tree. The output will show all cells that are in contact with the cell of interest in a graphical 327 representation in which the thickness of the bars is proportional to the predicted score of a 16
17 328 specific contact. The website is accessible through the link: Discussion Signaling interaction plays a key role in breaking of division symmetry during metazoan 332 development. Accurate and systematic identification of the interactions at cellular resolution 333 during development is critical for understanding molecular mechanism of symmetry breaking but 334 is technically challenging (Zacharias et al. 2015). This is especially true during a late proliferative 335 stage of embryogenesis due to the difficulties in establishing contacting cells and their identities 336 (Bao et al. 2006; Richards et al. 2013). It is also challenging to generate the native expression 337 dynamics of signaling molecules at cellular resolution for each cell cycle. 338 Here, we present an automated platform that allows accurate identification of signaling 339 interactions at cellular resolution during the proliferative stage of C. elegans embryogenesis. This 340 was achieved by a combination of computer modeling of cell contact, automated cell lineaging 341 and single-cell gene expression profiling. The cell contact map calibrated with both membrane 342 labeling and known signaling interactions lays a foundation for systematic identification of 343 signaling interactions. Applying the platform in C. elegans not only allows validation and 344 refinement of the existing Notch signaling interactions but also permits identification of multiple 345 novel signaling interactions especially during a relatively late embryonic stage. The method can 346 be applied to the characterization of any other signaling interactions. It should be noted that the 347 Voronoi modeling is an approximation of cell surface. Predicted interactions with a smaller 17
18 348 surface area in contact may or may not be functionally relevant. Alternatively, some functional 349 contacts might be missed out in our list due the empirical cutoff we used in the modeling process. 350 Functional test is required for making a functional calling of a functional contact. 351 Although many existing fate specifications were proposed to be triggered by a single signaling 352 event, our analyses suggest that fate specification may depend on multiple signaling interactions 353 that take place consecutively across cell divisions. For example, though our cell contact data and 354 membrane labeling results support that it is ABalapa that mediates the third Notch interaction (Fig ) instead of ABalapp as described previously (Moskowitz and Rothman 1996), ablation of either 356 ABalapa or ABalapp doesn't affect ref-1 expression in ABplaaa descendants. We propose that the 357 relay of signaling interactions over multiple generations may be a common practice for breaking 358 of division symmetry as suggested earlier based on lineal expression of Wnt components 359 (Zacharias et al. 2015). Alternatively, the interaction might be very brief. Once the signaling cell 360 is born the signaling event might happen very quickly and ablation of that cell soon after its birth 361 might not be enough to block the signaling interaction. We also observed frequent redundancy of 362 signaling interactions which may serve to increase the robustness of a developmental process. 363 All of the expression patterns for Notch ligands and receptors are derived from a fusion between 364 their promoter sequences and GFP with a heterogeneous 3 UTR from his-72. Therefore, these 365 vectors may capture only the zygotic but not maternal expression (Murray et al. 2008). In addition, 366 the arbitrarily chosen fragment may not necessarily contain all of the functional elements required 367 to drive its native expression. Because all of the expression patterns are derived from a 18
19 368 single-copy transgene, some of them may be too dim to be detectable. Therefore, certain 369 expressing cells or stages may be missing in our dataset. For example, the expression of lag-2 was 370 seen in ABala descendants by extrachromosomal array (Moskowitz and Rothman 1996), but not 371 in our transgenic strain (Fig. S3 D-E), which could be because the expression driven by a 372 single-copy transgene is too dim to be detected or because some cis-elements are lacking in the 373 promoter used. Use of a brighter reporter, for example, Ruby3 (Bajar et al. 2016), may facilitate 374 the visualization of single-copy transgenes. In summary, we present a new map of cell-cell 375 contacts in C. elegans embryogenesis. We applied the map together with 4D imaging-based 376 cell lineage analysis to refine previously described cell inductions. We finally develop a 377 website that potentially becomes a valuable resource to the C. elegans community for 378 intuitive and easy access to cell-cell contacts Materials and Methods Modeling of cell-cell contact 382 Prediction of cell surface is performed using the Voronoi segmentation algorithm (Franz 383 Aurenhammer 1991; Atsuyuki Okabe, Barry Boots 2000) with the "Voro++" library(rycroft 2009) 384 using the output from StarryNite as an input, which contains 3D coordinates for all nuclei at a minute interval from 4 to 350 cells of a C. elegans embryo. One caveat of the method is the 386 segmentation of the cells located at the edge of an embryo, where a false positive cell contact may 387 be predicted as reported previously (Hench et al. 2009). To solve this issue, for each embryo, a 19
20 388 3D convex hull was generated as a proxy for embryo boundary. Given the reproducible migration 389 of cells at the embryo boundary, cell surface and contact areas were computed with cells 390 coordinates and the 3D convex hull with Voro D coordinates from 91 wild-type C. elegans embryos were individually modeled to define cell 392 contacts for each time point (1.5 minute) for all embryos. To evaluate the variability of cell 393 contacts among embryos, cell contact areas were compared against each embryo using cell 394 stage, i.e., the number of cells in a given embryo, rather than the absolute developmental time. 395 This would minimize the complications associated with variability in developmental timing Visualization of cell boundary at desired stage 398 A strain ZZY0535 was made by crossing the lineaging strain RW10029 expressing GFP lineaging 399 markers with strain OD84 expressing a membrane marker, Ppie-1::mCherry::PH (PLC1delta1) 400 (see Table S3). The three markers were rendered triply homozygous. 401 For visualization of cell contact by fluorescence membrane labeling, a 4-cell embryo with desired 402 developmental timing was selected for 4D imaging with a Leica SP5 confocal microscope using 403 the similar settings as those used for automated lineaging till the embryo developed to the desired 404 stage. Timing for presence of a cell of interest was estimated based on our lineaging results of the wild-type embryos(ho et al. 2015). Imaging with live data mode was switched to normal mode 406 to take a single stack consisting of 110 focal planes with suitable AOTF compensation using a 407 pinhole of 1.6 AU and three-line accumulation. Images were acquired from both GFP and 20
21 408 mcherry channels. Identity of the cell of interest was resolved by manually navigating through 409 the image stacks using Leica Application Suite X (LAS X). The 3D stack of the embryo was used 410 to reconstruct the 3D volume projection with LAS X. The embryo was rotated to a proper 411 orientation to facilitate visualization of the desired cell boundary. Part of the embryo was cut open 412 across different axes for visualization of contact Cell ablation coupled with cell lineage analysis 415 For cell ablation coupled with automated lineaging, a 4-cell embryo with desired orientation was 416 selected for 4D-imaging till the cell targeted for ablation was born. Manual tracing of the 417 targeting cell was performed with the help of the lineaging markers. Immediately after the target 418 cell completed mitosis, imaging was terminated and the following procedures were performed 419 within 1.5 minutes: switch the imaging mode from live data mode to normal mode; focus on the 420 middle plane of the target cell nucleus by fine-tuning the Z-Galvo; select the bleaching point from 421 the panel and create a region of interest (ROI) in the middle of the target cell nucleus in a preview 422 panel; turn off all the fluorescence detectors except the one for the DIC and switch the filter to 423 "Substrate"; set the bleaching time (40 seconds for ABala, 20 seconds for all others); temporally 424 close the shutters for all the wavelengths except the pulsed diode laser (PDL 800-B, PicoQuant), 425 which emits 405nm laser beam; tune it to 100% intensity and start the bleaching; and once 426 completed, switch back to the live data mode and resume the 4D-imaging as usual
22 428 Generation of single-copy transgenic lines 429 Single-copy transgene consisting of a fusion between the promoter of a Notch ligand/receptor and 430 GFP was generated using minimos technique(frokjaer-jensen et al. 2014). The primer sequences 431 used for amplifying the promoter sequences were listed in Table S4. The minimos targeting 432 vector pcfj909 was modified to include a genomic coding region of his-24 upstream of the GFP 433 coding sequence to facilitate nuclear localization for automated lineal expression profiling as 434 described(zhao et al. 2010c). Multiple independent strains were produced for each promoter. A 435 single strain that shows expression patterns consistent with the remaining ones was genotyped by 436 inverse PCR and crossed with the lineaging strain RW Both lineaging and Notch markers 437 were rendered homozygous for automated lineaging and lineal expression profiling as 438 described(zhao et al. 2010c) D live cell imaging, automated lineaging and profiling of lineal gene expression 441 Imaging was performed in the similar way to that described previously(shao et al. 2013). Briefly, 442 lineaging strain, RW10226(Zhao et al. 2010a), ubiquitously expressing nuclear mcherry, was 443 crossed with the strain expressing a fusion between the promoter of a Notch component and GFP. 444 Both the lineaging markers and the promoter fusion were rendered homozygous before lineaging D imaging stacks (roughly 0.7 µm/stack) were sequentially collected for both GFP and RFP 446 (mcherry) channels at a 1.5-minute interval for a total of 240 time points using a Leica SP5 447 confocal microscope as described(shao et al. 2013). Automated profiling of lineal expression was 22
23 448 performed as described(zhao et al. 2010c) Worm strains and maintenance 451 All the animals were maintained on NGM plates seeded with OP50 at room temperature unless 452 stated otherwise. The genotypes of the strains used in this paper were listed in Table S Data availability 455 Strains are available upon request. The authors affirm that all data necessary for confirming the 456 conclusions of the article are present within the article, figures, and tables. Cell-cell contacts can 457 also be accessible through the following link: Acknowledgements We thank Mr. WS Chung for logistic support and helpful discussion with the members of Z 461 Zhao s laboratory. This work is supported by the Hong Kong Research Grants Council (Project 462 numbers HKBU5/CRF/11G, HKBU and HKBU ) and HKBU Faculty Research 463 Fund (FRG2/13-14/063), HKBU Strategic Development Fund for Environmental Genetics and 464 the National Natural Science Foundation of China (Project ) and the China Postdoctoral 465 Science Foundation (Project 2016M600769). Some of the strains used in this study were provided 466 by C. elegans Genetic Center, which is funded by NIH Office of Research Infrastructure 467 Programs (P40 OD010440). 23
24 Author contributions L.C modeled the cell contacts and H.C.K.N contributed to the dataset. M.K.W generated 3D 471 projections of membrane-labeling and performed cell ablation. V.W.S.H, L.Y.C and X.R made the 472 transgenic strains and produced lineal expressions. H.Y and Z.Z conceived the project. L.C and 473 Z.Z wrote the manuscript References Atsuyuki Okabe, Barry Boots K. S. & S. N. C., 2000 Spatial Tessellations Concepts and 477 Applications of Voronoi Diagrams. John Wiley. 478 Bajar B. T., Wang E. S., Lam A. J., Kim B. B., Jacobs C. L., et al., 2016 Improving brightness and 479 photostability of green and red fluorescent proteins for live cell imaging and FRET reporting. 480 Sci. Rep. 6: Bao Z., Murray J. I., Boyle T., Ooi S. L., Sandel M. J., et al., 2006 Automated cell lineage tracing 482 in Caenorhabditis elegans. Proc Natl Acad Sci U S A 103: Bowerman B., Tax F. E., Thomas J. H., Priess J. R., 1992 Cell interactions involved in 484 development of the bilaterally symmetrical intestinal valve cells during embryogenesis in 485 Caenorhabditis elegans. Development 116: Clevers H., Nusse R., 2012 Wnt/β-Catenin Signaling and Disease. Cell 149: Du Z., Santella A., He F., Tiongson M., Bao Z., 2014 De Novo Inference of Systems-Level 488 Mechanistic Models of Development from Live-Imaging-Based Phenotype Analysis. Cell 24
25 : Edgar L. G., Carr S., Wang H., Wood W. B., 2001 Zygotic Expression of the caudal Homolog 491 pal-1 Is Required for Posterior Patterning in Caenorhabditis elegans Embryogenesis. Dev. 492 Biol. 229: Franz Aurenhammer, 1991 Voronoi Diagrams A Survey of a Fundamental Geometric Data 494 Structure. ACM Comput. Surv. 23: Frokjaer-Jensen C., Davis M. W., Sarov M., Taylor J., Flibotte S., et al., 2014 Random and 496 targeted transgene insertion in Caenorhabditis elegans using a modified Mos1 transposon. 497 Nat. Methods 11: Goldstein B., 1992 Induction of gut in Caenorhabditis elegans embryos. Nature 357: Good K., Ciosk R., Nance J., Neves A., Hill R. J., et al., 2004 The T-box transcription factors 500 TBX-37 and TBX-38 link GLP-1/Notch signaling to mesoderm induction in C. elegans 501 embryos. Development 131: Greenan G., Brangwynne C. P., Jaensch S., Gharakhani J., Julicher F., et al., 2010 Centrosome 503 size sets mitotic spindle length in Caenorhabditis elegans embryos. Curr. Biol. 20: Greenwald I., 2013 Notch signaling: genetics and structure. WormBook: Hara Y., Kimura A., 2009 Cell-Size-Dependent Spindle Elongation in the Caenorhabditis elegans 506 Early Embryo. Curr. Biol. 19: Hench J., Henriksson J., Luppert M., Burglin T. R., 2009 Spatio-temporal reference model of 508 Caenorhabditis elegans embryogenesis with cell contact maps. Dev. Biol. 333:
26 509 Ho V. W., Wong M. K., An X., Guan D., Shao J., et al., 2015 Systems-level quantification of 510 division timing reveals a common genetic architecture controlling asynchrony and fate 511 asymmetry. Mol. Syst. Biol. 11: Huang S., Shetty P., Robertson S. M., Lin R., 2007 Binary cell fate specification during C. 513 elegans embryogenesis driven by reiterated reciprocal asymmetry of TCF POP-1 and its 514 coactivator -catenin SYS-1. Development 134: Hutter H., Schnabel R., 1994 glp-1 and inductions establishing embryonic axes in C. elegans. 516 Development 120: Hutter H., Schnabel R., 1995 Specification of anterior-posterior differences within the AB lineage 518 in the C. elegans embryo: a polarising induction. Development 121: Keller P. J., Schmidt A. D., Wittbrodt J., Stelzer E. H., 2008 Reconstruction of zebrafish early 520 embryonic development by scanned light sheet microscopy. Science (80-. ). 322: Mello C. C., Draper B. W., Priess J. R., 1994 The maternal genes apx-1 and glp-1 and 522 establishment of dorsal-ventral polarity in the early C. elegans embryo. Cell 77: Mickey K. M., Mello C. C., Montgomery M. K., Fire A., Priess J. R., 1996 An inductive 524 interaction in 4-cell stage C. elegans embryos involves APX-1 expression in the signalling 525 cell. Development 122: Moore J. L., Du Z., Bao Z., 2013 Systematic quantification of developmental phenotypes at 527 single-cell resolution during embryogenesis. Development 140: Moskowitz I. P., Rothman J. H., 1996 lin-12 and glp-1 are required zygotically for early 26
27 529 embryonic cellular interactions and are regulated by maternal GLP-1 signaling in 530 Caenorhabditis elegans. Development 122: Murray J. I., Bao Z., Boyle T. J., Boeck M. E., Mericle B. L., et al., 2008 Automated analysis of 532 embryonic gene expression with cellular resolution in C. elegans. Nat. Methods 5: Murray J. I., Boyle T. J., Preston E., Vafeados D., Mericle B., et al., 2012 Multidimensional 534 regulation of gene expression in the C. elegans embryo. Genome Res. 22: Muzzey D., Oudenaarden A. van, 2009 Quantitative time-lapse fluorescence microscopy in single 536 cells. Annu. Rev. Cell Dev. Biol. 25: Neves A., Priess J. R., 2005 The REF-1 family of bhlh transcription factors pattern C. elegans 538 embryos through Notch-dependent and Notch-independent pathways. Dev. Cell 8: Priess J. R., 2005 Notch signaling in the C. elegans embryo. WormBook 2007/12/01: Richards J. L., Zacharias A. L., Walton T., Burdick J. T., Murray J. I., 2013 A quantitative model 541 of normal Caenorhabditis elegans embryogenesis and its disruption after stress. Dev. Biol : Rocheleau C. E., Downs W. D., Lin R., Wittmann C., Bei Y., et al., 1997 Wnt signaling and an 544 APC-related gene specify endoderm in early C. elegans embryos. Cell 90: Rose L., Gonczy P., 2014 Polarity establishment, asymmetric division and segregation of fate 546 determinants in early C. elegans embryos. WormBook: Rycroft C. H., 2009 VORO++ : A three-dimensional Voronoi cell library in C++. Chaos An 548 Interdiscip. J. Nonlinear Sci. 19:
28 549 Sawa H., 2012 Control of Cell Polarity and Asymmetric Division in C. elegans. In: Current topics 550 in developmental biology,, pp Schnabel R., Hutter H., Moerman D., Schnabel H., 1997 Assessing normal embryogenesis in 552 Caenorhabditis elegans using a 4D microscope: variability of development and regional 553 specification. Dev. Biol. 184: Schnabel R., Bischoff M., Hintze A., Schulz A.-K., Hejnol A., et al., 2006 Global cell sorting in 555 the C. elegans embryo defines a new mechanism for pattern formation. Dev. Biol. 294: Shah P. K., Santella A., Jacobo A., Siletti K., Hudspeth A. J., et al., 2017 An In Toto Approach to 558 Dissecting Cellular Interactions in Complex Tissues. Dev. Cell 43: e Shao J., He K., Wang H., Ho W. S., Ren X., et al., 2013 Collaborative regulation of development 560 but independent control of metabolism by two epidermis-specific transcription factors in 561 Caenorhabditis elegans. J. Biol. Chem. 288: Shelton C. A., Bowerman B., 1996 Time-dependent responses to glp-1-mediated inductions in 563 early C. elegans embryos. Development 122: Sulston J. E., Schierenberg E., White J. G., Thomson J. N., 1983 The embryonic cell lineage of 565 the nematode Caenorhabditis elegans. Dev Biol 100: Yochem J., Weston K., Greenwald I., 1988 The Caenorhabditis elegans lin-12 gene encodes a 567 transmembrane protein with overall similarity to Drosophila Notch. Nature 335: Zacharias A. L., Walton T., Preston E., Murray J. I., 2015 Quantitative Differences in Nuclear 28
29 569 β-catenin and TCF Pattern Embryonic Cells in C. elegans. (PW Sternberg, Ed.). PLoS Genet : e Zacharias A. L., Murray J. I., 2016 Combinatorial decoding of the invariant C. elegans embryonic 572 lineage in space and time. Genesis 54: Zhao Z., Boyle T. J., Bao Z., Murray J. I., Mericle B., et al., 2008 Comparative analysis of 574 embryonic cell lineage between Caenorhabditis briggsae and Caenorhabditis elegans. Dev. 575 Biol. 314: Zhao Z., Flibotte S., Murray J. I., Blick D., Boyle T. J., et al., 2010a New tools for investigating 577 the comparative biology of Caenorhabditis briggsae and C. elegans. Genetics 184: Zhao Z., Flibotte S., Murray J. I., Blick D., Boyle T. J., et al., 2010b New tools for investigating 579 the comparative biology of Caenorhabditis briggsae and C. elegans. Genetics 184: Zhao Z., Boyle T. J., Liu Z., Murray J. I., Wood W. B., et al., 2010c A negative regulatory loop 581 between microrna and Hox gene controls posterior identities in Caenorhabditis elegans. 582 PLoS Genet. 6: e
30 584 Supporting Information Legends 585 Supporting Tables 586 Table S1. List of cell pairs between which an effective cell contact is called. 587 Table S2. List of cells expressing Notch ligands or receptors Table S3. List of strains and its genotypes Table S4. List of PCR primers for amplification of promoters for Notch ligands and receptors Supporting Figures Figure S1. Occurrence distribution of the ratio of modeled contact area between MS and ABalp (A) or ABara (B) relative to average total cell surface area at the current time point. Second Notch signaling interactions are well established between the two cell pairs. Figure S2. Comparison of brood sizes between unmounted (non-pressurized control) and mounted (mounting under pressure) embryos. Shown are boxplots of brood sizes that were scored from eight adults for each group with the total number of counted embryos indicated. Figure S3. Lineal and spatial expression of Notch components up to 350 cells. A-C. Lineal expression of two Notch receptors, glp-1 (A) and lin-12 (B), and a Notch ligand, apx-1 (C), in P1 sublineage. D-E. Lineal expression of a Notch ligand, lag-2, in ABa (D) and ABp (E) sublineage. F-I. Space-filling models showing spatial expression of the above four genes in a 350-cell C. elegans embryo. Brightness in red corresponds to expression intensity. J. Spatial expression of lag-2 based on their lineal origins in a 350-cell C. elegans embryo. ABalaappaa, red; ABalapapaa, blue; ABalppaaaa, pink; ABalppaapa, yellow; ABalappaaa, green; MSapp descendants, cyan. Figure S4. Lineal expression of ref-1 in ABa sublineage of embryos before (A) or after (B-E) cell ablation. Names of the ablated cells are indicated in parenthesis with approximate ablation timing indicated by an arrow. Note a loss of ref-1 expression in descendants of the ablated cells. Figure S5. Lineal expression of ref-1 in P1 sublineage of embryos before (A) or after (B-E) cell ablation. Programmed cell deaths are indicated with arrow. Figure S6. Lineal expression of ref-1 in ABa (A) or ABp (B) sublineages of embryos before (A) or after (B-E) ablation of ABalapp as indicated on the top of each lineage tree. Cell ablation is 30
31 indicated by arrowhead and the left head precursor, ABplaaa, is indicated by arrow. Figure S7. Screenshot of the output by searching website of C. elegans Cell-Cell Contact Map (CCCCM) using cell ABplaaa as a query. The querying cell is highlighted in red while its contacting cells in blue in both lineage tree (top, up to 350 cells) and network schematics (bottom). Relative contact area is shown in proportional to the thickness of the bar connecting contacting cells. Details of cell contact information are shown on the bottom right. Only contacts that satisfy our threshold are shown. Cells can also be queried using by navigating lineage tree as shown in bottom left. Supporting Movies Movie 1. A time-lapse movie showing the contacts between ABplaaa and ABalpap and those between their daughters. Movie 2. A time-lapse movie showing the contacts between excretory cell precursor, ABplpapp and MSapp. 31
32 Tables Table 1. Comparison of our cell contact map with a previous map(hench et al. 2009) and the 644 contacting cell pairs with known Notch signaling interaction Contacting cells Notch* Our map Previous map(hench et al. 2009) Remarks MS->ABalp Yes Yes 8/8 2 nd Notch MS->ABara Yes Yes 8/8 2 nd Notch ABalapa->ABplaaa Yes Yes 8/8 3 rd Notch ABalapp->ABplaaa Yes No# 8/8 3 rd Notch MSapp->ABplpapp? Yes 6/6 4 th Notch MSapa->ABplpapp? No 6/6 4 th Notch MSappp->ABplpppp? Yes 4/5 5 th Notch MS->ABala No No 1/8 2 nd Notch MS->ABarp No No 7/8 2 nd Notch ABarp->ABala No No 7/8 NA ABalp->ABarp No No 6/8 NA ABpla->ABpra No No 0 NA ABplp->ABpra No No 5/8 NA * existing knowledge on Notch signaling; NA: not applicable;? ambiguity in signaling cell 662 identity. # could be a false negative due to cutoff of contact area
33 Figure legends Fig 1. Overview of a 350-cell stage C. elegans embryo. A. Nomarski micrograph of a C. elegans 667 embryo of appropriate 350-cell stage. B. Epifluorescence micrograph showing superimposed 668 nuclear expression patterns of lineaging markers (red) and a pharynx marker, PHA-4 (green). C. 669 Superimposed micrograph from panels B and C. D. 3D space-filling model of a 350-cell embryo. 670 Cells are differentially color-coded based on their lineal origins. E. Cell lineage tree up to 350-cell 671 stage. Cell lineages are differentially colored based on cell fate except the undifferentiated cell 672 fates that are colored in black Fig 2. Modeling of cell-cell contact during C. elegans embryogenesis. A. Demarcation of the ratio 675 of contact areas between cells with and without a functional contact. Shown is the occurrence 676 distribution of modeled contact areas between cell pairs that are known to have (green) or not to 677 have (brown) the 2 nd Notch (see main text) interactions in 91 embryos. Percentage of contact area 678 out of average cell surface area of all cells in the current time point is plotted on x axis and the 679 number of embryos with a given ratio out of 91 wild types on y axis. B. Distribution of any 680 contacts (contact area >0) in 91 wild-type embryos. Y axis denotes the percentage of a given 681 contact out of all observed contacts and x axis the observed times for a given contact out of embryos. Contacts with over 95% reproducibility (i.e., observed in 87 out of 91 embryos) are 683 shaded in red. C. A diagram showing the definition of effective cell contact with cell A over 684 consecutive three time points. Contact area that is bigger or smaller than 6.5% of the average 33
34 685 surface areas of all the cells is differentially colored in red and blue lines respectively. For a given 686 cell pair, only cell contact area that is over 6.5% for at least two consecutive time point (around minutes) is defined as an effective cell contact. D. Heat map of mutual Pearson correlation's 688 coefficient (r) of contact areas for all cells between 91 individual wild type embryos. Both 689 horizontal and vertical axes denote the coefficient of an individual embryo against another. E. An 690 example of 40-cell C. elegans embryo expressing GFP in nuclei and membrane marker PH in cell 691 membrane (red) Fig 3. Expression of Notch ligands and receptors in C. elegans embryo. A-F. Lineal expression 694 (red) of two Notch receptors, glp-1and lin-12, and one ligand, apx-1, in ABa and ABp lineage up 695 to 350-cell stage. G-I. Spatial expression of the three genes differentially color coded based on 696 their lineal origins. J. Combined spatial expression patterns of the three genes between ligand, 697 apx-1, (red) and the two receptors, glp-1 and lin-12 (green) Fig 4. Refinement of 3 rd Notch signaling interaction in a 55-cell C. elegans embryo. A-C. 700 Epifluorescence micrographs of different focal planes of the same C. elegans embryo (dorsal view 701 with anterior to the left) focusing on cell ABplaaa (plane 26), ABalapa (plane 51) and ABalapp 702 (plane 72), respectively, as indicated by arrowhead. Cell membranes and nuclei are colored in red 703 and green respectively. D. 3D projection of epifluorescence micrographs. E. Cut-open view of the 704 3D projection in panel D showing cell boundaries. The projection is orientated to facilitate 34
35 705 visualization of the cell boundaries. F. Modeling of cell boundaries in an embryo at approximately 706 the same stage as in panel D. Nuclei of ABalapa and ABalapp are colored in red and indicated 707 with an a and p, respectively, and the remaining nuclei colored in blue; ABplaaa nucleus is 708 colored in green. G-J. Lineal expression of Pref-1::mCherry in ABp lineage of a wild-type 709 embryo (G) or embryos with cell ablation (ablated cell indicated in parenthesis). Target cells of 710 the 3 rd Notch signaling interaction are indicated with an arrowhead Fig 5. Refined 4 th Notch signaling interaction in C. elegans embryo. A. Shown is a 3D projection 713 of epifluorescence micrograph of an 87-cell embryo with cell membranes labelled by mcherry 714 (red) and nuclei by GFP. One or both of MSap daughters were previously proposed to signal 715 excretory cell precursor, ABplpapp. The three cells are indicated with an arrowhead. B. Cut-open 716 view of the same embryo as in panel A showing cell boundaries. The embryo is oriented so that 717 the boundaries of interest are most obvious. C. Modeling of cell boundaries of the same embryo 718 as in panel B with the same three cells indicated with an arrowhead. ABplpapp is colored in green 719 and two MSap daughters in red and the remaining nuclei in blue. D. 3D space-filling model of an 720 embryo at the same stage as in panel A. Red: ABa; dark blue: ABp; light blue: MS; green: E; pink: 721 C; brown: D; yellow: P4. The same three cells as in panel A are indicated with an arrowhead. E. 722 Lineal expression of a Notch ligand, lag-2, in MSapp (red) indicated with an arrowhead. Cell 723 death is indicated with an X
36 725 Fig 6. Identities of cells for fifth Notch signaling interaction in C. elegans embryo. A. 3D 726 projection of a 96-cell embryo with cell membranes and nuclei colored in red and green, 727 respectively. Signaling interaction was proposed to take place between two cells, MSappp (yellow 728 arrowhead) and ABplpppp (white arrow head). B. Cut-open view of the same embryo as in panel 729 A showing cell boundaries. C. 3D space-filling model of a 96-cell C. elegans embryo with cell 730 pairs similarly color coded as in panel A. D. Modeling of cell boundaries in a 96-cell C. elegans 731 embryo. Nuclei of MSappp and ABplpppp are colored in red and green, respectively and the 732 remaining nuclei in blue
37

38

39

40

41
42

43
Nature Biotechnology: doi: /nbt Supplementary Figure 1. Overexpression of YFP::GPR-1 in the germline.
 Supplementary Figure 1 Overexpression of YFP::GPR-1 in the germline. The pie-1 promoter and 3 utr were used to express yfp::gpr-1 in the germline. Expression levels from the yfp::gpr-1(cai 1.0)-expressing
Systems-level quantification of division timing reveals a common genetic architecture controlling asynchrony and fate asymmetry
 Download date: 15/04/2019 Systems-level quantification of division timing reveals a common genetic architecture controlling asynchrony and fate asymmetry Ho, Vincy Wing Sze; Wong, Ming-Kin; An, Xiaomeng;
Chapter 11. Development: Differentiation and Determination
 KAP Biology Dept Kenyon College Differential gene expression and development Mechanisms of cellular determination Induction Pattern formation Chapter 11. Development: Differentiation and Determination
Developmental switches and gene regulatory networks in the most completely described animal, the nematode C. elegans
 Developmental switches and gene regulatory networks in the most completely described animal, the nematode. elegans Joel Rothman U Santa Barbara Generating developmental diversity: Symmetry breaking Dr.
interactions and are regulated by maternal GLP-1 signaling in Caenorhabditis
 Development 122, 4105-4117 (1996) Printed in Great ritain The Company of iologists Limited 1996 DEV3495 4105 lin-12 and glp-1 are required zygotically for early embryonic cellular interactions and are
Chapter 18 Lecture. Concepts of Genetics. Tenth Edition. Developmental Genetics
 Chapter 18 Lecture Concepts of Genetics Tenth Edition Developmental Genetics Chapter Contents 18.1 Differentiated States Develop from Coordinated Programs of Gene Expression 18.2 Evolutionary Conservation
NIH Public Access Author Manuscript Nat Methods. Author manuscript; available in PMC 2008 September 26.
 NIH Public Access Author Manuscript Published in final edited form as: Nat Methods. 2008 August ; 5(8): 703 709. doi:10.1038/nmeth.1228. Automated analysis of embryonic gene expression with cellular resolution
Unicellular: Cells change function in response to a temporal plan, such as the cell cycle.
 Spatial organization is a key difference between unicellular organisms and metazoans Unicellular: Cells change function in response to a temporal plan, such as the cell cycle. Cells differentiate as a
Establishment of POP-1 asymmetry in early C. elegans embryos
 Development 130, 3547-3556 2003 The Company of Biologists Ltd doi:10.1242/dev.00563 3547 Establishment of POP-1 asymmetry in early C. elegans embryos Frederick D. Park and James R. Priess Division of Basic
Midterm 1. Average score: 74.4 Median score: 77
 Midterm 1 Average score: 74.4 Median score: 77 NAME: TA (circle one) Jody Westbrook or Jessica Piel Section (circle one) Tue Wed Thur MCB 141 First Midterm Feb. 21, 2008 Only answer 4 of these 5 problems.
Caenorhabditis elegans
 Caenorhabditis elegans Why C. elegans? Sea urchins have told us much about embryogenesis. They are suited well for study in the lab; however, they do not tell us much about the genetics involved in embryogenesis.
Figure S1. Programmed cell death in the AB lineage occurs in temporally distinct
 SUPPLEMENTAL FIGURE LEGENDS Figure S1. Programmed cell death in the AB lineage occurs in temporally distinct waves. (A) A representative sub-lineage (ABala) of the C. elegans lineage tree (adapted from
Cell Fate Specification in the C. elegans Embryo
 a DEVELOPMENTAL DYNAMICS 239:1315 1329, 2010 SPECIAL ISSUE REVIEWS A PEER REVIEWED FORUM Cell Fate Specification in the C. elegans Embryo Morris F. Maduro* Cell specification requires that particular subsets
Combinatorial specification of blastomere identity by glp-1-dependent cellular interactions in the nematode Caenorhabditis elegans
 Development 20, 3325-3338 (994) Printed in Great Britain The Company of Biologists Limited 994 3325 Combinatorial specification of blastomere identity by glp--dependent cellular interactions in the nematode
MBios 401/501: Lecture 14.2 Cell Differentiation I. Slide #1. Cell Differentiation
 MBios 401/501: Lecture 14.2 Cell Differentiation I Slide #1 Cell Differentiation Cell Differentiation I -Basic principles of differentiation (p1305-1320) -C-elegans (p1321-1327) Cell Differentiation II
Early Development in Invertebrates
 Developmental Biology Biology 4361 Early Development in Invertebrates October 25, 2006 Early Development Overview Cleavage rapid cell divisions divisions of fertilized egg into many cells Gastrulation
POP-1 and Anterior Posterior Fate Decisions in C. elegans Embryos
 Cell, Vol. 92, 229 239, January 23, 1998, Copyright 1998 by Cell Press POP-1 and Anterior Posterior Fate Decisions in C. elegans Embryos Rueyling Lin, Russell J. Hill, and James R. Priess* Division of
Wnt-dependent spindle polarization in the early C. elegans embryo
 Seminars in Cell & Developmental Biology 17 (2006) 204 213 Review Wnt-dependent spindle polarization in the early C. elegans embryo Timothy D. Walston a, Jeff Hardin a,b, a Laboratory of Genetics, University
178 Part 3.2 SUMMARY INTRODUCTION
 178 Part 3.2 Chapter # DYNAMIC FILTRATION OF VARIABILITY WITHIN EXPRESSION PATTERNS OF ZYGOTIC SEGMENTATION GENES IN DROSOPHILA Surkova S.Yu. *, Samsonova M.G. St. Petersburg State Polytechnical University,
Chapter 4 Evaluating a potential interaction between deltex and git in Drosophila: genetic interaction, gene overexpression and cell biology assays.
 Evaluating a potential interaction between deltex and git in Drosophila: genetic interaction, gene overexpression and cell biology assays. The data described in chapter 3 presented evidence that endogenous
Supplementary Materials for
 www.sciencesignaling.org/cgi/content/full/6/301/ra98/dc1 Supplementary Materials for Regulation of Epithelial Morphogenesis by the G Protein Coupled Receptor Mist and Its Ligand Fog Alyssa J. Manning,
Upstream Elements Regulating mir-241 and mir-48 Abstract Introduction
 Upstream Elements Regulating mir-241 and mir-48 Hanna Vollbrecht, Tamar Resnick, and Ann Rougvie University of Minnesota: Twin Cities Undergraduate Research Scholarship 2012-2013 Abstract Caenorhabditis
Figure 1. Automated 4D detection and tracking of endosomes and polarity markers.
 A t = 0 z t = 90 B t = 0 z t = 90 C t = 0-90 t = 0-180 t = 0-300 Figure 1. Automated 4D detection and tracking of endosomes and polarity markers. A: Three different z planes of a dividing SOP shown at
Wan-Ju Liu 1,2, John S Reece-Hoyes 3, Albertha JM Walhout 3 and David M Eisenmann 1*
 Liu et al. BMC Developmental Biology 2014, 14:17 RESEARCH ARTICLE Open Access Multiple transcription factors directly regulate Hox gene lin-39 expression in ventral hypodermal cells of the C. elegans embryo
purpose of this Chapter is to highlight some problems that will likely provide new
 119 Chapter 6 Future Directions Besides our contributions discussed in previous chapters to the problem of developmental pattern formation, this work has also brought new questions that remain unanswered.
Segment boundary formation in Drosophila embryos
 Segment boundary formation in Drosophila embryos Development 130, August 2003 Camilla W. Larsen, Elizabeth Hirst, Cyrille Alexandre and Jean Paul Vincent 1. Introduction: - Segment boundary formation:
arxiv: v1 [stat.ap] 16 Sep 2015
![arxiv: v1 [stat.ap] 16 Sep 2015](/thumbs/91/106662330.jpg "arxiv: v1 [stat.ap] 16 Sep 2015") The Annals of Applied Statistics 2015, Vol. 9, No. 2, 950 968 DOI: 10.1214/15-AOAS820 c Institute of Mathematical Statistics, 2015 arxiv:1509.04872v1 [stat.ap] 16 Sep 2015 BAYESIAN DETECTION OF EMBRYONIC
The Annals of Applied Statistics 2015, Vol. 9, No. 2, 950 968 DOI: 10.1214/15-AOAS820 c Institute of Mathematical Statistics, 2015 arxiv:1509.04872v1 [stat.ap] 16 Sep 2015 BAYESIAN DETECTION OF EMBRYONIC
Axis Specification in Drosophila
 Developmental Biology Biology 4361 Axis Specification in Drosophila November 2, 2006 Axis Specification in Drosophila Fertilization Superficial cleavage Gastrulation Drosophila body plan Oocyte formation
Big Idea 3: Living systems store, retrieve, transmit and respond to information essential to life processes. Tuesday, December 27, 16
 Big Idea 3: Living systems store, retrieve, transmit and respond to information essential to life processes. Enduring understanding 3.B: Expression of genetic information involves cellular and molecular
SUPPLEMENTARY INFORMATION
 doi:10.1038/nature11589 Supplementary Figure 1 Ciona intestinalis and Petromyzon marinus neural crest expression domain comparison. Cartoon shows dorsal views of Ciona mid gastrula (left) and Petromyzon
SUPPLEMENTARY INFORMATION
 Supplementary Discussion Rationale for using maternal ythdf2 -/- mutants as study subject To study the genetic basis of the embryonic developmental delay that we observed, we crossed fish with different
1. What are the three general areas of the developing vertebrate limb? 2. What embryonic regions contribute to the developing limb bud?
 Study Questions - Lecture 17 & 18 1. What are the three general areas of the developing vertebrate limb? The three general areas of the developing vertebrate limb are the proximal stylopod, zeugopod, and
SUPPLEMENTARY INFORMATION
 med!1,2 Wild-type (N2) end!3 elt!2 5 1 15 Time (minutes) 5 1 15 Time (minutes) med!1,2 end!3 5 1 15 Time (minutes) elt!2 5 1 15 Time (minutes) Supplementary Figure 1: Number of med-1,2, end-3, end-1 and
Developmental Biology Lecture Outlines
 Developmental Biology Lecture Outlines Lecture 01: Introduction Course content Developmental Biology Obsolete hypotheses Current theory Lecture 02: Gametogenesis Spermatozoa Spermatozoon function Spermatozoon
Axis Specification in Drosophila
 Developmental Biology Biology 4361 Axis Specification in Drosophila November 6, 2007 Axis Specification in Drosophila Fertilization Superficial cleavage Gastrulation Drosophila body plan Oocyte formation
Possible mechanisms for initiating macroscopic left-right asymmetry in developing organisms
 Possible mechanisms for initiating macroscopic left-right asymmetry in developing organisms Chris Henley, Ricky Chachra, Jimmy Shen Cornell U. [Support: U.S. Dept. of Energy] APS March Meeting, Mar. 2,
University of Massachusetts Medical School Wan-Ju Liu University of Maryland
 University of Massachusetts Medical School escholarship@umms Program in Systems Biology Publications and Presentations Program in Systems Biology 5-13-2014 Multiple transcription factors directly regulate
Multiple levels of regulation specify the polarity of an asymmetric cell division in C. elegans
 Development 127, 4587-4598 (2) Printed in Great Britain The Company of Biologists Limited 2 DEV4424 4587 Multiple levels of regulation specify the polarity of an asymmetric cell division in C. elegans
Reading: Chapter 5, pp ; Reference chapter D, pp Problem set F
 Mosaic Analysis Reading: Chapter 5, pp140-141; Reference chapter D, pp820-823 Problem set F Twin spots in Drosophila Although segregation and recombination in mitosis do not occur at the same frequency
Cells to Tissues. Peter Takizawa Department of Cell Biology
 Cells to Tissues Peter Takizawa Department of Cell Biology From one cell to ensembles of cells. Multicellular organisms require individual cells to work together in functional groups. This means cells
Analysis and Simulation of Biological Systems
 Analysis and Simulation of Biological Systems Dr. Carlo Cosentino School of Computer and Biomedical Engineering Department of Experimental and Clinical Medicine Università degli Studi Magna Graecia Catanzaro,
Three different fusions led to three basic ideas: 1) If one fuses a cell in mitosis with a cell in any other stage of the cell cycle, the chromosomes
 If one fuses a cell in mitosis with a cell in any other stage of the cell cycle, the chromosomes") Section Notes The cell division cycle presents an interesting system to study because growth and division must be carefully coordinated. For many cells it is important that it reaches the correct size
Section Notes The cell division cycle presents an interesting system to study because growth and division must be carefully coordinated. For many cells it is important that it reaches the correct size
Supplementary Figure 1: Mechanism of Lbx2 action on the Wnt/ -catenin signalling pathway. (a) The Wnt/ -catenin signalling pathway and its
 The Wnt/ -catenin signalling pathway and its") Supplementary Figure 1: Mechanism of Lbx2 action on the Wnt/ -catenin signalling pathway. (a) The Wnt/ -catenin signalling pathway and its transcriptional activity in wild-type embryo. A gradient of canonical
Supplementary Figure 1: Mechanism of Lbx2 action on the Wnt/ -catenin signalling pathway. (a) The Wnt/ -catenin signalling pathway and its transcriptional activity in wild-type embryo. A gradient of canonical
Green Fluorescent Protein (GFP) Today s Nobel Prize in Chemistry
 Today s Nobel Prize in Chemistry") In the news: High-throughput sequencing using Solexa/Illumina technology The copy number of each fetal chromosome can be determined by direct sequencing of DNA in cell-free plasma from pregnant women Confession:
In the news: High-throughput sequencing using Solexa/Illumina technology The copy number of each fetal chromosome can be determined by direct sequencing of DNA in cell-free plasma from pregnant women Confession:
Why Flies? stages of embryogenesis. The Fly in History
 The Fly in History 1859 Darwin 1866 Mendel c. 1890 Driesch, Roux (experimental embryology) 1900 rediscovery of Mendel (birth of genetics) 1910 first mutant (white) (Morgan) 1913 first genetic map (Sturtevant
Specification of the C. elegans MS blastomere by the T-box factor TBX-35
 Development epress online publication date 10 July 2006 RESEARCH ARTICLE 3097 Development 133, 3097-3106 (2006) doi:10.1242/dev.02475 Specification of the C. elegans MS blastomere by the T-box factor TBX-35
Life Sciences For NET & SLET Exams Of UGC-CSIR. Section B and C. Volume-08. Contents A. BASIC CONCEPT OF DEVELOPMENT 1
 Section B and C Volume-08 Contents 5. DEVELOPMENTAL BIOLOGY A. BASIC CONCEPT OF DEVELOPMENT 1 B. GAMETOGENESIS, FERTILIZATION AND EARLY DEVELOPMENT 23 C. MORPHOGENESIS AND ORGANOGENESIS IN ANIMALS 91 0
C. elegans L1 cell adhesion molecule functions in axon guidance
 C. elegans L1 cell adhesion molecule functions in axon guidance Biorad Lihsia Chen Dept. of Genetics, Cell Biology & Development Developmental Biology Center C. elegans embryogenesis Goldstein lab, UNC-Chapel
Supplementary Figure 1. Phenotype of the HI strain.
 Supplementary Figure 1. Phenotype of the HI strain. (A) Phenotype of the HI and wild type plant after flowering (~1month). Wild type plant is tall with well elongated inflorescence. All four HI plants
AP Biology Gene Regulation and Development Review
 AP Biology Gene Regulation and Development Review 1. What does the regulatory gene code for? 2. Is the repressor by default active/inactive? 3. What changes the repressor activity? 4. What does repressor
Supplementary Materials for
 advances.sciencemag.org/cgi/content/full/3/5/e1602426/dc1 Supplementary Materials for In vivo mapping of tissue- and subcellular-specific proteomes in Caenorhabditis elegans The PDF file includes: Aaron
AP3162D: Lecture 4 - Basic modelling frameworks for developmental biology and cell-fate decisions
 AP162D: Lecture 4 - Basic modelling frameworks for developmental biology and cell-fate decisions Hyun Youk Delft University of Technology (Dated: March 15, 2018) In this lecture, we will derive the Berg-Purcell
5.1 Cell Division and the Cell Cycle
 5.1 Cell Division and the Cell Cycle Lesson Objectives Contrast cell division in prokaryotes and eukaryotes. Identify the phases of the eukaryotic cell cycle. Explain how the cell cycle is controlled.
Meiosis. Bởi: OpenStaxCollege
 Meiosis Bởi: OpenStaxCollege Sexual reproduction requires fertilization, a union of two cells from two individual organisms. If those two cells each contain one set of chromosomes, then the resulting cell
Axis Specification in Drosophila
 Developmental Biology Biology 4361 Axis Specification in Drosophila July 9, 2008 Drosophila Development Overview Fertilization Cleavage Gastrulation Drosophila body plan Oocyte formation Genetic control
Questions in developmental biology. Differentiation Morphogenesis Growth/apoptosis Reproduction Evolution Environmental integration
 Questions in developmental biology Differentiation Morphogenesis Growth/apoptosis Reproduction Evolution Environmental integration Representative cell types of a vertebrate zygote => embryo => adult differentiation
Neural development its all connected
 Neural development its all connected How do you build a complex nervous system? How do you build a complex nervous system? 1. Learn how tissue is instructed to become nervous system. Neural induction 2.
Developmental Biology 3230 Midterm Exam 1 March 2006
 Name Developmental Biology 3230 Midterm Exam 1 March 2006 1. (20pts) Regeneration occurs to some degree to most metazoans. When you remove the head of a hydra a new one regenerates. Graph the inhibitor
Question Set # 4 Answer Key 7.22 Nov. 2002
 Question Set # 4 Answer Key 7.22 Nov. 2002 1) A variety of reagents and approaches are frequently used by developmental biologists to understand the tissue interactions and molecular signaling pathways
Investigating C. elegans development through mosaic analysis
 Primer 4761 Investigating C. elegans development through mosaic analysis John Yochem and Robert K. Herman Department of Genetics, Cell Biology and Development, University of Minnesota, 6-160 Jackson Hall,
Lecture Series 5 Cell Cycle & Cell Division
 Lecture Series 5 Cell Cycle & Cell Division Reading Assignments Read Chapter 18 Cell Cycle & Cell Division Read Chapter 19 pages 651-663 663 only (Benefits of Sex & Meiosis sections these are in Chapter
Big Idea 1: The process of evolution drives the diversity and unity of life.
 Big Idea 1: The process of evolution drives the diversity and unity of life. understanding 1.A: Change in the genetic makeup of a population over time is evolution. 1.A.1: Natural selection is a major
7.013 Problem Set
 7.013 Problem Set 5-2013 Question 1 During a summer hike you suddenly spot a huge grizzly bear. This emergency situation triggers a fight or flight response through a signaling pathway as shown below.
LIST of SUPPLEMENTARY MATERIALS
 LIST of SUPPLEMENTARY MATERIALS Mir et al., Dense Bicoid Hubs Accentuate Binding along the Morphogen Gradient Supplemental Movie S1 (Related to Figure 1). Movies corresponding to the still frames shown
Honors Biology Reading Guide Chapter 11
 Honors Biology Reading Guide Chapter 11 v Promoter a specific nucleotide sequence in DNA located near the start of a gene that is the binding site for RNA polymerase and the place where transcription begins
Patterning the. moving beyond the cell lineage
 atterning the C. elegans embryo erspective atterning the C. elegans embryo moving beyond the lineage The Caenorhabditis elegans embryo undergoes a series of stereotyped cleavages that generates the organs
DEVELOPMENT. Shuyi Huang, Premnath Shetty, Scott M. Robertson and Rueyling Lin*
 RESEARCH ARTICLE 2685 Development 134, 2685-2695 (2007) doi:10.1242/dev.008268 Binary cell fate specification during C. elegans embryogenesis driven by reiterated reciprocal asymmetry of TCF POP-1 and
BIOLOGY 111. CHAPTER 5: Chromosomes and Inheritance
 BIOLOGY 111 CHAPTER 5: Chromosomes and Inheritance Chromosomes and Inheritance Learning Outcomes 5.1 Differentiate between sexual and asexual reproduction in terms of the genetic variation of the offspring.
Analysis of Cell Fate from Single-Cell Gene Expression Profiles in C. elegans
 Resource Analysis of Cell Fate from Single-Cell Gene Expression Profiles in C. elegans Xiao Liu, 1 Fuhui Long, 2 Hanchuan Peng, 2 Sarah J. Aerni, 3 Min Jiang, 1 Adolfo Sánchez-Blanco, 1 John I. Murray,
Enduring understanding 1.A: Change in the genetic makeup of a population over time is evolution.
 The AP Biology course is designed to enable you to develop advanced inquiry and reasoning skills, such as designing a plan for collecting data, analyzing data, applying mathematical routines, and connecting
Cellular Neurobiology BIPN 140 Fall 2016 Problem Set #8
 Cellular Neurobiology BIPN 140 Fall 2016 Problem Set #8 1. Inductive signaling is a hallmark of vertebrate and mammalian development. In early neural development, there are multiple signaling pathways
Bypass and interaction suppressors; pathway analysis
 Bypass and interaction suppressors; pathway analysis The isolation of extragenic suppressors is a powerful tool for identifying genes that encode proteins that function in the same process as a gene of
Study Guide A. Answer Key. Cell Growth and Division. SECTION 1. THE CELL CYCLE 1. a; d; b; c 2. gaps 3. c and d 4. c 5. b and d 6.
 Cell Growth and Division Answer Key SECTION 1. THE CELL CYCLE 1. a; d; b; c 2. gaps 3. c and d 4. c 5. b and d 6. G 1 7. G 0 8. c 9. faster; too large 10. volume 11. a and b 12. repeating pattern or repetition
MIR-237 is Likely a Developmental Timing Gene that Regulates the L2-to-L3 Transition in C. Elegans
 Marquette University e-publications@marquette Master's Theses (2009 -) Dissertations, Theses, and Professional Projects MIR-237 is Likely a Developmental Timing Gene that Regulates the L2-to-L3 Transition
Lecture 7. Development of the Fruit Fly Drosophila
 BIOLOGY 205/SECTION 7 DEVELOPMENT- LILJEGREN Lecture 7 Development of the Fruit Fly Drosophila 1. The fruit fly- a highly successful, specialized organism a. Quick life cycle includes three larval stages
MCB 141 Midterm I Feb. 14, 2012
 Write your name and student ID# on EVERY PAGE of your exam MCB 141 Midterm I Feb. 14, 2012 Question #1 Question #2 Question #3 Question #4 BONUS / 28 pts / 27 pts / 25 pts / 20 pts / 1 pt TOTAL / 100 pts
SUPPLEMENTARY INFORMATION
 SUPPLEMENTARY INFORMATION doi:10.1038/nature12791 Supplementary Figure 1 (1/3) WWW.NATURE.COM/NATURE 1 RESEARCH SUPPLEMENTARY INFORMATION Supplementary Figure 1 (2/3) 2 WWW.NATURE.COM/NATURE SUPPLEMENTARY
Answer Key. Cell Growth and Division
 Cell Growth and Division Answer Key SECTION 1. THE CELL CYCLE Cell Cycle: (1) Gap1 (G 1): cells grow, carry out normal functions, and copy their organelles. (2) Synthesis (S): cells replicate DNA. (3)
AP Curriculum Framework with Learning Objectives
 Big Ideas Big Idea 1: The process of evolution drives the diversity and unity of life. AP Curriculum Framework with Learning Objectives Understanding 1.A: Change in the genetic makeup of a population over
Cell Growth and Division
 Cell Growth and Division Growth, Development, and Reproduction Q: How does a cell produce a new cell? 10.1 Why do cells divide? WHAT I KNOW SAMPLE ANSWER: Cells divide to produce more cells. WHAT I LEARNED
Natural Variation, Development, and Adaptive Phenotypes in C. elegans
 Natural Variation, Development, and Adaptive Phenotypes in C. elegans Bradly Alicea http://publish.illinois.edu/bradly-alicea Fly/Worm Club, UIUC, April 22, 2015 with input from Nathan Schroeder, Rebecca
Meiosis * OpenStax. This work is produced by OpenStax-CNX and licensed under the Creative Commons Attribution License 3.0.
 OpenStax-CNX module: m45466 1 Meiosis * OpenStax This work is produced by OpenStax-CNX and licensed under the Creative Commons Attribution License 3.0 By the end of this section, you will be able to: Abstract
Mesoderm Induction CBT, 2018 Hand-out CBT March 2018
 Mesoderm Induction CBT, 2018 Hand-out CBT March 2018 Introduction 3. Books This module is based on the following books: - 'Principles of Developement', Lewis Wolpert, et al., fifth edition, 2015 - 'Developmental
10-810: Advanced Algorithms and Models for Computational Biology. microrna and Whole Genome Comparison
 10-810: Advanced Algorithms and Models for Computational Biology microrna and Whole Genome Comparison Central Dogma: 90s Transcription factors DNA transcription mrna translation Proteins Central Dogma:
GENETIC CONTROL OF CELL INTERACTIONS IN NEMATODE DEVELOPMENT
 Annu. Rev. Genet. 1991. 25. 411-36 Copyright 199l by Annual Reviews Inc. All rights reserved GENETIC CONTROL OF CELL INTERACTIONS IN NEMATODE DEVELOPMENT E. J. Lambie and Judith Kimble Laboratory of Molecular
Exam 1 ID#: October 4, 2007
 Biology 4361 Name: KEY Exam 1 ID#: October 4, 2007 Multiple choice (one point each) (1-25) 1. The process of cells forming tissues and organs is called a. morphogenesis. b. differentiation. c. allometry.
The Wnt effector POP-1 and the PAL-1/Caudal homeoprotein collaborate with SKN-1 to activate C. elegans endoderm development
 Developmental Biology 285 (2005) 510 523 Genomes & Developmental Control The Wnt effector POP-1 and the PAL-1/Caudal homeoprotein collaborate with SKN-1 to activate C. elegans endoderm development Morris
3.a.2- Cell Cycle and Meiosis
 Big Idea 3: Living systems store, retrieve, transmit and respond to information essential to life processes. 3.a.2- Cell Cycle and Meiosis EU 3.A: Heritable information provides for continuity of life.
Boolean genetic network model for the control of C. elegans early embryonic cell cycles
 RESEARCH Open Access Boolean genetic network model for the control of C. elegans early embryonic cell cycles Xiaotai Huang 1*, Long Chen 1, Hung Chim 1, Leanne Lai Hang Chan 1, Zhongying Zhao 2, Hong Yan
Nonlinear Optics. Single-Molecule Microscopy Group. Physical Optics Maria Dienerowitz.
 Single-Molecule Microscopy Group Nonlinear Optics Physical Optics 21-06-2017 Maria Dienerowitz maria.dienerowitz@med.uni-jena.de www.single-molecule-microscopy.uniklinikum-jena.de Contents Introduction
7.013 Spring 2005 Problem Set 4
 MIT Department of Biology 7.013: Introductory Biology - Spring 2005 Instructors: Professor Hazel Sive, Professor Tyler Jacks, Dr. Claudette Gardel NAME TA 7.013 Spring 2005 Problem Set 4 FRIDAY April 8th,
Gene expression in prokaryotic and eukaryotic cells, Plasmids: types, maintenance and functions. Mitesh Shrestha
 Gene expression in prokaryotic and eukaryotic cells, Plasmids: types, maintenance and functions. Mitesh Shrestha Plasmids 1. Extrachromosomal DNA, usually circular-parasite 2. Usually encode ancillary
Biology 218, practise Exam 2, 2011
 Figure 3 The long-range effect of Sqt does not depend on the induction of the endogenous cyc or sqt genes. a, Design and predictions for the experiments shown in b-e. b-e, Single-cell injection of 4 pg
16 The Cell Cycle. Chapter Outline The Eukaryotic Cell Cycle Regulators of Cell Cycle Progression The Events of M Phase Meiosis and Fertilization
 The Cell Cycle 16 The Cell Cycle Chapter Outline The Eukaryotic Cell Cycle Regulators of Cell Cycle Progression The Events of M Phase Meiosis and Fertilization Introduction Self-reproduction is perhaps
Development of Drosophila
 Development of Drosophila Hand-out CBT Chapter 2 Wolpert, 5 th edition March 2018 Introduction 6. Introduction Drosophila melanogaster, the fruit fly, is found in all warm countries. In cooler regions,
Sonic hedgehog (Shh) signalling in the rabbit embryo
 signalling in the rabbit embryo") Sonic hedgehog (Shh) signalling in the rabbit embryo In the first part of this thesis work the physical properties of cilia-driven leftward flow were characterised in the rabbit embryo. Since its discovery
Sonic hedgehog (Shh) signalling in the rabbit embryo In the first part of this thesis work the physical properties of cilia-driven leftward flow were characterised in the rabbit embryo. Since its discovery
Roles of Cell Division. Reproduction - Like begets like, more or less. Examples of Cell Numbers. Outline Cell Reproduction
 Outline Cell Reproduction 1. Overview of Cell Reproduction 2. Cell Reproduction in Prokaryotes 3. Cell Reproduction in Eukaryotes 1. Chromosomes 2. Cell Cycle 3. Mitosis and Cytokinesis 4. Sexual Life
Name 8 Cell Cycle and Meiosis Test Date Study Guide You must know: The structure of the replicated chromosome. The stages of mitosis.
 Name 8 Cell Cycle and Meiosis Test Date Study Guide You must know: The structure of the replicated chromosome. The stages of mitosis. The role of kinases and cyclin in the regulation of the cell cycle.
Genetics, brain development, and behavior
 Genetics, brain development, and behavior Jan. 13, 2004 Questions: Does it make sense to talk about genes for behavior? How do genes turn into brains? Can environment affect development before birth? What
Biology, 7e (Campbell) Chapter 13: Meiosis and Sexual Life Cycles
 Chapter 13: Meiosis and Sexual Life Cycles") Biology, 7e (Campbell) Chapter 13: Meiosis and Sexual Life Cycles Chapter Questions 1) What is a genome? A) the complete complement of an organism's genes B) a specific sequence of polypeptides within
Biology, 7e (Campbell) Chapter 13: Meiosis and Sexual Life Cycles Chapter Questions 1) What is a genome? A) the complete complement of an organism's genes B) a specific sequence of polypeptides within