Vertical structure. To conclude, we will review the critical factors invloved in the development of extratropical storms.
|
|
|
- Rosanna Mathews
- 5 years ago
- Views:
Transcription
1 Vertical structure Now we will examine the vertical structure of the intense baroclinic wave using three visualization tools: Upper level charts at selected pressure levels Vertical soundings for selected radiosonde stations Vertical cross-sections.
2 Vertical structure Now we will examine the vertical structure of the intense baroclinic wave using three visualization tools: Upper level charts at selected pressure levels Vertical soundings for selected radiosonde stations Vertical cross-sections. To conclude, we will review the critical factors invloved in the development of extratropical storms.
, temperature (red).")
3 Upper level charts for 00 UTC, Nov. 10, Geopotential height (black), temperature (red). 2
4 850 hpa level chart 00Z, November 10, (contour 30 m for height, 4 C for temperature) 3
5 700 hpa level chart 00Z, November 10, (contour 30 m for height, 4 C for temperature) 4
6 500 hpa level chart 00Z, November 10, (contour 60 m for height, 4 C for temperature) 5
7 250 hpa level chart 00Z, November 10, (contour 120 m for height, 2 C for temperature) 6
8 200 hpa level chart 00Z, November 10, (contour 120 m for height, 2 C for temperature) 7
9 100 hpa level chart 00Z, November 10, (contour 60 m for height, 2 C for temperature) 8
10 Upper Level Charts The 850 hpa chart for 00 UTC November 10, when the associated extratropical cyclone was beginning to deepen rapidly, is examined next. The corresponding sea level pressure and surface air temperature patterns is also shown. 9
11 Upper Level Charts The 850 hpa chart for 00 UTC November 10, when the associated extratropical cyclone was beginning to deepen rapidly, is examined next. The corresponding sea level pressure and surface air temperature patterns is also shown. The 850-hPa height gradients tend to be stronger than the gradients in sea-level pressure (or 1000-hPa height). Stronger gradients are indicative of higher geostrophic wind speeds. The winds are stronger at the 850-hPa level as well. 9
12 850 hpa level chart 00Z, November 10, (contour 30 m for height, 4 C for temperature) 10
13 Sea level pressure and hpa thickness 00 UTC November 10th,
14 Based on the thermal wind equation, we know that strengthening of the westerly component of the wind from the surface to the 850-hPa level is consistent with the prevailing meridional temperature gradient in this layer, with colder air to the north. 12
15 Based on the thermal wind equation, we know that strengthening of the westerly component of the wind from the surface to the 850-hPa level is consistent with the prevailing meridional temperature gradient in this layer, with colder air to the north. From the hypsometric equation it is readily verified that the conventional 4-hPa contour interval for plotting sea-level pressure is roughly comparable to the 30 m contour interval used for plotting 850 hpa height. 1 hpa 8 metres 12
16 Based on the thermal wind equation, we know that strengthening of the westerly component of the wind from the surface to the 850-hPa level is consistent with the prevailing meridional temperature gradient in this layer, with colder air to the north. From the hypsometric equation it is readily verified that the conventional 4-hPa contour interval for plotting sea-level pressure is roughly comparable to the 30 m contour interval used for plotting 850 hpa height. 1 hpa 8 metres Hence, the relative strength of the pressure gradient force (and the geostropic wind) at the two levels can be assessed qualitatively simply by comparing the spacing of the isobars and height contours. 12
17 When the differences in contour intervals in the charts is taken into account, it is seen that gradients and wind speeds increase continuously with height up to the 250-hPa level, which corresponds to the level of the jet stream. 13
18 When the differences in contour intervals in the charts is taken into account, it is seen that gradients and wind speeds increase continuously with height up to the 250-hPa level, which corresponds to the level of the jet stream. From 250 to 100-hPa, the highest level shown, the gradients and wind speeds decrease markedly with height. 13

19 Sea level pressure and hpa thickness 00 UTC November 10th,
20 The 850-hPa isotherms tend to be concentrated within the frontal zone extending from the Great Plains eastward to the Atlantic seaboard and passing through the surface low. 15
21 The 850-hPa isotherms tend to be concentrated within the frontal zone extending from the Great Plains eastward to the Atlantic seaboard and passing through the surface low. To the east of the surface low, the winds are blowing through the frontal zone from the warm side to the cold side, advecting it northward. To the west of the surface low they are blowing through it from the cold side to the warm side, advecting it southeastward around the southern flank of the surface low. 15
22 The 850-hPa isotherms tend to be concentrated within the frontal zone extending from the Great Plains eastward to the Atlantic seaboard and passing through the surface low. To the east of the surface low, the winds are blowing through the frontal zone from the warm side to the cold side, advecting it northward. To the west of the surface low they are blowing through it from the cold side to the warm side, advecting it southeastward around the southern flank of the surface low. The frontal zone is particularly tight in the region of cold advection to the south of the surface low, and the temperature is fairly uniform within the warm sector to the southeast of the surface low. The 850-hPa height contours that pass through the frontal zone exhibit strong cyclonic curvature. 15
23 850 hpa level chart 00Z, November 10, (contour 30 m for height, 4 C for temperature) 16
24 Over the Carolinas, the frontal zone on the 850-hPa chart is positioned quite far to the north of its counterpart on the surface charts. This northward displacement reflects the shallowness of the layer of trapped cool air to the east of the Appalachian mountain range. 17
25 Over the Carolinas, the frontal zone on the 850-hPa chart is positioned quite far to the north of its counterpart on the surface charts. This northward displacement reflects the shallowness of the layer of trapped cool air to the east of the Appalachian mountain range. Proceeding upward from the 850-hPa to the 250-hPa level, the patterns exhibit notable changes. The geopotential height gradients and the associated geostrophic winds generally increase with height, and this tendency is mirrored in the strength of the observed winds. 17
26 Over the Carolinas, the frontal zone on the 850-hPa chart is positioned quite far to the north of its counterpart on the surface charts. This northward displacement reflects the shallowness of the layer of trapped cool air to the east of the Appalachian mountain range. Proceeding upward from the 850-hPa to the 250-hPa level, the patterns exhibit notable changes. The geopotential height gradients and the associated geostrophic winds generally increase with height, and this tendency is mirrored in the strength of the observed winds. The trough in the geopotental height field tilts westward with height by around 1/4 wavelength from the surface up to the 500-hPa level, but it exhibits relatively little vertical tilt above that level. 17
")
27 850 hpa level chart 00Z, November 10, (contour 30 m for height, 4 C for temperature) 18
")
28 700 hpa level chart 00Z, November 10, (contour 30 m for height, 4 C for temperature) 19
")
29 500 hpa level chart 00Z, November 10, (contour 60 m for height, 4 C for temperature) 20

30 250 hpa level chart 00Z, November 10, (contour 120 m for height, 2 C for temperature) 21

31 200 hpa level chart 00Z, November 10, (contour 120 m for height, 2 C for temperature) 22
32 100 hpa level chart 00Z, November 10, (contour 60 m for height, 2 C for temperature) 23
33 The horizontal temperature advection also weakens with height as the wind vectors come into alignment with the isotherms. In contrast to the patterns at 850 and 700-hPa, which are highly baroclinic, the structure at the higher levels is more equivalent barotropic. 24
34 The horizontal temperature advection also weakens with height as the wind vectors come into alignment with the isotherms. In contrast to the patterns at 850 and 700-hPa, which are highly baroclinic, the structure at the higher levels is more equivalent barotropic. The temperature patterns in the lower stratosphere are weak and are entirely different from those in the troposphere. At these levels, the air in troughs in the geopotential height field tends to be warmer than the surrounding air, and the air in ridges tends to be cold. 24
35 The horizontal temperature advection also weakens with height as the wind vectors come into alignment with the isotherms. In contrast to the patterns at 850 and 700-hPa, which are highly baroclinic, the structure at the higher levels is more equivalent barotropic. The temperature patterns in the lower stratosphere are weak and are entirely different from those in the troposphere. At these levels, the air in troughs in the geopotential height field tends to be warmer than the surrounding air, and the air in ridges tends to be cold. From the hypsometric equation it follows that the amplitudes of the ridges and troughs must decrease with height, consistent with the observations. By the time we reach the 100 hpa level, the only vestige of the baroclinic wave that remains is the weak trough over the western United States. 24
")
36 100 hpa level chart 00Z, November 10, (contour 60 m for height, 2 C for temperature) 25
37 250-hPa height contours superimposed on hPa thickness (indicated by colored shading). For some stations, tropopause temperatures (TT in C) and pressures (PPP in hpa) are plotted (TT/PPP). 26
38 The 250-hPa height contours, indicative of the flow at the jet stream level are seen to be aligned with the isotherms in the lower tropospheric temperature field. 27
39 The 250-hPa height contours, indicative of the flow at the jet stream level are seen to be aligned with the isotherms in the lower tropospheric temperature field. The jet stream passes over the baroclinic zones, with colder air lying to the left of it. 27
40 The 250-hPa height contours, indicative of the flow at the jet stream level are seen to be aligned with the isotherms in the lower tropospheric temperature field. The jet stream passes over the baroclinic zones, with colder air lying to the left of it. The cold air in the trough of the wave in the western United States was subsiding and spreading out at the earth s surface, as reflected in the rapid advance of the cold front. The subsidence of the cold air depressed the tropopause and adiabatically warmed the air in the lower stratosphere. 27
 and pressures (PPP in hpa) are plotted")
41 250-hPa height contours superimposed on hPa thickness (indicated by coloured shading). For some stations, tropopause temperatures (TT in C) and pressures (PPP in hpa) are plotted (TT/PPP). 28
42 The tropopause was located below the 300-hPa ( 9 km) level at stations in the trough region, and tropopause temperatures were near 50 C. 29
43 The tropopause was located below the 300-hPa ( 9 km) level at stations in the trough region, and tropopause temperatures were near 50 C. At the 250-hPa level, relative humidities over the center of the trough were in the 25 40% range, indicative of a recent history of subsidence. 29
44 The tropopause was located below the 300-hPa ( 9 km) level at stations in the trough region, and tropopause temperatures were near 50 C. At the 250-hPa level, relative humidities over the center of the trough were in the 25 40% range, indicative of a recent history of subsidence. Meanwhile, in the relatively warm, ascending air mass over the northern Great Plains, tropopause was above the 200 hpa ( 12 km) level, temperatures reported at that level were below 60 C, and relative humidities were in the around 80%. 29
45 30
46 Vertical Profiles Vertical temperature profiles for stations in the trough and ridge of the wave are contrasted in the composite diagram below. Denver, Colorado lies within the subsiding cold air mass near the center of the 250-hPa trough. Amarillo, Texas lies along the axis of the jet stream Davenport, Iowa lies in the region of ascent in the ridge at the jet stream level. 31
47 Vertical temperature profiles for Denver (blue) Amarillo (black) and Davenport (red), 00 UTC, 10 Nov (skew-t ln p diagram). 32
48 The Denver, Colorado profile, near the center of the 250- hpa trough is relatively cold at tropospheric levels. It exhibits a distinct discontinuity in lapse-rate around the 350 hpa (8 km) level, with a transition to more isothermal conditions. 33
49 The Denver, Colorado profile, near the center of the 250- hpa trough is relatively cold at tropospheric levels. It exhibits a distinct discontinuity in lapse-rate around the 350 hpa (8 km) level, with a transition to more isothermal conditions. In contrast, the Davenport, Iowa profile exhibits a much colder and more distinctive tropopause at the 180-hPa (12.5 km) level. The tropopause temperature at this time was 20 C colder at Davenport than at Denver. 33
50 The Denver, Colorado profile, near the center of the 250- hpa trough is relatively cold at tropospheric levels. It exhibits a distinct discontinuity in lapse-rate around the 350 hpa (8 km) level, with a transition to more isothermal conditions. In contrast, the Davenport, Iowa profile exhibits a much colder and more distinctive tropopause at the 180-hPa (12.5 km) level. The tropopause temperature at this time was 20 C colder at Davenport than at Denver. Amarillo, Texas, which lies close to the axis of the jet stream exhibits a less clearly defined tropopause structure, with no indications of a clear break in the lapse rate. Along the axis of the jet stream the tropopause is not so much a layer as a vertical wall, with stratospheric air to the left and tropospheric air to the right (in the northern hemisphere). 33
51 Denver (blue), Amarillo (black) and Davenport (red). 34
52 35
53 Soundings We next examine vertical profiles of wind, temperature and dew point in the lower troposphere at representative stations in different sectors of the developing cyclone. 36
54 Soundings We next examine vertical profiles of wind, temperature and dew point in the lower troposphere at representative stations in different sectors of the developing cyclone. At Amarillo (Texas), to the south of the surface low, the 850-hPa level lies within a relatively thin layer in which the wind is backing with height (turning from northwesterly below to southwesterly above). 36
55 Soundings We next examine vertical profiles of wind, temperature and dew point in the lower troposphere at representative stations in different sectors of the developing cyclone. At Amarillo (Texas), to the south of the surface low, the 850-hPa level lies within a relatively thin layer in which the wind is backing with height (turning from northwesterly below to southwesterly above). From the thermal wind equation, strong backing implies strong cold advection. 36
56 Soundings We next examine vertical profiles of wind, temperature and dew point in the lower troposphere at representative stations in different sectors of the developing cyclone. At Amarillo (Texas), to the south of the surface low, the 850-hPa level lies within a relatively thin layer in which the wind is backing with height (turning from northwesterly below to southwesterly above). From the thermal wind equation, strong backing implies strong cold advection. [Recall: V g = 1 f k Φ = V g p = 1 f k Φ p so V g k T z so the cold air is to the left of the shear-vector.] k T 36

57 Soundings of wind, temperature and dew point at 00 UTC, November 20, Left: Amarillo, Texas in the cold frontal zone; Right: Davenport, Iowa in the warm frontal zone. 37
58 The positioning of this layer of strong backing just above the 850-hPa level in the sounding indicates that the frontal zone lies just to the east of Amarillo and that it slopes westward with height. 38
59 The positioning of this layer of strong backing just above the 850-hPa level in the sounding indicates that the frontal zone lies just to the east of Amarillo and that it slopes westward with height. The sounding for Davenport lies on the cold side of the frontal zone to the east of the surface low, where the warm air is being advected northward by the southerly component of the wind. In the Davenport sounding, the wind veers with increasing height, indicative of warm advection. 38
60 The positioning of this layer of strong backing just above the 850-hPa level in the sounding indicates that the frontal zone lies just to the east of Amarillo and that it slopes westward with height. The sounding for Davenport lies on the cold side of the frontal zone to the east of the surface low, where the warm air is being advected northward by the southerly component of the wind. In the Davenport sounding, the wind veers with increasing height, indicative of warm advection. Soundings for stations located in the warm sector of the developing cyclone (not shown) exhibit little turning of wind with height other that the frictional veering just above the surface, and relatively little increase of wind speed with height. 38
61 Vertical Cross-sections Vertical cross-sections are the natural complement to horizontal maps in revealing the three-dimensional structure of weather systems. 39
62 Vertical Cross-sections Vertical cross-sections are the natural complement to horizontal maps in revealing the three-dimensional structure of weather systems. With today s high resolution gridded data sets generated by sophisticated data assimilation schemes, all the analyst need do is specify the time and orientation of the section and the fields to be included in the section. 39
63 Vertical Cross-sections Vertical cross-sections are the natural complement to horizontal maps in revealing the three-dimensional structure of weather systems. With today s high resolution gridded data sets generated by sophisticated data assimilation schemes, all the analyst need do is specify the time and orientation of the section and the fields to be included in the section. The two most widely used variables in vertical cross sections are temperature (or equivalent potential temperature) and wind. 39
64 Vertical Cross-sections Vertical cross-sections are the natural complement to horizontal maps in revealing the three-dimensional structure of weather systems. With today s high resolution gridded data sets generated by sophisticated data assimilation schemes, all the analyst need do is specify the time and orientation of the section and the fields to be included in the section. The two most widely used variables in vertical cross sections are temperature (or equivalent potential temperature) and wind. If the plane of the section is oriented normal to the jet stream, the analysis can be simplified by resolving the wind into components parallel and normal to the section. 39
65 Isotachs of the normal component clearly reveal the location and strength of the jet stream where it passes through the plane of the section and they often capture the zones of strongest vertical wind shear, where patches of clear air turbulence tend to be concentrated. 40
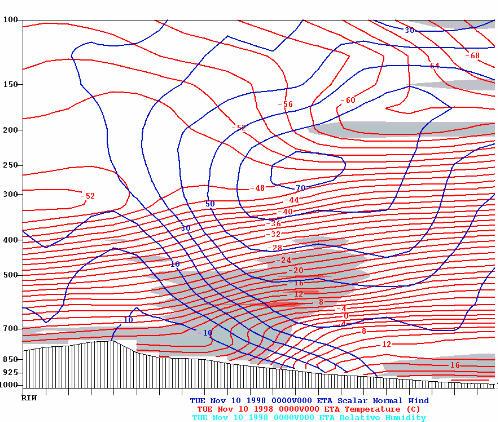
66 Isotachs of the normal component clearly reveal the location and strength of the jet stream where it passes through the plane of the section and they often capture the zones of strongest vertical wind shear, where patches of clear air turbulence tend to be concentrated. The vertical shear of the wind component normal to the section and the horizontal temperature gradient along the section are approximately related by the thermal wind equation: V n p R T fp s where V n is the wind component into the section and T is temperature in the plane of the section, with the horizontal coordinate s increasing toward the right. 40
67 Isotachs of the normal component clearly reveal the location and strength of the jet stream where it passes through the plane of the section and they often capture the zones of strongest vertical wind shear, where patches of clear air turbulence tend to be concentrated. The vertical shear of the wind component normal to the section and the horizontal temperature gradient along the section are approximately related by the thermal wind equation: V n p R T fp s where V n is the wind component into the section and T is temperature in the plane of the section, with the horizontal coordinate s increasing toward the right. It follows that... 40
68 In regions of the section in which the flow is barotropic, isotherms are horizontal ( T/ s = 0) and isotachs are vertical ( V n / p = 0). 41
69 In regions of the section in which the flow is barotropic, isotherms are horizontal ( T/ s = 0) and isotachs are vertical ( V n / p = 0). In regions where isotachs are tightly spaced in the vertical, isotherms are tighly spaced in the horizontal. 41
70 In regions of the section in which the flow is barotropic, isotherms are horizontal ( T/ s = 0) and isotachs are vertical ( V n / p = 0). In regions where isotachs are tightly spaced in the vertical, isotherms are tighly spaced in the horizontal. Near the tropopause, the vertical wind shear and the horizontal temperature gradient undergo a sign reversal at the same level. 41
71 In regions of the section in which the flow is barotropic, isotherms are horizontal ( T/ s = 0) and isotachs are vertical ( V n / p = 0). In regions where isotachs are tightly spaced in the vertical, isotherms are tighly spaced in the horizontal. Near the tropopause, the vertical wind shear and the horizontal temperature gradient undergo a sign reversal at the same level. The same relationships apply to vertical wind shear and the horizontal gradient of potential temperature. 41
72 In regions of the section in which the flow is barotropic, isotherms are horizontal ( T/ s = 0) and isotachs are vertical ( V n / p = 0). In regions where isotachs are tightly spaced in the vertical, isotherms are tighly spaced in the horizontal. Near the tropopause, the vertical wind shear and the horizontal temperature gradient undergo a sign reversal at the same level. The same relationships apply to vertical wind shear and the horizontal gradient of potential temperature. Temperature and potential temperature sections are different in appearance: 41
73 In regions of the section in which the flow is barotropic, isotherms are horizontal ( T/ s = 0) and isotachs are vertical ( V n / p = 0). In regions where isotachs are tightly spaced in the vertical, isotherms are tighly spaced in the horizontal. Near the tropopause, the vertical wind shear and the horizontal temperature gradient undergo a sign reversal at the same level. The same relationships apply to vertical wind shear and the horizontal gradient of potential temperature. Temperature and potential temperature sections are different in appearance: in the troposphere temperature usually decreases with height while potential temperature increases with height 41
74 In regions of the section in which the flow is barotropic, isotherms are horizontal ( T/ s = 0) and isotachs are vertical ( V n / p = 0). In regions where isotachs are tightly spaced in the vertical, isotherms are tighly spaced in the horizontal. Near the tropopause, the vertical wind shear and the horizontal temperature gradient undergo a sign reversal at the same level. The same relationships apply to vertical wind shear and the horizontal gradient of potential temperature. Temperature and potential temperature sections are different in appearance: in the troposphere temperature usually decreases with height while potential temperature increases with height in the stratosphere θ/ p is always strong and negative, while T/ p is often weak and may be of either sign. 41
75 First vertical cross-section The first example is oriented perpendicular to the cold front and jet stream over the southern Great Plains, 00 UTC 10 November 1998, looking downstream (i.e., northeastward). 42
76 First vertical cross-section The first example is oriented perpendicular to the cold front and jet stream over the southern Great Plains, 00 UTC 10 November 1998, looking downstream (i.e., northeastward). Temperature is indicated by red contours and isotachs of geostrophic wind speed normal to the section, with positive values defined as southwesterly winds directed into the section, are plotted in blue. Regions with relative humidities in excess of 80% are shaded. 42
77 First vertical cross-section The first example is oriented perpendicular to the cold front and jet stream over the southern Great Plains, 00 UTC 10 November 1998, looking downstream (i.e., northeastward). Temperature is indicated by red contours and isotachs of geostrophic wind speed normal to the section, with positive values defined as southwesterly winds directed into the section, are plotted in blue. Regions with relative humidities in excess of 80% are shaded. The front at the earth s surface is apparent as a wedge of downward sloping isotherms and strong vertical wind shear, as indicated by the close spacing of the isotachs in the vertical. 42
78 43
79 The front slopes backward toward the cold air, with increasing height. The front becomes less clearly defined at levels above 850 hpa. 44
80 The front slopes backward toward the cold air, with increasing height. The front becomes less clearly defined at levels above 850 hpa. The jet stream passes through the section at the 250-hPa level, directly above the frontal zone. The wind speed in the core of the jet stream is slightly in excess of 70 m/s. 44
81 The front slopes backward toward the cold air, with increasing height. The front becomes less clearly defined at levels above 850 hpa. The jet stream passes through the section at the 250-hPa level, directly above the frontal zone. The wind speed in the core of the jet stream is slightly in excess of 70 m/s. The tropopause is clearly evident as a discontinuity in the vertical spacing of the isotherms: in the troposphere the isotherms are closely spaced in the vertical, indicative of strong lapse rates, while in the stratosphere, they are widely spaced, indicative of close-to-isothermal lapse rates. 44
82 The front slopes backward toward the cold air, with increasing height. The front becomes less clearly defined at levels above 850 hpa. The jet stream passes through the section at the 250-hPa level, directly above the frontal zone. The wind speed in the core of the jet stream is slightly in excess of 70 m/s. The tropopause is clearly evident as a discontinuity in the vertical spacing of the isotherms: in the troposphere the isotherms are closely spaced in the vertical, indicative of strong lapse rates, while in the stratosphere, they are widely spaced, indicative of close-to-isothermal lapse rates. The tropopause is low and relatively warm on the cyclonic (left) side of the jet stream and high and on the anticyclonic (right) side. 44
83 45

84 46
85 Alternatively, one can view the tropopause as being depressed over the cold, subsiding air mass and elevated over the warm air mass as a consequence of the thermally direct circulations in this rapidly developing baroclinic wave. 47
86 Alternatively, one can view the tropopause as being depressed over the cold, subsiding air mass and elevated over the warm air mass as a consequence of the thermally direct circulations in this rapidly developing baroclinic wave. If one were to fly along the section at the jet stream (250- hpa) level, passing from the warm side to the cold side of the lower tropospheric frontal zone, one would cross from the upper troposphere to the lower stratosphere while crossing the jet stream. 47
87 Alternatively, one can view the tropopause as being depressed over the cold, subsiding air mass and elevated over the warm air mass as a consequence of the thermally direct circulations in this rapidly developing baroclinic wave. If one were to fly along the section at the jet stream (250- hpa) level, passing from the warm side to the cold side of the lower tropospheric frontal zone, one would cross from the upper troposphere to the lower stratosphere while crossing the jet stream. Entry into the stratosphere would be marked by a sharp decrease in relative humidity and an increase in the mixing ratio of ozone. 47
88 Alternatively, one can view the tropopause as being depressed over the cold, subsiding air mass and elevated over the warm air mass as a consequence of the thermally direct circulations in this rapidly developing baroclinic wave. If one were to fly along the section at the jet stream (250- hpa) level, passing from the warm side to the cold side of the lower tropospheric frontal zone, one would cross from the upper troposphere to the lower stratosphere while crossing the jet stream. Entry into the stratosphere would be marked by a sharp decrease in relative humidity and an increase in the mixing ratio of ozone. One would also observe a marked increase in the isentropic potential vorticity of the ambient air: a consequence of the increase in static stability θ/ p in combination with a transition from weak anticyclonic relative vorticity ζ on the equatorward flank of the jet stream to quite strong cyclonic relative vorticity on the poleward flank. 47
89 IPV Another variable frequently plotted in vertical cross sections is isentropic potential vorticity IPV = g(ζ θ + f) θ p a conservative tracer that serves as a marker for intrusions of stratospheric air into the troposphere in the vicinity of the jet stream. 48
90 IPV Another variable frequently plotted in vertical cross sections is isentropic potential vorticity IPV = g(ζ θ + f) θ p a conservative tracer that serves as a marker for intrusions of stratospheric air into the troposphere in the vicinity of the jet stream. Air that has been in the stratosphere for an appreciable time acquires high values of static stability θ/ p by virtue of the vertical gradient of diabatic heating at those levels. 48
91 IPV Another variable frequently plotted in vertical cross sections is isentropic potential vorticity IPV = g(ζ θ + f) θ p a conservative tracer that serves as a marker for intrusions of stratospheric air into the troposphere in the vicinity of the jet stream. Air that has been in the stratosphere for an appreciable time acquires high values of static stability θ/ p by virtue of the vertical gradient of diabatic heating at those levels. When a layer of stratospheric air is drawn downward into the troposphere, columns are stretched in the vertical, pulling the potential temperature surfaces apart and thereby causing the static stability to decrease. 48
92 IPV Another variable frequently plotted in vertical cross sections is isentropic potential vorticity IPV = g(ζ θ + f) θ p a conservative tracer that serves as a marker for intrusions of stratospheric air into the troposphere in the vicinity of the jet stream. Air that has been in the stratosphere for an appreciable time acquires high values of static stability θ/ p by virtue of the vertical gradient of diabatic heating at those levels. When a layer of stratospheric air is drawn downward into the troposphere, columns are stretched in the vertical, pulling the potential temperature surfaces apart and thereby causing the static stability to decrease. Conservation of potential vorticity requires that the vorticity of the air become more cyclonic as it is stretched. 48
93 Second vertical cross-section We now examine a vertical cross section normal the frontal zone twelve hours later, at 12 UTC November 10,
94 Second vertical cross-section We now examine a vertical cross section normal the frontal zone twelve hours later, at 12 UTC November 10, In this section the red contours are isentropes (rather than isotherms) and high values of isentropic potential vorticity, indicative of stratospheric air, are indicated by shading. 49
95 Second vertical cross-section We now examine a vertical cross section normal the frontal zone twelve hours later, at 12 UTC November 10, In this section the red contours are isentropes (rather than isotherms) and high values of isentropic potential vorticity, indicative of stratospheric air, are indicated by shading. The jet stream is substantially stronger in this section than in the previous one, with peak wind speeds in excess of 100 m/s. 49
96 Second vertical cross-section We now examine a vertical cross section normal the frontal zone twelve hours later, at 12 UTC November 10, In this section the red contours are isentropes (rather than isotherms) and high values of isentropic potential vorticity, indicative of stratospheric air, are indicated by shading. The jet stream is substantially stronger in this section than in the previous one, with peak wind speeds in excess of 100 m/s. Immediately beneath the jet stream is a layer characterized by very strong vertical wind shear. Consistent with the thermal wind equation, the ihorizontal gradient of temperature in this layer is also quite strong, with colder air to the left. 49
97 50
98 The air within this upper level frontal zone exhibits strong cyclonic relative vorticity by virtue of its cyclonic shear V n s and it is also characterized by strong static stability, as evidenced by the tight vertical spacing of the isentropes. 51
99 The air within this upper level frontal zone exhibits strong cyclonic relative vorticity by virtue of its cyclonic shear V n s and it is also characterized by strong static stability, as evidenced by the tight vertical spacing of the isentropes. It follows that the isentropic potential vorticity (IPV) of the air within this upper level frontal zone is much higher than that of typical air parcels at this level and the air within the core of the jet stream. Accordingly, the IPV contours are folded backwards beneath the jet stream so as to include the upper tropspheric frontal zone within the region of high IPV. 51
100 The air within this upper level frontal zone exhibits strong cyclonic relative vorticity by virtue of its cyclonic shear V n s and it is also characterized by strong static stability, as evidenced by the tight vertical spacing of the isentropes. It follows that the isentropic potential vorticity (IPV) of the air within this upper level frontal zone is much higher than that of typical air parcels at this level and the air within the core of the jet stream. Accordingly, the IPV contours are folded backwards beneath the jet stream so as to include the upper tropspheric frontal zone within the region of high IPV. Since the IPV contours define the boundary between tropospheric air and stratospheric air, it follows that the air within the frontal zone is of recent stratospheric origin. 51

101 52
102 Caption: Vertical cross-section of wind and potential temperature for 12 UTC November 10, Potential temperature is indicated by red contours and isotachs of geostrophic wind speed normal to the section, with positive values defined as southwesterly winds directed into the section, are plotted in blue. Isentropic potential vorticity in units of 10 6 K m 2 s 1 kg 1 (i.e., PVU) is indicated by shading. 53
103 Caption: Vertical cross-section of wind and potential temperature for 12 UTC November 10, Potential temperature is indicated by red contours and isotachs of geostrophic wind speed normal to the section, with positive values defined as southwesterly winds directed into the section, are plotted in blue. Isentropic potential vorticity in units of 10 6 K m 2 s 1 kg 1 (i.e., PVU) is indicated by shading. The isentropic potential vorticity is plotted in PV units, that is 10 6 K m 2 s 1 kg 1, indicated by shading. 53
104 Caption: Vertical cross-section of wind and potential temperature for 12 UTC November 10, Potential temperature is indicated by red contours and isotachs of geostrophic wind speed normal to the section, with positive values defined as southwesterly winds directed into the section, are plotted in blue. Isentropic potential vorticity in units of 10 6 K m 2 s 1 kg 1 (i.e., PVU) is indicated by shading. The isentropic potential vorticity is plotted in PV units, that is 10 6 K m 2 s 1 kg 1, indicated by shading. When IPV is expressed in these units, the IPV = 2.0 surface usually conforms quite closely to the tropopause, with higher values above and lower values below. 53
105 Caption: Vertical cross-section of wind and potential temperature for 12 UTC November 10, Potential temperature is indicated by red contours and isotachs of geostrophic wind speed normal to the section, with positive values defined as southwesterly winds directed into the section, are plotted in blue. Isentropic potential vorticity in units of 10 6 K m 2 s 1 kg 1 (i.e., PVU) is indicated by shading. The isentropic potential vorticity is plotted in PV units, that is 10 6 K m 2 s 1 kg 1, indicated by shading. When IPV is expressed in these units, the IPV = 2.0 surface usually conforms quite closely to the tropopause, with higher values above and lower values below. As we saw, the air within the frontal zone is of recent stratospheric origin. Such upper level frontal zones and their associated tropopause folds are the expressions of extrusions of stratospheric air, with high concentrations of ozone and other stratospheric tracers, into the upper troposphere. 53
106 Sometimes tropopause folding is a reversible process in which the high IPV air within the fold is eventually drawn back into the stratosphere. At other times, the process is irreversible: the extruded stratospheric air becomes incorporated into the troposphere, where it eventually loses its distinctively high IPV. 54
107 Sometimes tropopause folding is a reversible process in which the high IPV air within the fold is eventually drawn back into the stratosphere. At other times, the process is irreversible: the extruded stratospheric air becomes incorporated into the troposphere, where it eventually loses its distinctively high IPV. With the development of the cyclone, the stratospheric air was drawn downward and northeastward over the cold frontal zone, becoming an integral part of the dry slot in the water vapour satellite imagery. The resulting injection of air with high IPV into the environment of the cyclone contributed to the remarkable intensification of this system during the later stages of its development. 54

108 WV image 09 UCT, 10 Nov.,
109 Development processes Baroclinic instability, in its pure form, is a bottom up process, involving the advection of the lower tropospheric meridional temperature gradient by the low level wind field. 56
110 Development processes Baroclinic instability, in its pure form, is a bottom up process, involving the advection of the lower tropospheric meridional temperature gradient by the low level wind field. In idealized numerical simulations, baroclinic waves reach their peak amplitude first in the lower troposphere and a day or so later at the jet stream level. 56
111 Development processes Baroclinic instability, in its pure form, is a bottom up process, involving the advection of the lower tropospheric meridional temperature gradient by the low level wind field. In idealized numerical simulations, baroclinic waves reach their peak amplitude first in the lower troposphere and a day or so later at the jet stream level. In the real atmosphere, the location and timing of extratropical cyclone development (cyclogenesis) is influenced, and in some cases even dominated by dynamical processes in the upper troposphere. 56
112 Development processes Baroclinic instability, in its pure form, is a bottom up process, involving the advection of the lower tropospheric meridional temperature gradient by the low level wind field. In idealized numerical simulations, baroclinic waves reach their peak amplitude first in the lower troposphere and a day or so later at the jet stream level. In the real atmosphere, the location and timing of extratropical cyclone development (cyclogenesis) is influenced, and in some cases even dominated by dynamical processes in the upper troposphere. To generate a cyclone as intense as the one examined in this section, conditions in the upper and lower troposphere must both be favourable. 56
113 The region of cyclonic vorticity advection downstream of and on the cyclonic (i.e., poleward) side of a strong westerly jet is a favoured site for cyclogenesis, especially if it passes over a region of strong low-level baroclinicity. 57
114 The region of cyclonic vorticity advection downstream of and on the cyclonic (i.e., poleward) side of a strong westerly jet is a favoured site for cyclogenesis, especially if it passes over a region of strong low-level baroclinicity. Extrusions of stratospheric air, with its high potential vorticity, into upper level frontal zones can increase the rate of intensification of the cyclonic circulation. 57
115 Another process that determines the sites most favourable for cyclogenesis is the eastward dispersion of Rossby waves at the jet stream level: New baroclinic waves develop downstream of the existing ones, while the mature waves die out at the upstream end of the wavetrain. 58
116 Another process that determines the sites most favourable for cyclogenesis is the eastward dispersion of Rossby waves at the jet stream level: New baroclinic waves develop downstream of the existing ones, while the mature waves die out at the upstream end of the wavetrain. The relevance of this downstream development process is illustrated by the time-latitude plot of the meridional wind component at the jet stream (250-hPa) level for November Time-latitude section of 250-hPa meridional wind averaged from 30 to 60 N for November N/A 58
117 Another process that determines the sites most favourable for cyclogenesis is the eastward dispersion of Rossby waves at the jet stream level: New baroclinic waves develop downstream of the existing ones, while the mature waves die out at the upstream end of the wavetrain. The relevance of this downstream development process is illustrated by the time-latitude plot of the meridional wind component at the jet stream (250-hPa) level for November Time-latitude section of 250-hPa meridional wind averaged from 30 to 60 N for November N/A From this section it is evident that the cyclone that developed over the central United States ( 90 W) November 10 was part of a well-defined wave packet that propagated eastward with a group velocity of around 20 m/s, roughly twice the rate of propagation of the individual waves within the packet. 58
118 Final Word of Caution We end our discussion on the structure and life cycle of extratropical cyclones with a disclaimer: No single case study can do justice to the diversity and complexity of the structure and evolution of extratropical weather systems. The structure of fronts and rain bands varies widely from case to case and the ideal textbook example is rarely, if ever observed. 59
119 Final Word of Caution We end our discussion on the structure and life cycle of extratropical cyclones with a disclaimer: No single case study can do justice to the diversity and complexity of the structure and evolution of extratropical weather systems. The structure of fronts and rain bands varies widely from case to case and the ideal textbook example is rarely, if ever observed. Even in the nearly perfect storm examined in this section, the warm front was difficult to follow and the presence of a secondary cold front complicated the interpretation of the surface maps and many of the time series. 59
120 Final Word of Caution We end our discussion on the structure and life cycle of extratropical cyclones with a disclaimer: No single case study can do justice to the diversity and complexity of the structure and evolution of extratropical weather systems. The structure of fronts and rain bands varies widely from case to case and the ideal textbook example is rarely, if ever observed. Even in the nearly perfect storm examined in this section, the warm front was difficult to follow and the presence of a secondary cold front complicated the interpretation of the surface maps and many of the time series. Hence, the example should be interpreted not as a comprehensive description of extratropical cyclones, but as an in-depth example designed to illustrate these remarkable atmospheric systems. 59
Fronts in November 1998 Storm
 Fronts in November 1998 Storm Much of the significant weather observed in association with extratropical storms tends to be concentrated within narrow bands called frontal zones. Fronts in November 1998
Synoptic Meteorology II: Self-Development in the IPV Framework. 5-7 May 2015
 Synoptic Meteorology II: Self-Development in the IPV Framework 5-7 May 2015 Readings: Section 5.3.6 of Midlatitude Synoptic Meteorology. Introduction In this and other recent lectures, we have developed
and 24 mm, hPa lapse rates between 3 and 4 K km 1, lifted index values
 3.2 Composite analysis 3.2.1 Pure gradient composites The composite initial NE report in the pure gradient northwest composite (N = 32) occurs where the mean sea level pressure (MSLP) gradient is strongest
Synoptic Meteorology
 M.Sc. in Meteorology Synoptic Meteorology [MAPH P312] Prof Peter Lynch Second Semester, 2004 2005 Seminar Room Dept. of Maths. Physics, UCD, Belfield. Part 9 Extratropical Weather Systems These lectures
Final Examination, MEA 443 Fall 2008, Lackmann
 Place an X here to count it double! Name: Final Examination, MEA 443 Fall 2008, Lackmann If you wish to have the final exam count double and replace your midterm score, place an X in the box above. As
u g z = g T y (1) f T Margules Equation for Frontal Slope
 f T Margules Equation for Frontal Slope") Margules Equation for Frontal Slope u g z = g f T T y (1) Equation (1) is the thermal wind relation for the west wind geostrophic component of the flow. For the purposes of this derivation, we assume that
Margules Equation for Frontal Slope u g z = g f T T y (1) Equation (1) is the thermal wind relation for the west wind geostrophic component of the flow. For the purposes of this derivation, we assume that
Fixed Rossby Waves: Quasigeostrophic Explanations and Conservation of Potential Vorticity
 Fixed Rossby Waves: Quasigeostrophic Explanations and Conservation of Potential Vorticity 1. Observed Planetary Wave Patterns After upper air observations became routine, it became easy to produce contour
Summary of High Wind Event of 7 March 2004
 Summary of High Wind Event of 7 March 2004 This event was characterized by a very strong jet streak that developed over North Carolina by 00 UTC 8 March, as seen in the Eta model analysis at 300 mb, with
Quasi-Geostrophic Implications
 Chapter 10 Quasi-Geostrophic Implications When you look at a weather chart with all its isolines and plotted data, you need a framework upon which to interpret what you see. Quasi-geostrophic theory provides
The Planetary Circulation System
 12 The Planetary Circulation System Learning Goals After studying this chapter, students should be able to: 1. describe and account for the global patterns of pressure, wind patterns and ocean currents
Isentropic Analysis. Much of this presentation is due to Jim Moore, SLU
 Isentropic Analysis Much of this presentation is due to Jim Moore, SLU Utility of Isentropic Analysis Diagnose and visualize vertical motion - through advection of pressure and system-relative flow Depict
Synoptic Meteorology II: Frontogenesis Examples Figure 1
 Synoptic Meteorology II: Frontogenesis Examples The below images, taken from the 1200 UTC 17 January 2019 GFS forecast run, provide examples of the contributions of deformation and divergence to frontogenesis.
Synoptic Meteorology II: Petterssen-Sutcliffe Development Theory Application March 2015
 Synoptic Meteorology II: Petterssen-Sutcliffe Development Theory Application 10-12 March 2015 In our lecture on Petterssen-Sutcliffe Development Theory, we outlined the principle of selfdevelopment in
 http://www.ssec.wisc.edu/data/composites.html Red curve: Incoming solar radiation Blue curve: Outgoing infrared radiation. Three-cell model of general circulation Mid-latitudes: 30 to 60 latitude MID-LATITUDES
Mid-Latitude Cyclones and Fronts. Lecture 12 AOS 101
 Mid-Latitude Cyclones and Fronts Lecture 12 AOS 101 Homework 4 COLDEST TEMPS GEOSTROPHIC BALANCE Homework 4 FASTEST WINDS L Consider an air parcel rising through the atmosphere The parcel expands as it
Measurement of Rotation. Circulation. Example. Lecture 4: Circulation and Vorticity 1/31/2017
 Lecture 4: Circulation and Vorticity Measurement of Rotation Circulation Bjerknes Circulation Theorem Vorticity Potential Vorticity Conservation of Potential Vorticity Circulation and vorticity are the
Boundary layer controls on extratropical cyclone development
 Boundary layer controls on extratropical cyclone development R. S. Plant (With thanks to: I. A. Boutle and S. E. Belcher) 28th May 2010 University of East Anglia Outline Introduction and background Baroclinic
4/29/2011. Mid-latitude cyclones form along a
 Chapter 10: Cyclones: East of the Rocky Mountain Extratropical Cyclones Environment prior to the development of the Cyclone Initial Development of the Extratropical Cyclone Early Weather Along the Fronts
1. COLD FRONT - CLOUD STRUCTURE IN SATELLITE IMAGES
 1. COLD FRONT - CLOUD STRUCTURE IN SATELLITE IMAGES The satellite image shows a cyclonically curved synoptic scale cloud band usually a few hundred kilometres wide; in the VIS image the cloud band mostly
The water vapour channels of SEVIRI (Meteosat). An introduction
. An introduction") The water vapour channels of SEVIRI (Meteosat). An introduction jose.prieto@eumetsat.int Cachoeira P. July 2006 Formats 1.5 1 Objectives 2 Describe the characteristics of WV channels on board of SEVIRI
The water vapour channels of SEVIRI (Meteosat). An introduction jose.prieto@eumetsat.int Cachoeira P. July 2006 Formats 1.5 1 Objectives 2 Describe the characteristics of WV channels on board of SEVIRI
10B.2 THE ROLE OF THE OCCLUSION PROCESS IN THE EXTRATROPICAL-TO-TROPICAL TRANSITION OF ATLANTIC HURRICANE KAREN
 10B.2 THE ROLE OF THE OCCLUSION PROCESS IN THE EXTRATROPICAL-TO-TROPICAL TRANSITION OF ATLANTIC HURRICANE KAREN Andrew L. Hulme* and Jonathan E. Martin University of Wisconsin-Madison, Madison, Wisconsin
The dynamics of high and low pressure systems
 The dynamics of high and low pressure systems Newton s second law for a parcel of air in an inertial coordinate system (a coordinate system in which the coordinate axes do not change direction and are
1. Rossby and Ertel 2. Conservation and invertibility - a useful combination 2.1 Action at a distance
 Met Office College - Course Notes Potential vorticity Contents 1. Rossby and Ertel 2. Conservation and invertibility - a useful combination 2.1 Action at a distance 3. Conceptual models of development
Occlusion cyclogenesis II
 Occlusion cyclogenesis II Upper level influences on cyclogenesis Vorticity Advection (CVA) and the 4-quadrant jet streak model (Uccellini) Potential Vorticity (PV) (Hoskins Theory) Rapid cyclogenesis 14
Meteorology Lecture 15
 Meteorology Lecture 15 Robert Fovell rfovell@albany.edu 1 Important notes These slides show some figures and videos prepared by Robert G. Fovell (RGF) for his Meteorology course, published by The Great
CONVERGENCE, DIVERGENCE, AND VORTICITY
 CHAPTER 1 CONVERGENCE, DIVERGENCE, AND VORTICITY In your reading of the AG2 manual, volume 1, you became familiar with the terms convergence, divergence, and vorticity when used in relation to surface
Middle Latitude Cyclones a storm that forms at middle and high latitudes, outside of the tropics.
 Middle Latitude Cyclones a storm that forms at middle and high latitudes, outside of the tropics. Polar Front Theory a theory that explains the life cycle of mid latitude cyclones and their associated
Lower-Tropospheric Height Tendencies Associated with the Shearwise and Transverse Components of Quasigeostrophic Vertical Motion
 JULY 2007 N O T E S A N D C O R R E S P O N D E N C E 2803 Lower-Tropospheric Height Tendencies Associated with the Shearwise and Transverse Components of Quasigeostrophic Vertical Motion JONATHAN E. MARTIN
Multiscale Analyses of Inland Tropical Cyclone Midlatitude Jet Interactions: Camille (1969) and Danny (1997)
 and Danny (1997)") Multiscale Analyses of Inland Tropical Cyclone Midlatitude Jet Interactions: Camille (1969) and Danny (1997) Matthew Potter, Lance Bosart, and Daniel Keyser Department of Atmospheric and Environmental
Multiscale Analyses of Inland Tropical Cyclone Midlatitude Jet Interactions: Camille (1969) and Danny (1997) Matthew Potter, Lance Bosart, and Daniel Keyser Department of Atmospheric and Environmental
Observation Homework Due 11/24. Previous Lecture. Midlatitude Cyclones
 Lecture 21 Midlatitude Cyclones Observation Homework Due 11/24 1 2 Midlatitude Cyclones Midlatitude Cyclone or Winter Storm Cyclogenesis Energy Source Life Cycle Air Streams Vertical Structure Storm Hazards
Mesoscale Atmospheric Systems. Surface fronts and frontogenesis. 06 March 2018 Heini Wernli. 06 March 2018 H. Wernli 1
 Mesoscale Atmospheric Systems Surface fronts and frontogenesis 06 March 2018 Heini Wernli 06 March 2018 H. Wernli 1 Temperature (degc) Frontal passage in Mainz on 26 March 2010 06 March 2018 H. Wernli
Four ways of inferring the MMC. 1. direct measurement of [v] 2. vorticity balance. 3. total energy balance
![Four ways of inferring the MMC. 1. direct measurement of [v] 2. vorticity balance. 3. total energy balance](/thumbs/88/114934484.jpg "Four ways of inferring the MMC. 1. direct measurement of [v] 2. vorticity balance. 3. total energy balance") Four ways of inferring the MMC 1. direct measurement of [v] 2. vorticity balance 3. total energy balance 4. eliminating time derivatives in governing equations Four ways of inferring the MMC 1. direct
Four ways of inferring the MMC 1. direct measurement of [v] 2. vorticity balance 3. total energy balance 4. eliminating time derivatives in governing equations Four ways of inferring the MMC 1. direct
Chapter 1 Anatomy of a Cyclone
 Chapter 1 Anatomy of a Cyclone The Beast in the East 15-17 February 2003 Extra-tropical cyclone an area of low pressure outside of the tropics Other names for extra-tropical cyclones: Cyclone Mid-latitude
Chapter 10: Mid-latitude Cyclones Mid-Latitude Cyclones
 Chapter 10: Mid-latitude Cyclones Mid-Latitude Cyclones Mid-latitude cyclones form along a boundary separating polar air from warmer air to the south. Life Cycle of Cyclone Cyclone Structures Steering
Chapter 10: Mid-latitude Cyclones
 Chapter 10: Mid-latitude Cyclones Life Cycle of Cyclone Cyclone Structures Steering of Cyclone Mid-Latitude Cyclones Mid-latitude cyclones form along a boundary separating polar air from warmer air to
Answers to Clicker Questions
 Answers to Clicker Questions Chapter 1 What component of the atmosphere is most important to weather? A. Nitrogen B. Oxygen C. Carbon dioxide D. Ozone E. Water What location would have the lowest surface
Characteristic blocking events over Ural-Siberia in Boreal Winter under Present and Future Climate Conditions
 Characteristic blocking events over Ural-Siberia in Boreal Winter under Present and Future Climate Conditions Wen Zhou & Hoffman Cheung Guy Carpenter Asia-Pacific Climate Impact Center School of Energy
Chapter 9. Weather Patterns & Midlatitude Cyclones
 Chapter 9 Weather Patterns & Midlatitude Cyclones Frontal Weather Fronts are boundary surfaces between different air masses. Warm front Cold front Stationary front Occluded front Drylines Frontal Weather
Weather report 28 November 2017 Campinas/SP
 Weather report 28 November 2017 Campinas/SP Summary: 1) Synoptic analysis and pre-convective environment 2) Verification 1) Synoptic analysis and pre-convective environment: At 1200 UTC 28 November 2017
The Impact of air-sea interaction on the extratropical transition of tropical cyclones
 The Impact of air-sea interaction on the extratropical transition of tropical cyclones Sarah Jones Institut für Meteorologie und Klimaforschung Universität Karlsruhe / Forschungszentrum Karlsruhe 1. Introduction
Examples of Pressure Gradient. Pressure Gradient Force. Chapter 7: Forces and Force Balances. Forces that Affect Atmospheric Motion 2/2/2015
 Chapter 7: Forces and Force Balances Forces that Affect Atmospheric Motion Fundamental force - Apparent force - Pressure gradient force Gravitational force Frictional force Centrifugal force Forces that
Upper-tropospheric downstream development leading to surface cyclogenesis in the central Mediterranean
 Meteorol. Appl. 6, 33 3 (999) Upper-tropospheric downstream development leading to surface cyclogenesis in the central Mediterranean Nicholas G Prezerakos, Helena A Flocas and Silas C Michaelides 3 General
1/25/2010. Circulation and vorticity are the two primary
 Lecture 4: Circulation and Vorticity Measurement of Rotation Circulation Bjerknes Circulation Theorem Vorticity Potential Vorticity Conservation of Potential Vorticity Circulation and vorticity are the
Diagnostic Study of a Severe Thunderstorm over Jeddah
 Atmospheric and Climate Sciences, 2013, 3, 150-164 http://dx.doi.org/10.4236/acs.2013.31017 Published Online January 2013 (http://www.scirp.org/journal/acs) Diagnostic Study of a Severe Thunderstorm over
Chapter 12 Fronts & Air Masses
 Chapter overview: Anticyclones or highs Air Masses o Classification o Source regions o Air masses of North America Fronts o Stationary fronts o Cold fronts o Warm fronts o Fronts and the jet stream o Frontogenesis
Diabatic processes and the structure of the warm conveyor belt
 2 nd European Windstorm Workshop Leeds, 3-4 September 2012 Diabatic processes and the structure of the warm conveyor belt Oscar Martínez-Alvarado J. Chagnon, S. Gray, R. Plant, J. Methven Department of
WATER VAPOUR IMAGERY ANALYSIS IN 7.3µ/6.2µ FOR DIAGNOSING THERMO-DYNAMIC CONTEXT OF INTENSE CONVECTION
 WATER VAPOUR IMAGERY ANALYSIS IN 7.3µ/6.2µ FOR DIAGNOSING THERMO-DYNAMIC CONTEXT OF INTENSE CONVECTION P. Santurette 1 and C.G. Georgiev 2 1 Météo-France, 42, Avenue G. Coriolis, 31057 Toulouse Cedex 01,
A Cyclogenesis south of the Alps. Manfred Kurz Neustadt/Weinstraße
 A Cyclogenesis south of the Alps Manfred Kurz Neustadt/Weinstraße A cyclogenesis south of the Alps Surface maps 06-11-99, 00 UTC The occluded frontal system of a quasi-stationary low above the North Sea
True or false: The atmosphere is always in hydrostatic balance. A. True B. False
 Clicker Questions and Clicker Quizzes Clicker Questions Chapter 7 Of the four forces that affect the motion of air in our atmosphere, which is to thank for opposing the vertical pressure gradient force
San Francisco State University Department of Earth & Climate Sciences Fall 2017
 San Francisco State University Name Department of Earth & Climate Sciences Fall 2017 Part 1: Fronts Final Inclass Exercise (Inclass Exercise 11) Diagnosing Fronts and Upper Tropospheric Divergence Patterns
Vertical Structure of Atmosphere
 ATMOS 3110 Introduction to Atmospheric Sciences Distribution of atmospheric mass and gaseous constituents Because of the earth s gravitational field, the atmosphere exerts a downward forces on the earth
Solutions to Comprehensive Final Examination Given on Thursday, 13 December 2001
 Name & Signature Dr. Droegemeier Student ID Meteorology 1004 Introduction to Meteorology Fall, 2001 Solutions to Comprehensive Final Examination Given on Thursday, 13 December 2001 BEFORE YOU BEGIN!! Please
2D.1 DETERMINATION OF A CONSISTENT TIME FOR THE EXTRATROPICAL TRANSITION OF TROPICAL CYCLONES
 2D.1 DETERMINATION OF A CONSISTENT TIME FOR THE EXTRATROPICAL TRANSITION OF TROPICAL CYCLONES David E. Kofron*, Elizabeth A. Ritchie, and J. Scott Tyo University of Arizona, Tucson, Arizona 1. INTRODUCTION
DANISH METEOROLOGICAL INSTITUTE
 DANISH METEOROLOGICAL INSTITUTE SCIENTIFIC REPORT 3-11 Quasigeostrophic interpretation of extratropical cyclogenesis Niels Woetmann Nielsen COPENHAGEN 23 ISSN Nr. 9-3263 (printed) ISSN Nr. 1399-1949 (online)
Dynamics of the Atmosphere. Large-scale flow with rotation and stratification
 12.810 Dynamics of the Atmosphere Large-scale flow with rotation and stratification Visualization of meandering jet stream Upper level winds from June 10th to July 8th 1988 from MERRA Red shows faster
Refer to Figure 1 and what you have learned so far in this course when responding to the following:
 Refer to Figure 1 and what you have learned so far in this course when responding to the following: 1.Looking down on a Northern Hemisphere extratropical cyclone, surface winds blow [(clockwise and outward)(counterclockwise
Transient/Eddy Flux. Transient and Eddy. Flux Components. Lecture 7: Disturbance (Outline) Why transients/eddies matter to zonal and time means?
 Why transients/eddies matter to zonal and time means?") Lecture 7: Disturbance (Outline) Transients and Eddies Climate Roles Mid-Latitude Cyclones Tropical Hurricanes Mid-Ocean Eddies (From Weather & Climate) Flux Components (1) (2) (3) Three components contribute
Lecture 7: Disturbance (Outline) Transients and Eddies Climate Roles Mid-Latitude Cyclones Tropical Hurricanes Mid-Ocean Eddies (From Weather & Climate) Flux Components (1) (2) (3) Three components contribute
The Physics of Jet Stream Meandering
 Advances in Systems Science and Application (2015) Vol.15 No.3 294-302 The Physics of Jet Stream Meandering Walter E Janach Meggenhornstrasse 20, CH-6045 Meggen, Switzerland Abstract Large-amplitude jet
Isentropic Thinking & Airstreams Analysis
 Isentropic Thinking & Airstreams Analysis Drs. James T. Moore & Sam Ng Saint Louis University & Metropolitan State College of Denver Utility of Isentropic Analysis Diagnose and visualize vertical motion
Using simplified vorticity equation,* by assumption 1 above: *Metr 430 handout on Circulation and Vorticity. Equations (4) and (5) on that handout
 and (5) on that handout") Rossby Wave Equation A. Assumptions 1. Non-divergence 2. Initially, zonal flow, or nearly zonal flow in which u>>v>>w. 3. Initial westerly wind is geostrophic and does not vary along the x-axis and equations
Rossby Wave Equation A. Assumptions 1. Non-divergence 2. Initially, zonal flow, or nearly zonal flow in which u>>v>>w. 3. Initial westerly wind is geostrophic and does not vary along the x-axis and equations
3. Midlatitude Storm Tracks and the North Atlantic Oscillation
 3. Midlatitude Storm Tracks and the North Atlantic Oscillation Copyright 2006 Emily Shuckburgh, University of Cambridge. Not to be quoted or reproduced without permission. EFS 3/1 Review of key results
Synoptic-Dynamic Meteorology in Midlatitudes
 Synoptic-Dynamic Meteorology in Midlatitudes VOLUME II Observations and Theory of Weather Systems HOWARD B. BLUESTEIN New York Oxford OXFORD UNIVERSITY PRESS 1993 Contents 1. THE BEHAVIOR OF SYNOPTIC-SCALE,
Science Olympiad Meteorology Quiz #1 Page 1 of 7
 1) What is generally true about the stratosphere: a) Has turbulent updrafts and downdrafts. b) Has either a stable or increasing temperature profile with altitude. c) Where the auroras occur. d) Both a)
2. Meridional atmospheric structure; heat and water transport. Recall that the most primitive equilibrium climate model can be written
 2. Meridional atmospheric structure; heat and water transport The equator-to-pole temperature difference DT was stronger during the last glacial maximum, with polar temperatures down by at least twice
Science Olympiad Meteorology Quiz #2 Page 1 of 8
 1) The prevailing general direction of the jet stream is from west to east in the northern hemisphere: 2) Advection is the vertical movement of an air mass from one location to another: 3) Thunderstorms
Air Masses of North America cp and ca air masses Air mass characterized by very cold and dry conditions
 Chapter 8: Air Masses, Fronts, and Middle-Latitude Cyclones Air masses Fronts Middle-latitude cyclones Air Masses Air mass an extremely large body of air whose properties of temperature and humidity are
ATSC 2000 Final Fall 2005
 ATSC 2000 Final Fall 2005 true/false /25 multiple choice /25 short answer /23 essay /10 total /83 or % True/False Indicate whether the sentence or statement is true or false. (25 questions 1% each) 1.
1.4 CONNECTIONS BETWEEN PV INTRUSIONS AND TROPICAL CONVECTION. Beatriz M. Funatsu* and Darryn Waugh The Johns Hopkins University, Baltimore, MD
 1.4 CONNECTIONS BETWEEN PV INTRUSIONS AND TROPICAL CONVECTION Beatriz M. Funatsu* and Darryn Waugh The Johns Hopkins University, Baltimore, MD 1. INTRODUCTION Stratospheric intrusions into the tropical
EAS372 Open Book Final Exam 11 April, 2013
 EAS372 Open Book Final Exam 11 April, 2013 Professor: J.D. Wilson Time available: 2 hours Value: 30% Please check the Terminology, Equations and Data section before beginning your responses. Answer all
Examination #3 Wednesday, 28 November 2001
 Name & Signature Dr. Droegemeier Student ID Meteorology 1004 Introduction to Meteorology Fall, 2001 Examination #3 Wednesday, 28 November 2001 BEFORE YOU BEGIN!! Please be sure to read each question CAREFULLY
Transient and Eddy. Transient/Eddy Flux. Flux Components. Lecture 3: Weather/Disturbance. Transient: deviations from time mean Time Mean
 Lecture 3: Weather/Disturbance Transients and Eddies Climate Roles Mid-Latitude Cyclones Tropical Hurricanes Mid-Ocean Eddies Transient and Eddy Transient: deviations from time mean Time Mean Eddy: deviations
The Impact of the Extratropical Transition of Typhoon Dale (1996) on the Early Wintertime Stratospheric Circulation
 on the Early Wintertime Stratospheric Circulation") The Impact of the Extratropical Transition of Typhoon Dale (1996) on the Early 1996-97 Wintertime Stratospheric Circulation Andrea L. Lang 1, Jason M. Cordeira 2, Lance F. Bosart 1 and Daniel Keyser 1
The Impact of the Extratropical Transition of Typhoon Dale (1996) on the Early 1996-97 Wintertime Stratospheric Circulation Andrea L. Lang 1, Jason M. Cordeira 2, Lance F. Bosart 1 and Daniel Keyser 1
Revisiting the Structure and Characteristics of an Early Summer Monsoon Trough over South China in 1975
 194 SOLA, 2014, Vol. 10, 194 198, doi:10.2151/sola.2014-041 Revisiting the Structure and Characteristics of an Early Summer Monsoon Trough over South China in 1975 Feng Hsiao and Yi-Leng Chen University
Name SOLUTIONS T.A./Section Atmospheric Science 101 Homework #6 Due Thursday, May 30 th (in class)
") Name SOLUTIONS T.A./Section Atmospheric Science 101 Homework #6 Due Thursday, May 30 th (in class) 1. General Circulation Briefly describe where each of the following features is found in the earth s general
Name SOLUTIONS T.A./Section Atmospheric Science 101 Homework #6 Due Thursday, May 30 th (in class) 1. General Circulation Briefly describe where each of the following features is found in the earth s general
Class exercises Chapter 3. Elementary Applications of the Basic Equations
 Class exercises Chapter 3. Elementary Applications of the Basic Equations Section 3.1 Basic Equations in Isobaric Coordinates 3.1 For some (in fact many) applications we assume that the change of the Coriolis
The feature of atmospheric circulation in the extremely warm winter 2006/2007
 The feature of atmospheric circulation in the extremely warm winter 2006/2007 Hiroshi Hasegawa 1, Yayoi Harada 1, Hiroshi Nakamigawa 1, Atsushi Goto 1 1 Climate Prediction Division, Japan Meteorological
Mesoscale analysis of a comma cloud observed during FASTEX
 Meteorol. Appl. 7, 129 134 (2000) Mesoscale analysis of a comma cloud observed during FASTEX K D Williams, Joint Centre for Mesoscale Meteorology, Department of Meteorology, University of Reading, PO Box
1. INTRODUCTION: 2. DATA AND METHODOLOGY:
 27th Conference on Hurricanes and Tropical Meteorology, 24-28 April 2006, Monterey, CA 3A.4 SUPERTYPHOON DALE (1996): A REMARKABLE STORM FROM BIRTH THROUGH EXTRATROPICAL TRANSITION TO EXPLOSIVE REINTENSIFICATION
Part-8c Circulation (Cont)
") Part-8c Circulation (Cont) Global Circulation Means of Transfering Heat Easterlies /Westerlies Polar Front Planetary Waves Gravity Waves Mars Circulation Giant Planet Atmospheres Zones and Belts Global
Part-8c Circulation (Cont) Global Circulation Means of Transfering Heat Easterlies /Westerlies Polar Front Planetary Waves Gravity Waves Mars Circulation Giant Planet Atmospheres Zones and Belts Global
MET 3502 Synoptic Meteorology. Lecture 8: September 16, AIRMASSES, FRONTS and FRONTAL ANALYSIS (2)
") MET 3502 Synoptic Meteorology Lecture 8: September 16, 2010 AIRMASSES, FRONTS and FRONTAL ANALYSIS (2) Identifying a cold front on a surface weather map: 1. Surface front is located at the leading edge
MET 3502 Synoptic Meteorology Lecture 8: September 16, 2010 AIRMASSES, FRONTS and FRONTAL ANALYSIS (2) Identifying a cold front on a surface weather map: 1. Surface front is located at the leading edge
General Atmospheric Circulation
 General Atmospheric Circulation Take away Concepts and Ideas Global circulation: The mean meridional (N-S) circulation Trade winds and westerlies The Jet Stream Earth s climate zones Monsoonal climate
Diabatic processes and the structure of extratropical cyclones
 Geophysical and Nonlinear Fluid Dynamics Seminar AOPP, Oxford, 23 October 2012 Diabatic processes and the structure of extratropical cyclones Oscar Martínez-Alvarado R. Plant, J. Chagnon, S. Gray, J. Methven
The Behaviour of the Atmosphere
 3 The Behaviour of the Atmosphere Learning Goals After studying this chapter, students should be able to: apply the ideal gas law and the concept of hydrostatic balance to the atmosphere (pp. 49 54); apply
Synoptic Meteorology II: Potential Vorticity Inversion and Anomaly Structure April 2015
 Synoptic Meteorology II: Potential Vorticity Inversion and Anomaly Structure 14-16 April 2015 Readings: Sections 4.2 and 4.4 of Midlatitude Synoptic Meteorology. Potential Vorticity Inversion Introduction
Isentropic Analysis. We can look at weather data in other ways besides on constantpressure. Meteorology 411 Iowa State University Week 11 Bill Gallus
 Isentropic Analysis We can look at weather data in other ways besides on constantpressure surfaces! Meteorology 411 Iowa State University Week 11 Bill Gallus A brief history of meteorology In the 1930s
Project 2 Fronts
 12.307 Project 2 Fronts Lodovica Illari and John Marshall March 2010 Abstract We inspect fronts crossing the country associated with day-to-day variations in the weather using real-time atmospheric observations.
Summary of November Central U.S. Winter Storm By Christopher Hedge
 Summary of November 12-13 2010 Central U.S. Winter Storm By Christopher Hedge Event Overview The first significant snowfall of the 2010-2011 season affected portions of the plains and upper Mississippi
Dynamic Meteorology 1
 Dynamic Meteorology 1 Lecture 14 Sahraei Department of Physics, Razi University http://www.razi.ac.ir/sahraei Buys-Ballot rule (Northern Hemisphere) If the wind blows into your back, the Low will be to
Synoptic Meteorology I: Skew-T Diagrams and Thermodynamic Properties
 Synoptic Meteorology I: Skew-T Diagrams and Thermodynamic Properties For Further Reading Most information contained within these lecture notes is drawn from Chapters 1, 2, 4, and 6 of The Use of the Skew
CHAPTER 2 - ATMOSPHERIC CIRCULATION & AIR/SEA INTERACTION
 Chapter 2 - pg. 1 CHAPTER 2 - ATMOSPHERIC CIRCULATION & AIR/SEA INTERACTION The atmosphere is driven by the variations of solar heating with latitude. The heat is transferred to the air by direct absorption
Diabatic processes modifying potential vorticity in a North Atlantic cyclone
 Quarterly Journal of the Royal Meteorological Society Q. J. R. Meteorol. Soc. 139: 17 1, July 13 A Diabatic processes modifying potential vorticity in a North Atlantic cyclone J. M. Chagnon,* S. L. Gray
A more detailed and quantitative consideration of organized convection: Part I Cold pool dynamics and the formation of squall lines
 A more detailed and quantitative consideration of organized convection: Part I Cold pool dynamics and the formation of squall lines Note: Lecture notes presented here based on course Daily Weather Laboratory
Introduction to Conceptual Models
 Zentralanstalt für Meteorologie und Geodynamik Introduction to Conceptual Models Veronika Zwatz-Meise IR Satellite Images with Satrep From Cloud systems in satellite images to Conceptual Models If we look
Winds and Global Circulation
 Winds and Global Circulation Atmospheric Pressure Winds Global Wind and Pressure Patterns Oceans and Ocean Currents El Nino How is Energy Transported to its escape zones? Both atmospheric and ocean transport
Rapid cyclogenesis over Poland on 28 March 1997
 Meteorol. Appl. 6, 363 370 (1999) Rapid cyclogenesis over Poland on 28 March 1997 Jan Waclaw Parfiniewicz, Institute of Meteorology and Water Management, ul. Podleœna 61, 01 673 Warszawa, Poland A small
Lec 10: Interpreting Weather Maps
 Lec 10: Interpreting Weather Maps Case Study: October 2011 Nor easter FIU MET 3502 Synoptic Hurricane Forecasts Genesis: on large scale weather maps or satellite images, look for tropical waves (Africa
A Numerical Modeling Study of Mesoscale Cyclogenesis to the East of the Korean Peninsula
 VOLUME 126 MONTHLY WEATHER REVIEW SEPTEMBER 1998 A Numerical Modeling Study of Mesoscale Cyclogenesis to the East of the Korean Peninsula TAE-YOUNG LEE AND YOUNG-YOUN PARK Department of Atmospheric Sciences,
Answer Key for Practice Test #2
 Answer Key for Practice Test #2 Section 1. Multiple-choice questions. Choose the one alternative that best completes the statement or answers the question. Mark your choice on the optical scan sheet. 1.
McGraw Hill Yearbook of Science & Technology Extratropical cyclone occlusion. McGraw Hill 2008 Yearbook of Science & Technology.
 McGraw Hill Yearbook of Science & Technology 0 Extratropical cyclone occlusion Journal: McGraw Hill 0 Yearbook of Science & Technology Manuscript ID: draft Manuscript Type: Date Submitted by the Author:
13 Extratropical cyclones
 Copyright 2015 by Roland Stull. Practical Meteorology: An Algebra-based Survey of Atmospheric Science 13 Extratropical cyclones Contents Cyclone Characteristics 426 Cyclogenesis & Cyclolysis 426 Cyclone