AIRNow and AIRNow-Tech
|
|
|
- Damian Thomas
- 5 years ago
- Views:
Transcription
1 AIRNow and AIRNow-Tech Dianne S. Miller and Alan C. Chan Sonoma Technology, Inc. Petaluma, California Presented to the National Tribal Forum Spokane, Washington June 15,
2 Outline Overview of AIRNow AIRNow-Tech About Features Case study analysis: Use of AIRNow-Tech during 2008 California wildfires Related topics Air Quality Index (AQI) Getting data into AIRNow AIRNow mapping AIRNow-Tech Demonstration 2
 Collects, quality")

3 Overview of AIRNow AIRNow provides a common framework for acquiring and distributing air quality information that Fosters community effort among tribal, federal, state, and local air quality agencies (130+) Collects, quality assures, and transfers real-time and forecasted air quality information to the public Communicates air quality via the AQI Issues weather/air quality news stories Enables partnerships with national media Provides air quality education and outreach 3
4 Overview of AIRNow Program Coordination: 44 tribes, 130+ agencies, and 1,500+ stakeholders Monitoring: 2,000+ sites, 400 forecasts Assistance: 130+ agencies, 30+ media users, 20+ data users Education: Stakeholders Media outreach: print, TV, web outlets, social media Systems Centralization: one-stop data source for real-time/forecast data Quality control : automated and manual quality checks AQI conversion: consistency across the nation Mapping: quick and automated mapping methods Distribution: data for public, media, researchers, systems 4
5 Overview of AIRNow AIRNow vs. AQS AQS * Data available on AIRNow-Tech back to February 2009 AIRNow Data use Regulatory decisions Health-based decisions, mapping, education Timeliness of data 6-12 month delay Real-time Historical record 6-12 months prior to 1998 Last hour to 2002* Data quality Official data Preliminary data Routine mapping Not available Hourly on AIRNow.gov Data access Data Mart AIRNow-Tech and AIRNow Gateway Media distribution Not available Hourly (AQI observations and forecasts) 5


»")

6 Overview of AIRNow A Brief History 1997: Beginning (northeast U.S.) : Expanding coverage Early 2000s: First tribal partner : New services» AIRNow-Tech (technical web site)» AIRNow Gateway (distribution service)» Coordination with media» More pollutants 2009+: AIRNow-International» New software system» Coordination with other countries 6

7 Participation: States/Provinces 7

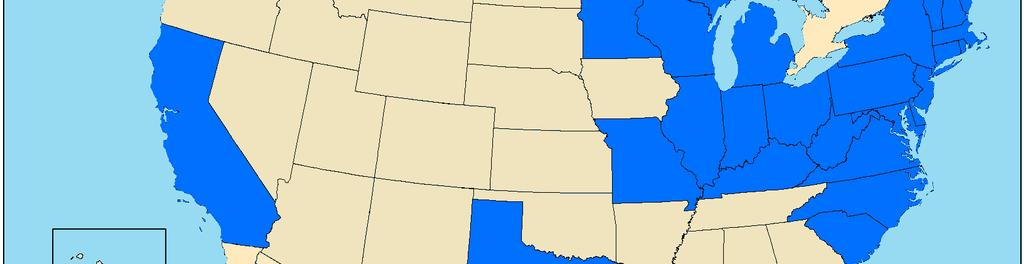
8 Participation: States/Provinces 8

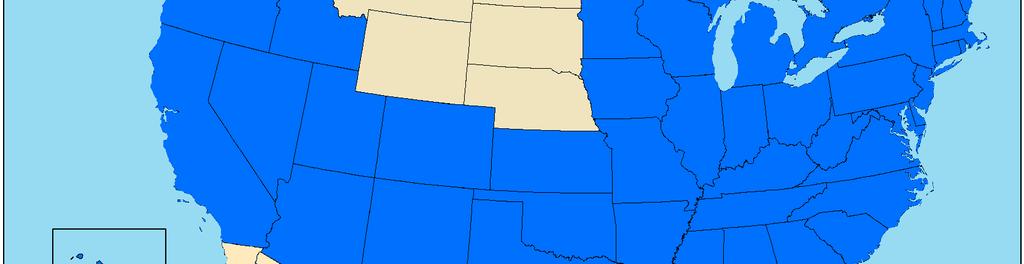
9 Participation: States/Provinces 9

10 Participation: States/Provinces 10

11 Participation: Shanghai States/Provinces 11
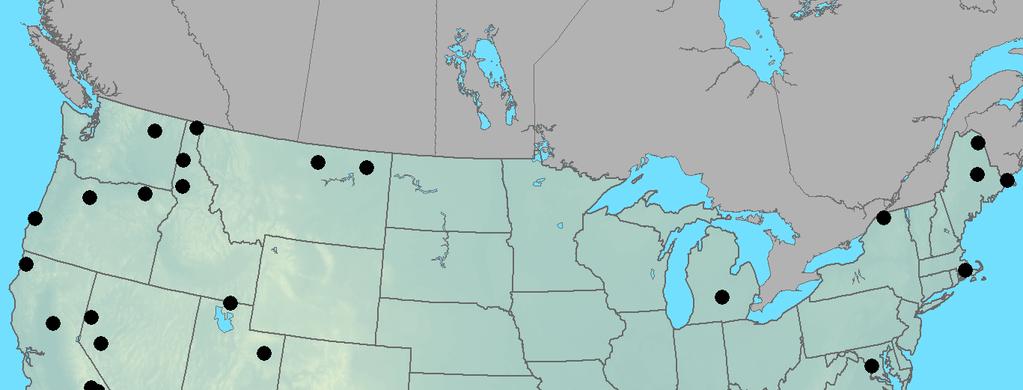
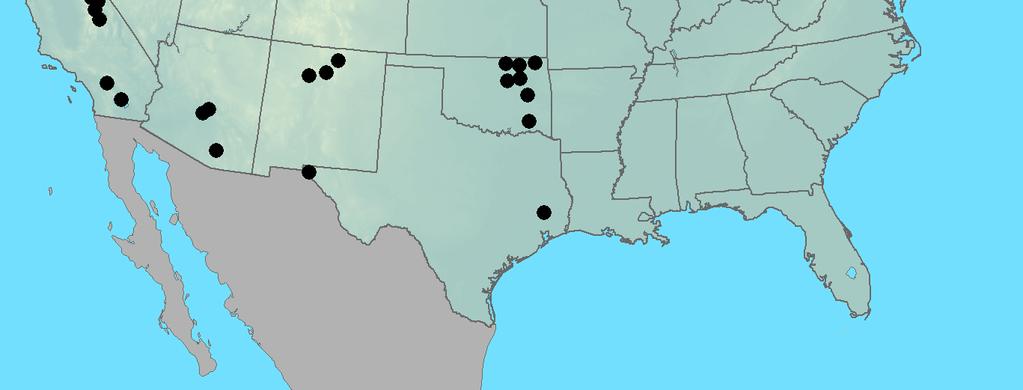
12 Participation by Tribal Groups 12


13 Overview of AIRNow Purpose Data Decision Inform the public, media, and decision makers Educate and support the voluntary AIRNow community of agencies Provide data to other systems


14 Overview of AIRNow Community 130+ tribes and agencies 1,500+ stakeholders and users 2,000+ monitoring sites 400 forecast cities 14
15 Overview of AIRNow Data Flow 130+ Air Agencies 15


16 Example Monitoring Data Flow Data dissemination to public 10:25-11:00 LST Data collection 09:00-10:00 LST Delivery to AIRNow 10:01-10:30 LST Automatic QA/QC 10:01-10:25 LST AIRNow Gateway data files Data file AIRNow database Example: Cherokee Nation delivers data 5-9 minutes past every hour AIRNow web services 16


17 AIRNowTech.org About AIRNow-Tech Decision Support System management and analysis tool for the AIRNow Program GIS functions HYSPLIT trajectory tool, satellite, and smoke products Data queries, personalized tools, preferences, and services Ability to view meteorological and air quality data Password-protected user accounts Hazard Mapping System smoke plumes with forward HYSPLIT trajectories 17
18 AIRNow-Tech Features (1 of 2) Home Relevant news, events, and snapshot of agency status Agencies Status of monitor data delivery by agency and parameter Sites Monitor information, configuration, and status by site Navigator (GIS) Monitor maps, current and historical air quality and meteorological data display, HYSPLIT trajectories, numerous supporting GIS layers (including tribal boundaries) Data Hourly, daily, and historical monitoring data queries Forecasts Forecast submittal, analysis tools, and configuration Polling Summaries on data delivery times and completeness Notifier AIRNow program listserv EnviroFlash Air quality forecast distribution system Resources General information for AIRNow Program and the Data Management Center (DMC) My Account Account management, customizable preferences, and tools 18
19 AIRNow-Tech Features (2 of 2) AIRNow-Tech tools for current or past event analysis Query and export spreadsheets Real-time and past hourly air quality data (PM 2.5, PM 10, O 3, and other pollutants) Data summaries (e.g., days with AQI over 100) Create time-series plots of current and past hourly or daily air quality data Access real-time and past meteorological observations Create and save GIS maps of Current or past observed AQ and meteorological conditions HYSPLIT backward and forward trajectories at different heights Hazard Mapping System smoke and fire locations and other layers 19
20 Case Study Analysis with AIRNow-Tech AIRNow-Tech was a key tool during the summer wildfires of 2008 in California Data flowed into AIRNow from mobile monitors that were deployed near fire locations Emergency response personnel used AIRNow-Tech to track air quality Data queries Navigator GIS HYSPLIT Satellite-detected fire locations 20

21 AIRNow-Tech Navigator (1 of 3) = Mobile Monitors July 9, 2008, at 11 a.m. PST Hourly PM 2.5 concentrations in µg/m³ 21
22 AIRNow-Tech Navigator (2 of 3) Sacramento = Satellite-detected fires 24-hour backward trajectory at 300 m Backward trajectory showing where Sacramento s air came from during the last 24 hours. 22

23 AIRNow-Tech Navigator (3 of 3) Sacramento 24-hour forward trajectory at 300 m July 10, 2008, at 11 a.m. PST Hourly PM 2.5 concentrations in µg/m³ Forward trajectory showing where the smoke from the wildfires was going during the next 24 hours. 23
 Air Quality Index (AQI) Provides indicator of the quality of the air and its health effects Color is key for communication Ranges from 0 to 500 101 corresponds to the level that violates the")
24 What is the Air Quality Index? (1 of 3) Air Quality Index (AQI) Provides indicator of the quality of the air and its health effects Color is key for communication Ranges from 0 to corresponds to the level that violates the federal health standard (except for PM 2.5 ) AQI Values AQI Category (Descriptor) AQI Color 0-50 Good Green Moderate Yellow Unhealthy for Sensitive Groups Orange Unhealthy Red Very Unhealthy Purple Hazardous Maroon 24
25 What is the Air Quality Index? (2 of 3) Descriptors Good 0 50 Moderate Unhealthy for Sensitive Groups Unhealthy Very Unhealthy Hazardous Cautionary Statements No message Moderate health concerns for unusually sensitive individuals Identifiable groups at risk different groups for different pollutants General public at risk; sensitive groups at greater risk General public at greater risk; sensitive groups at greatest risk Health warnings of emergency conditions NAAQS* *National Ambient Air Quality Standard 25
26 What is the Air Quality Index? AQI Breakpoints (3 of 3) AQI Values 8-hr Avg O 3 (ppm) 24-hr Avg PM 10 (µg/m 3 ) 24-hr Avg PM 2.5 (µg/m 3 ) Not defined
27 Pollutant Reporting Air Quality Index Uniform for all pollutants Raw data 1-hr ozone concentration of 102 ppb 8-hr ozone concentration estimate of 87 ppb Standardization 129 AQI 24-hr PM 2.5 concentration of 52 µg/m 3 Health effects (general) Members of sensitive groups may experience health effects. The general public is not likely to be affected. Health effects (by pollutant) Ozone PM 2.5 Active children and adults, and people with respiratory disease, such as asthma, should limit prolonged outdoor exertion. People with heart or lung disease, older adults, and children should reduce prolonged activity or exertion. 27
28 Getting Data into AIRNow Three ways to submit data to AIRNow OBS file (phasing out) XML file via Data Exchange Node AQCSV file Details on each file format are available on the AIRNow-Tech Resources page Many data logger manufacturers have modules available to automatically create one or more of these formats 28

29 OBS Format Legacy format for data ingest into AIRNow Why are we phasing it out? Difficult to program No native support for Mobile monitors Three-dimensional data Limited list of accepted parameters No sub-hourly data Applied only to North America Difficult to use in mobile applications 29
 Allows for Ingest of AQS")

30 AQCSV Format (1 of 2) Supports AQS standards (parameter codes, POC) Any AQS parameters Speciated/lab data Mobile monitors data (changing location) Allows for Ingest of AQS data into AIRNow Backfill of AQS certified data into AIRNow when available Bulk data updates Support of international data exchange Easy encoding and parsing of data (Excel) 30

 AQCSV Format (2 of 2)")
31 ISO Standards Country codes (840 = USA) Date and time AQS-Based Parameter codes Units codes Support for AQS qualifier codes Location information Latitude and longitude Elevation and GIS datum Method codes Measurement performance characteristics (value and uncertainty) AQCSV Format (2 of 2) 31


32 AIRNow Maps Map types include Forecast or observed AQI Pollutant-specific or overall AQI Local, regional, or national scale Current hour, current animation, or daily peak Map are archived on AIRNow.gov Maps are created automatically whenever new data are received Forecasts Observations 32


33 AIRNow.gov Current Air Quality Maps Forecast Current maps AQI AQI maps Animation Current Current Ozone PM 2.5 Archive maps 33

34 AIRNow.gov Archived Maps Search archives by Map type Region Month/year 34
35 Making AIRNow Maps: Masking AQI is first interpolated based on observations at stations. But how do we deal with monitor-sparse regions? 35


36 AIRNow Maps: Masking A mask is created to block out areas without sufficient monitoring. Blue shading indicates masked areas 36


37 AIRNow Maps: Masking The resulting map shows interpolated AQI which is accurate near station observations but is not displayed in regions far from monitors. 37
38 AIRNow-Tech Demonstration Site and monitor management Performing data queries Navigator GIS Customizable preferences and tools in My Account 38

39 AIRNow-Tech Home Page AIRNowTech.org Default home page includes a News and Events section and a Polling Summary of all participating agencies Home page can be personalized to include other agency-specific information 39

40 Site and Monitor Management (1 of 4) Current agency delivery status is shown with colorcoded boxes 40

41 Site and Monitor Management (2 of 4) Current parameter delivery status is shown with color-coded boxes 41

42 Site and Monitor Management (3 of 4) Easily toggle through your agency s sites by using the drop-down menu. Edit site information by clicking on Enable Editing. Site status can be set to either Active or Inactive. Data from both Active and InactiveEdit sites parameter undergo QC and can information be queried by using AIRNow-Tech. clicking on However, a only data name from Active sites are used to produce maps and other AQI reporting products. 42

43 Site and Monitor Management (4 of 4) Approve data for public reporting 43
")
44 Performing Data Queries (1 of 7) 44
")
45 Performing Data Queries (2 of 7) 45
")
46 Performing Data Queries (3 of 7) 46
")
47 Performing Data Queries (4 of 7) 47
48 Performing Data Queries (5 of 7) 48

49 Performing Data Queries (6 of 7) Access to all parameters Useful for analyzing diurnal trends and daily averages Sorting and row/column summaries available 49
 Enhanced data grouping and graphing Useful for multiyear analysis")
50 Performing Data Queries (7 of 7) Access to all parameters Useful for daily maximum values or AQI categories over a few weeks or months Sorting and row/column summaries available Data from 1993 to present (ozone only until 2009) Enhanced data grouping and graphing Useful for multiyear analysis 50

51 Navigator GIS (1 of 11) 51
52 Navigator GIS (2 of 11) Site locations with optional site label Air quality monitoring site NWS site 52
53 Navigator GIS (3 of 11) Monitor data with labels Selected PM 2.5 hourly data 53
54 Navigator GIS (4 of 11) View one of seven meteorological parameters from both NWS and air quality agencies 54
 Wind barbs")
55 Navigator GIS (5 of 11) Wind barbs 55
56 Navigator GIS (6 of 11) Input trajectory parameters Run backward and forward HYSPLIT trajectories 56
57 Navigator GIS (7 of 11) Backward trajectory with optional labels 57
58 Navigator GIS (8 of 11) Go to a previous hour or day The location of the trajectory parcel moves every hour 58

59 Navigator GIS (9 of 11) Use the magnifying glass zoom out tool to view a larger scale regional map 59

60 Navigator GIS (10 of 11) Use the Layers tab to add map layers, including tribal lands
 smoke plumes with forward HYSPLIT")
61 Navigator GIS (10 of 11) Hazard Mapping System (HMS) smoke plumes with forward HYSPLIT trajectories 61
")
62 My Account (1 of 4) 62

63 My Account (2 of 4) Turn DMC s on/off 63
64 My Account (3 of 4) Site List Management 64

65 My Account (4 of 4) Report Management Weekly Ozone Exceedances 65

66 Resources The AIRNow-Tech Resources page has Tutorial videos Manuals and Instructions Data formats and processing details Links and other useful information 66

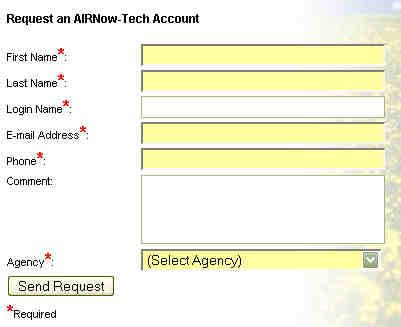
67 Request an Account 67

68 AIRNow Scoping Study for Tribal/Underserved Communities Purpose: to better serve members of tribes and communities that are involved in air quality management Focuses on the data collection, information management, and decision support needs of air quality managers at tribal and community air agencies Provides information for future efforts to improve AIRNow system in ways that benefit tribes and communities Timeline: March-October
69 Contacts Alan Chan Dianne Miller
AIRNow and AIRNow-Tech
 AIRNow and AIRNow-Tech Dianne S. Miller and Alan C. Chan Sonoma Technology, Inc. Petaluma, California Presented to the National Tribal Forum Spokane, Washington June 15, 2011 910216-4140 Outline Overview
EPA AIRNow Program. Air Quality Index Reporting and Forecasts. Prepared by: John E. White
 EPA AIRNow Program Air Quality Index Reporting and Forecasts Prepared by: John E. White 1st Workshop on Satellite Observations for Air Quality Management May 9th, 2011 Outline AIRNow Program Overview Air
Central Ohio Air Quality End of Season Report. 111 Liberty Street, Suite 100 Columbus, OH Mid-Ohio Regional Planning Commission
 217 218 Central Ohio Air Quality End of Season Report 111 Liberty Street, Suite 1 9189-2834 1 Highest AQI Days 122 Nov. 217 Oct. 218 July 13 Columbus- Maple Canyon Dr. 11 July 14 London 11 May 25 New Albany
Air Quality Forecasting Activities in the United States
 Air Quality Forecasting Activities in the United States NARSTO Executive Assembly May 9-10, 2006 Ottawa, Canada Richard A. Chet Wayland U.S. Environmental Protection Agency Research Triangle Park, North
Monitoring Extreme Weather Events. February 8, 2010
 Monitoring Extreme Weather Events February 8, 2010 Extensive network of over 800 stations across the Prairies Good coverage across entire agriculture production region Network of networks strategy includes
Overview of U.S. Forecasting/Outreach Methods
 Overview of U.S. Forecasting/Outreach Methods John E. White, US EPA white.johne@epa.gov NCAR/ASP 2016 Summer Colloquium on Air Quality Outline Air Quality Forecasting in the U.S. How it is done Challenges
Addendum to the. Submitted to U.S. EPA Region 9 March 17, Prepared by:
 Addendum to the Exceptional Events Demonstration for 2015 Ozone Exceedance in Washoe County from the 2015 California Wildfires August 21, 2015 Submitted to U.S. EPA Region 9 March 17, 2017 Prepared by:
Guide to Hydrologic Information on the Web
 NOAA s National Weather Service Guide to Hydrologic Information on the Web Colorado River at Lees Ferry Photo: courtesy Tim Helble Your gateway to web resources provided through NOAA s Advanced Hydrologic
End of Ozone Season Report
 End of Ozone Season Report Central Ohio: April 1 through October 31, 2016 The Mid-Ohio Regional Planning Commission (MORPC) is part of a network of agencies across the country that issues daily air quality
AREP GAW. AQ Forecasting
 AQ Forecasting What Are We Forecasting Averaging Time (3 of 3) PM10 Daily Maximum Values, 2001 Santiago, Chile (MACAM stations) 300 Level 2 Pre-Emergency Level 1 Alert 200 Air Quality Standard 150 100
MPCA Forecasting Summary 2010
 MPCA Forecasting Summary 2010 Jessica Johnson, Patrick Zahn, Natalie Shell Sonoma Technology, Inc. Petaluma, CA Presented to Minnesota Pollution Control Agency St. Paul, MN June 3, 2010 aq-ppt2-01 907021-3880
Using Smoke Modeling Tools for Prescribed Fire Planning and Implementation A Quick Set of Instructions (Revised October 2015)
") Using Smoke Modeling Tools for Prescribed Fire Planning and Implementation A Quick Set of Instructions (Revised October 2015) Fire Management Officers (FMOs) in Region 8 are using smoke modeling more often
Using Smoke Modeling Tools for Prescribed Fire Planning and Implementation A Quick Set of Instructions (Revised October 2015) Fire Management Officers (FMOs) in Region 8 are using smoke modeling more often
MesoWest Accessing, Storing, and Delivering Environmental Observations
 MesoWest Accessing, Storing, and Delivering Environmental Observations John Horel, University of Utah John.horel@utah.edu http://mesowest.utah.edu Goal: promote and support access, storage, and use of
How Prescribed Burning and Wildfires Can Impact Daily Air Quality Forecasting. September 6, 2017 Department of Environmental Quality
 How Prescribed Burning and Wildfires Can Impact Daily Air Quality Forecasting September 6, 2017 Department of Environmental Quality Outline Air Quality Forecasting Overview Prescribed Fire Impacts Case
NOAA s Air Quality Forecasting Activities. Steve Fine NOAA Air Quality Program
 NOAA s Air Quality Forecasting Activities Steve Fine NOAA Air Quality Program Introduction Planned Capabilities Initial: 1-day 1 forecast guidance for ozone Develop and validate in Northeastern US September,
New SPOT Program. Customer Tutorial. Tim Barry Fire Weather Program Leader National Weather Service Tallahassee
 New SPOT Program Customer Tutorial Tim Barry Fire Weather Program Leader National Weather Service Tallahassee tim.barry@noaa.gov Live Demonstration http://www.weather.gov/spot/ Live Demonstration http://www.weather.gov/spot/
NOAA-EPA s s U.S. National Air Quality Forecast Capability
 NOAA-EPA s s U.S. National Air Quality Forecast Capability May 10, 2006 Paula M. Davidson 1, Nelson Seaman 1, Jeff McQueen 1, Rohit Mathur 1,2, Chet Wayland 2 1 National Oceanic and Atmospheric Administration
AQI Detectives. Learning Objective: Understand the Air Quality Index and learn how to find the daily air quality. Subjects
 AQI Detectives 8 A C T I V I T Y Learning Objective: Understand the Index and learn how to find the daily air quality. Subjects Health Social Studies Materials Computer with internet access Crayons, colored
Extreme Temperature Protocol in Middlesex-London
 Clean Air Partnership Webinar March 17, 2009 Extreme Temperature Protocol in Middlesex-London Presented by Iqbal Kalsi, MBA, CPHI(C), CCEP iqbal.kalsi@mlhu.on.ca 1 History Informal monitoring, tracking
WeatherHawk Weather Station Protocol
 WeatherHawk Weather Station Protocol Purpose To log atmosphere data using a WeatherHawk TM weather station Overview A weather station is setup to measure and record atmospheric measurements at 15 minute
Guidelines for School Closure Due to Adverse Weather or Other Conditions
 Guidelines for School Closure Due to Adverse Weather or Other Conditions Hong Kong weather can be extreme and often unpredictable necessitating the need to modify our schedules on occasion. As always,
AIRQUEST Annual Report and State of the Model
 AIRQUEST Annual Report and State of the Model Brian Lamb 1, Serena Chung 1, Farren Herron-Thorpe 2 and Joseph Vaughan 1 1 Laboratory for Atmospheric Research, Washington State University, Pullman, W, USA
Overview of Left Menu Items on the New OK-FIRE
 Overview of Left Menu Items on the New OK-FIRE In contrast to the current OK-FIRE (http://okfire.mesonet.org), in the new OK-FIRE there are only LEFT menu items (located within the orange rectangle added
AN INTERNATIONAL SOLAR IRRADIANCE DATA INGEST SYSTEM FOR FORECASTING SOLAR POWER AND AGRICULTURAL CROP YIELDS
 AN INTERNATIONAL SOLAR IRRADIANCE DATA INGEST SYSTEM FOR FORECASTING SOLAR POWER AND AGRICULTURAL CROP YIELDS James Hall JHTech PO Box 877 Divide, CO 80814 Email: jameshall@jhtech.com Jeffrey Hall JHTech
Quality Measures Green Light Report Online Management Tool. Self Guided Tutorial
 Quality Measures Green Light Report Online Management Tool Self Guided Tutorial 1 Tutorial Contents Overview Access the QM Green Light Report Review the QM Green Light Report Tips for Success Contact PointRight
Nomination Form. Clearinghouse. New York State Office for Technology. Address: State Capitol-ESP, PO Box
 NASIRE 2001 RECOGNITION AWARDS Recognizing Outstanding Achievement in the Field of Innovative Use of Technology Nomination Form Title of Nomination: Manager/Job Title: Agency: NYS Geographic Information
Gridded Ambient Air Pollutant Concentrations for Southern California, User Notes authored by Beau MacDonald, 11/28/2017
 Gridded Ambient Air Pollutant Concentrations for Southern California, 1995-2014 User Notes authored by Beau, 11/28/2017 METADATA: Each raster file contains data for one pollutant (NO2, O3, PM2.5, and PM10)
Environmental quality modeling
 Environmental quality modeling Air quality management modeling AIRQUIS Water quality management modeling WATERQUIS N:\adm\arkiv\overhead\2006\CEE\Yale-9.ppt 1 An Integrated Air Quality Managament System
HURREVAC REFERENCE IMPORTANT INFORMATION TO KNOW WHEN A STORM IS APPROACHING
 HURREVAC REFERENCE IMPORTANT INFORMATION TO KNOW WHEN A STORM IS APPROACHING PART 1: Workspace Layout Program Header (1 Red) Includes tools that allow the user to manage program setup, update forecast
United States Multi-Hazard Early Warning System
 United States Multi-Hazard Early Warning System Saving Lives Through Partnership Lynn Maximuk National Weather Service Director, Central Region Kansas City, Missouri America s s Weather Enterprise: Protecting
User Guide. Affirmatively Furthering Fair Housing Data and Mapping Tool. U.S. Department of Housing and Urban Development
 User Guide Affirmatively Furthering Fair Housing Data and Mapping Tool U.S. Department of Housing and Urban Development December, 2015 1 Table of Contents 1. Getting Started... 5 1.1 Software Version...
Instituto de Pesquisas Meteorológicas - IPMet Universidade Estadual Paulista - Unesp
 IPMET WEB GIS APPLICATION FOR SEVERE WEATHER ALERT AND DECISION SUPPORT Jaqueline Murakami Kokitsu Instituto de Pesquisas Meteorológicas - IPMet Universidade Estadual Paulista - Unesp IPMet/Unesp Meteorological
Air quality affects everyone. The
 em feature Air quality affects everyone. The average person breathes approximately 15,000 liters of air each day.1 More than 159 million people in the United States live in areas designated as nonattainment
Forecasting Panel Discussion State/Local/EPA Meeting: Year-Round/Mult-Pollutant Air Quality Index (AQI) April 24-25, 2003 USEPA Offices RTP, NC
 April 24-25, 2003 USEPA Offices RTP, NC") Forecasting Panel Discussion State/Local/EPA Meeting: Year-Round/Mult-Pollutant Air Quality Index (AQI) April 24-25, 2003 USEPA Offices RTP, NC Cary Gentry, Forsyth County EAD Dan Salkovitz (Virginia DEQ)
Forecasting Panel Discussion State/Local/EPA Meeting: Year-Round/Mult-Pollutant Air Quality Index (AQI) April 24-25, 2003 USEPA Offices RTP, NC Cary Gentry, Forsyth County EAD Dan Salkovitz (Virginia DEQ)
Basic Training Battlemind to Home Symposium. Sept
 Basic Training Battlemind to Home Symposium Sept 2017 1 What is Measuring Communities? A social indicators project which allows users to obtain military-specific information about communities strengths
WMO Public Weather Services: Enhanced Communication Skills for Improved Service Delivery. by S.W. Muchemi (WMO)
") WMO Public Weather Services: Enhanced Communication Skills for Improved Service Delivery by S.W. Muchemi (WMO) Functions of the Public Weather Services (PWS) programme of WMO To strengthen the capabilities
WMO Public Weather Services: Enhanced Communication Skills for Improved Service Delivery by S.W. Muchemi (WMO) Functions of the Public Weather Services (PWS) programme of WMO To strengthen the capabilities
LED Lighting Facts: Product Submission Guide
 LED Lighting Facts: Product Submission Guide NOVEMBER 2017 1 P a g e L E D L i g h t i n g F a c t s : M a n u f a c t u r e r P r o d u c t S u b m i s s i o n G u i d e TABLE OF CONTENTS Section 1) Accessing
Solar Time, Angles, and Irradiance Calculator: User Manual
 Solar Time, Angles, and Irradiance Calculator: User Manual Circular 674 Thomas Jenkins and Gabriel Bolivar-Mendoza 1 Cooperative Extension Service Engineering New Mexico Resource Network College of Agricultural,
Using This Flip Chart
 Using This Flip Chart Solar storms can cause fluctuations in the magnetosphere called magnetic storms. These magnetic storms have disabled satellites and burned out transformers shutting down power grids.
Using the 2008 TerraViva! SEDAC Viewer in the Classroom
 Using the 2008 TerraViva! SEDAC Viewer in the Classroom Robert R. Downs Center for International Earth Science Information Network (CIESIN) The Earth Institute, Columbia University Prepared for presentation
BASIC TECHNOLOGY Pre K starts and shuts down computer, monitor, and printer E E D D P P P P P P P P P P
 BASIC TECHNOLOGY Pre K 1 2 3 4 5 6 7 8 9 10 11 12 starts and shuts down computer, monitor, and printer P P P P P P practices responsible use and care of technology devices P P P P P P opens and quits an
Dr. Steven Koch Director, NOAA National Severe Storms Laboratory Chair, WRN Workshop Executive Committee. Photo Credit: Associated Press
 Dr. Steven Koch Director, NOAA National Severe Storms Laboratory Chair, WRN Workshop Executive Committee 1 Photo Credit: Associated Press 1" 2" Much%Increased%Vulnerability%to% High6Impact%Weather% %even%before%2011!%
IDEA. from research to routine
 IDEA. from research to routine A collaboration between NASA, EPA, NOAA and CIMSS Cooperative Institute for Meteorological Satellite Studies Infusing satellite Data in Environmental Applications (IDEA)
: : User Manual: : - 10 December
 : : User Manual: : - 0 December 06 - : : User Manual: : Table of Contents. Map Control. How to move a map. How to zoom in and out a map 4. How to inquire Ocean Currents. How to inquire predicted current
ON SITE SYSTEMS Chemical Safety Assistant
 ON SITE SYSTEMS Chemical Safety Assistant CS ASSISTANT WEB USERS MANUAL On Site Systems 23 N. Gore Ave. Suite 200 St. Louis, MO 63119 Phone 314-963-9934 Fax 314-963-9281 Table of Contents INTRODUCTION
Introduction to Weather Analytics & User Guide to ProWxAlerts. August 2017 Prepared for:
 Introduction to Weather Analytics & User Guide to ProWxAlerts August 2017 Prepared for: Weather Analytics is a leading data and analytics company based in Washington, DC and Dover, New Hampshire that offers
GIS for Integrated Pest Management. Christina Hailey. Abstract:
 GIS for Integrated Pest Management Christina Hailey Abstract: At its formation in 1965, Harris County Mosquito Control (Houston, Texas) (HCMC) was primarily involved in the prevention and control of mosquito-borne
Northrop Grumman Concept Paper
 Northrop Grumman Concept Paper A Comprehensive Geospatial Web-based Solution for NWS Impact-based Decision Support Services Glenn Higgins April 10, 2014 Northrop Grumman Corporation Information Systems
Evaluating Physical, Chemical, and Biological Impacts from the Savannah Harbor Expansion Project Cooperative Agreement Number W912HZ
 Evaluating Physical, Chemical, and Biological Impacts from the Savannah Harbor Expansion Project Cooperative Agreement Number W912HZ-13-2-0013 Annual Report FY 2018 Submitted by Sergio Bernardes and Marguerite
Overview of the Tropical Cyclone Guidance Project
 Overview of the Tropical Cyclone Guidance Project Dr. Jonathan L. Vigh With thanks to Mahsa Mirzargar (Univ. of Miami) Shanghai Typhoon Institute 09 July 2018 NCAR is sponsored by the National Science
MxVision WeatherSentry Web Services Content Guide
 MxVision WeatherSentry Web Services Content Guide July 2014 DTN 11400 Rupp Drive Minneapolis, MN 55337 00.1.952.890.0609 This document and the software it describes are copyrighted with all rights reserved.
Rainfall-River Forecasting: Overview of NOAA s Role, Responsibilities, and Services
 Dr. Thomas Graziano Chief Hydrologic Services Division NWS Headquarters Steve Buan Service Coordination Hydrologist NWS North Central River Forecast Center Rainfall-River Forecasting: Overview of NOAA
Department of Meteorology University of Nairobi. Laboratory Manual. Micrometeorology and Air pollution SMR 407. Prof. Nzioka John Muthama
 Department of Meteorology University of Nairobi Laboratory Manual Micrometeorology and Air pollution SMR 407 Prof. Nioka John Muthama Signature Date December 04 Version Lab : Introduction to the operations
RSMC WASHINGTON USER'S INTERPRETATION GUIDELINES ATMOSPHERIC TRANSPORT MODEL OUTPUTS
 RSMC WASHINGTON USER'S INTERPRETATION GUIDELINES ATMOSPHERIC TRANSPORT MODEL OUTPUTS -Version 2.0- (January 2007) 1. Introduction In the context of current agreements between the National Oceanic and Atmospheric
M E R C E R W I N WA L K T H R O U G H
 H E A L T H W E A L T H C A R E E R WA L K T H R O U G H C L I E N T S O L U T I O N S T E A M T A B L E O F C O N T E N T 1. Login to the Tool 2 2. Published reports... 7 3. Select Results Criteria...
LED Lighting Facts: Manufacturer Guide
 LED Lighting Facts: Manufacturer Guide 2018 1 P a g e L E D L i g h t i n g F a c t s : M a n u f a c t u r e r G u i d e TABLE OF CONTENTS Section 1) Accessing your account and managing your products...
Local Area Emergency (LAE)
") Local Area Emergency (LAE) An emergency message that defines an event that, by itself, does not pose a significant threat to public safety and/or property. However, the event could escalate, contribute
Local Area Emergency (LAE) An emergency message that defines an event that, by itself, does not pose a significant threat to public safety and/or property. However, the event could escalate, contribute
PUBLIC SAFETY POWER SHUTOFF POLICIES AND PROCEDURES
 PACIFIC GAS AND ELECTRIC COMPANY PUBLIC SAFETY POWER SHUTOFF POLICIES AND PROCEDURES SEPTEMBER 2018 1 PACIFIC GAS AND ELECTRIC COMPANY PUBLIC SAFETY POWER SHUTOFF POLICIES AND PROCEDURES SEPTEMBER 2018
Studying Topography, Orographic Rainfall, and Ecosystems (STORE)
") Studying Topography, Orographic Rainfall, and Ecosystems (STORE) Introduction Basic Lesson 3: Using Microsoft Excel to Analyze Weather Data: Topography and Temperature This lesson uses NCDC data to compare
Studying Topography, Orographic Rainfall, and Ecosystems (STORE) Introduction Basic Lesson 3: Using Microsoft Excel to Analyze Weather Data: Topography and Temperature This lesson uses NCDC data to compare
Reducing Vulnerability to Extreme Heat: Science-Policy Interface
 Reducing Vulnerability to Extreme Heat: Science-Policy Interface Olga Wilhelmi, Mary Hayden, Jennifer Boehnert, Ursula Lauper and SIMMER research team October 23, 2013 Toronto SIMMER workshop Science-Policy
WMO. Key Elements of PWS and Effective EWS. Haleh Haleh Kootval Chief, PWS Programme
 WMO Key Elements of PWS and Effective EWS Haleh Haleh Kootval Chief, PWS Programme Workshop Objectives This workshop is all about Service Delivery and becoming excellent at it through: Sharing experiences
GIS-Based Sediment Quality Database for the St. Louis River Area of Concern (AOC): Overview Presentations and Demonstration
: Overview Presentations and Demonstration") GIS-Based Sediment Quality Database for the St. Louis River Area of Concern (AOC): Overview Presentations and Demonstration Judy L. Crane 1 and Dawn E. Smorong 2 1 Minnesota Pollution Control Agency, St.
GIS-Based Sediment Quality Database for the St. Louis River Area of Concern (AOC): Overview Presentations and Demonstration Judy L. Crane 1 and Dawn E. Smorong 2 1 Minnesota Pollution Control Agency, St.
2018 NASCIO Award Submission Category: Cross-Boundary Collaboration and Partnerships. Project Title: Tennessee Wildfires: A Coordinated GIS Response
 2018 NASCIO Award Submission Category: Cross-Boundary Collaboration and Partnerships Project Title: Tennessee Wildfires: A Coordinated GIS Response Sevier County, Tennessee State of Tennessee, Emergency
A PRESCRIBED BURN DECISION SUPPORT SYSTEM FOR THE KANSAS FLINT HILLS REGION
 A PRESCRIBED BURN DECISION SUPPORT SYSTEM FOR THE KANSAS FLINT HILLS REGION Kenneth Craig*, Clinton MacDonald, Neil Wheeler, Alan Healy, and Patrick Zahn Sonoma Technology, Inc., Petaluma, California,
Watershed Modeling Orange County Hydrology Using GIS Data
 v. 10.0 WMS 10.0 Tutorial Watershed Modeling Orange County Hydrology Using GIS Data Learn how to delineate sub-basins and compute soil losses for Orange County (California) hydrologic modeling Objectives
The CANSAC/BLUESKY Connection
 The CANSAC/BLUESKY Connection Timothy Brown Desert Research Institute Program for Climate, Ecosystem and Fire Applications Reno, NV Partners USDA Forest Service Region 5 California Air Resources Board
Appendix 4 Weather. Weather Providers
 Appendix 4 Weather Using weather data in your automation solution can have many benefits. Without weather data, your home automation happens regardless of environmental conditions. Some things you can
New COST Action: Towards a European Network on Chemical Weather Forecasting and Information Systems
 New COST Action: Towards a European Network on Chemical Weather Forecasting and Information Systems Proposer: Mikhail Sofiev Finnish Meteorological Institute Historical background EUMETNET Workshop on
STANDARD OPERATING PROCEDURES
 PAGE: 1 of 5 CONTENTS 1.0 SCOPE AND APPLICATION 2.0 METHOD SUMMARY 3.0 SAMPLE PRESERVATION, CONTAINERS, HANDLING, AND STORAGE 4.0 INTERFERENCE AND POTENTIAL PROBLEMS 5.0 EQUIPMENT/APPARATUS 6.0 REAGENTS
IMS4 ARWIS. Airport Runway Weather Information System. Real-time data, forecasts and early warnings
 Airport Runway Weather Information System Real-time data, forecasts and early warnings Airport Runway Weather Information System FEATURES: Detection and prediction of runway conditions Alarms on hazardous
Internal Audit Report
 Internal Audit Report Right of Way Mapping TxDOT Internal Audit Division Objective To determine the efficiency and effectiveness of district mapping procedures. Opinion Based on the audit scope areas reviewed,
NWS Flood Warning Products plus a Look Ahead
 NWS Flood Warning Products plus a Look Ahead September 21 & 22, 2010 DRBC Flood Warning Users Forum Presented by Gary Szatkowski Meteorologist-in-Charge NOAA s National Weather Service Philadelphia/Mt.
WELCOME TO THE 2018 RA-IV WORKSHOP ON HURRICANE FORECASTING AND WARNING
 WELCOME TO THE 2018 RA-IV WORKSHOP ON HURRICANE FORECASTING AND WARNING Richard J. Pasch and Daniel P. Brown Senior Hurricane Specialists National Hurricane Center ORIENTATION Use of PCs NHC Facility Workshop
The Impacts of Wildfire Smoke and the Western Canada BlueSky Wildfire Smoke Forecasting System
 The Impacts of Wildfire Smoke and the Western Canada BlueSky Wildfire Smoke Forecasting System Wildland Fire Canada Conference October 2012 Steve Sakiyama, British Columbia Ministry of Environment Steve.Sakiyama@gov.bc.ca
Doug Kluck NOAA Kansas City, MO National Center for Environmental Information (NCEI) National Integrated Drought Information System (NIDIS)
 National Integrated Drought Information System (NIDIS)") National Integrated Drought Information System (NIDIS) for the Missouri River Basin Drought Early Warning Information System (DEWS) & Runoff Trends in the Missouri Basin & Latest Flood Outlook Doug Kluck
National Integrated Drought Information System (NIDIS) for the Missouri River Basin Drought Early Warning Information System (DEWS) & Runoff Trends in the Missouri Basin & Latest Flood Outlook Doug Kluck
Natural Event Documentation
 ADDENDUM Natural Event Documentation Corcoran, Oildale and Bakersfield, California September 22, 2006 San Joaquin Valley Unified Air Pollution Control District May 23, 2007 Natural Event Documentation
GIS-T 2010 Building a Successful Geospatial Data Sharing Framework: A Ohio DOT Success Story
 GIS-T 2010 Building a Successful Geospatial Data Sharing Framework: A Ohio DOT Success Story ODOT District 2 GIS John Puente District 1 GIS Coordinator\ Planning Administrator 2 Interoperability 3 District
Title: Storm of the Century: Documenting the 1993 Superstorm
 A. PAIIF 2011 Cover Page Title: Storm of the Century: Documenting the 1993 Superstorm Point of Contact: Name: Alex Granger Email: alex.granger@noaa.gov Phone Number: 571-555-9278 Mailing Address: Research
Weather Technology in the Cockpit (WTIC) Program Program Update. Friends/Partners of Aviation Weather (FPAW) November 2, 2016
 Program Program Update. Friends/Partners of Aviation Weather (FPAW) November 2, 2016") Weather Technology in the Cockpit (WTIC) Program Program Update Friends/Partners of Aviation Weather (FPAW) November 2, 2016 Presented by Gary Pokodner, WTIC Program Manager Phone: 202.267.2786 Email:
Weather Technology in the Cockpit (WTIC) Program Program Update Friends/Partners of Aviation Weather (FPAW) November 2, 2016 Presented by Gary Pokodner, WTIC Program Manager Phone: 202.267.2786 Email:
COOP Modernization: NOAA s Environmental Real-time Observation Network in New England, the Southeast and Addressing NIDIS in the West
 COOP Modernization: NOAA s Environmental Real-time Observation Network in New England, the Southeast and Addressing NIDIS in the West Ken Crawford NWS Office of Science and Technology Special Presentation
DEVELOPMENT OF A FORECAST EARLY WARNING SYSTEM ethekwini Municipality, Durban, RSA. Clint Chrystal, Natasha Ramdass, Mlondi Hlongwae
 DEVELOPMENT OF A FORECAST EARLY WARNING SYSTEM ethekwini Municipality, Durban, RSA Clint Chrystal, Natasha Ramdass, Mlondi Hlongwae LOCATION DETAILS AND BOUNDARIES ethekwini Municipal Area = 2297 km 2
U s i n g t h e E S A / E U M E T C A S T N a v i g a t o r s
 U s i n g t h e E S A / E U M E T C A S T N a v i g a t o r s Copernicus User Uptake Information Sessions Copernicus EU Copernicus EU Copernicus EU www.copernicus.eu I N T R O D U C T I O N O F U S E C
Performing Map Cartography. using Esri Production Mapping
 AGENDA Performing Map Cartography Presentation Title using Esri Production Mapping Name of Speaker Company Name Kannan Jayaraman Agenda Introduction What s New in ArcGIS 10.1 ESRI Production Mapping Mapping
Introduction. Project Summary In 2014 multiple local Otsego county agencies, Otsego County Soil and Water
 Introduction Project Summary In 2014 multiple local Otsego county agencies, Otsego County Soil and Water Conservation District (SWCD), the Otsego County Planning Department (OPD), and the Otsego County
JOB REQUESTS C H A P T E R 3. Overview. Objectives
 C H A P T E R 3 JOB REQUESTS Overview Objectives Job Requests is one of the most critical areas of payroll processing. This is where the user can enter, update, and view information regarding an employee
BSYSE 456/556 Surface Hydrologic Processes and Modeling
 BSYSE 456/556 Surface Hydrologic Processes and Modeling Lab 9 (Prepared by Erin Brooks and Jan Boll, UI, and Joan Wu, WSU) P Introduction One of the most difficult tasks in watershed assessment and management
Development of Operational Air Quality MM5-MOS Equations for the San Joaquin Valley Air Pollution Control District
 Program for Climate, Ecosystem and Fire Applications Development of Operational Air Quality MM5-MOS Equations for the San Joaquin Valley Air Pollution Control District Final Report Hauss J. Reinbold Timothy
An Integrated Fire, Smoke and Air Quality Data & Tools Network
 An Integrated Fire, Smoke and Air Quality Data & Tools Network Stefan Falke and Rudolf Husar Center for Air Pollution Impact and Trend Analysis Washington University in St. Louis Brooke Hemming US EPA
CLIMATE CHANGE ADAPTATION BY MEANS OF PUBLIC PRIVATE PARTNERSHIP TO ESTABLISH EARLY WARNING SYSTEM
 CLIMATE CHANGE ADAPTATION BY MEANS OF PUBLIC PRIVATE PARTNERSHIP TO ESTABLISH EARLY WARNING SYSTEM By: Dr Mamadou Lamine BAH, National Director Direction Nationale de la Meteorologie (DNM), Guinea President,
PRELIMINARY EXPERIENCES WITH THE MULTI-MODEL AIR QUALITY FORECASTING SYSTEM FOR NEW YORK STATE
 PRELIMINARY EXPERIENCES WITH THE MULTI-MODEL AIR QUALITY FORECASTING SYSTEM FOR NEW YORK STATE Prakash Doraiswamy 1,,*, Christian Hogrefe 1,2, Winston Hao 2, Brian Colle 3, Mark Beauharnois 1, Ken Demerjian
INCA-CE achievements and status
 INCA-CE achievements and status Franziska Strauss Yong Wang Alexander Kann Benedikt Bica Ingo Meirold-Mautner INCA Central Europe Integrated nowcasting for the Central European area This project is implemented
Geoprocessing Hydrometeorological Datasets to Assess National Weather Service (NWS) Forecasts
 Forecasts") Geoprocessing Hydrometeorological Datasets to Assess National Weather Service (NWS) Forecasts Jack Settelmaier National Weather Service Southern Region HQ Fort Worth, Texas ABSTRACT The National Weather
Geoprocessing Hydrometeorological Datasets to Assess National Weather Service (NWS) Forecasts Jack Settelmaier National Weather Service Southern Region HQ Fort Worth, Texas ABSTRACT The National Weather
Temporary College Closure Due to Inclement Weather or Other Adverse Conditions.
 OTHER TOPICS Index No. X-1 PROCEDURES MEMORANDUM TO: FROM: SUBJECT: MCC Students and Staff Office of the President Temporary College Closure Due to Inclement Weather or Other Adverse Conditions. DATE:
National Weather Service. Building a Weather Ready Nation
 National Weather Service Building a Weather Ready Nation The NWS is a federal agency Department of Commerce National Oceanic and Atmospheric Administration National Weather Service Today s National Weather
The Wind Hazard: Messaging the Wind Threat & Corresponding Potential Impacts
 The Wind Hazard: Messaging the Wind Threat & Corresponding Potential Impacts Scott Spratt Warning Coordination Meteorologist NWS Melbourne, FL David Sharp Science & Operations Officer NWS Melbourne, FL
Unit 5: NWS Hazardous Weather Products. Hazardous Weather and Flooding Preparedness
 Unit 5: NWS Hazardous Weather Products Objectives Describe the mission of the NWS Describe the basic organizational structure of the NWS Explain the purpose of various NWS products Explain how Probability
1.2 UTILIZING MODIS SATELLITE OBSERVATIONS IN NEAR-REAL-TIME TO IMPROVE AIRNow NEXT DAY FORECAST OF FINE PARTICULATE MATTER, PM2.5
 1.2 UTILIZING MODIS SATELLITE OBSERVATIONS IN NEAR-REAL-TIME TO IMPROVE AIRNow NEXT DAY FORECAST OF FINE PARTICULATE MATTER, PM2.5 James Szykman*, John White US EPA, Office of Air Quality Planning and
Boundary and Annexation Survey (BAS)
") Boundary and Annexation Survey (BAS) New Mexico SDC Meeting Chris Wingate Geography Division U.S. Census Bureau 1 Agenda Boundary and Annexation Survey (BAS) BAS Overview American Community Survey (ACS)
Boundary and Annexation Survey (BAS) New Mexico SDC Meeting Chris Wingate Geography Division U.S. Census Bureau 1 Agenda Boundary and Annexation Survey (BAS) BAS Overview American Community Survey (ACS)
Evaluation of Small Sensors for Detection of Dust at Cuyama Valley High School
 Evaluation of Small Sensors for Detection of Dust at Cuyama Valley High School Final Report Prepared for Santa Barbara County Air Pollution Control District Santa Barbara, CA December 2016 This document
National Climatic Data Center Data Management Issues Tom Karl Director, NOAA s National Climatic Data Center
 National Climatic Data Center Data Management Issues Tom Karl Director, NOAA s National Climatic Data Center Opening Meeting NOAA Science Advisory Board s Data Archiving and Access Requirements Working