Regional Impacts of Climate Change
|
|
|
- Morgan Hampton
- 5 years ago
- Views:
Transcription


1 Regional Impacts of Climate Change Antonio J Busalacchi World Climate Research Programme
2 Outline Weather Extremes the New Normal Observed Changes in the Climate System Projections of Future Climate Change Grand Challenges for Climate Research on Regional Scales Sea Level Cryosphere Hydrology Extremes


3 Weather Extremes are the New Normal

4

5 Interruptions to Electric Grid Increasing
 Meteorological")
6 NatCatSERVICE Loss events worldwide 2014 Geographical overview Winter damage USA, Canada, 5 8 Jan Severe storms USA, May Flash floods USA,11 13 Aug Floods United Kingdom, Dec 2013 Feb 2014 Floods Bosnia and Herzegovina, Serbia, Croatia, Romania, May Typhoon Rammasun China, Philippines, Vietnam, Jul Geophysical events (Earthquake, tsunami, volcanic eruption) Meteorological events (Tropical storm, extratropical storm, convective storm, local storm) Drought USA, 2014 Severe storms France, Belgium, Germany, 7 10 Jun Winter damage Japan, 7 16 Feb Hydrological events (Flood, mass movement) Hurricane Odile Mexico, Sep Typhoon Kalmaegi China, Philippines, Vietnam, Sep Climatological events (Extreme temperature, drought, wildfire) Severe storms USA, 2 4 Apr 980 Loss events Severe storms USA, 27 Apr 1 May Severe storms USA, 3 5 Jun Drought Brazil, 2014 Cyclone Hudhud India, Oct Floods India, Pakistan, 3 15 Sep Earthquake China, 3 Aug Source: Munich Re, NatCatSERVICE, 2015 Loss events Selection of Catastrophes Overall losses US$ 1,500m As at January Munich Re
7 US Natural Catastrophe Update Loss events in the US Number of events Number of Natural Disasters on the Rise Number 250 Geophysical events (Earthquake, tsunami, volcanic activity) Total: 119 Events Meteorological events (Tropical storm, extratropical storm, convective storm, local storm) 150 Hydrological events (Flood, mass movement) Climatological events (Extreme temperature, drought, forest fire) Source: Geo Risks Research, NatCatSERVICE 2015 Munich Re 7
8 US Natural Catastrophe Update Convective loss events in the US Overall and insured losses bn US$ 50 Overall losses (in 2014 values)* 40 Insured losses (in 2014 values)* 30 Analysis contains: severe storm, tornado, hail, flash flood and lightning *Losses adjusted to inflation based on country CPI Source: Geo Risks Research, NatCatSERVICE 2015 Munich Re 8
9 NatCatSERVICE Loss events worldwide Number of events Number Geophysical events (Earthquake, tsunami, volcanic activity) 800 Meteorological events (Tropical storm, extratropical storm, convective storm, local storm) Hydrological events (Flood, mass movement) Climatological events (Extreme temperature, drought, forest fire) Source: Munich Re, NatCatSERVICE Source: Geo Risks Research, NatCatSERVICE As at January Munich Re
10 The Physical Climate System

11


12 Projections of climate change Svante Arrhenius, Verldamas Utveckling, 1906 any doubling of the percentage of carbon dioxide in the air would raise the temperature of the Earth s surface by 4 C. the percentage of carbonic acid in the atmosphere may, by the advances of industry, be changed to a noticeable degree in the course of centuries. Intergovernmental Panel on Climate Change 2007 the best estimate of climate sensitivity to a CO 2 doubling is a warming of 3 C, with a likely range of 2 to 4.5 C. business as usual scenarios lead to CO 2 doubling over pre-industrial levels between 2050 and 2100.
13 The IPCC WG1 Sequence IPCC (2013) Warming of the climate system is unequivocal, and since the 1950s, many of the observed changes are unprecedented over decades to millennia. The atmosphere and ocean have warmed, the amounts of snow and ice have diminished, sea level has risen, and the concentrations of greenhouse gases have increased. IPCC (1990) Broad overview of climate change science, discussion of uncertainties and evidence for warming. IPCC (1995) The balance of evidence suggests a discernible human influence on global climate. IPCC (2001) Most of the warming of the past 50 years is likely (>66%) to be attributable to human activities. IPCC (2007) Warming is unequivocal, and most of the warming of the past 50 years is very likely (90%) due to increases in greenhouse gases.
.")
14 Observed Changes in the Climate System Atmosphere Each of the last three decades has been successively warmer at the Earth s surface than any preceding decade since In the Northern Hemisphere, was likely the warmest 30-year period of the last 1400 years (medium confidence). In this Summary for Policymakers, the following terms have been used to indicate the assessed likelihood of an outcome or a result: virtually certain % probability, very likely %, likely %, about as likely as not 33 66%, unlikely 0 33%, very unlikely 0 10%, exceptionally unlikely 0 1%. Additional terms (extremely likely: %, more likely than not >50 100%, and extremely unlikely 0 5%) may also be used when appropriate.
15 Observed globally averaged combined land and ocean surface temperature anomaly All Figures IPCC
.")
16 Observed change in surface temperature All Figures IPCC 2013 Map of the observed surface temperature change from 1901 to 2012 derived from temperature trends determined by linear regression.trends have been calculated where data availability permits a robust estimate (i.e., only for grid boxes with greater than 70% complete records and more than 20% data availability in the first and last 10% of the time period). Other areas are white. Grid boxes where the trend is significant at the 10% level are indicated by a + sign.

17 Figure 1.2

18 Geographic resolution characteristic of the generations of global climate models used in the IPCC Assessment Reports

.")


19 Comparison of observed and simulated climate change All Figures IPCC 2013 Comparison of observed and simulated climate change based on three large-scale indicators in the atmosphere, the cryosphere and the ocean: change in continental land surface air temperatures (yellow panels), Arctic and Antarctic September sea ice extent (white panels), and upper ocean heat content in the major ocean basins (blue panels). All time-series are decadal averages, plotted at the centre of the decade. For temperature panels, observations are dashed lines if the spatial coverage of areas being examined is below 50%. For ocean heat content and sea ice panels the solid line is where the coverage of data is good and higher in quality, and the dashed line is where the data coverage is only adequate, and thus, uncertainty is larger. Model results shown are Coupled Model Intercomparison Project Phase 5 (CMIP5) multi-model ensemble ranges, with shaded bands indicating the 5 to 95% confidence intervals.

20 All Figures IPCC 2013 Global average surface temperature change CMIP5 multi-model simulated time series from 1950 to 2100 for change in global annual mean surface temperature relative to ,

21 Maps of CMIP5 multi-model mean results for the scenarios RCP2.6 and RCP8.5 in of (a) annual mean surface temperature change, (b) average percent change in annual mean precipitation. The number of CMIP5 models used to calculate the multi-model mean is indicated in the upper right corner of each panel. Hatching indicates regions where the multi-model mean is small compared to natural internal variability (i.e., less than one standard deviation of natural internal variability in 20-year means). Stippling indicates regions where the multimodel mean is large compared to natural internal variability (i.e., greater than two standard deviations of natural internal variability in 20-year means) and where at least 90% of models agree on the sign of change. Maps of CMIP5 multi-model mean results All Figures IPCC 2013
22 WCRP Future Directions: Actionable Science Defined as: data, analysis, and forecasts that are sufficiently predictive, accepted and understandable to support decision-making, including capital investment decision-making. World Climate Conference-3, OceanObs 09, ICSU Review and Visioning, acknowledge WCRP past contributions and identify future challenges and opportunities. Need for more flexibility/agility to respond to expanding users needs, that includes information: At regional scale For key sectors of global economy For adaptation, mitigation and risk management
23 WCRP Grand Challenges Regional Climate Information Regional Sea-Level Rise Cryosphere in a Changing Climate Clouds, Circulation, and Climate Sensitivity Changes in Water Availability Science Underpinning the Prediction and Attribution of Extreme Events
24 Grand Challenge on Regional Climate Information Question: Can we provide skillful, regional climate information at seasonal to decadal time scales plus credible and useful long-term regional climate change projections? Science Topics Intraseasonal to interannual variability & predictability Monsoon systems Decadal variability & predictability

25 Natural factors that affect climate/water extremes Risk of an extremely heavy precipitation event in North America is influenced by El Nino and La Nina Estimated risk of occurrence of a 20-year event increased reduced during an El Nino event. Effect of La Nina roughly opposite Zhang, et al 2005


26 Role of the ocean: long-term drought SST Anomaly 30N Warm SST 30S Cold SST Ocean temperatures conditioning the atmosphere Dry Model precipitation anomaly US Dustbowl Era 1930 s Dry Wet Dry Observed precipitation anomaly Schubert et al., Science, 2004 and Hoerling and Kumar, Science, 2003

27

28 Regional Climate Information Soil moisture in southern Africa in mid-april The image on the left is based on rain gauge data only. It shows that data gaps and lack of spatial variability limit the information that can be provided in large areas of Africa to monitor plant health. The more detailed image on the right includes soil moisture data from ESA s SMOS mission, which are assimilated into the United States Department of Agriculture s Foreign Agricultural Service forecasting system. This adds significant information in large areas of southern Africa.
29 Grand Challenge on Sea Level Rise Challenges: Scenario uncertainty/global mean sea level Inter-model spread Strong internal variability Research Activities Past changes in regional sea level Present sea level changes and processes Future projections Ocean-Coastal and Human Interaction
30 All Figures IPCC 2013 Observed indicators of a changing global climate Global mean sea level relative to the mean of the longest running dataset, and with all datasets aligned to have the same value in 1993, the first year of satellite altimetry data. All time-series (coloured lines indicating different data sets) show annual values, and where assessed, uncertainties are indicated by coloured shading.

31 Global mean sea level rise All Figures IPCC 2013 Projections of global mean sea level rise over the 21st century relative to from the combination of the CMIP5 ensemble with process-based models, for RCP2.6 and RCP8.5. The assessed likely range is shown as a shaded band. The assessed likely ranges for the mean over the period for all RCP scenarios are given as coloured vertical bars, with the corresponding median value given as a horizontal line.

32 2015 World Cities Exceeding 5 Million Residents Source: U.N. Population Division


33 Regional Sea- Level Rise Sea level fall along the U.S. west coast and rise in the western tropical Pacific Ocean since early 1990s appears to result from the phase change of the Inter-basin Pacific Decadal & multi-decadal Variability (Weiqing Han et al., University Colorado, 2011)
. With rising sea levels, a 100-year flood at the end of this century (not mapped here) is projected to inundate a far larger area of New York City.")
34 Regional Sea-Level Rise The light blue area depicts today s FEMA 100-year flood zone for the city (the area of the city that is expected to be flooded once every 100 years). With rising sea levels, a 100-year flood at the end of this century (not mapped here) is projected to inundate a far larger area of New York City. (NCA, 2009)
35 Grand Challenge on Cryospheric Changes Science Topics A coordinated focus on seasonal, interannual and longer-term predictions and projections of polar climate and the role of cryosphere in climate predictability A focused effort on improving the representation of permafrost and high-latitude land surface, including wetlands, in climate models, with specific emphasis on their role in the global carbon cycle A focused effort on developing ice sheet models, with specific emphasis on the role of ice sheet dynamics on the rate of the SLR
 25 20 15 1979 1980 1981 1982 1984 1985 1986 1987 1988 1990 1989 1991 1993 1994 1995 1997 1998 1999 2000 2001 2002 2005 2003 2004")
36 35 30 Cryosphere and Climate Change Total Greenland ice sheet melt area increased 65% since 1979 over the 30 year record; on average 2%/year The increasing trend in the total area of melting bare ice is at 13% per year Cumulative Melt Area (10 6 km 2 ) Year Courtesy of K. Steffen
37


38 Sea ice minima in September of 1980, 2007 and Sea ice images from NASA/Goddard Space Flight Center Scientific Visualization Studio. Composite graphic from NOAA. Model projections of sea ice thickness when the Arctic is nearly ice free in September, within 30 years. Units for sea ice thickness are meters. Figure from Wang and Overland

39
40 Grand Challenge on Water Availability Science Questions: How can we better understand and predict variations and changes in precipitation? How do changes in the land surface and hydrology influence past and future changes in water availability and security? How can we use the current water observations and products in assessing climate change? How can better models lead to improvements in water management?


41 Water and Population Water is not everywhere! 15% 8% 8% 13% 36% 60% 11% 13% 26% 6% Approximate percentage of global population 5% 1% Approximate percentage of global water supply

42 Water Availability Territory size shows the proportion of all worldwide freshwater resources found there

43 The water cycle describes the continuous movement of water through the climate system in its liquid, solid and vapor forms, and storage in the reservoirs of ocean, cryosphere, land surface and atmosphere.

44

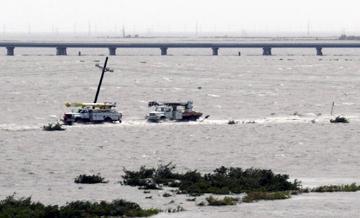
45 April 2013 showers in Argentina 1 April 2013: Torrential rain Buenos Aires. Over night, rainfall records broken, >6 inches in less than two hours; flooding, killing eight people and leaving hundreds displaced. Buenos Aires Central Observatory 3 April 2013: Next storm 11 to 16 inches in some spots in La Plata Basin. Damage: >$500Million Since the early 80s, the frequency of extreme weather events dumping over 100 millimeters of water has tripled, Canziani

46 The record is especially noteworthy since before Sept. 9, Boulder, along with much of eastern Colorado, was still mired in long-term drought conditions. As of Sept. 17, Boulder s monthly rainfall during September stood at inches, all but 0.02 inches of which fell during the preceding week. The previous all-time monthly record was 9.59 inches in May of 1995.
 to +10 (wet) with values below -3 representing severe to extreme drought.")
47 Palmer Drought Severity Index (PDSI) The Palmer Drought Severity Index (PDSI) uses readily available temperature and precipitation data to estimate relative dryness. The PDSI is a standardized measure, ranging from about -10 (dry) to +10 (wet) with values below -3 representing severe to extreme drought. Dai, Aiguo & National Center for Atmospheric Research Staff (Eds)
 and links to the pattern of rain in Africa SSTs and Sahelian rainfall")

48 A World of Drought Many dry areas are getting drier. Observed sea surface temperature (SST) and links to the pattern of rain in Africa SSTs and Sahelian rainfall have varied in the past. Some studies suggest links to widespread ocean SST trends and global warming. Physical understanding of regional changes worldwide (snowpack? evaporation?) is needed for projections/attribution.. Sahelian rainfall decline is reproduced in many models

49 Drought: Tools and Resources
50 Grand Challenge on Climate Extremes There is a general consensus emerging from climate research that any change in the mean climate is likely to feature even larger changes in the frequency and severity of extreme climate events Research foci for the WCRP include: Detecting significant trends, changes in extreme events and abrupt changes in global and regional climate Improvement in climate change projections not just for the mean climate, but for changes in extreme events.

51 Extreme Events over the Past Decade Heat waves / Extreme high temperatures Severe or prolonged droughts Cold waves / Extreme low temperatures / Snow storms Tropical cyclones, hurricanes and typhoons Intense storms / Flooding / Heavy rainfall
 Warm")
 have increased (decreased) by about 15 days Alexander")
52 Changes in temperature extremes, Over 70% of land area sampled shows significant change in minimum temperature extremes (days/decade) Warm nights (cold nights) have increased (decreased) by about 25 days since 1951 Warm days (cold days) have increased (decreased) by about 15 days Alexander et al. 2006

53 Indices of precipitation extremes Alexander, Zhang, et al 2005 Alexander, Zhang, et al 2005 Tendency is consistent with model results and physical understanding Groisman, et al 2005

54

55
56 Summary Whacky weather is here to stay More extreme events; i.e., more intense storms and more widespread drought Wetter regions getting wetter, drier getting drier Sea level will inexorably continue to rise, but regional impacts (from storm surge, changes in ocean circulation, wind set up, tidal amplitudes, subsidence) may be order 10 times global mean
Climate Change 2007: The Physical Science Basis
 Climate Change 2007: The Physical Science Basis Working Group I Contribution to the IPCC Fourth Assessment Report Presented by R.K. Pachauri, IPCC Chair and Bubu Jallow, WG 1 Vice Chair Nairobi, 6 February
What is the IPCC? Intergovernmental Panel on Climate Change
 IPCC WG1 FAQ What is the IPCC? Intergovernmental Panel on Climate Change The IPCC is a scientific intergovernmental body set up by the World Meteorological Organization (WMO) and by the United Nations
WMO Statement on the State of the Global Climate Preliminary conclusions for 2018 and WMO Greenhouse Bulletin
 WMO Statement on the State of the Global Climate Preliminary conclusions for 2018 and WMO Greenhouse Bulletin Dr Elena Manaenkova Deputy Secretary General World Meteorological Organisation Statement on
Current and future climate of the Cook Islands. Pacific-Australia Climate Change Science and Adaptation Planning Program
 Pacific-Australia Climate Change Science and Adaptation Planning Program Penrhyn Pukapuka Nassau Suwarrow Rakahanga Manihiki N o r t h e r n C o o k I s l a nds S o u t h e Palmerston r n C o o k I s l
Presentation Overview. Southwestern Climate: Past, present and future. Global Energy Balance. What is climate?
 Southwestern Climate: Past, present and future Mike Crimmins Climate Science Extension Specialist Dept. of Soil, Water, & Env. Science & Arizona Cooperative Extension The University of Arizona Presentation
US/Global Natural Catastrophe Update
 US/Global Natural Catastrophe Update NAIC's CIPR Symposium on Implications of Increasing Catastrophe Volatility on Insurers Carl Hedde, SVP, Head of Risk Accumulation Munich Reinsurance America, Inc. Source:
UPDATE OF REGIONAL WEATHER AND SMOKE HAZE (December 2017)
") UPDATE OF REGIONAL WEATHER AND SMOKE HAZE (December 2017) 1. Review of Regional Weather Conditions for November 2017 1.1 In November 2017, Southeast Asia experienced inter-monsoon conditions in the first
UPDATE OF REGIONAL WEATHER AND SMOKE HAZE (December 2017) 1. Review of Regional Weather Conditions for November 2017 1.1 In November 2017, Southeast Asia experienced inter-monsoon conditions in the first
Extreme Weather Events and Climate Change
 Extreme Weather Events and Climate Change Robert M Rabin NOAA/National Severe Storms Lab Norman, Oklahoma Most material presented is from: Climate Change 2013: The Physical Science Basis. Intergovernmental
THE FUTURE OF U.S. WEATHER CATASTROPHES
 Source: NASA THE FUTURE OF U.S. WEATHER CATASTROPHES Mark C. Bove, CPCU, ARe Senior Research Meteorologist Munich Reinsurance America, Inc. AIMU Marine Insurance Day 2 October 2015 Agenda Natural Catastrophes
THE CHANGING CLIMATE OF CATASTROPHE RISK UNDERWRITING
 Source: NPS THE CHANGING CLIMATE OF CATASTROPHE RISK UNDERWRITING Mark C. Bove, CPCU, ARe Senior Research Meteorologist Munich Reinsurance America, Inc. Midwest / Western Regional Farm Bureau Underwriting
Observed Climate Variability and Change: Evidence and Issues Related to Uncertainty
 Observed Climate Variability and Change: Evidence and Issues Related to Uncertainty David R. Easterling National Climatic Data Center Asheville, North Carolina Overview Some examples of observed climate
The Failed Science of Global warming: Time to Re-consider Climate Change
 The Failed Science of Global warming: Time to Re-consider Climate Change Madhav Khandekar Expert Reviewer IPCC 2007 Climate Change IPCC vs NIPCC IPCC: Intergovernmental Panel on Climate Change; A UN Body
Will a warmer world change Queensland s rainfall?
 Will a warmer world change Queensland s rainfall? Nicholas P. Klingaman National Centre for Atmospheric Science-Climate Walker Institute for Climate System Research University of Reading The Walker-QCCCE
Mozambique. General Climate. UNDP Climate Change Country Profiles. C. McSweeney 1, M. New 1,2 and G. Lizcano 1
 UNDP Climate Change Country Profiles Mozambique C. McSweeney 1, M. New 1,2 and G. Lizcano 1 1. School of Geography and Environment, University of Oxford. 2.Tyndall Centre for Climate Change Research http://country-profiles.geog.ox.ac.uk
Current and future climate of Vanuatu. Pacific-Australia Climate Change Science and Adaptation Planning Program
 Pacific-Australia Climate Change Science and Adaptation Planning Program Hiu Torres Islands Vanua Lava Gaua Banks Islands Espiritu Santo Malekula Ambae Épi Maéwo Pentecost Ambrym Shepherd Islands Éfate
1990 Intergovernmental Panel on Climate Change Impacts Assessment
 1990 Intergovernmental Panel on Climate Change Impacts Assessment Although the variability of weather and associated shifts in the frequency and magnitude of climate events were not available from the
Global warming is unequivocal: The 2007 IPCC Assessment
 Global warming is unequivocal: The 2007 IPCC Assessment Kevin E. Trenberth * March 2, 2007 * Any opinions, findings, conclusions, or recommendations expressed in this publication are those of the author
Seasonal Climate Outlook for South Asia (June to September) Issued in May 2014
 Issued in May 2014") Ministry of Earth Sciences Earth System Science Organization India Meteorological Department WMO Regional Climate Centre (Demonstration Phase) Pune, India Seasonal Climate Outlook for South Asia (June
Ministry of Earth Sciences Earth System Science Organization India Meteorological Department WMO Regional Climate Centre (Demonstration Phase) Pune, India Seasonal Climate Outlook for South Asia (June
Deke Arndt, Chief, Climate Monitoring Branch, NOAA s National Climatic Data Center
 Thomas R. Karl, L.H.D., Director, NOAA s National Climatic Data Center, and Chair of the Subcommittee on Global Change Research Peter Thorne, PhD, Senior Scientist, Cooperative Institute for Climate and
Chapter 2. Changes in Sea Level Melting Cryosphere Atmospheric Changes Summary IPCC (2013)
") IPCC (2013) Ice is melting faster (sea ice, glaciers, ice sheets, snow) Sea level is rising More ocean heat content More intense rainfall More severe drought Fewer frosts More heat waves Spring is arriving
IPCC (2013) Ice is melting faster (sea ice, glaciers, ice sheets, snow) Sea level is rising More ocean heat content More intense rainfall More severe drought Fewer frosts More heat waves Spring is arriving
Chapter outline. Reference 12/13/2016
 Chapter 2. observation CC EST 5103 Climate Change Science Rezaul Karim Environmental Science & Technology Jessore University of science & Technology Chapter outline Temperature in the instrumental record
Current and future climate of the Marshall Islands. Pacific-Australia Climate Change Science and Adaptation Planning Program
 Pacific-Australia Climate Change Science and Adaptation Planning Program North Pacific Ocean Bikini Enewetak Ailinginae Rongelap Rongrik Utrik Taka R a Bikar t a Ujelang R a l i k Wotto Ujae C h a Lae
Seamless weather and climate for security planning
 Seamless weather and climate for security planning Kirsty Lewis, Principal Climate Change Consultant, Met Office Hadley Centre 28 June 2010 Global Climate Models Mitigation timescale changes could be avoided
Extreme Rainfall in the Southeast U.S.
 Extreme Rainfall in the Southeast U.S. David F. Zierden Florida State Climatologist Center for Ocean Atmospheric Prediction Studies The Florida State University March 7, 2016 Causes of Extreme Rainfall
Observed State of the Global Climate
 WMO Observed State of the Global Climate Jerry Lengoasa WMO June 2013 WMO Observations of Changes of the physical state of the climate ESSENTIAL CLIMATE VARIABLES OCEANIC ATMOSPHERIC TERRESTRIAL Surface
Observed changes in climate and their effects
 1 1.1 Observations of climate change Since the TAR, progress in understanding how climate is changing in space and time has been gained through improvements and extensions of numerous datasets and data
Zambia. General Climate. Recent Climate Trends. UNDP Climate Change Country Profiles. Temperature. C. McSweeney 1, M. New 1,2 and G.
 UNDP Climate Change Country Profiles Zambia C. McSweeney 1, M. New 1,2 and G. Lizcano 1 1. School of Geography and Environment, University of Oxford. 2. Tyndall Centre for Climate Change Research http://country-profiles.geog.ox.ac.uk
Projections of future climate change
 Projections of future climate change Matthew Collins 1,2 and Catherine A. Senior 2 1 Centre for Global Atmospheric Modelling, Department of Meteorology, University of Reading 2 Met Office Hadley Centre,
Climatic and Ecological Conditions in the Klamath Basin of Southern Oregon and Northern California: Projections for the Future
 Climatic and Ecological Conditions in the Klamath Basin of Southern Oregon and Northern California: Projections for the Future A Collaborative Effort by: CLIMATE LEADERSHIP INITIATIVE INSTITUTE FOR A SUSTAINABLE
The South Eastern Australian Climate Initiative
 The South Eastern Australian Climate Initiative Phase 2 of the South Eastern Australian Climate Initiative (SEACI) is a three-year (2009 2012), $9 million research program investigating the causes and
Extremes of Weather and the Latest Climate Change Science. Prof. Richard Allan, Department of Meteorology University of Reading
 Extremes of Weather and the Latest Climate Change Science Prof. Richard Allan, Department of Meteorology University of Reading Extreme weather climate change Recent extreme weather focusses debate on climate
8.1.2 Climate Projections
 Chapter 8 Nauru 167 8.1 Climate Summary 8.1.1 Current Climate Over the past half century it is likely that there has been a warming air temperature trend at Nauru which is partly associated with warming
UPDATE OF REGIONAL WEATHER AND SMOKE HAZE (May 2017)
") UPDATE OF REGIONAL WEATHER AND SMOKE HAZE (May 2017) 1. Review of Regional Weather Conditions in April 2017 1.1 Inter monsoon conditions, characterised by afternoon showers and winds that are generally
UPDATE OF REGIONAL WEATHER AND SMOKE HAZE (May 2017) 1. Review of Regional Weather Conditions in April 2017 1.1 Inter monsoon conditions, characterised by afternoon showers and winds that are generally
2015: A YEAR IN REVIEW F.S. ANSLOW
 2015: A YEAR IN REVIEW F.S. ANSLOW 1 INTRODUCTION Recently, three of the major centres for global climate monitoring determined with high confidence that 2015 was the warmest year on record, globally.
A Tutorial on Climate Change Science: The. 4 th National Climate Assessment CLIMATE SCIENCE. Don Wuebbles
 CLIMATE SCIENCE S P E C I A L R E P O R T A Tutorial on Climate Change Science: The Fourth National Climate Assessment Volume I 4 th National Climate Assessment Don Wuebbles Department of Atmospheric Sciences
Monthly Long Range Weather Commentary Issued: APRIL 18, 2017 Steven A. Root, CCM, Chief Analytics Officer, Sr. VP,
 Monthly Long Range Weather Commentary Issued: APRIL 18, 2017 Steven A. Root, CCM, Chief Analytics Officer, Sr. VP, sroot@weatherbank.com MARCH 2017 Climate Highlights The Month in Review The average contiguous
Climate Risk Profile for Samoa
 Climate Risk Profile for Samoa Report Prepared by Wairarapa J. Young Samoa Meteorology Division March, 27 Summary The likelihood (i.e. probability) components of climate-related risks in Samoa are evaluated
CLIMATE READY BOSTON. Climate Projections Consensus ADAPTED FROM THE BOSTON RESEARCH ADVISORY GROUP REPORT MAY 2016
 CLIMATE READY BOSTON Sasaki Steering Committee Meeting, March 28 nd, 2016 Climate Projections Consensus ADAPTED FROM THE BOSTON RESEARCH ADVISORY GROUP REPORT MAY 2016 WHAT S IN STORE FOR BOSTON S CLIMATE?
Water Stress, Droughts under Changing Climate
 Water Stress, Droughts under Changing Climate Professor A.K.M. Saiful Islam Institute of Water and Flood Management Bangladesh University of Engineering and Technology (BUET) Outline of the presentation
How strong does wind have to be to topple a garbage can?
 How strong does wind have to be to topple a garbage can? Imagine winds powerful enough to pick up a truck and toss it the length of a football field. Winds of this extreme sometimes happen in a tornado.
3. Climate Change. 3.1 Observations 3.2 Theory of Climate Change 3.3 Climate Change Prediction 3.4 The IPCC Process
 3. Climate Change 3.1 Observations 3.2 Theory of Climate Change 3.3 Climate Change Prediction 3.4 The IPCC Process 3.1 Observations Need to consider: Instrumental climate record of the last century or
Implications of Climate Change on Long Lead Forecasting and Global Agriculture. Ray Motha
 Implications of Climate Change on Long Lead Forecasting and Global Agriculture Ray Motha Source: http://www.coaps.fsu.edu/lib/climatoons/toon38.shtml ENSO Teleconnections 30 Observed Monthly Sea Surface
Chapter 3 East Timor (Timor-Leste)
") Chapter 3 East Timor (Timor-Leste) 49 3.1 Climate Summary 3.1.1 Current Climate Despite missing temperature records for Dili Airport, it is probable that over the past half century there has been a warming
Chapter 3 East Timor (Timor-Leste) 49 3.1 Climate Summary 3.1.1 Current Climate Despite missing temperature records for Dili Airport, it is probable that over the past half century there has been a warming
Minnesota s Climatic Conditions, Outlook, and Impacts on Agriculture. Today. 1. The weather and climate of 2017 to date
 Minnesota s Climatic Conditions, Outlook, and Impacts on Agriculture Kenny Blumenfeld, State Climatology Office Crop Insurance Conference, Sep 13, 2017 Today 1. The weather and climate of 2017 to date
Northern Rockies Adaptation Partnership: Climate Projections
 Northern Rockies Adaptation Partnership: Climate Projections Contents Observed and Projected Climate for the NRAP Region... 2 Observed and Projected Climate for the NRAP Central Subregion... 8 Observed
Activity 2.2: Recognizing Change (Observation vs. Inference)
") Activity 2.2: Recognizing Change (Observation vs. Inference) Teacher Notes: Evidence for Climate Change PowerPoint Slide 1 Slide 2 Introduction Image 1 (Namib Desert, Namibia) The sun is on the horizon
Activity 2.2: Recognizing Change (Observation vs. Inference) Teacher Notes: Evidence for Climate Change PowerPoint Slide 1 Slide 2 Introduction Image 1 (Namib Desert, Namibia) The sun is on the horizon
Extreme Weather and Climate Change: the big picture Alan K. Betts Atmospheric Research Pittsford, VT NESC, Saratoga, NY
 Extreme Weather and Climate Change: the big picture Alan K. Betts Atmospheric Research Pittsford, VT http://alanbetts.com NESC, Saratoga, NY March 10, 2018 Increases in Extreme Weather Last decade: lack
Malawi. General Climate. UNDP Climate Change Country Profiles. C. McSweeney 1, M. New 1,2 and G. Lizcano 1
 UNDP Climate Change Country Profiles Malawi C. McSweeney 1, M. New 1,2 and G. Lizcano 1 1. School of Geography and Environment, University of Oxford. 2. Tyndall Centre for Climate Change Research http://country-profiles.geog.ox.ac.uk
Appendix 1: UK climate projections
 Appendix 1: UK climate projections The UK Climate Projections 2009 provide the most up-to-date estimates of how the climate may change over the next 100 years. They are an invaluable source of information
Weather Elements (air masses, fronts & storms)
") Weather Elements (air masses, fronts & storms) S6E4. Obtain, evaluate and communicate information about how the sun, land, and water affect climate and weather. A. Analyze and interpret data to compare
Weather Elements (air masses, fronts & storms) S6E4. Obtain, evaluate and communicate information about how the sun, land, and water affect climate and weather. A. Analyze and interpret data to compare
Global Forecast Map: IRI Seasonal Forecast for Precipitation (rain and snow) over May July 2011, issued on 21 April 2011.
 over May July 2011, issued on 21 April 2011.") 21 April 2011 -Global La Niña Update Produced by the Red Cross/Red Crescent Climate Centre and the International Research Institute for Climate and Society This update contains: - A global La Niña update
21 April 2011 -Global La Niña Update Produced by the Red Cross/Red Crescent Climate Centre and the International Research Institute for Climate and Society This update contains: - A global La Niña update
MPACT OF EL-NINO ON SUMMER MONSOON RAINFALL OF PAKISTAN
 MPACT OF EL-NINO ON SUMMER MONSOON RAINFALL OF PAKISTAN Abdul Rashid 1 Abstract: El-Nino is the dominant mod of inter- annual climate variability on a planetary scale. Its impact is associated worldwide
Cape Verde. General Climate. Recent Climate. UNDP Climate Change Country Profiles. Temperature. Precipitation
 UNDP Climate Change Country Profiles C. McSweeney 1, M. New 1,2 and G. Lizcano 1 1. School of Geography and Environment, University of Oxford. 2. Tyndall Centre for Climate Change Research http://country-profiles.geog.ox.ac.uk
Suriname. General Climate. Recent Climate Trends. UNDP Climate Change Country Profiles. Temperature. C. McSweeney 1, M. New 1,2 and G.
 UNDP Climate Change Country Profiles Suriname C. McSweeney 1, M. New 1,2 and G. Lizcano 1 1. School of Geography and Environment, University of Oxford. 2. Tyndall Centre for Climate Change Research http://country-profiles.geog.ox.ac.uk
Climate Science, Projections and BoM Capability
 Climate Science, Projections and BoM Capability Climate Information Program: David Jones (Manager of Climate Monitoring and Prediction) & Leading in Climate Data, Monitoring, Prediction and Advice Perry
Update on Climate Science. Professor Richard Betts, Met Office
 Update on Climate Science Professor Richard Betts, Met Office The science of climate change Crown copyright Met Office Prof Richard Betts Head of Climate Impacts Research Crown copyright Met Office Observing
Future Climate Change
 Future Climate Change How do you know whether to trust a prediction about the future? All predictions are based on global circulation models (GCMs, AOGCMs) - model accuracy is verified by its ability to
US Drought Status. Droughts 1/17/2013. Percent land area affected by Drought across US ( ) Dev Niyogi Associate Professor Dept of Agronomy
 Dev Niyogi Associate Professor Dept of Agronomy") Droughts US Drought Status Dev Niyogi Associate Professor Dept of Agronomy Deptof Earth Atmospheric Planetary Sciences Indiana State Climatologist Purdue University LANDSURFACE.ORG iclimate.org climate@purdue.edu
Droughts US Drought Status Dev Niyogi Associate Professor Dept of Agronomy Deptof Earth Atmospheric Planetary Sciences Indiana State Climatologist Purdue University LANDSURFACE.ORG iclimate.org climate@purdue.edu
Jill Key. Chapter 6 Kiribati
 Jill Key Chapter 6 Kiribati 113 6.1 Climate Summary 6.1.1 Current Climate Warming trends are evident in both annual and half-year mean air temperatures at Tarawa from 1950. At Kiritmati, in eastern Kiribati,
B. The Observed Changes in the Climate System
 gases (decades to centuries), and, as a result, their concentrations respond much more quickly to changes in emissions. Volcanic activity can inject large amounts of sulphur-containing gases (primarily
Global warming and Extremes of Weather. Prof. Richard Allan, Department of Meteorology University of Reading
 Global warming and Extremes of Weather Prof. Richard Allan, Department of Meteorology University of Reading Extreme weather climate change Recent extreme weather focusses debate on climate change Can we
Lecture 28: Observed Climate Variability and Change
 Lecture 28: Observed Climate Variability and Change 1. Introduction This chapter focuses on 6 questions - Has the climate warmed? Has the climate become wetter? Are the atmosphere/ocean circulations changing?
Figure 1. Carbon dioxide time series in the North Pacific Ocean (
 Evidence #1: Since 1950, Earth s atmosphere and oceans have changed. The amount of carbon released to the atmosphere has risen. Dissolved carbon in the ocean has also risen. More carbon has increased ocean
UPDATE OF REGIONAL WEATHER AND SMOKE HAZE (September 2017)
") UPDATE OF REGIONAL WEATHER AND SMOKE HAZE (September 2017) 1. Review of Regional Weather Conditions in August 2017 1.1 Southwest Monsoon conditions continued to prevail in the region in August 2017. The
UPDATE OF REGIONAL WEATHER AND SMOKE HAZE (September 2017) 1. Review of Regional Weather Conditions in August 2017 1.1 Southwest Monsoon conditions continued to prevail in the region in August 2017. The
Multiple Choice Identify the choice that best completes the statement or answers the question.
 CH.15 practice TEST Multiple Choice Identify the choice that best completes the statement or answers the question. 1) The short-term state of the atmosphere is called a) climate. c) water cycle. b) weather.
Climate Variability and Change Past, Present and Future An Overview
 Climate Variability and Change Past, Present and Future An Overview Dr Jim Salinger National Institute of Water and Atmospheric Research Auckland, New Zealand INTERNATIONAL WORKSHOP ON REDUCING VULNERABILITY
Challenges to Improving the Skill of Weekly to Seasonal Climate Predictions. David DeWitt with contributions from CPC staff
 Challenges to Improving the Skill of Weekly to Seasonal Climate Predictions David DeWitt with contributions from CPC staff 1 Outline CPC Background Prediction, monitoring, diagnostics, and climate services
Climate Impacts to Southwest Water Sector. Dr. Dave DuBois New Mexico State Climatologist
 Climate Impacts to Southwest Water Sector Dr. Dave DuBois New Mexico State Climatologist Presented at EPA Extreme Events and Climate Adaptation Planning Workshop June 3, 2015 Water Year Precip. % of Average
Seasonal Climate Watch July to November 2018
 Seasonal Climate Watch July to November 2018 Date issued: Jun 25, 2018 1. Overview The El Niño-Southern Oscillation (ENSO) is now in a neutral phase and is expected to rise towards an El Niño phase through
Atmospheric circulation analysis for seasonal forecasting
 Training Seminar on Application of Seasonal Forecast GPV Data to Seasonal Forecast Products 18 21 January 2011 Tokyo, Japan Atmospheric circulation analysis for seasonal forecasting Shotaro Tanaka Climate
The Climate of the Carolinas: Past, Present, and Future - Results from the National Climate Assessment
 The Climate of the Carolinas: Past, Present, and Future - Results from the National Climate Assessment Chip Konrad Chris Fuhrmann Director of the The Southeast Regional Climate Center Associate Professor
UPDATE OF REGIONAL WEATHER AND SMOKE HAZE (February 2018)
") UPDATE OF REGIONAL WEATHER AND SMOKE HAZE (February 2018) 1. Review of Regional Weather Conditions for January 2018 1.1 The prevailing Northeast monsoon conditions over Southeast Asia strengthened in January
UPDATE OF REGIONAL WEATHER AND SMOKE HAZE (February 2018) 1. Review of Regional Weather Conditions for January 2018 1.1 The prevailing Northeast monsoon conditions over Southeast Asia strengthened in January
Climate outlook, longer term assessment and regional implications. What s Ahead for Agriculture: How to Keep One of Our Key Industries Sustainable
 Climate outlook, longer term assessment and regional implications What s Ahead for Agriculture: How to Keep One of Our Key Industries Sustainable Bureau of Meteorology presented by Dr Jeff Sabburg Business
2013 ATLANTIC HURRICANE SEASON OUTLOOK. June RMS Cat Response
 2013 ATLANTIC HURRICANE SEASON OUTLOOK June 2013 - RMS Cat Response Season Outlook At the start of the 2013 Atlantic hurricane season, which officially runs from June 1 to November 30, seasonal forecasts
Climate Variability and Change, and Southern California Water San Gabriel Valley Water Forum, Pomona, CA, October 2, 2014
 Climate Variability and Change, and Southern California Water San Gabriel Valley Water Forum, Pomona, CA, October 2, 2014 Dan Cayan (with Mike Dettinger, David Pierce, Suraj Polade, Mary Tyree, Alexander
Drought Impacts in the Southern Great Plains. Mark Shafer University of Oklahoma Norman, OK
 Drought Impacts in the Southern Great Plains Mark Shafer University of Oklahoma Norman, OK Causes of Drought: Large-Scale, Stationary High Pressure Air rotates clockwise around high pressure steers storms
IGAD Climate Prediction and Applications Centre Monthly Bulletin, August 2014
 IGAD Climate Prediction and Applications Centre Monthly Bulletin, 1. HIGHLIGHTS/ ACTUALITES Rainfall activities were mainly observed over the central parts of the northern sector and western parts of equatorial
The science behind southeast Australia s wet, cool summer.
 XXXX The science behind southeast Australia s wet, cool summer. Key facts: 1. For many years scientists have painted a clear picture: that the Earth s surface is warming rapidly and the climate is changing.
Ellen L. Mecray NOAA Regional Climate Services Director, Eastern Region Taunton, MA
 Ellen L. Mecray NOAA Regional Climate Services Director, Eastern Region Taunton, MA Regions of the US National Climate Assessment What we Observe: Climate changes and impacts Increasing temperature Increasingly
Understanding Weather and Climate Risk. Matthew Perry Sharing an Uncertain World Conference The Geological Society, 13 July 2017
 Understanding Weather and Climate Risk Matthew Perry Sharing an Uncertain World Conference The Geological Society, 13 July 2017 What is risk in a weather and climate context? Hazard: something with the
Weather Atmospheric condition in one place during a limited period of time Climate Weather patterns that an area typically experiences over a long
 Weather Atmospheric condition in one place during a limited period of time Climate Weather patterns that an area typically experiences over a long period of time Many factors influence weather & climate
Analysis of Historical Pattern of Rainfall in the Western Region of Bangladesh
 24 25 April 214, Asian University for Women, Bangladesh Analysis of Historical Pattern of Rainfall in the Western Region of Bangladesh Md. Tanvir Alam 1*, Tanni Sarker 2 1,2 Department of Civil Engineering,
JOINT BRIEFING TO THE MEMBERS. El Niño 2018/19 Likelihood and potential impact
 JOINT BRIEFING TO THE MEMBERS El Niño 2018/19 Likelihood and potential impact CURRENT EL NIÑO OUTLOOK (SEPTEMBER 2018) CPC/IRI ENSO Forecast from September. Red bars denote probability of an El Nino developing
Cuba. General Climate. Recent Climate Trends. UNDP Climate Change Country Profiles. Temperature. C. McSweeney 1, M. New 1,2 and G.
 UNDP Climate Change Country Profiles Cuba C. McSweeney 1, M. New 1,2 and G. Lizcano 1 1. School of Geography and Environment, University of Oxford. 2. Tyndall Centre for Climate Change Research http://country-profiles.geog.ox.ac.uk
Quenching the Valley s thirst: The connection between Sierra Nevada snowpack & regional water supply
 Quenching the Valley s thirst: The connection between Sierra Nevada snowpack & regional water supply Roger Bales, UC Merced Snow conditions Snow & climate change Research directions Sierra Nevada snow
THE CANADIAN CENTRE FOR CLIMATE MODELLING AND ANALYSIS
 THE CANADIAN CENTRE FOR CLIMATE MODELLING AND ANALYSIS As Canada s climate changes, and weather patterns shift, Canadian climate models provide guidance in an uncertain future. CANADA S CLIMATE IS CHANGING
Climate Change in the Northeast
 Climate Change in the Northeast Dr. Alan K. Betts Atmospheric Research, Pittsford, VT 05763 akbetts@aol.com http://alanbetts.com NNECAPA Stowe, VT September 11, 2014 Outline Science of climate change Global
Global Climate Change and the Implications for Oklahoma. Gary McManus Associate State Climatologist Oklahoma Climatological Survey
 Global Climate Change and the Implications for Oklahoma Gary McManus Associate State Climatologist Oklahoma Climatological Survey OCS LEGISLATIVE MANDATES Conduct and report on studies of climate and weather
First-Order Draft Chapter 3 IPCC WG1 Fourth Assessment Report
 0 Figure... Estimates of linear trends in significant wave height (cm decade - ) for the regions along the major ship routes for the global ocean for the period 0 00. Trends are shown only for the locations
Chapter 1 Climate in 2016
 Chapter 1 Climate in 2016 1.1 Global climate summary Extremely high temperatures were frequently observed in many regions of the world, and in particular continued for most of the year in various places
Climate.tgt, Version: 1 1
 Name: Key Concepts Choose the letter of the best answer. (5 points each) 1. 2. 3. 4. 5. 6. 7. 8. 9. 10. Date: A city located in the middle of North America experiences extreme temperature changes during
NOAA National Centers for Environmental Information State Summaries 149-HI. Observed and Projected Temperature Change
 9-HI HAWAI I Key Messages Average annual temperature has increased by about F since 95, with a leveling off of the rate of warming in the last two decades. Under a higher emissions pathway, historically
Weather Atmospheric condition in one place during a limited period of time Climate Weather patterns that an area typically experiences over a long
 Weather Atmospheric condition in one place during a limited period of time Climate Weather patterns that an area typically experiences over a long period of time Many factors influence weather & climate
Projected Impacts of Climate Change in Southern California and the Western U.S.
 Projected Impacts of Climate Change in Southern California and the Western U.S. Sam Iacobellis and Dan Cayan Scripps Institution of Oceanography University of California, San Diego Sponsors: NOAA RISA
UPDATE OF REGIONAL WEATHER AND SMOKE HAZE November 2016
 UPDATE OF REGIONAL WEATHER AND SMOKE HAZE November 2016 1. Review of Regional Weather Conditions in November 2016 1.1 Southwest Monsoon conditions prevailed on most days in October 2016 and the winds were
Weather Outlook: 2015 Growing Season
 Weather Outlook: 2015 Growing Season Leon F. Osborne Chester Fritz Distinguished Professor Regional Weather Information Center University of North Dakota Grand Forks, North Dakota Why Should We Be Concerned?
Anticipated and Observed Trends in the Global Hydrological Cycle. Kevin E. Trenberth NCAR
 Anticipated and Observed Trends in the Global Hydrological Cycle Kevin E. Trenberth NCAR The presence of moisture affects the disposition of incoming solar radiation: Evaporation (drying) versus temperature
Global Climate Change and the Implications for Oklahoma. Gary McManus Associate State Climatologist Oklahoma Climatological Survey
 Global Climate Change and the Implications for Oklahoma Gary McManus Associate State Climatologist Oklahoma Climatological Survey Our previous stance on global warming Why the anxiety? Extreme Viewpoints!
By: J Malherbe, R Kuschke
 2015-10-27 By: J Malherbe, R Kuschke Contents Summary...2 Overview of expected conditions over South Africa during the next few days...3 Significant weather events (27 October 2 November)...3 Conditions
Climate changes in Finland, but how? Jouni Räisänen Department of Physics, University of Helsinki
 Climate changes in Finland, but how? Jouni Räisänen Department of Physics, University of Helsinki 19.9.2012 Outline Some basic questions and answers about climate change How are projections of climate