Appendix 1: UK climate projections
|
|
|
- Hugo Gilmore
- 6 years ago
- Views:
Transcription
1 Appendix 1: UK climate projections The UK Climate Projections 2009 provide the most up-to-date estimates of how the climate may change over the next 100 years. They are an invaluable source of information if you wish to find out more about the future climate at a national or regional level. In this section: UK Climate Projections 2009 Climate overview 40 Design for future climate
 2, based on projections provided by the Met")
2 Appendix 1: UK climate projections UK Climate Projections 2009 Probabilistic data Three scenarios for greenhouse gas emissions Absolute values as well as projected changes Published tables, maps and graphs Creating bespoke maps and graphs The key source of information on recent and future UK climate change is the UK Climate Projections 2009 (UKCP09) 2, based on projections provided by the Met Office. This is the fifth generation of UK projections and is the most comprehensive, updating and augmenting the previous set published in 2002 (UKCIP02). This is the information on which research organisations, regulation and standards-setting bodies and the insurance industry are basing their responses to climate change. The older UKCIP02 scenarios are still available to refer to in connection with existing guidance until that is updated. Information is available from the UKCP09 website, and a full description can be found in UK Climate Projections: Briefing Report sections 3 and A range of tools, methods and guidance are also available from the website of the UK Climate Impacts Programme (UKCIP) 34, which was set up in 1997 to work in partnership with the public, private, research and voluntary sectors to help them develop strategies to adapt to climate change. In order to make appropriate changes in the way we design new buildings and develop strategies for adapting the existing stock we need to understand the likely pattern, timescale and magnitude of the projected changes in some detail. Probabilistic data The UKCP09 projections differ fundamentally from their predecessors in that information is presented as probabilistic ranges of values indicating percentage likelihood rather than single values for each climate variable considered. This is because they are now based on the outputs from a range of climate models rather than the UK Met Office s Hadley Centre model alone. This makes them more robust in that they take into account a wider range of variants and different but plausible climate modelling methodologies. Design for future climate 41

3 Appendix 1: UK climate projections Explaining probability Having a probabilistic range of values makes interpretation of the climate projections more complicated. In addition to the three equally likely climate scenarios based on different levels of greenhouse gas emissions, within each scenario there is a range of values that may occur. Three scenarios for greenhouse gas emissions The projections are based on a representative range of three of the greenhouse gas emissions scenarios used for the latest Intergovernmental Panel on Climate Change (IPCC) Assessment Report 35, as shown in figure 9. Figure 9: emissions scenarios used for UKCP09 33 These ranges are presented as percentages that relate to how likely a climate change impact is to occur A1FI These ranges are useful when managing risk for example: some events that are extremely unlikely to occur may have potentially catastrophic consequences and so should be designed for other climate impacts, although very likely to occur will have lesser impacts in certain regions and so can be disregarded. Global CO 2 emissions (GtC/yr) A1B 10 5 B As with the IPCC Assessment Report, none of these scenarios should be regarded as being statistically more likely to occur than any other. They are simply based on different assumptions about greenhouse gas emissions, land use, technological and economic development. In addition, an H ++ (extreme) scenario 33 has been developed specifically to investigate sea level rise and storm surges. This aims to reflect the effect of melting ice that is not well represented at present in global climate models but which represents a major The graphs in this section show the impacts that are likely to occur, where likely refers to probabilities between 90% (very likely) to 10% A1FI = High CO 2 emissions A1B = Medium emissions B1 = Low emissions source of uncertainty in projecting sea level rise. (very unlikely). 42 Design for future climate
4 Appendix 1: UK climate projections Absolute values as well as projected changes Absolute figures for climate variables (e.g. 19 C) are provided in addition to relative data on climate change (e.g. 2 C rise). Projections of change are useful for understanding the relative difference between what we are familiar with and future conditions, but absolute figures are more useful in understanding the actual effect of a change on, say, designing the size of a drain or maintaining a particular internal temperature. Full probabilistic data is provided for: Over land: mean temperature mean daily maximum temperature mean daily minimum temperature warmest day of the season (99th percentile of daily maximum temperature in a season) coolest day of the season (1st percentile of daily maximum temperature in a season) warmest night of the season (99th percentile of the daily minimum temperature in a season) coldest day of the season (1st percentile of daily minimum temperature in a season) precipitation rate (rain/snowfall combined) wettest day of the season (99th percentile of daily precipitation rate in the season) specific humidity relative humidity total cloud net surface long wave flux net surface short wave flux total downward short wave flux mean sea level pressure. Over sea: mean air temperature precipitation rate total cloud mean sea level pressure. Probabilistic data is not provided for: wind speed snow soil moisture surface latent heat flux 36. Projections for these were included in UKCIP02, albeit with relatively low levels of confidence attached. The change is due either to technical incompatibility between the results of the different models now used for the UK projections or because results vary significantly between different models which, in turn, do not match observed data particularly well. Non-probabilistic data for specialist users on wind speed are available (outside UKCP09) based on outputs from the Met Office regional climate model for the medium scenario only from the Climate Impacts LINK website 37. A technical note is available on the interpretation of this information 38 ; however, in simple terms, it projects a slight decrease in winter mean wind speed over the UK. Published tables, maps and graphs A wide range of data tables, maps and graphs is available for climate variables for probabilities, ranging from 10% (very likely to be exceeded) to 90% (very unlikely to be exceeded) in a number of different forms, the most useful of which are: Plume plots These show a plume of probability under a given emissions scenario, giving the likely (10% to 90%) range of change of a particular climate variable over time for a particular location; in the case of figure 10, change in mean summer temperature. Design for future climate 43

5 Appendix 1: UK climate projections Figure 10: typical plume plot 33 Change in mean temperature ( C) Time period 90% 67% 50% 33% 10% Pre-prepared maps These are available for each of the three emissions scenarios for three time periods (2020s, 2050s and 2080s) for the majority of climate variables for: the UK as a whole administrative regions Creating bespoke maps and graphs A new user interface is available on the UKCP09 website to provide custom graphics and data tables tailored to individual user needs. This includes analytical tools, for example: A new Weather Generator is available for expert users only, which generates synthetic hourly data. The outputs do not represent actual weather and can only be used by considering together the results of many runs of the tool (at least 100). This provides statistically credible probabilistic representations of what might occur given a particular future climate and is useful in investigating the potential occurrence of events like heatwaves, frost and dry spells. A Threshold tool has also been developed that can be used in combination with the Weather Generator to produce statistics for the number of occasions when a variable (such as temperature) might be above or below a chosen value. This is useful for investigating heatwaves, heating or cooling degree days. Again, this is only suitable for expert use. river basins marine areas. 44 Design for future climate
6 Appendix 1: UK climate projections Overview of the projected climate Graphs Maps Tables Graphs Taking annual mean temperature as an example, figure 11 shows the projected range of likely change (relative to the baseline period of ) for the south east of England under the medium emissions scenario based on a UKCP09 plume plot. The central estimate is shown as a heavy dotted line, with the 10-90% probability range as a lightly shaded area and the 33-67% probability range more darkly shaded. Figure 11: annual mean temperature change in south east England (medium scenario) 2 In figure 12, given that none of the emissions scenarios can be regarded as being statistically more likely than any other, in order to take account of the full range of likely projections for the full range of emissions scenarios, the projections for the low (10% shaded green) and high (90% shaded grey) scenarios have been added to the graph. Figure 12: annual mean temperature change in south east England (all scenarios) 2 There is a wealth of information available on the UKCP09 website which is summarised in the UK Climate Projections: Briefing Report. 33 For those who principally need a broad understanding of the range of issues we might need to deal with, the following graphs and maps, developed by UKCIP for this report, give a simple overview. The tables on pages 60 and 61 summarise some of the projected changes for the 2080s. Change in annual mean temperature (ºC) % % 50% 3 33% 10% Time period Change in annual mean temperature (ºC) % 90% 67% 50% % 10% 10% Time period Low emissions Medium emissions High emissions Design for future climate 45
7 Appendix 1: UK climate projections A similar exercise can be carried out for other UK regions: north Scotland is shown in figure 13 as a comparative example. Figure 13: annual mean temperature change in north Scotland (all scenarios) 2 Change in annual mean temperature (ºC) % 90% 67% 50% 33% 2 10% 10% Time period Low emissions Medium emissions High emissions The projected changes for north Scotland are slightly less than that for the south east of England, both in terms of magnitude and spread for different scenarios, illustrating the point that climate impacts are a regional issue, with different projected levels of change for different regions. Plume plots demonstrate very effectively that, for all climate variables and scenarios modelled, the climate is still extremely likely to be changing at the end of the twenty-first century rather than stabilising or showing signs of returning to the climate we are currently familiar with. This has two consequences: firstly, that adaptation is likely to be an ongoing issue for the foreseeable future rather than accommodating a single step change; and secondly, that adaptation measures designed to accommodate a higher emissions scenario or a higher probability than in fact turns out to be the case will simply have a longer life. To put it another way, many changes that might be at the upper end of probability under a high scenario in the 2020s are projected to become the norm in, say, the 2050s. Obviously, if global agreements are put in place that manage to limit global temperature change to under 2 C, a more optimistic picture might emerge. However, in the absence of this we have little alternative but to prepare for higher and ongoing levels of change. In figure 14, the same plume plots plotted against absolute temperature rather than temperature change (these are approximate extrapolations of UKCP09 data for illustrative purposes rather than data supplied directly from UKCP09) illustrate that, whereas there is a significant difference in temperature across the UK currently, under a changing climate the climate will become more divergent, and more so at the upper levels of emissions scenarios and probabilities. Under these circumstances it will become increasingly important to take account of climate differences in different locations across the country. 46 Design for future climate
 17 16 15 14 13 12 11 10 9 8 7 South East England North Scotland 2020 2030 2040 2050 2060 2070 2080 Time period 90% 10% 90% 10% Maps The maps produced in UKCP09 are perhaps the most useful")
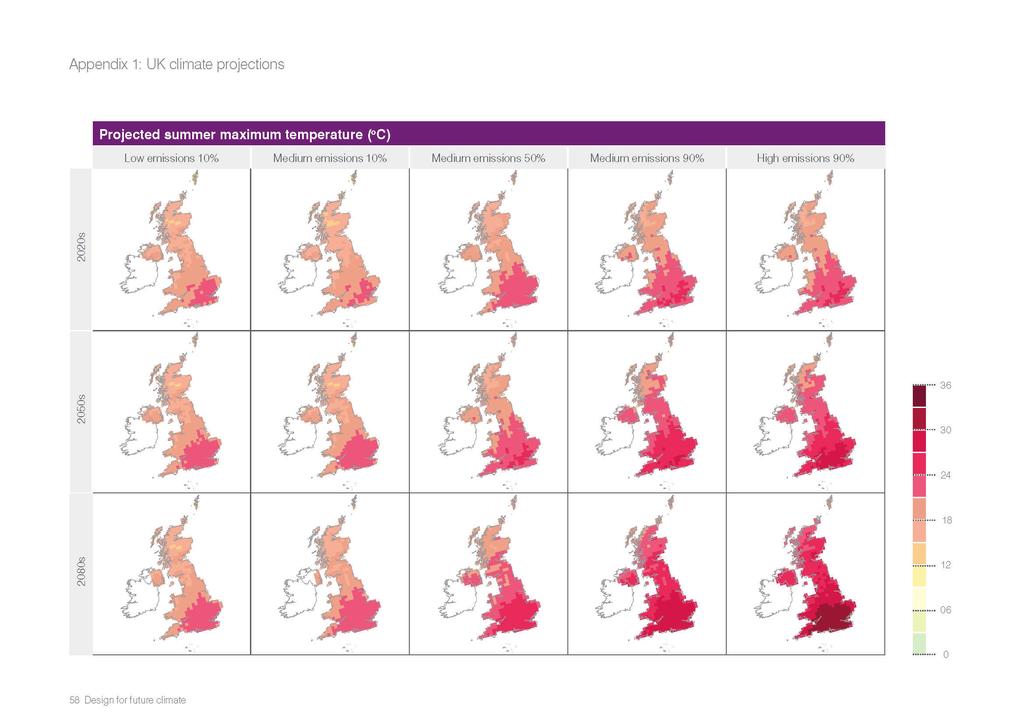
8 Appendix 1: UK climate projections Figure 14: change in absolute annual mean temperature for south east England (top) and north Scotland (bottom) (all scenarios) 39 Change in annual mean temperature (ºC) South East England North Scotland Time period 90% 10% 90% 10% Maps The maps produced in UKCP09 are perhaps the most useful visualisation of the effects of climate change for different aspects of climate. The maps on the following pages 2 have been assembled from UKCP09 data to give overviews of the likely range of change across the country and across all three emissions scenarios for a number of the most relevant climate variables. These maps show the likely range of change from the 10th percentile projection for the low emissions scenario, through the likely range for the medium scenario, to the 90th percentile projection for the high scenario. Change less than that shown for the 10th percentile projection for the low emissions scenario is very unlikely, as is change greater than that shown for the 90th percentile projection for the high scenario (assuming of course that the range of emissions scenarios modelled are themselves reasonable projections). Low emissions Medium emissions High emissions Design for future climate 47
9
10
11
12
13
14
15
16
17
18
19
20
21 Appendix 1: UK climate projections Tables Projected changes by 2080 Climate aspect Mean daily maximum temperatures will increase everywhere Likely range 10% 50% 90% Here are some examples of projected changes by 2080 for the medium emissions scenario (relative to the baseline period of ) 2. A range of values is given. Values are very unlikely to be less than the 10% value and very unlikely to be greater than the 90% value, the 50% value is the central estimate. Winter maximum: Southern England 0.7 C 1.5 C 2.7 C Northern Britain 1.3 C 2.5 C 4.4 C Summer maximum: Climate aspect Likely range Southern England 1.0 C 5.4 C 9.5 C Northern Britain 1.0 C 2.8 C 5.0 C All areas of the UK will become warmer, more so in summer than winter Change in summer mean temperatures: 10% 50% 90% Greatest in southern England 2.2 C 4.2 C 6.8 C Warmest day in summer (no simple geographical pattern): Lowest change 2.4 C 2.4 C 6.8 C Highest change 0.2 C 4.8 C 12.3 C Least in the Scottish islands 1.2 C 2.5 C 4.1 C Climate aspect Mean daily minimum temperatures will increase everywhere Winter daily minimum: Likely range 10% 50% 90% Least change 0.6 C 2.1 C 3.7 C Greatest change 1.5 C 3.5 C 5.9 C Summer daily minimum: Least change (northern Scotland) 1.3 C 2.7 C 4.5 C Greatest change (southern Britain) 2.0 C 4.1 C 7.1 C 60 Design for future climate
22 Appendix 1: UK climate projections Climate aspect Likely range Climate aspect Likely range Little change in total annual rainfall (central estimate) but a change in the balance between winter and summer 10% 50% 90% Relative humidity will decrease in summer in parts of southern England, by less elsewhere. Winter changes are a few per cent less everywhere 10% 50% 90% Total range (no simple geographical pattern) 16% 14% Winter: Greatest increase (western side of the UK) 9% 33% 70% Greatest decrease (Scottish Highlands) 11% Summer: Little change Greatest decrease (far south of England) 65% 40 % 6% Smallest decrease (Scottish Highlands) 8% Wettest day in winter: Lowest estimate (northern Scotland) 12% Little change Little change 7% 10% 13% Highest estimate (parts of England) 7% 25% 56% Wettest day in summer: Lowest estimate 38% 12% 9% Highest estimate 12% 1% 51% Lowest estimate (southern England) 20% 9% 0% Summer cloud cover decreases in parts of southern England but increases in parts of northern Scotland Summer mean cloud cover: 10% 50% 90% Maximum decrease (southern England) 33% 18% 2% Maximum increase (northern Scotland) 0% 0% 11% Winter mean cloud cover: Little change 10% 10% Gulf Stream (Atlantic Ocean circulation): very unlikely that there will be an abrupt change during the century Snowfall: not included in probabilistic data; however, the Met Office regional climate model projects reductions in winter mean snowfall. Mountain areas: between 65% and 80% Elsewhere: between 80% and 95% Wind speed: also not included in probabilistic data; however, the Met Office regional climate model projects reductions in winter mean wind speed of a few per cent over the UK No assessment is included of how the urban heat island effect may change Design for future climate 61
Review of medium to long term coastal risks associated with British Energy sites: Climate Change Effects - Final Report
 Review of medium to long term coastal risks associated with British Energy sites: Climate Change Effects - Final Report Prepared for British Energy Generation Ltd Authors: Reviewed by: Authorised for issue
Fig P3. *1mm/day = 31mm accumulation in May = 92mm accumulation in May Jul
 Met Office 3 month Outlook Period: May July 2014 Issue date: 24.04.14 Fig P1 3 month UK outlook for precipitation in the context of the observed annual cycle The forecast presented here is for May and
What is the IPCC? Intergovernmental Panel on Climate Change
 IPCC WG1 FAQ What is the IPCC? Intergovernmental Panel on Climate Change The IPCC is a scientific intergovernmental body set up by the World Meteorological Organization (WMO) and by the United Nations
1990 Intergovernmental Panel on Climate Change Impacts Assessment
 1990 Intergovernmental Panel on Climate Change Impacts Assessment Although the variability of weather and associated shifts in the frequency and magnitude of climate events were not available from the
Current and future climate of the Cook Islands. Pacific-Australia Climate Change Science and Adaptation Planning Program
 Pacific-Australia Climate Change Science and Adaptation Planning Program Penrhyn Pukapuka Nassau Suwarrow Rakahanga Manihiki N o r t h e r n C o o k I s l a nds S o u t h e Palmerston r n C o o k I s l
Seamless weather and climate for security planning
 Seamless weather and climate for security planning Kirsty Lewis, Principal Climate Change Consultant, Met Office Hadley Centre 28 June 2010 Global Climate Models Mitigation timescale changes could be avoided
Climate Change 2007: The Physical Science Basis
 Climate Change 2007: The Physical Science Basis Working Group I Contribution to the IPCC Fourth Assessment Report Presented by R.K. Pachauri, IPCC Chair and Bubu Jallow, WG 1 Vice Chair Nairobi, 6 February
Projections of future climate change
 Projections of future climate change Matthew Collins 1,2 and Catherine A. Senior 2 1 Centre for Global Atmospheric Modelling, Department of Meteorology, University of Reading 2 Met Office Hadley Centre,
SHAPING OUR FUTURE: THE CLIMATE CHALLENGE KS3 LESSON 1 TEACHER GUIDE HOW IS OUR CLIMATE CHANGING?
 SHAPING OUR FUTURE: THE CLIMATE CHALLENGE KS3 LESSON 1 TEACHER GUIDE HOW IS OUR CLIMATE CHANGING? KS3 LESSON 1 TEACHER GUIDE HOW IS OUR CLIMATE CHANGING? Learning objective: To understand, through the
Climate Variability and Change Past, Present and Future An Overview
 Climate Variability and Change Past, Present and Future An Overview Dr Jim Salinger National Institute of Water and Atmospheric Research Auckland, New Zealand INTERNATIONAL WORKSHOP ON REDUCING VULNERABILITY
Update on Climate Science. Professor Richard Betts, Met Office
 Update on Climate Science Professor Richard Betts, Met Office The science of climate change Crown copyright Met Office Prof Richard Betts Head of Climate Impacts Research Crown copyright Met Office Observing
Climate Change and the East Midlands Economy Executive Summary
 Climate Change and the East Midlands Economy Executive Summary A report prepared for emda Met Office Consultancy August 2010 This work, with the exception of logos, photographs and images and any other
Observed Climate Variability and Change: Evidence and Issues Related to Uncertainty
 Observed Climate Variability and Change: Evidence and Issues Related to Uncertainty David R. Easterling National Climatic Data Center Asheville, North Carolina Overview Some examples of observed climate
Understanding Weather and Climate Risk. Matthew Perry Sharing an Uncertain World Conference The Geological Society, 13 July 2017
 Understanding Weather and Climate Risk Matthew Perry Sharing an Uncertain World Conference The Geological Society, 13 July 2017 What is risk in a weather and climate context? Hazard: something with the
National Meteorological Library and Archive
 National Meteorological Library and Archive Fact sheet No. 4 Climate of the United Kingdom Causes of the weather in the United Kingdom The United Kingdom lies in the latitude of predominately westerly
LONDON & TE December 2009
 LONDON & TE2100 10 December 2009 Tim Reeder Environment Agency How is London vulnerable to CC? Flooding Overheating Water resources Air Quality Subsidence and heave Wind storms Global climate events What
Cape Verde. General Climate. Recent Climate. UNDP Climate Change Country Profiles. Temperature. Precipitation
 UNDP Climate Change Country Profiles C. McSweeney 1, M. New 1,2 and G. Lizcano 1 1. School of Geography and Environment, University of Oxford. 2. Tyndall Centre for Climate Change Research http://country-profiles.geog.ox.ac.uk
Current and future climate of Vanuatu. Pacific-Australia Climate Change Science and Adaptation Planning Program
 Pacific-Australia Climate Change Science and Adaptation Planning Program Hiu Torres Islands Vanua Lava Gaua Banks Islands Espiritu Santo Malekula Ambae Épi Maéwo Pentecost Ambrym Shepherd Islands Éfate
Climate changes in Finland, but how? Jouni Räisänen Department of Physics, University of Helsinki
 Climate changes in Finland, but how? Jouni Räisänen Department of Physics, University of Helsinki 19.9.2012 Outline Some basic questions and answers about climate change How are projections of climate
Climate Change Models: The Cyprus Case
 Climate Change Models: The Cyprus Case M. Petrakis, C. Giannakopoulos, G. Lemesios National Observatory of Athens AdaptToClimate 2014, Nicosia Cyprus Climate Research (1) Climate is one of the most challenging
3. Climate Change. 3.1 Observations 3.2 Theory of Climate Change 3.3 Climate Change Prediction 3.4 The IPCC Process
 3. Climate Change 3.1 Observations 3.2 Theory of Climate Change 3.3 Climate Change Prediction 3.4 The IPCC Process 3.1 Observations Need to consider: Instrumental climate record of the last century or
Global warming and Extremes of Weather. Prof. Richard Allan, Department of Meteorology University of Reading
 Global warming and Extremes of Weather Prof. Richard Allan, Department of Meteorology University of Reading Extreme weather climate change Recent extreme weather focusses debate on climate change Can we
CLIMATE RESILIENCE FOR ALBERTA MUNICIPALITIES CLIMATE PROJECTIONS NORTHERN ALBERTA. Dr. Mel Reasoner Reasoner Environmental Consulting
 CLIMATE RESILIENCE FOR ALBERTA MUNICIPALITIES CLIMATE PROJECTIONS NORTHERN ALBERTA Dr. Mel Reasoner Reasoner Environmental Consulting Probability of occurrence Increase in Mean Temperature & Variance Less
Mozambique. General Climate. UNDP Climate Change Country Profiles. C. McSweeney 1, M. New 1,2 and G. Lizcano 1
 UNDP Climate Change Country Profiles Mozambique C. McSweeney 1, M. New 1,2 and G. Lizcano 1 1. School of Geography and Environment, University of Oxford. 2.Tyndall Centre for Climate Change Research http://country-profiles.geog.ox.ac.uk
The importance of sampling multidecadal variability when assessing impacts of extreme precipitation
 The importance of sampling multidecadal variability when assessing impacts of extreme precipitation Richard Jones Research funded by Overview Context Quantifying local changes in extreme precipitation
Climate Dataset: Aitik Closure Project. November 28 th & 29 th, 2018
 1 Climate Dataset: Aitik Closure Project November 28 th & 29 th, 2018 Climate Dataset: Aitik Closure Project 2 Early in the Closure Project, consensus was reached to assemble a long-term daily climate
Future changes in fog frequency from the UKCP09 ensemble of regional climate model projections UKCP09 additional product
 UK CLIMATE PROJECTIONS Future changes in fog frequency from the UKCP09 ensemble of regional climate model projections UKCP09 additional product http://ukclimateprojections.defra.gov.uk 2 UK CLIMATE PROJECTIONS
A Study of the Uncertainty in Future Caribbean Climate Using the PRECIS Regional Climate Model
 A Study of the Uncertainty in Future Caribbean Climate Using the PRECIS Regional Climate Model by Abel Centella and Arnoldo Bezanilla Institute of Meteorology, Cuba & Kenrick R. Leslie Caribbean Community
CLIMATE MODEL DOWNSCALING: HOW DOES IT WORK AND WHAT DOES IT TELL YOU?
 rhgfdjhngngfmhgmghmghjmghfmf CLIMATE MODEL DOWNSCALING: HOW DOES IT WORK AND WHAT DOES IT TELL YOU? YAN FENG, PH.D. Atmospheric and Climate Scientist Environmental Sciences Division Argonne National Laboratory
CLIMATE RESILIENCE FOR ALBERTA MUNICIPALITIES CLIMATE PROJECTIONS SOUTHERN ALBERTA. Dr. Mel Reasoner Reasoner Environmental Consulting
 CLIMATE RESILIENCE FOR ALBERTA MUNICIPALITIES CLIMATE PROJECTIONS SOUTHERN ALBERTA Dr. Mel Reasoner Reasoner Environmental Consulting Probability of occurrence Increase in Mean Temperature & Variance Less
CLIMATE READY BOSTON. Climate Projections Consensus ADAPTED FROM THE BOSTON RESEARCH ADVISORY GROUP REPORT MAY 2016
 CLIMATE READY BOSTON Sasaki Steering Committee Meeting, March 28 nd, 2016 Climate Projections Consensus ADAPTED FROM THE BOSTON RESEARCH ADVISORY GROUP REPORT MAY 2016 WHAT S IN STORE FOR BOSTON S CLIMATE?
Lecture 28: Observed Climate Variability and Change
 Lecture 28: Observed Climate Variability and Change 1. Introduction This chapter focuses on 6 questions - Has the climate warmed? Has the climate become wetter? Are the atmosphere/ocean circulations changing?
IMPACTS OF A WARMING ARCTIC
 The Earth s Greenhouse Effect Most of the heat energy emitted from the surface is absorbed by greenhouse gases which radiate heat back down to warm the lower atmosphere and the surface. Increasing the
Zambia. General Climate. Recent Climate Trends. UNDP Climate Change Country Profiles. Temperature. C. McSweeney 1, M. New 1,2 and G.
 UNDP Climate Change Country Profiles Zambia C. McSweeney 1, M. New 1,2 and G. Lizcano 1 1. School of Geography and Environment, University of Oxford. 2. Tyndall Centre for Climate Change Research http://country-profiles.geog.ox.ac.uk
National Meteorological Library and Archive
 National Meteorological Library and Archive Fact sheet No. 4 Climate of the United Kingdom Causes of the weather in the United Kingdom The United Kingdom lies in the latitude of predominately westerly
THE CANADIAN CENTRE FOR CLIMATE MODELLING AND ANALYSIS
 THE CANADIAN CENTRE FOR CLIMATE MODELLING AND ANALYSIS As Canada s climate changes, and weather patterns shift, Canadian climate models provide guidance in an uncertain future. CANADA S CLIMATE IS CHANGING
Chapter outline. Reference 12/13/2016
 Chapter 2. observation CC EST 5103 Climate Change Science Rezaul Karim Environmental Science & Technology Jessore University of science & Technology Chapter outline Temperature in the instrumental record
J8.4 TRENDS OF U.S. SNOWFALL AND SNOW COVER IN A WARMING WORLD,
 J8.4 TRENDS OF U.S. SNOWFALL AND SNOW COVER IN A WARMING WORLD, 1948-2008 Richard R. Heim Jr. * NOAA National Climatic Data Center, Asheville, North Carolina 1. Introduction The Intergovernmental Panel
PREDICTING OVERHEATING RISK IN HOMES
 PREDICTING OVERHEATING RISK IN HOMES Susie Diamond Inkling Anastasia Mylona CIBSE Simulation for Health and Wellbeing 27th June 2016 - CIBSE About Inkling Building Physics Consultancy Susie Diamond Claire
Training: Climate Change Scenarios for PEI. Training Session April Neil Comer Research Climatologist
 Training: Climate Change Scenarios for PEI Training Session April 16 2012 Neil Comer Research Climatologist Considerations: Which Models? Which Scenarios?? How do I get information for my location? Uncertainty
An Initial Estimate of the Uncertainty in UK Predicted Climate Change Resulting from RCM Formulation
 An Initial Estimate of the Uncertainty in UK Predicted Climate Change Resulting from RCM Formulation Hadley Centre technical note 49 David P. Rowell 6 May2004 An Initial Estimate of the Uncertainty in
What is PRECIS and what can it do?
 PRECIS: Facilitating capacity building and technology transfer to enable climate change mitigation and adaptation activities worldwide Joseph Intsiful, UNFCCC NWP Meeting, Mexico City 4-7 March 2008 Content:
Climate Change Scenarios 2030s
 Climate Change Scenarios 2030s Ashwini Kulkarni ashwini@tropmet.res.in K Krishna Kumar, Ashwini Kulkarni, Savita Patwardhan, Nayana Deshpande, K Kamala, Koteswara Rao Indian Institute of Tropical Meteorology,
Global Climate Change and the Implications for Oklahoma. Gary McManus Associate State Climatologist Oklahoma Climatological Survey
 Global Climate Change and the Implications for Oklahoma Gary McManus Associate State Climatologist Oklahoma Climatological Survey OCS LEGISLATIVE MANDATES Conduct and report on studies of climate and weather
The ENSEMBLES Project
 The ENSEMBLES Project Providing ensemble-based predictions of climate changes and their impacts by Dr. Chris Hewitt Abstract The main objective of the ENSEMBLES project is to provide probabilistic estimates
Climate Change in Newfoundland & Labrador
 Climate Change in Newfoundland & Labrador Impacts and Adaptation Newleef Conference 08 October 2015 Met-Ocean Services The Team 55 personnel; 24/7 operational weather forecast desk; Equipment technician
2015: A YEAR IN REVIEW F.S. ANSLOW
 2015: A YEAR IN REVIEW F.S. ANSLOW 1 INTRODUCTION Recently, three of the major centres for global climate monitoring determined with high confidence that 2015 was the warmest year on record, globally.
Baseline Climatology. Dave Parker ADD PRESENTATION TITLE HERE (GO TO: VIEW / MASTER / SLIDE MASTER TO AMEND) ADD PRESENTER S NAME HERE / ADD DATE HERE
 ADD PRESENTER S NAME HERE / ADD DATE HERE") Baseline Climatology Dave Parker ADD PRESENTATION TITLE HERE (GO TO: VIEW / MASTER / SLIDE MASTER TO AMEND) ADD PRESENTER S NAME HERE / ADD DATE HERE Copyright EDF Energy. All rights reserved. Introduction
Baseline Climatology Dave Parker ADD PRESENTATION TITLE HERE (GO TO: VIEW / MASTER / SLIDE MASTER TO AMEND) ADD PRESENTER S NAME HERE / ADD DATE HERE Copyright EDF Energy. All rights reserved. Introduction
Global Wind Patterns
 Name: Earth Science: Date: Period: Global Wind Patterns 1. Which factor causes global wind patterns? a. changes in the distance between Earth and the Moon b. unequal heating of Earth s surface by the Sun
Northern Rockies Adaptation Partnership: Climate Projections
 Northern Rockies Adaptation Partnership: Climate Projections Contents Observed and Projected Climate for the NRAP Region... 2 Observed and Projected Climate for the NRAP Central Subregion... 8 Observed
Climate. Annual Temperature (Last 30 Years) January Temperature. July Temperature. Average Precipitation (Last 30 Years)
 January Temperature. July Temperature. Average Precipitation (Last 30 Years)") Climate Annual Temperature (Last 30 Years) Average Annual High Temp. (F)70, (C)21 Average Annual Low Temp. (F)43, (C)6 January Temperature Average January High Temp. (F)48, (C)9 Average January Low Temp.
Climate Annual Temperature (Last 30 Years) Average Annual High Temp. (F)70, (C)21 Average Annual Low Temp. (F)43, (C)6 January Temperature Average January High Temp. (F)48, (C)9 Average January Low Temp.
What is Climate? Understanding and predicting climatic changes are the basic goals of climatology.
 What is Climate? Understanding and predicting climatic changes are the basic goals of climatology. Climatology is the study of Earth s climate and the factors that affect past, present, and future climatic
Australian Meteorological and Oceanographic Society (AMOS) Statement on Climate Change
 Statement on Climate Change") Australian Meteorological and Oceanographic Society (AMOS) Statement on Climate Change This statement provides a summary of some aspects of climate change and its uncertainties, with particular focus on
Australian Meteorological and Oceanographic Society (AMOS) Statement on Climate Change This statement provides a summary of some aspects of climate change and its uncertainties, with particular focus on
Weather and Climate Summary and Forecast December 2017 Report
 Weather and Climate Summary and Forecast December 2017 Report Gregory V. Jones Linfield College December 5, 2017 Summary: November was relatively cool and wet from central California throughout most of
CHAPTER 1: INTRODUCTION
 CHAPTER 1: INTRODUCTION There is now unequivocal evidence from direct observations of a warming of the climate system (IPCC, 2007). Despite remaining uncertainties, it is now clear that the upward trend
CURRENT AND FUTURE TROPICAL CYCLONE RISK IN THE SOUTH PACIFIC
 CURRENT AND FUTURE TROPICAL CYCLONE RISK IN THE SOUTH PACIFIC COUNTRY RISK PROFILE: SAMOA JUNE 2013 Samoa has been affected by devastating cyclones on multiple occasions, e.g. tropical cyclones Ofa and
Use of climate reanalysis for EEA climate change assessment. Blaz Kurnik. European Environment Agency (EEA)
") Use of climate reanalysis for EEA climate change assessment Blaz Kurnik European Environment Agency (EEA) 2016: EEA content priorities Circular economy Climate and Energy Sustainable Development Goals
Use of climate reanalysis for EEA climate change assessment Blaz Kurnik European Environment Agency (EEA) 2016: EEA content priorities Circular economy Climate and Energy Sustainable Development Goals
NIWA Outlook: March-May 2015
 March May 2015 Issued: 27 February 2015 Hold mouse over links and press ctrl + left click to jump to the information you require: Overview Regional predictions for the next three months: Northland, Auckland,
Climate Science, Projections and BoM Capability
 Climate Science, Projections and BoM Capability Climate Information Program: David Jones (Manager of Climate Monitoring and Prediction) & Leading in Climate Data, Monitoring, Prediction and Advice Perry
Weather and Climate Summary and Forecast November 2017 Report
 Weather and Climate Summary and Forecast November 2017 Report Gregory V. Jones Linfield College November 7, 2017 Summary: October was relatively cool and wet north, while warm and very dry south. Dry conditions
Extremes Events in Climate Change Projections Jana Sillmann
 Extremes Events in Climate Change Projections Jana Sillmann Max Planck Institute for Meteorology International Max Planck Research School on Earth System Modeling Temperature distribution IPCC (2001) Outline
Changes in Frequency of Extreme Wind Events in the Arctic
 Changes in Frequency of Extreme Wind Events in the Arctic John E. Walsh Department of Atmospheric Sciences University of Illinois 105 S. Gregory Avenue Urbana, IL 61801 phone: (217) 333-7521 fax: (217)
Analysing River Discharge Data for Flood Analysis
 Analysing River Discharge Data for Flood Analysis This suggested response provides answers to the eleven questions posed on the web-site. Your report should have covered all of this material. (A) Produce
Historical and Projected National and Regional Climate Trends
 Climate Change Trends for Planning at Sand Creek Massacre National Historic Site Prepared by Nicholas Fisichelli, NPS Climate Change Response Program April 18, 2013 Climate change and National Parks Climate
Northern New England Climate: Past, Present, and Future. Basic Concepts
 Northern New England Climate: Past, Present, and Future Basic Concepts Weather instantaneous or synoptic measurements Climate time / space average Weather - the state of the air and atmosphere at a particular
DEPARTMENT OF EARTH & CLIMATE SCIENCES Name SAN FRANCISCO STATE UNIVERSITY Nov 29, ERTH 360 Test #2 200 pts
 DEPARTMENT OF EARTH & CLIMATE SCIENCES Name SAN FRANCISCO STATE UNIVERSITY Nov 29, 2018 ERTH 360 Test #2 200 pts Each question is worth 4 points. Indicate your BEST CHOICE for each question on the Scantron
METADATA MANAGEMENT TOOL (LIO)
") METADATA MANAGEMENT TOOL (LIO) Climate data - High resolution projections Metadata Metadata (XML) Title Climate data - High resolution projections Date Date type Creation Date Date type Abstract Publication
METADATA MANAGEMENT TOOL (LIO) Climate data - High resolution projections Metadata Metadata (XML) Title Climate data - High resolution projections Date Date type Creation Date Date type Abstract Publication
Climate Change in Colorado: Recent Trends, Future Projections and Impacts An Update to the Executive Summary of the 2014 Report
 Climate Change in Colorado: Recent Trends, Future Projections and Impacts An Update to the Executive Summary of the 2014 Report Jeff Lukas, Western Water Assessment, University of Colorado Boulder - Lukas@colorado.edu
Climate Services in Practice UK Perspective
 Climate Services in Practice UK Perspective Chris Hewitt ICCS, Columbia University, October 2011 Overview Perspectives on: Why have a climate service? What is a climate service? UK activities Examples
Seasonal Climate Watch January to May 2016
 Seasonal Climate Watch January to May 2016 Date: Dec 17, 2015 1. Advisory Most models are showing the continuation of a strong El-Niño episode towards the latesummer season with the expectation to start
Chapter 7 Projections Based on Downscaling
 Damage caused by Tropical Cyclone Pat, Cook Islands, February 2010. Photo: National Environment Service, Government of the Cook Islands Chapter 7 Projections Based on Downscaling 181 Summary Downscaled
Antigua and Barbuda. General Climate. Recent Climate Trends. UNDP Climate Change Country Profiles. Temperature
 UNDP Climate Change Country Profiles Antigua and Barbuda C. McSweeney 1, M. New 1,2 and G. Lizcano 1 1. School of Geography and Environment, University of Oxford. 2. Tyndall Centre for Climate Change Research
Monthly Long Range Weather Commentary Issued: APRIL 18, 2017 Steven A. Root, CCM, Chief Analytics Officer, Sr. VP,
 Monthly Long Range Weather Commentary Issued: APRIL 18, 2017 Steven A. Root, CCM, Chief Analytics Officer, Sr. VP, sroot@weatherbank.com MARCH 2017 Climate Highlights The Month in Review The average contiguous
Climate Risk Profile for Samoa
 Climate Risk Profile for Samoa Report Prepared by Wairarapa J. Young Samoa Meteorology Division March, 27 Summary The likelihood (i.e. probability) components of climate-related risks in Samoa are evaluated
Confronting Climate Change in the Great Lakes Region. Technical Appendix Climate Change Projections CLIMATE MODELS
 Confronting Climate Change in the Great Lakes Region Technical Appendix Climate Change Projections CLIMATE MODELS Large, three-dimensional, coupled atmosphere-ocean General Circulation Models (GCMs) of
New Zealand Climate Update No 226, April 2018 Current climate March 2018
 New Zealand Climate Update No 226, April 2018 Current climate March 2018 March 2018 was characterised by significantly higher pressure than normal to the east of New Zealand. This pressure pattern, in
New Zealand Climate Update No 223, January 2018 Current climate December 2017
 New Zealand Climate Update No 223, January 2018 Current climate December 2017 December 2017 was characterised by higher than normal sea level pressure over New Zealand and the surrounding seas. This pressure
Cuba. General Climate. Recent Climate Trends. UNDP Climate Change Country Profiles. Temperature. C. McSweeney 1, M. New 1,2 and G.
 UNDP Climate Change Country Profiles Cuba C. McSweeney 1, M. New 1,2 and G. Lizcano 1 1. School of Geography and Environment, University of Oxford. 2. Tyndall Centre for Climate Change Research http://country-profiles.geog.ox.ac.uk
NIWA Outlook: October - December 2015
 October December 2015 Issued: 1 October 2015 Hold mouse over links and press ctrl + left click to jump to the information you require: Overview Regional predictions for the next three months: Northland,
Crown copyright Met Office
 Planning for extreme droughts: Current approaches for developing extreme drought scenarios and options for developing new methods Exeter Workshop 23/1/2017 Steven Wade, Elizabeth Brock, Fai Fung, Met Office
Climate change projections for Greater Manchester
 Climate change projections for Greater Manchester Cavan, G. 1 Introduction... 3 1.1 Background to climate change... 4 1.2 Emissions scenarios... 4 1.3 Probability levels... 6 1.4 Time periods... 6 1.4
Global Climate Change and the Implications for Oklahoma. Gary McManus Associate State Climatologist Oklahoma Climatological Survey
 Global Climate Change and the Implications for Oklahoma Gary McManus Associate State Climatologist Oklahoma Climatological Survey Our previous stance on global warming Why the anxiety? Extreme Viewpoints!
Energy Systems, Structures and Processes Essential Standard: Analyze patterns of global climate change over time Learning Objective: Differentiate
 Energy Systems, Structures and Processes Essential Standard: Analyze patterns of global climate change over time Learning Objective: Differentiate between weather and climate Global Climate Focus Question
Global warming is unequivocal: The 2007 IPCC Assessment
 Global warming is unequivocal: The 2007 IPCC Assessment Kevin E. Trenberth * March 2, 2007 * Any opinions, findings, conclusions, or recommendations expressed in this publication are those of the author
Operational event attribution
 Operational event attribution Peter Stott, NCAR, 26 January, 2009 August 2003 Events July 2007 January 2009 January 2009 Is global warming slowing down? Arctic Sea Ice Climatesafety.org climatesafety.org
St Lucia. General Climate. Recent Climate Trends. UNDP Climate Change Country Profiles. Temperature. Precipitation
 UNDP Climate Change Country Profiles St Lucia C. McSweeney 1, M. New 1,2 and G. Lizcano 1 1. School of Geography and Environment, University of Oxford. 2. Tyndall Centre for Climate Change Research http://country-profiles.geog.ox.ac.uk
Weather and Climate Summary and Forecast August 2018 Report
 Weather and Climate Summary and Forecast August 2018 Report Gregory V. Jones Linfield College August 5, 2018 Summary: July 2018 will likely go down as one of the top five warmest July s on record for many
SEASONAL VARIABILITY AND PERSISTENCE IN TEMPERATURE SCENARIOS FOR ICELAND
 SEASONAL VARIABILITY AND PERSISTENCE IN TEMPERATURE SCENARIOS FOR ICELAND Haraldur Ólafsson 1,2 and Ólafur Rögnvaldsson 2,3 1 University of Iceland, Reykjavík, Iceland 2 Bergen School of Meteorology, Geophysical
Regional Climate Change Effects Report
 Regional Climate Change Effects Report Aug 6, 2010 Robert Kafalenos, FHWA U.S. Department of Transportation Federal Highway Administration 1 Past Performance does not guarantee future returns Past weather
Extremes of Weather and the Latest Climate Change Science. Prof. Richard Allan, Department of Meteorology University of Reading
 Extremes of Weather and the Latest Climate Change Science Prof. Richard Allan, Department of Meteorology University of Reading Extreme weather climate change Recent extreme weather focusses debate on climate
Drought and Climate Extremes Indices for the North American Drought Monitor and North America Climate Extremes Monitoring System. Richard R. Heim Jr.
 Drought and Climate Extremes Indices for the North American Drought Monitor and North America Climate Extremes Monitoring System Richard R. Heim Jr. NOAA/NESDIS/National Climatic Data Center Asheville,
Percentage of normal rainfall for August 2017 Departure from average air temperature for August 2017
 New Zealand Climate Update No 219, August 2017 Current climate August 2017 Overall, mean sea level pressure was lower than normal over and to the west of New Zealand during August while higher than normal
Changes to Extreme Precipitation Events: What the Historical Record Shows and What It Means for Engineers
 Changes to Extreme Precipitation Events: What the Historical Record Shows and What It Means for Engineers Geoffrey M Bonnin National Oceanic and Atmospheric Administration National Weather Service Office
Forecasting the "Beast from the East" and Storm Emma
 Forecasting the "Beast from the East" and Storm Emma Ken Mylne and Rob Neal with contributions from several scientists across the Met Office ECMWF UEF Meeting, 5-8 June 2018 Beast started 24 Feb Emma reached
GLOBAL CLIMATES FOCUS
 which you will learn more about in Chapter 6. Refer to the climate map and chart on pages 28-29 as you read the rest of this chapter. FOCUS GLOBAL CLIMATES What are the major influences on climate? Where
ANNUAL BULLETIN OF CLIMATE CHANGE MONITORING IN KAZAKHSTAN:
 Ministry of Energy of the Republic of Kazakhstan Republican State Enterprise Kazhydromet ANNUAL BULLETIN OF CLIMATE CHANGE MONITORING IN KAZAKHSTAN: 213 ºС 2. 1.. -1. -2. -3. 1941 1945 1949 1953 1957 1961
PREDICTING DROUGHT VULNERABILITY IN THE MEDITERRANEAN
 J.7 PREDICTING DROUGHT VULNERABILITY IN THE MEDITERRANEAN J. P. Palutikof and T. Holt Climatic Research Unit, University of East Anglia, Norwich, UK. INTRODUCTION Mediterranean water resources are under
The elevations on the interior plateau generally vary between 300 and 650 meters with
 11 2. HYDROLOGICAL SETTING 2.1 Physical Features and Relief Labrador is bounded in the east by the Labrador Sea (Atlantic Ocean), in the west by the watershed divide, and in the south, for the most part,
How will global warming of 2 o C affect Delaware? Observed and projected changes in climate and their impacts
 How will global warming of 2 o C affect Delaware? Observed and projected changes in climate and their impacts To prevent dangerous interference with the climate system, the scientific view is that the
Tracking the fingerprints of climate change, three years after the Paris Agreement December 2018
 E ve n H eavier W eathe r Tracking the fingerprints of climate change, three years after the Paris Agreement December 2018 Writing: Richard Black Research: Russell Baum 1 Even Heavier Weather Exec utive