Goes. Summary. topographic. watershed. of the. wetlands, section. topo maps of. our area. 2. Allow. students to Note: Model. map (2.
|
|
|
- Paulina Norton
- 5 years ago
- Views:
Transcription
1 Goes It Does Chicago River Classroom Activity Summary Students will use the web to investigate the topography of the Chicago River watershed. Then students will make a model of the Chicago River watershed to observe how the Chicago River was reversed. Background Once a meandering stream surrounded by wetlands, the Chicago River has been channelized, polluted and even changed to flow backwards. See included articles for more details on the Chicago River. Procedure I. Topographic Maps 1. Pass out the student instructions for this section. Make sure to tell studentss to read ALL the directions beforee beginning. Visit or to view topo maps of our area. 2. Allow students to work at computers. Note: A teacher version of the instructionn sheet is included. It contains all the answers to the questions. II. Creating the Map and Making the Model 1. The day before class, make the gelatin models: Copy the attached tracing map (2 pages) onto transparencies. One map per group of four students. Grade Level: 5 th 8 th Duration: Two 45 minute class periods Objectives: 1. Students will be able to use topographic maps. 2. Student will create a 3D model of the Chicago River watershed. 3. Students will be able to articulate how the Chicago River was reversed. Materials: Turkey roasting pan (with stabilizing rack) 16 x12 x 2.5 (1 per group of 4) Clear Knox gelatin (1 canister) Water Blue food coloring Yellow food coloring Plastic knives (1 per group of 4) Plastic spoonss (2 per group of 4) Plastic cups, or beakers (2 per group of 4) Permanent markers (1 per group of 4) Attached riverr map printed on transparency film (1 per group of 4) Copies of student directions, reference map and threee articles (1 per student or group of 4) Standards: 1.B.3d, 13.B.3d, 13.B.3f, 16.A.3a, 16.A.3b, 16.E.3c, 17.C.3a, 17.D.3b NGSS: RI.8.10, 4-ESS3-1, 5-ESS3-1, RH 6-8 7, MS-ESS3-4, MS-ESS2-2 p. 1
2 Staple the two transparencies together so that one big map is formed. Be sure to line up the river sections. Note: The maps are in landscape format" ". Place a stapled transparency map at the bottom of each turkey pan (1 per group of 4). Make the pans of gelatin, pouring the gelatin right on top of the transparency map. The gelatin should be six inches deep. Because the gelatin is clear, the students will be able to see the map through it. 2. At the beginning of class: Divide students into groups of four. Pass out the student instruction sheets, a beaker, the food coloring, plastic knifes, spoons and permanent markers. Have students follow the direction sheets to make the model. Note: A teacher version of the instructionn sheet is included. It contains all the answers to the questions. p. 2
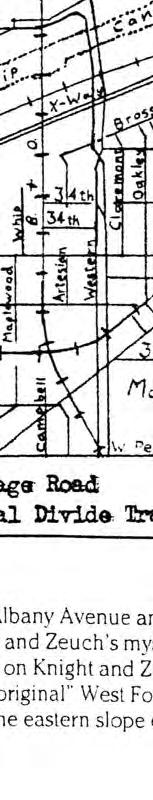
3 Goes It Does Teacher Version of Student Pages I. Topographic Maps View the Referencee Map of the Chicago River (attached) and notice its shape. It has three forks on top, turns toward the Lake and then travels south a bit. Originally, the river flowed from the north forks, south, into the main stem and from the south branches, northwest, into the main stem. Everything then flowed out into Lake Michigan. Why? To find out we will have to consult a topographic map. A topo-grapho-what you say? A topographic map ( or topo map for short) is a two dimensional representation of the land. It shows streets and buildings (maybe even your school), water bodies, parks and wetlands. It also shows the topography or the hilliness of the area. Brown lines curving all over the map have numbers on them. The numbers represent the number of feet that line (and hence that part of the land) is above sea level. If you look at several lines next to each other and the numbers are getting higher, you are climbing up a hill. If the numbers are gettingg lower, you are sliding down the hill. Follow the instructions to view the elevation pattern in the Chicago River watershed and find out why the river originally flowed into the lake. Instructions Go to or These websites can be used for viewing topographic maps online) you can also orderr custom topoo maps. Lets Practice: Find the elevation of your school 1. Visit one of the two websitess listed above. 2. Locate the United States, Illinois, or the City of Chicago and zoom in. has a locator for your school s address, or pick a well-known feature near you, like the Field Museum. 3. Find your school on the map. 4. When the map is on the screen be sure that it is set at a scale for easiest viewing. Select topo or terrain-topo mode to obtain a topo map. 5. Notice the brown curving lines all over the map. These are called contour lines and they indicate the elevation of an area. When you want to know the elevation of a particular spot follow the brown line closest to it until you see the brown number. This number indicates the elevation of that area in feet above sea level. Contour lines next to each other are five feet apart. (See the example below.) If a place is between two lines with different elevations, the elevation of that place is between those two elevations. For example, look at Raccoon High School above. The elevation of the school is somewhere between the 610 ft and 605 ft above sea level. p. 3
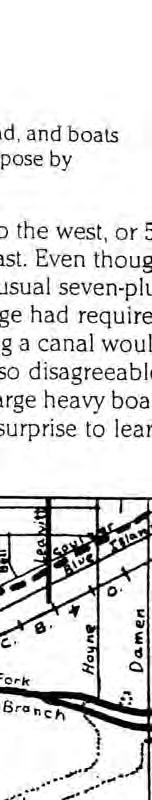
4 Contour lines Oak Street Raccoon HS Raccoon Lake 6. What is the elevation of your school? 7. Practice moving around the map. If you want the map to move east, west, north or south, place the cursor on the map and drag it that direction. This is especially helpful if you want to follow a street. Let s Get Going: Find the Elevation of the Threee Forks of the North Branch of the Chicago River Now let s take a look at the Reference Map given to you by your teacher. 1. What is the landmark at the top of the West Fork of the Chicago River? Florsheim Park (found at , ) a. Go to Topo maps and type in Florsheim Park, IL in Feature names. b. What is the elevation of this landmark? 689 above sea level 2. What is the landmark at the very top of the North Branch where the three forks meet? Linne Woods (found at , ) a. Go back to the toolbar above the topo map that you are looking at. b. Go to Topo maps and type in Linne Woods, IL in Feature names. c. What is the elevation of this landmark? (Remember to follow the line CLOSEST to the site.) 650 feet above sea level Keep it Going: Find the Elevation of the Main Branch of the Chicago River Take another look at the Reference Map and locate the Main Branch of the Chicago River. You will be tracing the elevation changes along the main branch, by following Kinzie Avenue. (Found at , ) 1. Go to Topo maps and type in Ogden Slip, IL in Feature names. Continue to follow Kinzie Avenue to the west when it becomes railroad tracks. 2. Fill in the elevation chart for the following locations: p. 4
5 Location Ogden Slip Kinzie Avenue and Ashland Avenue Kinzie Avenue and Sacramento Kinzie Avenue and Kostner Avenue Kinzie Avenue and Lockwood Kinzie Avenue and Pine Kinzie Avenue and Oak Park Avenue Kinzie Avenue and Kenilworth Kinzie Avenue and Franklin Kinzie Avenue and GAR Woods Elevation , , , , , , , , , , One More to Go: Find the Elevation of the South Branch of the Chicago River Look back at the Reference Map and locate the South Branch of the Chicago River. You will be tracing the elevation changes along the south branch and beyond, by following Cermak Avenue. (Found at 41.85, ) 1. Go to Topo maps and type in McCormick Place, IL in Featuree names. 2. Fill in the elevation chart for the following locations: Location Elevation Cermak at it s beginning at the lakeshoree , Cermak and Canalport , Cermak and Avers Avenue , Cermak and Pulaski , Cermak and Cicero , Cermak and Laramie , Cermak and Ridgeland , Cermak and Bur Oak Avenuee (Woodlawn , Cemeteries) Cermak and DesPlaines River , So What Do All Those Numbers Mean? All the numbers you found determine which way water flows because water flows downhill (from areas of higher to areas of lower elevation). Every water body is surrounded by a watershed an area of land that drains into the water body because the land is at a higher elevation than the water body. And water in a river itself will flow downhill until in reaches a lake, sea or ocean. Answer thesee questions to find out what your numbers mean for the flow of water in the Chicago River. 1. Which place has a higher elevation, the top of the West Fork or the top of the North Branch where the three forks meet? West Fork 2. Based on that information, which way does the water flow towards the north or south? South. The threee North Forks have a higher elevation than the beginning of the North Branch where the forks meet. Therefore, water will flow from the higher to lower elevation. p. 5
6 3. Look at your list of elevations from along the main stem. What happens to the elevation as you get further away from the lake? It increases. 4. Based on that information, which way does the Chicago River flow, into Lake Michigan or away from Lake Michigan? Into Lake Michigan. 5. Look at the elevations between the Chicago River and the Des Plaines River along Kinzie Avenue. What happens to the elevation? Goes up and then down. What is the highest point? 630 feet above sea level 6. Now look at the elevations between the Chicago River and the Des Plaines River along Cermak Avenue. What happens to the elevation? Goes up and then down. What is the highest point? 627 feet above sea level 7. Based on that information what does the water do west of the highest point? Flow into Des Plaines River. What does it do east of the highest point? Flow into the Chicago River. These high points show the presence of a sub continental divide water flowing into the Chicago River goes out through the Great Lakes to the Atlantic Ocean while water flowing into the Des Plaines River flows the opposite direction towards the Gulf of Mexico. Withoutt this sub continental divide there would be no Chicago today. Why? Read and find out! Read the article: Location, Location, Location. II. Creating the 3-D Model of the Chicago River Now thatt you understand the lay of the land, it is time to make a model of the Chicago River and watch the water flow. Instructions When you receive your pan of gelatin, notice that you can see a map of the Chicago River through the gelatin. You should be able to see right through the gelatin to the map. Tracing the Outline of the Water Bodies with Your Permanent Marker 1. Trace the outline of Lake Michigan using your permanent marker. You will be writing on top of the gelatin. 2. Now trace the West Fork, Middle Fork and Skokie River. 3. Finally, trace the North Branch, the Main Stem, and the South Branch. Do NOT trace the Sanitary and Ship Canal! We are first making a model of the original Chicago River. Cutting the River and Lake 1. Take your knife and cut along the outline of Lake Michigan. Now GENTLY scoop out Lake Michigan, removing all the gelatin. You should be left with a big whole where Lake Michigan is. 2. Take your knife and trace the lines of the river. Push your knife ONLY about ¼ of an inch into the gelatin. Do NOT dig out the rivers or your whole model will fall apart. p. 6
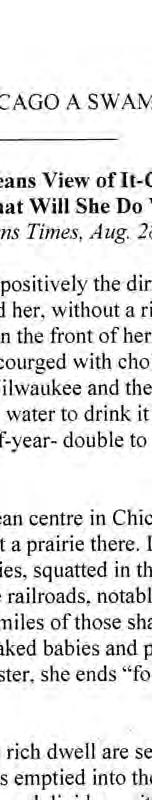
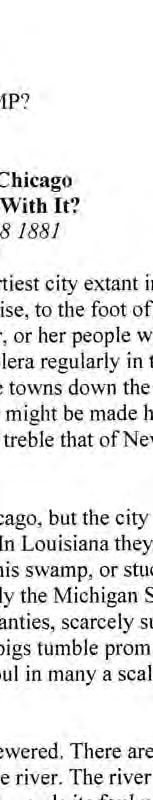
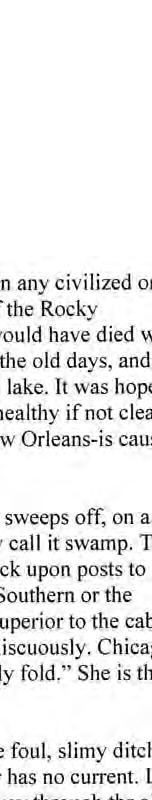
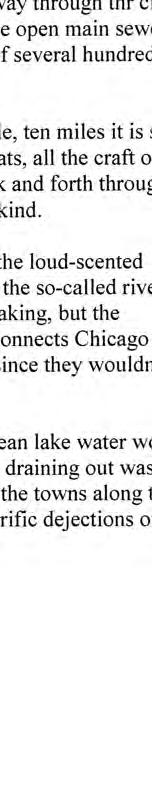
7 Adding Water 1. SLOWLY pour some blue colored water into the lake. Fill the lake to just below the top of the gelatin. Do NOT flood over the top of the gelatin or your model will falll apart. 2. Now SLOWLY pour some yellow colored water into the top of the three forks of the Chicago River. 3. Where does the yellow water in the Chicago River go? Down to the North Branch, into the main stem and out to the Lake. 4. Why does the water flow from the River into the Lake? Because the River is higher up than the Lake. Or stated another way, the lake is downhill from the river. Adding Sewers When Chicago was still young, in the mid and late 1800 s, the sewers would pour directly into the river. The sewage polluted more than the river. Read a 19 th century account of the problems: Is Chicago a Swamp? 1. Using the diagram below as a guide, you are going to be adding sewers to your model. With your knife, make some small holes in the gelatin. Connect the holes to the river with very shallow lines. Lake Michigan Chicago River Sewer Holes Sewer Tunnels 2. Pour some red food coloring into the holes. This represents sewage. 3. Where did Chicago s sewagee go in the mid to late 1800 s? Into the Chicago River and out to the lake. 4. How did this affect Chicago s drinking water? Chicago got its drinking water from the lake, so the city s drinking water source was polluted with sewage. p. 7
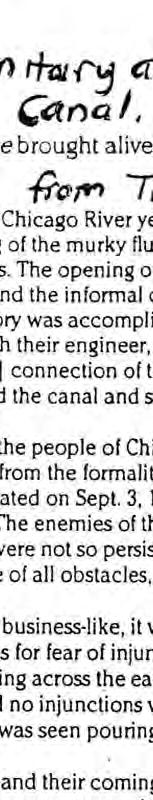
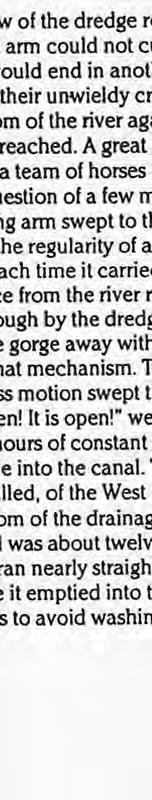
8 Adding the Sanitary and Ship Canal No one wants sewagee in their drinking water? What was Chicago to do? It decided to reverse the Chicago River by building the Chicago Sanitary and Ship Canal. 1. Read the 1900 newspaper article about the opening of the canal. Refer to Turn the River into Big Canal. 2. Using your permanent marker, trace the Chicago Sanitary and Ship Canal. 3. Starting at the edge of the tray and moving towards the South Branch of the Chicago River, cut the canal with your knife the same way you did for the rest of the rivers. (You are cutting it just like you read in the article! ) 4. Watch what happens! Clue: Watch the Chicago Sanitary and Ship Canal. 5. What color is the water in the Chicago Sanitary and Ship Canal? Green 6. Based on the color of the water in the Chicago Sanitary and Ship Canal, where is the water in the canal from? Lake Michigan (blue water) and Chicago River (yellow water). 7. So, is the river flowing into the lake or is the lake flowing into the river? The lake is flowing into the river. 8. Now block up the old river mouth (wheree the river meets the lake) with a piece of clay. Pour some blue water into the three northern forks. 9. Where does the water go? Into the canal. 10. Which part of the river is running backward? The Main Stem and South Branch. 11. How did the completion of the canal save the city s drinking water and help clean up the river? Clean lake water came in and flushed away the pollution, and the river no longer flowed into the lake. p. 8
9 Goes It Does Student Pages I. Topographic Maps View the Referencee Map of the Chicago River (attached) and notice its shape. It has three forks on top, turns toward the Lake and then travels south a bit. Originally, the river flowed from the north forks, south, into the main stem and from the south branches, northwest, into the main stem. Everything then flowed out into Lake Michigan. Why? To find out we will have to consult a topographic map. A topo-grapho-what you say? A topographic map ( or topo map for short) is a two dimensional representation of the land. It shows streets and buildings (maybe even your school), water bodies, parks and wetlands. It also shows the topography or the hilliness of the area. Brown lines curving all over the map have numbers on them. The numbers represent the number of feet that line (and hence that part of the land) is above sea level. If you look at several lines next to each other and the numbers are getting higher, you are climbing up a hill. If the numbers are gettingg lower, you are sliding down the hill. Follow the instructions to view the elevation pattern in the Chicago River watershed and find out why the river originally flowed into the lake. Instructions Go to or websites can be used for viewing topographic maps online) you can also order custom topoo maps. Lets Practice: Find the elevation of your school 1. Visit one of the two websitess listed above. 2. Locate the United States, Illinois, or the City of Chicago and zoom in. has a locator for your school s address, or pick a well-known feature near you, like the Field Museum. 3. Find your school on the map. 4. When the map is on the screen be sure that it is set at a scale for easiest viewing. Select topo or terrain-topo mode to obtain a topo map. 5. Notice the brown curving lines all over the map. These are called contour lines and they indicate the elevation of an area. When you want to know the elevation of a particular spot follow the brown line closest to it until you see the brown number. This number indicates the elevation of that area in feet above sea level. Contour lines next to each other are five feet apart. (See the example below.) If a place is between two lines with different elevations, the elevation of that place is between those two elevations. For example, look at Raccoon High School above. The elevation of the school is somewhere between the 610 ft and 605 ft above sea level. p. 9
10 Contour lines Oak Street Raccoon HS Raccoon Lake 6. What is the elevation of your school? 7. Practice moving around the map. If you want the map to move east, west, north or south, place the cursor on the map and drag it that direction. This is especially helpful if you want to follow a street. Let s Get Going: Find the Elevation of the Threee Forks of the North Branch of the Chicago River Now let s take a look at the Reference Map given to you by your teacher. 1. What is the landmark at the top of the West Fork of the Chicago River? a. Go to Topo maps and type in Florsheim Park, IL in Feature names. b. What is the elevation of this landmark? 2. What is the landmark at the very top of the North Branch where the three forks meet? a. Go back to the toolbar above the topo map that you are looking at. b. Go to Topo maps and type in Linne Woods, IL in Feature names. c. What is the elevation of this landmark? (Remember to follow the line CLOSEST to the site.) Keep it Going: Find the Elevation of the Main Branch of the Chicago River Take another look at the Reference Map and locate the Main Branch of the Chicago River. You will be tracing the elevation changes along the main branch, by following Kinzie Avenue. 1. Go to Topo maps and type in Ogden Slip, IL in Feature names. Continue to follow Kinzie Avenue to the west when it becomes railroad tracks. 2. Fill in the elevation chart for the following locations: p. 10
11 Location Ogden Slip Kinzie Avenue and Ashland Avenue Kinzie Avenue and Sacramento Kinzie Avenue and Kostner Avenue Kinzie Avenue and Lockwood Kinzie Avenue and Pine Kinzie Avenue and Oak Park Avenue Kinzie Avenue and Kenilworth Kinzie Avenue and Franklin Kinzie Avenue and GAR Woods Elevation One More to Go: Find the Elevation of the South Branch of the Chicago River Look back at the Reference Map and locate the South Branch of the Chicago River. You will be tracing the elevation changes along the south branch and beyond, by following Cermak Avenue. 1. Go to Topo maps and type in McCormick Place, IL in Featuree names. 2. Fill in the elevation chart for the following locations: Location Cermak at it s beginning at the lakeshoree Cermak and Canalport Cermak and Avers Avenue Cermak and Pulaski Cermak and Cicero Cermak and Laramie Cermak and Ridgeland Cermak and Bur Oak Avenuee (Woodlawn Cemeteries) Cermak and DesPlaines River Elevation So What Do All Those Numbers Mean? All the numbers you found determine which way water flows because water flows downhill (from areas of higher to areas of lower elevation). Every water body is surrounded by a watershed an area of land that drains into the water body because the land is at a higher elevation than the water body. And water in a river itself will flow downhill until in reaches a lake, sea or ocean. Answer thesee questions to find out what your numbers mean for the flow of water in the Chicago River. p. 11
12 1. Which place has a higher elevation, the top of the West Fork or the top of the North Branch where the three forks meet? 2. Based on that information, which way does the water flow towards the north or south? 3. Look at your list of elevations from along the main stem. What happens to the elevation as you get further away from the lake? 4. Based on that information, which way does the Chicago River flow, into Lake Michigan or away from Lake Michigan? 5. Look at the elevations between the Chicago River and the Des Plaines River along Kinzie Avenue. What happens to the elevation? What is the highest point? 6. Now look at the elevations between the Chicago River and the Des Plaines River along Cermak Avenue. What happens to the elevation? What is the highest point? 7. Based on that information what does the water do west of the highest point? What does it do east of the highest point? These high points show the presence of a sub continental divide water flowing into the Chicago River goes out through the Great Lakes to the Atlantic Ocean while water flowing into the Des Plaines River flows the opposite direction towards the Gulf of Mexico. Withoutt this sub continental divide there would be no Chicago today. Why? Read and find out! Read the article: Location, Location, Location. p. 12
13 II. Creating the 3-D Model of the Chicago River Now thatt you understand the lay of the land, it is time to make a model of the Chicago River and watch the water flow. Instructions When you receive your pan of gelatin, notice that you can see a map of the Chicago River through the gelatin. You should be able to see right through the gelatin to the map. Tracing the Outline of the Water Bodies with Your Permanent Marker 1. Trace the outline of Lake Michigan using your permanent marker. You will be writing on top of the gelatin. 2. Now trace the West Fork, Middle Fork and Skokie River. 3. Finally, trace the North Branch, the Main Stem, and the South Branch. Do NOT trace the Sanitary and Ship Canal! We are first making a model of the original Chicago River. Cutting the River and Lake 1. Take your knife and cut along the outline of Lake Michigan. Now GENTLY scoop out Lake Michigan, removing all the gelatin. You should be left with a big whole where Lake Michigan is. 2. Take your knife and trace the lines of the river. Push your knife ONLY about ¼ of an inch into the gelatin. Do NOT dig out the rivers or your whole model will fall apart. Adding Water 1. SLOWLY pour some blue colored water into the lake. Fill the lake to just below the top of the gelatin. Do NOT flood over the top of the gelatin or your model will falll apart. 2. Now SLOWLY pour some yellow colored water into the top of the three forks of the Chicago River. 3. Where does the yellow water in the Chicago River go? 4. Why does the water flow from the River into the Lake? Adding Sewers When Chicago was still young, in the mid and late 1800 s, the sewers would pour directly into the river. The sewage polluted more than the river. Read a 19 th century account of the problems: Is Chicago a Swamp? 1. Using the diagram below as a guide, you are going to be adding sewers to your model. With your knife, make some small holes in the gelatin. Connect the holes to the river with very shallow lines. p. 13
14 Lake Michigan Chicago River Sewer Holes Sewer Tunnels 2. Pour some red food coloring into the holes. This represents sewage. 3. Where did Chicago s sewagee go in the mid to late 1800s? 4. How did this affect Chicago s drinking water? Adding the Sanitary and Ship Canal No one wants sewagee in their drinking water? What was Chicago to do? It decided to reverse the Chicago River by building the Chicago Sanitary and Ship Canal. 1. Read the 1900 newspaper article about the opening of the canal. Refer to Turn the River into Big Canal. 2. Using your permanent marker, trace the Chicago Sanitary and Ship Canal. 3. Starting at the edge of the tray and moving towards the South Branch of the Chicago River, cut the canal with your knife the same way you did for the rest of the rivers. (You are cutting it just like you read in the article! ) 4. Watch what happens! Clue: Watch the Chicago Sanitary and Ship Canal. 5. What color is the water in the Chicago Sanitary and Ship Canal? 6. Based on the color of the water in the Chicago Sanitary and Ship Canal, where is the water in the canal from? p. 14
15 7. So, is the river flowing into the lake or is the lake flowing into the river? 8. Now block up the old river mouth (wheree the river meets the lake) with a piece of clay. Pour some blue water into the three northern forks. 9. Where does the water go? 10. Which part of the river is running backward? 11. How did the completion of the canal save the city s drinking water and help clean up the river? p. 15

16 p. 16

17 p. 17


18 Reference Map p. 18


19 p. 19


20 p. 20


21 p. 21


22 p. 22


23 p. 23


24 p. 24


25 p. 25


26 p. 26
Goes. Summary. topographic. watershed. of the. wetlands, section. topo maps of. our area. students to Note: 2. Allow. Model. inches deep.
 Goes It Does Chicago River Classroom Activity Summary Students will use the web to investigate the topography of the Chicago River watershed. Then students will make a model of the Chicago River watershed
EROSION RATES (1 Hour)
") EROSION RATES (1 Hour) Addresses NGSS Level of Difficulty: 2 Grade Range: 3-5 OVERVIEW In this activity, students will conduct simple investigations to collect data on erosion rates of different Earth
EROSION RATES (1 Hour) Addresses NGSS Level of Difficulty: 2 Grade Range: 3-5 OVERVIEW In this activity, students will conduct simple investigations to collect data on erosion rates of different Earth
Topographic Maps. Take Notes as you view the slides
 Topographic Maps Take Notes as you view the slides Lesson Objectives Define a topographic map and state its uses. Describe how contour lines show the elevations, shape, and slope of the land. Identify
UNIT 1C. USING TOPOGRAPHIC MAPS WHERE IN THE WORLD... ARE YOU?
 UNIT 1C. USING TOPOGRAPHIC MAPS WHERE IN THE WORLD... ARE YOU? TIME 60-90 minutes LEVEL All BENCHMARKS Next Generation Science Standards MS-LS1.D Science & Engineering Practices Developing and Using Models
Earth processes are dynamic actions that occur both on
 29 Weathering, Erosion, and Deposition R EA D I N G Earth processes are dynamic actions that occur both on the earth s surface and inside the earth. Any process that breaks down earth material, such as
CT Science Standard 4.3 Erosion Water has a major role in shaping the earth s surface. Trail Guides
 Trail Guides We have created a set of Trail Guides for use by you and your students as you explore our galleries on your field trip. The first section consists of the trail guides with teacher notes (pages
Notes and Summary pages:
 Topographic Mapping 8.9C Interpret topographical maps and satellite views to identify land and erosional features and predict how these shapes may be reshaped by weathering ATL Skills: Communication taking
Disciplinary Core Ideas
 WATER SLIDE (1 Hour) Addresses NGSS Level of Difficulty: 2 Grade Range: K-2 OVERVIEW In this activity, students will experiment with ice and water and evaluate how both can carry materials and change the
flow and ways: a storm
 Flow Tell Us? Chicago River Classroom Activity Summary In this lesson, students will examine historic stream flow data to understand how stream flow has changed over time. Students will then hypothesize
One Hilltop, Three Major Watersheds!
 One Hilltop, Three Major Watersheds! Adapted from: An original Creek Connections activity. Creek Connections, Box E, Allegheny College, Meadville, Pennsylvania, 16335 Watersheds of PA/ Topo Map Review
Erosion. erosion OBJECTIVES SCHEDULE PREPARATION VOCABULARY MATERIALS. For the class. The students. For each student. For each team of four
 activity 2 Erosion OBJECTIVES In this activity, students are introduced to the process of erosion. They use stream tables to demonstrate the relationship between moving water and erosion. The students
Three-D Visualization: Hands-on Bathymetry and Topography Activities
 Three-D Visualization: Hands-on Bathymetry and Topography Activities Sheryl Braile, Happy Hollow School West Lafayette, IN sjbraile@gmail.com Larry Braile, Purdue University West Lafayette, IN braile@purdue.edu,
Topographic Maps. More than a Road Map
 Topographic Maps More than a Road Map What is a Topographic Map? Scaled representation of features on the surface of the Earth such as roads, rivers, and plains Provides information about land elevations
PREPARE FOR THE ACTIVITY. Activity Sheet Chapter 6, Lesson 8 ph and Color Change
 Activity Sheet Chapter 6, Lesson 8 ph and Color Change Name Date DEMONSTRATION 1. Your teacher poured green universal indicator into each of two cups. What does the change in color of the indicator solution
EROSIONAL FEATURES. reflect
 reflect Have you ever looked at the land around you and wondered what processes shaped what you see? Perhaps you see mountains, valleys, rivers, or canyons. Do you know how long these geologic features
Lecture 9: Reference Maps & Aerial Photography
 Lecture 9: Reference Maps & Aerial Photography I. Overview of Reference and Topographic Maps There are two basic types of maps? Reference Maps - General purpose maps & Thematic Maps - maps made for a specific
8 th 12 th Designing a Monitoring Plan Mapping & Analysis (Activities 1 2)
") 8 th 12 th Designing a Monitoring Plan Mapping & Analysis (Activities 1 2) Objectives for All Activities - To be able to define and describe the purpose and uses of topographic maps. - To define rules
8 th 12 th Designing a Monitoring Plan Mapping & Analysis (Activities 1 2) Objectives for All Activities - To be able to define and describe the purpose and uses of topographic maps. - To define rules
Changes to Land 5.7B. landforms: features on the surface of Earth such as mountains, hills, dunes, oceans and rivers
 All the landforms on Earth have changed over time and continue to change. Many of the changes were caused by wind, moving water, and moving ice. Mountains have grown and shrunk. Rivers have cut away land
Using Map and Compass Together
 Using Map and Compass Together In situations where you foresee a potential evacuation on foot, where there are no roads, and no indication as to the direction of travel (i.e., road signs), it is recommended
Student Activity Sheet- Denali Topo Map
 Student Activity Sheet- Denali Topo Map Directions: Follow the steps in order and answer the associated questions as you proceed through the activity. The first part of the activity will be guided by your
Think about the landforms where you live. How do you think they have changed over time? How do you think they will change in the future?
 reflect All the landforms on Earth have changed over time and continue to change. Many of the changes were caused by wind, moving water, and moving ice. Mountains have grown and shrunk. Rivers have cut
Interpreting River Sediments
 Interpreting River Sediments Stream Movement & Mineral Deposits Adapted from: #435 Reading River Sediments, A Simulated Mining Activity for Molybdenum. Lab- Aids, Inc. 1996. Grade Level: Intermediate and
Flooding on the Somerset Levels. ArcGIS Online
 Flooding on the Somerset Levels ArcGIS Online Using this resource This resource has been written to help teachers make use of the ArcGIS Online program. It provides; guidance on how to use the program
Bellringer Notes 01/07/2016 to 02/25/2016
 Bellringer Notes 01/07/2016 to 02/25/2016 Bellringer 01/07/2016 Examine the following scene and identify who s statement best describes the forces on the canoe. 20 N Upstream 15 N Downstream Robert Forces
GET TO KNO W A NATIO NAL
 Your web browser (Safari 7) is out of date. For more security, comfort and the best experience on this site: Update your browser Ignore GET TO KNO W A NATIO NAL PARK W ITH FIEL DSCO PE Explore one of the
 Chapter 2 Mapping Our World Picture: Mount Capulin, Raton, NM Cinder Cone Volcano ://3.bp.blogspot.com/_sKz1KwXRzcg/SzFzM52gIoI/AAAAAAAAABk/hguBAT80pk0/s320/capulin.jpg http://www.peteandmelissa.com/images/oklahoma/p1020190.jpg
44H1749S SCIENCE ACTIVITY HEADS IN, HEARTS IN. Creating Landforms. Instructions for Set-Up. Activity Preparation
 HEADS IN, HEARTS IN Creating Landforms Instructions for Set-Up Supplies Guide for Families handout 15 clear plastic standup displays (optional) Landforms handouts 13 disposable cookie sheets, 9-inch by
Week: 4 5 Dates: 9/2 9/12 Unit: Plate Tectonics
 clementaged.weebly.com Name: ODD Period: Week: 4 5 Dates: 9/2 9/12 Unit: Plate Tectonics Monday Tuesday Wednesday Thursday Friday 1 No School 2 E 3 O *Vocabulary *Continental Drift Notes and Sea Floor
CLASSROOM KIT MAGNET EXPLORATION
 CLASSROOM KIT MAGNET EXPLORATION Page 1 1 Activity: What Do We Already Know? Teacher A simple, yet effective learning strategy, a K-W-L chart, is used to help Background: students clarify their ideas.
Thermal Convection of a Fluid
 C04 Thermal Convection of a Fluid http://web.ics.purdue.edu/~braile/edumod/convect/convect.htm Focus on Inquiry The students will calculate the velocity of convection currents using vegetable oil and thyme
Road Scholar. Williamette Valley Invitational Practice Tournament
 Road Scholar Williamette Valley Invitational Practice Tournament Rules for this Event As you complete this event, enter your answers on the online data sheet. You may click "submit" when done and quietly
World rivers investigation
 World rivers investigation Grades 3-5 This activity was designed as a companion for the music video What Does A River Want To Do?. Background What Does A River Want To Do? is a song about the countless
Lesson 2. Color change
 Lesson 2 Color change T E A C H E R G U I D E Lesson summary Students meet marine chemist Sera Tuikabe, who is studying ocean acidification in the water surrounding the Republic of the Fiji Islands. Students
Compass Basics. Quick Map Basics Review For Compass Use
 Compass Basics Quick Map Basics Review For Compass Use A topographic map tells you where things are and how to get to them, whether you're hiking, biking, hunting, fishing, or just interested in the world
Map Reading: Grades 4 & 5
 Map Reading: Grades 4 & 5 Grades: 4,5 Team Size: 1-2 competitors Duration: 25 minutes Supervisors: Sriram Garapati, Rebecca Neill-Totsuka Summary Description Students will solve a mystery using different
Erosional Features. What processes shaped this landscape?
 Have you ever looked at the land around you and wondered what processes shaped what you see? Perhaps you see mountains, valleys, rivers, or canyons. Do you know how long these geologic features have been
Get to Know Your Watershed
 engaging learners exploring watersheds connecting communities Get to Know Your Watershed QUESTION(S) What is a watershed? Where is my watershed? Author(s): Beth Bisson, Maine Sea Grant Program; Sandy Daniel,
Topo Map Tidbits. Adapted from: An original Creek Connections activity. Creek Connections, Box 10, Allegheny College, Meadville, Pennsylvania, 16335
 Topo Map Tidbits Adapted from: An original Creek Connections activity. Creek Connections, Box 10, Allegheny College, Meadville, Pennsylvania, 16335 Introduction to Topographic Maps Grade Level: Basic Duration:
OUR WONDROUS OCEANS PLANET WATER
 1 OCEAN LIFE CARDS 2 KNOW, NEED, LEARN Your teacher will instruct you in the use of this activity. 3 WATER S WAY INTRODUCTION Understanding the connection between precipitation on land and the water in
Living in a Watershed
 Living in a Watershed Department of Ecosystem Science and Ma... http://ecosystems.psu.edu/youth/sftrc/lesson-plans/water/k-5/watershed Department of Ecosystem Science and Management Youth Living in a Watershed
Earth and Space: Topographic Maps Satellite Images
 Earth and Space: Topographic Maps Satellite Images Earth and Space: Formative Assessment Activities for Earth and Space Topographic Maps Satellite Images Teacher Pages Purpose The purpose of this station
What is a map? Understanding your map needs
 What is a map? A map is simply a drawing or picture of a landscape or location. Maps usually show the landscape as it would be seen from above, looking directly down. As well as showing the landscape of
After you are finished, you can collect the salol, which should come off the plastic wrap easily. It can then be melted again and reused.
 IGNEOUS ROCK TEXTURES Teacher Information: Be sure to explain and use all standard laboratory safety practices and procedures. Be sure your students understand how to safely handle the chemicals and materials
Lab Activity on Sedimentary Processes
 Lab Activity on Sedimentary Processes 2002 Ann Bykerk-Kauffman, Dept. of Geological and Environmental Sciences, California State University, Chico * Objectives When you have completed this lab activity,
About places and/or important events Landmarks Maps How the land is, hills or flat or mountain range Connected to maps World Different countries
 What do you think you know about geography? About places and/or important events Landmarks Maps How the land is, hills or flat or mountain range Connected to maps World Different countries What do you
This Rocks! Author: Sara Kobilka Institute for Chemical Education and Nanoscale Science and Engineering Center University of Wisconsin-Madison
 This Rocks! Author: Sara Kobilka Institute for Chemical Education and Nanoscale Science and Engineering Center University of Wisconsin-Madison Purpose: To learn about the rock cycle and the role that weather
CLASSROOM SCIENCE ACTIVITIES
 CLASSROOM SCIENCE E ACTIVITIES ITIES Instructional note Analyze and interpret data from fossils to provide evidence of the organisms and the environments in which they lived long ago. (3-LS4-1) 3 From
1. Identify the Earth motion that provides the basis for our system of local time and time zones.
 Base your answers to questions 1 through 4 on the map below and on your knowledge of Earth science. The map shows the four time zones and some latitude and longitude lines across the continental United
Geology 101 Lab Worksheet: Topographic Maps
 Geology 101 Lab Worksheet: Topographic Maps Name: Refer to the Topographic Maps Lab for the information you need to complete this worksheet (http://commons.wvc.edu/rdawes/g101ocl/labs/topomapslab.html).
SIXTH GRADE WORKBOOK
 SIXTH GRADE WORKBOOK student Math/Science Nucleus 1990,2001 WATER CYCLE - WATER (6) Math/Science Nucleus 1990,2001 2 WATER CYCLE - WATER (6) LAB SAND CHART Sorting refers to particles that are the same
Federal Emergency Management Agency, Public Domain.
 Federal Emergency Management Agency, Public Domain. LIMITED LICENSE TO MODIFY. These PowerPoint slides may be modified only by teachers currently teaching the Science and Global Issues SEPUP course to
Stream Length. Adapted from: An original Creek Connections activity. Creek Connections, Box E, Allegheny College, Meadville, Pennsylvania, 16335
 Stream Length Adapted from: An original Creek Connections activity. Creek Connections, Box E, Allegheny College, Meadville, Pennsylvania, 16335 Stream Length Grade Level: Intermediate to Advanced Duration:
2nd Grade. Earth's Water. Slide 1 / 111 Slide 2 / 111. Slide 3 / 111. Slide 4 / 111. Slide 5 (Answer) / 111. Slide 5 / 111. Role of Water on Earth
 / 111. Slide 5 / 111. Role of Water on Earth") Slide 1 / 111 Slide 2 / 111 2nd Grade Role of Water on Earth 2015-11-20 www.njctl.org Slide 3 / 111 Slide 4 / 111 Table of Contents: The Role of Water on Earth Earth's Water The Use of Maps Click on the
Slide 1 / 111 Slide 2 / 111 2nd Grade Role of Water on Earth 2015-11-20 www.njctl.org Slide 3 / 111 Slide 4 / 111 Table of Contents: The Role of Water on Earth Earth's Water The Use of Maps Click on the
Ocean Acidification in a Cup Materials
 Ocean Acidification in a Cup Ocean acidification is a problem that humans will have to deal with as we release more and more carbon dioxide into the atmosphere. This activity demonstrates how water can
Moving and Shaking RM 1 RM 1 Operation: Earth s Structure
 Moving and Shaking RM 1 RM 1 Operation: Earth s Structure You are attending an international meeting of geologists. In order to properly understand the layers of the earth, you must create a folding model.
Elementary Social Studies Content Area Assessment Task. Winter 2010 EDUC 203
 1 Elementary Social Studies Content Area Assessment Task Winter 2010 EDUC 203 Students: Fourth grade class in Watsonville, CA. Approximately 90% Latino, primarily of Mexicandescent. About 80% participate
NAME DATE TOPOGRAPHIC MAPS. Activity 1: Topographic Map Investigation I: More Than a Road Map
 NAME DATE PARTNER(S) TOPOGRAPHIC MAPS Now you have seen how topographic maps can be generated to present the elevation of a terrain. Let s look at some topographic maps and learn how to interpret them.
BY SARAH J. FICK AND JONATHAN BAEK
 24 BY SARAH J. FICK AND JONATHAN BAEK CONTENT AREA Earth and space sciences GRADE LEVEL 6 8 BIG IDEA/UNIT Earth s systems. ESSENTIAL PRE-EXISTING KNOWLEDGE Basic water cycle processes and vocabulary Gravity
Name: Period: Air Masses Notes 7 Minutes Page 2 Watch the air masses video. Make sure you follow along.
 Air Masses and Fronts Activity Guide Component 8.3.3, 8.3.4, & 8.3.5 Guiding Questions (be able to answer these questions at the end of packet) 1. How are air masses formed? 2. What are the differences
Developed in Consultation with Florida Educators
 Developed in Consultation with Florida Educators Table of Contents Next Generation Sunshine State Standards Correlation Chart... 7 Benchmarks Chapter 1 The Practice of Science...................... 11
2011, 1998, 1987 Copyright by Remedia Publications, Inc. All Rights Reserved. Printed in the U.S.A.
 See the world REM 129A A Teaching Resource From 2011, 1998, 1987 Copyright by Remedia Publications, Inc. All Rights Reserved. Printed in the U.S.A. The purchase of this product entitles the individual
AT SEA: INVESTIGATING SOME OCEAN DYNAMICS
 NAME DATE PARTNER(S) AT SEA: INVESTIGATING SOME OCEAN DYNAMICS About three-quarters of the Earth s surface are covered by water in the form of oceans. These giant bodies of water have fascinated and intimidated
Chapter 6 Mapping and Online Tools
 Chapter 6 Mapping and Online Tools The stream site you monitor is just part of a much larger system. When analyzing stream health, it is important to take a holistic view by considering the entire watershed.
Watershed Delineation
 Watershed Delineation Adapted from: An original Creek Connections activity. Creek Connections, Box E, Allegheny College, Meadville, Pennsylvania, 16335 Watershed Delineation Grade Level: Intermediate to
Mapping the Moon Lesson 7: Making a Model
 PREVISIT ACTIVITY Space Explorers Trading Cards or Space Exploration Timeline Mapping the Moon Lesson 7: Making a Model 5E MODEL Elaborate GRADE LEVEL Middle School NSES STANDARDS (National Science Education
Chapter 6, Lesson 9: Neutralizing Acids and Bases
 Chapter 6, Lesson 9: Neutralizing Acids and Bases Key Concepts ph is a measure of the concentration of H 3 O + ions in a solution. Adding an acid increases the concentration of H 3 O + ions in the solution.
Module 7, Lesson 1 Water world
 Module 7, Lesson 1 Water world Imagine that the year is 2100. Scientists have determined that the rapidly warming climate of the earth will cause the ice sheets of Antarctica to break apart and melt at
GOING WITH THE FLOW (1 Hour)
") GOING WITH THE FLOW (1 Hour) Addresses NGSS Level of Difficulty: 3 Grade Range: 3-5 OVERVIEW In this activity, students use a stream table to model the processes of erosion and streambed formation. The
GOING WITH THE FLOW (1 Hour) Addresses NGSS Level of Difficulty: 3 Grade Range: 3-5 OVERVIEW In this activity, students use a stream table to model the processes of erosion and streambed formation. The
FOSSILS IN YOUR BACKYARD
 MOR BACKYARD 12 Activity Overview BIG IDEA OBJECTIVE BACKGROUND Millions of years ago, dinosaurs roamed all over our planet Why is it then that we only find dinosaurs in certain geographical locations?
Five Themes of Geography of Ecuador
 LESSON 1 Five Themes of Geography of Ecuador Lesson Objective The students will be able to: find the five themes of geography (location, movement, human/environment interaction, place, and region) of Ecuador
Soil and Erosion. Spring Lesson 5 - Grade 5. Lesson Description. Learning Objectives. Materials and Preparation
 Soil and Erosion Lesson Description In this lesson students learn about erosion. They learn about the four different kinds of erosion and do experiments that demonstrate each kind. They learn how erosion
Topographic Map Series:
 DEFINITION OF A MAP A MAP IS A GEOGRAPHIC PREPRESENTATION OF A PORTION OF THE EARTH S SURFACE DRAWN TO SCALE, AS SEEN FROM ABOVE. IT S USES COLORS, SYMBOLS AND LABELS TO REPRESENT FEATURES FOUND ON THE
Landform Project. Due Date: March 30, This is worth SS., Science, and LA grades!
 Landform Project Due Date: March 30, 2015. This is worth SS., Science, and LA grades! Create a map and a diorama in a pizza box to demonstrate landform meanings. Show and label landforms on both the map
LAB N - FLUVIAL PROCESSES AND LANDSCAPES
 LAB N - FLUVIAL PROCESSES AND LANDSCAPES Introduction The objective of this lab is to familiarize the student with the work of running water (streams and rivers) and the landforms that they create. Materials
Understanding elevation and derivative layers
 Understanding elevation and derivative layers ArcGIS makes it easy to work with elevation data by offering a dynamic world elevation service (TopoBathy) and a specific land elevation (Terrain). These services
Create A Watershed Profile
 Name Date Follow the steps below with Chesapeake Bay FieldScope to create a watershed profile for your location. Part 1. Take a trip down your tributaries. Create A Watershed Profile 1. Find your field
Lesson Title: Then and Now: How Society Alters Topography and Vegetation
 Lesson Title: Then and Now: How Society Alters Topography and Vegetation Lesson Author: Rodney Collins (rwcollins@lf.k12.de.us) Lesson Description: This lesson is a comparative study in which students
From the Coastal Zone to the Piedmont on the Underground Railroad
 From the Coastal Zone to the Piedmont on the Underground Railroad Chyrl Curtis Kingsbury Elementary Sumter, SC curtisc@sumter17.k12.sc.us Overview This lesson is a part of a larger unit on the Underground
Investigation 5: What happens when plates move sideways past each other?
 Tectonics Investigation 5: Teacher Guide Investigation 5: What happens when plates move sideways past each other? Plates move sideways past each other at transform boundaries. At these boundaries, the
STAAR Science Tutorial 40 TEK 8.9C: Topographic Maps & Erosional Landforms
 Name: Teacher: Pd. Date: STAAR Science Tutorial 40 TEK 8.9C: Topographic Maps & Erosional Landforms TEK 8.9C: Interpret topographic maps and satellite views to identify land and erosional features and
Decoding Topographic Maps
 Name: Date: 1. Base your answer(s) to the following question(s) on the topographic map below and on your knowledge of Earth science. Letters A through F represent locations on the map. What is the contour
United States of America Geography
 United States of America Geography Part I by Sonja E. Schild LearnSmart Publishing Co. Vancouver, BC, Canada Phone: (604) 433-1347 ISBN 0-9694445-3-9 Notice! All rights reserved. Permission to reproduce
Taft Stormwater Quest
 Taft Stormwater Quest Oregon Coast Quests is an Oregon Sea Grant program based at Oregon State University's Hatfield Marine Science Center. The Oregon Coast Book, 2017 18 Edition 43 Use this map to help
11. ALPINE GLACIAL LANDFORMS
 Geomorphology 11. Alpine Glacial Landforms 11. ALPINE GLACIAL LANDFORMS 40 Points One objective of this exercise is for you be able to identify alpine glacial landforms and measure their characteristics.
Problem How can I determine if different propellants will make a rocket travel faster?
 National Aeronautics and Space Administration SPEED IT UP Student Section Student Name Lesson Objective In this lesson, you will simulate how different propellant systems affect the velocity, or speed
Map Reading: Grades 2 & 3
 Map Reading: Grades 2 & 3 Grades: 2, 3 Team Size: 1-2 competitors Duration: 25 minutes (5 minute introduction, 20 minutes for questions) Supervisors: Rebecca Neill-Totsuka, Sriram Garapati Summary Description
Many Ways to Name a Place
 Your web browser (Safari 7) is out of date. For more security, comfort and Activityapply the best experience on this site: Update your browser Ignore Many Ways to Name a Place What are the names for the
Finding Fault with Food or Modeling Plate Movement
 Finding Fault with Food or Modeling Plate Movement Objective: Use models to describe how tectonic plates cause major geological events such as; ocean basins, earthquakes, volcanoes, and mountain building.
Benioff Box. Original Source: Dr. Leslie Sautter, Department of Geology, College of Charleston
 Original Source: Dr. Leslie Sautter, Department of Geology, College of Charleston Grade Level: SC Standards: National Standards: 8 th Grade 8 th IIIB3c,g,j Earth and Space Science - Content Standard D
Ice Sheets and Sea Level -- Concerns at the Coast (Teachers Guide)
") Ice Sheets and Sea Level -- Concerns at the Coast (Teachers Guide) Roughly 153 million Americans (~53% of the US population) live in coastal counties. World wide some 3 billion people live within 200 km
Ice Sheets and Sea Level -- Concerns at the Coast (Teachers Guide) Roughly 153 million Americans (~53% of the US population) live in coastal counties. World wide some 3 billion people live within 200 km
Module/Unit: Landforms Grade Level: Fifth
 Module/Unit: Landforms Grade Level: Fifth PA Academic Standards for Science and Technology and Environment and Ecology: 3.1.7.B Describe the use of models as an application or scientific or technological
Map Reading & Compass Use
 Spring 2013 Kestrel Land Trust Page 2 / 10 Contents Map Basics... 3 Map Types... 3 Terrain Association... 4 Estimating Distance: Pacing... 4 Contour Lines... 5 Navigating with a Compass... 6 Compass Types...
Vermont Stream Geomorphic Assessment. Appendix E. River Corridor Delineation Process. VT Agency of Natural Resources. April, E0 - April, 2004
 Vermont Stream Geomorphic Assessment Appendix E River Corridor Delineation Process Vermont Agency of Natural Resources - E0 - River Corridor Delineation Process Purpose A stream and river corridor delineation
The Magic School Bus on the Ocean Floor
 A Guide for Using The Magic School Bus on the Ocean Floor in the Classroom Based on the book written by Joanna Cole This guide written by Ruth M. Young, M.S. Ed. Teacher Created Resources, Inc. 6421 Industry
Dynamic Planet. Student Name. Teacher
 Dynamic Planet Student Name Teacher The Dynamic Planet 1. What makes our planet dynamic? 2. Draw the Earth and its systems: 3. What makes up the four systems of our Earth? Geosphere: Hydrosphere: Atmosphere:
Name: Mid-Year Review #2 SAR
 Name: Mid-Year Review #2 SAR Base your answers to questions 1 through 3 on on the diagram below, which shows laboratory materials used for an investigation of the effects of sediment size on permeability,
Chapter 6, Lesson 10: Carbon Dioxide Can Make a Solution Acidic
 Chapter 6, Lesson 10: Carbon Dioxide Can Make a Solution Acidic Key Concepts Carbon dioxide (CO 2 ) gas dissolved in water can cause water to become acidic. The acidity of water from dissolved CO 2 can
Contour Line Overlays in Google Earth
 Overview: Students download a section of a topographic map of their community from the ATEP website. This file will overlay the Google Earth satellite imagery. Students use the path tool to trace a contour
Basic Map Skills for the Outdoors
 Geography 80-20 80% of what there is to know, for 20% of the sweat Basic Map Skills for the Outdoors Map Scale Map source: US Geological Survey Four ways to indicate map scale: Representative fraction
Snack Tectonics or Modeling Plate Movement
 Snack Tectonics or Modeling Plate Movement Objective: Use models to describe how tectonic plates cause major geological events such as; ocean basins, earthquakes, volcanoes, and mountain building. Questions: