Introducing AOPA FlyQ EFB
|
|
|
- Cody Sutton
- 6 years ago
- Views:
Transcription


1 Hi, just a reminder that you're receiving this because you activated AOPA FlyQ EFB. Don't forget to add FlyQEFBSupport@seattleavionics.com to your address book so we'll be sure to land in your inbox! You may unsubscribe if you no longer wish to receive our s. Introducing AOPA FlyQ EFB Dear AOPA FlyQ EFB User, Thank you for downloading new AOPA FlyQ EFB! We're sending you this quick to help you get started using FlyQ EFB. We hope you find it useful and we very much welcome your feedback as we strive to continually improve the product. There is a lot of information in this , We encourage you to refer back to it often as you are getting familiar with FlyQ EFB. If you have questions or comments on FlyQ EFB, please contact us at FlyQ EFB Support. FlyQ EFB works with the ipad 2 or better and the new ipad mini. It does not work on the original ipad 1. Once you've had a chance to get to know FlyQ EFB and decide you're ready to extend your subscription for a full 12 months, visit for details on special AOPA member-only pricing. Top Buttons The buttons at the top of FlyQ EFB remain constant to give quick access to commonly-used functions at all times.

2 Single Screen and Split Screen Some people prefer the simplicity of a single large view on the ipad. FlyQ EFB begins like this with a series of tabs at the bottom of the screen. The tabs show the major functional areas of the app: Airports, Weather, Plans, Maps, and Procedures. Tap any tab to see the type of info you want. In this way, you can see detailed info about an airport, a 2D or 3D map, an approach procedure or airport diagram, or detailed weather -- all in a large, easy to read view.

3 Other people prefer to see more at the same time so FlyQ EFB offers a simple Split button. A tap to the button in the upper left corner of the screen switch from single screen to split screen and back again. In split screen view, you can see a map and airport info, a map and an approach procedure, 2 maps (perhaps different scales or one IFR and one VFR), and much more.

4 The Map FlyQ EFB has an incredible mapping system that works in both 2D and 3D Synthetic Vision mode. In addition to the map itself, there are three areas of the screen with tools or information: Map Bar, Status Window, Gauge Bar. Each of these areas can be "flicked" off the screen or "pulled" back by grabbing the small tab above or below the area.

5 The Map Bar In the upper left corner of every map is series of 4 buttons. These control key mapping features. From left to right, they are: Layers, GPS Lock, Track

6 Up, and 3D. Layers FlyQ EFB lets you mix and match any base map (Sectional, IFR Low, or IFR High) with anything else. Simply tap the base layer you want then tap as many or as few weather or other layers as you like. In this way, you can see NexRad radar and satellite at the same time or see easy-to-read winds aloft arrows and METAR/TAF circles at the same time.
7 Notes: The Winds Aloft arrows point in the direction that the wind is going not in the direction it comes from. The number at the end is the expected winds aloft speed, in Kts, at your current GPS altitude. Thus, this number generally changes as you climb. Tap the large Weather tab at the bottom of the screen to see winds at other altitudes. The METAR/TAF circles use 3 colors to depict the actual or expected weather conditions: green is VFR, yellow is MVFR, and red is IFR, LIFR, or VLIFR. The colors are determined by either METARs or TAFs, depending on the time. If the airport has a METAR report that is still valid (they last one hour), the color is based on a METAR. If you're outside the time range of METARs, FlyQ EFB automatically switches to using TAFs.
8 GPS Lock Normally FlyQ EFB uses your GPS to keep the map centered on your current location. However, if you use your finger to pan (move) the map, tap this button to re-center on the GPS. If GPS Lock is already on (magenta), tap it again to zoom in. The only way to turn GPS Lock off is to move the map. Track Up We've been amazed that virtually all aviation apps only show maps in North Up orientation. FlyQ EFB fixes that by adding an easy toggle to switch from Track Up (magenta and the default) to North Up. Note: Track Up is meaningless unless you're moving (that is, have a track) so this button has no effect if you're using the ipad at your desk. Also, when you turn Track Up on, the system also engages the GPS Lock button. 2D / 3D FlyQ EFB was designed from the ground-up to use one very powerful mapping system that works in either standard 2D or true 3D Synthetic Vision mode. There is no additional subscription required to get this feature and switching from 2D to 3D is as easy as tapping the button that looks like a 3-dimensional cube.

9 Notes: 1. In 2D mode, FlyQ automatically downloads data from the Internet so you don't have to pre-load data (of course, you should before you fly -- see the Downloading Data section below). However, for technical reasons, 3D synthetic vision requires data to be pre-downloaded. Thus, if you switch to 3D mode before downloading data, you'll see a warning that you need to use the Data Manager. If you don't, all you'll see is a blue screen. 2. In 3D mode, you can't overlay all the same layers you can in 2D but we invite you to overlay Sectionals or IFR charts over the raw terrain for a much more realistic and useful display. Simply tap the Layers button and select Sectional, IFR Low, or IFR High rather than the default Terrain. Status Window The upper right area of the screen shows critical data accuracy and aging information. Tip: Remember that you can flick this window on or off the screen. When flicked off, grab the "handle" to pull it back down.

10 GPS ipads have been known to lose the GPS lock in flight. At a glance, this area gives you a quick indication of whether or not the GPS is engaged (or, as above, if the GPS simulator is on). Tap the blue arrow for additional detail in terms of horizontal and vertical accuracy. Wx Weather information is critical when flying but you need to know how old the weather data is to make decisions. This display immediately shows how old the METAR/TAF information is. Weather is downloaded from the Internet every 15 minutes and cached on the ipad for use during flight. Tap the blue arrow to see the age of the NexRad, the Satellite, etc. Simulator Perhaps the best way to learn about a product before you fly with it is to use the powerful built-in GPS simulator.
 or")
11 Load or create a flight plan then switch to the Map tab. Look at the Status Window at the upper right of the screen. The last item is the Simulator. Turn it on and watch the flight begin. Tap the blue arrow button on the right to see additional options such as a way to speed up the flight or jump immediately to any point in the flight by either time (the Position on Route slider) or by selecting a specific waypoint (the Jump to Waypoint button). Gauge Bar The bottom of the screen has a wealth of pilot-configurable gauges (speed, altitude, next waypoint, timers, etc.). FlyQ EFB has more gauges than can fit on the screen so tap a gauge to see a list of the other possible gauges that
12 can go in that position. If you select a Timer or Stopwatch gauge, press and hold the gauge to set the timer. And remember that you can flick the gauge bar on or off the screen as you like. Getting Info Flying requires fast and easy access to data and FlyQ EFB has you covered. Nearby Airports Let's say you're flying and have an emergency or you simply like the security of always knowing what the nearby airports are. Easy. Just tap the Airports tab and FlyQ EFB instantly uses the GPS to show nearby airports. Normally these airports are sorted by distance but you can tap the Sort button to sort by weather conditions, longest runway, or even by which airports have fuel. This list is not static; rather, it updates automatically every 15 seconds so it's a great safety aid to keep this screen up all the time. And it's much more than a simple list of airport names. For each entry, you'll see current weather conditions, distance and bearing to the airport, key operational info such as elevation, TPA, frequencies, and more. Of course, tap any entry for even more info.

13 Airports On Your Flight Plan As you approach your landing, you may want to look up information on your destination. Tap the Plans tab, tap your landing airport in the NavLog and


14 there it is. Any Airport, Navaid, or Fix There is a large search field at the top of the screen. Enter any ident, airport name, or city and FlyQ EFB immediately shows you the matches. Double-Tap the Map for Airports, Navaids, Fixes and TFRs Humans are visual creatures and typing on an ipad, especially while flying, isn't always the easiest thing to do. Once again, FlyQ EFB has you covered with a simple system for getting info about airports, navaids, and fixes on the map: Double-tap the map and FlyQ EFB pops-up matches in the area you tapped. This list has tabs at the bottom. By default, the list just shows airports and navaids but you can also select the Fixes tab or even TFRs. By the way, some people have asked why double-tap not single-tap like some other apps. We did this intentionally because it's simply too easy to tap the screen accidentally, especially in rough weather.

15 Flight Planning Your Way AOPA EFB FlyQ makes it very easy to create an ideal, wind-optimized flight plan any way you prefer. Plans can be created whether you're connected to the Internet or not but some advanced features are only available when online. Flight Plans created when you're online are automatically available from any device running a FlyQ application such as FlyQ Pocket for the iphone, FlyQ Pocket for Android, or, soon, FlyQ Flight Planner from your desktop PC or Mac. Use the Search Box at the Top of the Screen

16 Enter a series of idents into the top Search field such as FDK MIA for a direct plan from Fredrick, MD to Miami, FL. Tip: When you're online, use this same method to create a plan via Victor airways by adding adding the letter V to the end (e.g. FDK MIA V), via Jet airways by appending a J, via GPS-Direct that avoids terrain using G, or just by wind-optimizing by using the letter W. Use the Map Use the map to plan visually. Double-tap the map to visually add points. Press and hold to move an existing point or insert one between two existing points ("Rubber-banding").
17 Use the New Plan Window Select the Plans tab then use the New Flight Plan area to enter as much or as little info as you like and have FlyQ EFB plan the flight for you. This method has the most options including selecting the routing method, VFR or IFR, whether or not to optimize for best winds, etc. Tap the More button for even more options such as selecting which aircraft to fly, min and max altitude ranges, takeoff fuel, and more.

18 Weather Weather is crucial to flying and FlyQ EFB has a wealth of weather

19 information that make flying easier and safer. Weather can be accessed in a number of ways: On the Map FlyQ EFB can display any combination of NexRad, Satellite, METAR/TAF, and Winds Aloft over any 2D map. Tap the Layers button then select as many or as few weather layers as you like. For an Airport When an airport is selected, switch from the default General subtab to the Weather subtab. If you're connected to the Internet, you'll see animated local, regional, and national radar images around the airport. You'll also see the METAR and TAF from the nearest airport (not necessarily that airport if

20 it doesn't have these weather reports), a Winds Aloft table, and even a DUAT briefing. The top even shows the current temperature and, with a tap, an easy-to-read 7 day forecast.
21 Tip: Tap the METAR or TAF to see it much larger. This is especially handy in-flight or anytime for those of us who aren't 25 anymore. Weather Around Your Current Position Tap the large Weather tab at the bottom of the screen to see essentially the same information as described above for your current GPS location. Graphical Wind Optimizer Tap the large Weather tab at the bottom of the screen then select the Winds subtab. This is a very cool (and patent-pending!) feature. At a glance it answers the age-old in-flight question of whether to fly higher or lower. The Graphical Wind Optimizer shows what the winds are like relative to your current track (the aircraft image with the wind arrow through it) and what kind of headwind or tailwind to expect, given your current course, at different altitudes. In the graph below, the various headwind (red) and tailwind (green) components in knots are show for every altitude from 0 to 16,000 ft (altitudes in the table have the 000's place removed for brevity). Thus, flying at 16 (16,000 ft) would provide a 16 kts tailwind while flying at 6,000 ft is expected to produce a 3 kts headwind. Similarly, the representation of an aircraft with an arrow means a 6 kts wind that is almost a perfect a tailwind at the current altitude. The current altitude is shown both on the gauge below the map (11000) and as the light gray bar on the graph.

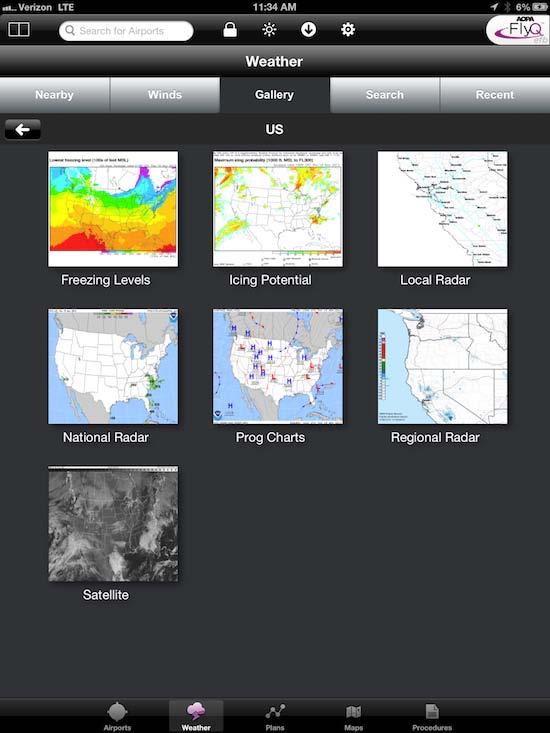
22 Weather Gallery FlyQ EFB gives quick and easy access to hundreds of US and Canadian weather graphics. Tap the main Weather tab then choose the Gallery tab.
23 Downloading Data
24 Downloading data every month isn't the most exciting part of flying but FlyQ makes it painless: simply spin and zoom a 3D globe to visually select the states you're interested in and FlyQ does the rest. FlyQ downloads incredibly fast because it downloads just the new information each month, not all data. As most aviation data remains the same every month, this feature alone can save you hours (the first download takes longer because FlyQ will download terrain data).

25 More Questions? Read the FlyQ EFB FAQ.

26 Support. Sincerely, The AOPA FlyQ EFB Team Forward This was sent to by Update Profile/ Address Instant removal with SafeUnsubscribe Privacy Policy. Seattle Avionics st Place NE Second Floor Woodinville WA 98072
Section 7: Hazard Avoidance
 7.1 In-Flight Hazard Awareness Section 7: Hazard Avoidance As technology improves, pilots have more and more real-time information within reach in all phases of flight. Terrain proximity, real-time weather
Assignment #0 Using Stellarium
 Name: Class: Date: Assignment #0 Using Stellarium The purpose of this exercise is to familiarize yourself with the Stellarium program and its many capabilities and features. Stellarium is a visually beautiful
Weather Legends in FOREFLIGHT MOBILE
 Weather Legends in FOREFLIGHT MOBILE 14th Edition Covers ForeFlight Mobile v9.4 on ipad Radar Legends (when from Internet) Snowy/Icy Precipitation Mixed Precipitation Rain Echo top (in 100 s of feet) ex:
08-Nov METARs and TAFs are shown in coded and decoded text format under the Airfield information where weather data is available.
 EasyWeather provides a direct weather interface from SA Weather Services to EasyPlan as overlays on your EasyPlan map. This service is available in South Africa only, at this stage. By using your internet
B KMD 550/850 Multi-Function Display Quick Reference For Software Version 01/14 or Later
 F N B KMD 550/850 Multi-Function Display Quick Reference For Software Version 01/14 or Later 12 1 11 2 3 4 10 13 9 6 5 7 1. Brightness Control 2. Data Card 3. Display 4. Available Functions Legend 5. On/Off
KMD 550/850 Multi-Function Display Quick Reference For Software Version 01/11 or Later
 F B KMD 550/850 Multi-Function Display Quick Reference For Software Version 01/11 or Later 12 1 11 N 2 3 4 10 13 9 6 5 7 1. Brightness Control 2. Data Card 3. Display 4. Available Functions Legend 5. On/Off
Multi-Function Display Pilot s Guide Addendum
 Multi-Function Display Pilot s Guide Addendum Software Release 8.1 600-00248-000 Rev: 01 600-00248-000 Rev: 01-1- Entegra EX5000 Document Revision History Date Revision Description Nov. 13, 2009 00 Initial
Guide to Hydrologic Information on the Web
 NOAA s National Weather Service Guide to Hydrologic Information on the Web Colorado River at Lees Ferry Photo: courtesy Tim Helble Your gateway to web resources provided through NOAA s Advanced Hydrologic
M E R C E R W I N WA L K T H R O U G H
 H E A L T H W E A L T H C A R E E R WA L K T H R O U G H C L I E N T S O L U T I O N S T E A M T A B L E O F C O N T E N T 1. Login to the Tool 2 2. Published reports... 7 3. Select Results Criteria...
Astronomy 101 Lab: Stellarium Tutorial
 Name: Astronomy 101 Lab: Stellarium Tutorial Please install the Stellarium software on your computer using the instructions in the procedure. If you own a laptop, please bring it to class. You will submit
TECDIS and TELchart ECS Weather Overlay Guide
 1 of 24 TECDIS and TELchart ECS provides a very advanced weather overlay feature, using top quality commercial maritime weather forecast data available as a subscription service from Jeppesen Marine. The
ForeFlight Mobile Legends
 ForeFlight Mobile Legends ForeFlight, LLC 11th Edition - Covers ForeFlight Mobile v8.1 and later RADAR LEGENDS (WHEN FROM INTERNET) Snowy/Icy Precipitation Mixed Precipitation Rain Echo top (in 100 s of
Simulating Future Climate Change Using A Global Climate Model
 Simulating Future Climate Change Using A Global Climate Model Introduction: (EzGCM: Web-based Version) The objective of this abridged EzGCM exercise is for you to become familiar with the steps involved
Friends & Partners in Aviation Weather: Part 135
 Friends & Partners in Aviation Weather: Part 135 Thursday, October 12, 2017 Jason E. Herman, CAM Chairman, NBAA Part 135 Subcommittee Part 135 On-Demand Operations A mix of many different operational environments
Multi-Function Display Pilot s Guide Addendum
 Multi-Function Display Pilot s Guide Addendum Software Release 4.2 or Later 600-00344-000 Rev: 01-1- EX500/EX600 Document Revision History Date Revision Description February 21, 2018 00 Initial Release
Weather Legends in FOREFLIGHT MOBILE
 Weather Legends in FOREFLIGHT MOBILE 15th Edition Covers ForeFlight Mobile v9.6 on ipad Radar Legends (when from Internet) Snowy/Icy Precipitation Mixed Precipitation Rain Echo top (in 100 s of feet) ex:
Lightcloud Application
 Controlling Your Lightcloud System Lightcloud Application Lightcloud Application Navigating the Application Devices Device Settings Organize Control Energy Scenes Schedules Demand Response Power Up State
Comparing whole genomes
 BioNumerics Tutorial: Comparing whole genomes 1 Aim The Chromosome Comparison window in BioNumerics has been designed for large-scale comparison of sequences of unlimited length. In this tutorial you will
Quick Reference Manual. Ver. 1.3
 Quick Reference Manual Ver. 1.3 1 EXASITE Voyage EXSITE Voyage is a web-based communication tool designed to support the following users; Ship operators who utilize Optimum Ship Routing (OSR) service in
Aviation Maps: Aviation Maps: Chapter Ten. Chapter Ten. The Art of the Chart. The Art of the Chart. Page J1. The Lambert Conformal Conic Projection
 Page J1 Chapter Ten Chapter Ten viation Maps: viation Maps: The rt of the Chart The rt of the Chart The Lambert Conformal Conic Projection 1. [J2/Figure 1] When drawing lines on a Lambert Conformal Conic
2 November WSI Hubcast VERSION 3.5 USER GUIDE
 2 November 2016 WSI Hubcast VERSION 3.5 USER GUIDE THE WEATHER COMPANY WSI Hubcast 2 COPYRIGHT All Rights Reserved; Confidential Material. The Weather Company 400 Minuteman Road Andover, MA 01810 EXAMPLES
Nobeltec TimeZero V2.0.2
 Nobeltec TimeZero V2.0.2 New Features: Windows 8 Compatibility Nobeltec TimeZero v2 is now compatible with Windows 8 for Intel Compatible PC and will work as a Windows desktop app. IMPORTANT NOTICE: Nobeltec
DESIGNED FOR EASY INTEGRATION HOW TO GET STARTED. Global Data Products
 DESIGNED FOR EASY INTEGRATION The easy-to-implement Baron Weather API allows precision aviation weather information to be added to any of your websites, apps or software. Backed by extensive documentation
Technical Description for Aventus NowCast & AIR Service Line
 Technical Description for Aventus NowCast & AIR Service Line This document has been assembled as a question and answer sheet for the technical aspects of the Aventus NowCast Service. It is designed to
EOS 102: Dynamic Oceans Exercise 1: Navigating Planet Earth
 EOS 102: Dynamic Oceans Exercise 1: Navigating Planet Earth YOU MUST READ THROUGH THIS CAREFULLY! This exercise is designed to familiarize yourself with Google Earth and some of its basic functions while
How to Make or Plot a Graph or Chart in Excel
 This is a complete video tutorial on How to Make or Plot a Graph or Chart in Excel. To make complex chart like Gantt Chart, you have know the basic principles of making a chart. Though I have used Excel
WEATHER SOURCES FSS WXBRIEF
 FSS 1-800-WXBRIEF WEATHER SOURCES ASOS / METARS KSNT, KMYL, KLLJ, KSMN AOPA/NOAA Satellite, Radar, Surface, Winds, etc. NIFC TFR s Noaa Automated Surface:METAR/ RAWS (Remote Automated WX Station) BLM/USFS
Using the FCMQ`s snowmobile trail interactive map
 Using the FCMQ`s snowmobile trail interactive map Recommended browsers: Google Chrome, Mozilla Firefox or Internet Explorer 10 or newer. The interactive map is compatible with any type of mobile device
SoilMapp for ipad is a free app that provides soil information at any location in Australia. You can use SoilMapp to:
 About SoilMapp What is SoilMapp? SoilMapp for ipad is a free app that provides soil information at any location in Australia. You can use SoilMapp to: learn about the soil on your property view maps, photographs,
Survey EFB Weather Applications CAT FW
 Survey Summary The Use of Electronic Flight Bags (EFB) and Installed Weather Applications to Facilitate inflight Weather Updates to the Cockpit 14 May 2018 EXECUTIVE SUMMARY The European Aviation Safety
BOUNDARY MAP USER GUIDE
 BOUNDARY MAP USER GUIDE Get Exploring. Boundaries. The Northern Ontario Boundary Map provides users with the ability to explore the many community, administrative and service provider boundaries in the
Electric Fields and Equipotentials
 OBJECTIVE Electric Fields and Equipotentials To study and describe the two-dimensional electric field. To map the location of the equipotential surfaces around charged electrodes. To study the relationship
CALIOPE EU: Air Quality
 CALIOPE EU: Air Quality CALIOPE EU air quality forecast application User Guide caliope@bsc.es Version 30/09/2015 TABLE OF CONTENTS 1. Description... 1 2. Installation... 1 3. User Guide... 2 3.1 Air quality
Appendix 4 Weather. Weather Providers
 Appendix 4 Weather Using weather data in your automation solution can have many benefits. Without weather data, your home automation happens regardless of environmental conditions. Some things you can
Traffic and Weather. Soaring Safety Foundation. Tom Johnson CFIG
 Traffic and Weather Soaring Safety Foundation Tom Johnson CFIG Weather Contents Weather Gathering Sources Weather Acquisition Enroute Weather Analysis Weather Hazards Weather in the Landing Pattern Basic
Gleim Private Pilot FAA Knowledge Test 2015 Edition, 1st Printing Updates July 2015
 Page 1 of 6 Gleim Private Pilot FAA Knowledge Test 2015 Edition, 1st Printing Updates July 2015 NOTE: Deleted text is displayed with a line through it. New text is shown with a blue background. If you
Overlaying GRIB data over NOAA APT weather satellite images using OpenCPN
 Overlaying GRIB data over NOAA APT weather satellite images using OpenCPN I receive NOAA weather satellite images which are quite useful when used alone but with GRIB wind and rain data overlaid they can
Aviation Weather Routing Tool: A Decision Aid for Manned/Unmanned Aircraft Routing
 Aviation Weather Routing Tool: A Decision Aid for Manned/Unmanned Aircraft Routing Dr. Richard Shirkey Mr. Terry Jameson Battlefield Environment Division Army Research Laboratory, WSMR rshirkeyn@arl.army.mil
THE ULTIMATE BALLISTICS CALCULATOR USER INFO
 THE ULTIMATE BALLISTICS CALCULATOR 1 USER INFO LAPUA BALLISTICS The ultimate 6DOF ballistics tool for mobile devices CONTENTS Lapua Ballistics is the first mobile ballistics app utilizing the 6DOF calculation
Abbildung 7.1: Info-Screen with status indicators and UTC time
 Tra c Display 7 No tra c received If there is no tra c in range / received, Butter y Displays show a special information screen with an UTC Clock and information about GPS and FLARM system status of the
GPS Worldwide Laboratory: a community of knowledge-seekers spanning the globe
 Laboratory B: (predicting and verifying satellite visibility) Lab Date: 1 November 2014 1 day depending on your time zone). YOU MUST DO THIS PARTICULAR LAB ON THE SPECIFIED DAY. Lab Goals: Predict when
Visual Tutorial. Pitot Static System Simulator. Adobe (formerly Macromedia) Flash Requirements
 Flash Requirements") Visual Tutorial Tutorial Version 1.01 Pitot Static System Simulator Adobe (formerly Macromedia) Flash Requirements Thank you for using the Pitot Static System Simulator from luizmonteiro.com. Please note
Visual Tutorial Tutorial Version 1.01 Pitot Static System Simulator Adobe (formerly Macromedia) Flash Requirements Thank you for using the Pitot Static System Simulator from luizmonteiro.com. Please note
TEACHER NOTES MATH NSPIRED
 Math Objectives Students will solve linear equations in one variable graphically and algebraically. Students will explore what it means for an equation to be balanced both graphically and algebraically.
ADL110B ADL120 ADL130 ADL140 How to use radar and strike images. Version
 ADL110B ADL120 ADL130 ADL140 How to use radar and strike images Version 1.00 22.08.2016 How to use radar and strike images 1 / 12 Revision 1.00-22.08.2016 WARNING: Like any information of the ADL in flight
Lesson Plan 2 - Middle and High School Land Use and Land Cover Introduction. Understanding Land Use and Land Cover using Google Earth
 Understanding Land Use and Land Cover using Google Earth Image an image is a representation of reality. It can be a sketch, a painting, a photograph, or some other graphic representation such as satellite
Chem 1 Kinetics. Objectives. Concepts
 Chem 1 Kinetics Objectives 1. Learn some basic ideas in chemical kinetics. 2. Understand how the computer visualizations can be used to benefit the learning process. 3. Understand how the computer models
Metar And Taf Decoding
 Metar And Taf Decoding 1 / 6 2 / 6 3 / 6 Metar And Taf Decoding examples: kmem 230853z auto 18014g18kt 10sm clr 16/m02 a3008 rmk ao2 slp117 t01561022 tsno $ klax 161550z cor 11004kt 2 1/2sm hz bkn011 bkn015
USE ALTIMETER SETTING
 USE ALTIMETER SETTING 1. Introduction One of the main instruments of the aircraft is the altimeter. The altimeter must be tuned to the right pressure in order to have the right value displayed and to be
LANDMARK TM. Class B TAWS
 LANDMARK TM Class B TAWS WAAS-GPS Accurate - 320 Mile Range - Easily Integrated Introducing the LandMark Model 8100 LandMark is the first stand-alone Class B TAWS to offer an optional WAAS-GPS sensor.
Pilot Report: flying with the Garmin GDL 39 ADS-B receiver
 Tips and tricks News Apps Accessories Top 12 ipad Tips ipad FAQs Webinars Email Signup Shop Home / Accessories / Pilot Report: flying with the Garmin GDL 39 ADS-B receiver 14 August 2012 Accessories 26
WAFS_Word. 2. Menu. 2.1 Untitled Slide
 WAFS_Word 2. Menu 2.1 Untitled Slide Published by Articulate Storyline 1. Introduction 1.1 Introduction Notes: As you will probably be aware, the traditional significant weather forecasts, usually seen
WSI InFlight for the Pocket PC User Guide
 WSI InFlight for the Pocket PC User Guide Software Version: 3.0, Release 1.0 Documentation Release: 3.1 Print Date: March 2004 Document: 970-INFLI-PPC-31 Part Number: 305424-02-IR For handhelds and other
GMX 200 TM. Pilot s Guide Addendum for WSI Weather
 GMX 200 TM Pilot s Guide Addendum for WSI Weather 2006-2007 Garmin Ltd. or its subsidiaries Garmin International, Inc. Garmin AT 1200 East 151 st Street, Olathe, Kansas 66062, U.S.A. 2345 Turner Rd., SE
Technical Description for Aventus NowCast & AIR Service Line
 Technical Description for Aventus NowCast & AIR Service Line This document has been assembled as a question and answer sheet for the technical aspects of the Aventus NowCast Service. It is designed to
B KMD 550/850 Multi-Function Display Quick Reference For Software Version 01/14 or Later
 F N B KMD 550/850 Multi-Function Display Quick Reference For Software Version 01/14 or Later 12 1 11 2 3 4 10 13 9 6 5 7 1. Brightness Control 2. Data Card 3. Display 4. Available Functions Legend 5. On/Off
Overview of Left Menu Items on the New OK-FIRE
 Overview of Left Menu Items on the New OK-FIRE In contrast to the current OK-FIRE (http://okfire.mesonet.org), in the new OK-FIRE there are only LEFT menu items (located within the orange rectangle added
Mil-Dot Rangefinder For iphone Version 4.4 User Manual
 Mil-Dot Rangefinder For iphone Version 4.4 User Manual Copyright 2011 Tom Holsten Introduction! 4 What is a mil-dot reticle?! 4 What is a milliradian?! 4 The basics of range estimation with a mil-dot scope!
NOTE. WeatherPRO, and WSI. Weather When It Really Matters. are service marks of WSI.
 NOTE This equipment has been tested and found to comply with the limits for a Class A digital service pursuant to part 15 of the FCC Rules. These limits are designed to provide reasonable protection against
GPS Mapping with Esri s Collector App. What We ll Cover
 GPS Mapping with Esri s Collector App Part 1: Overview What We ll Cover Part 1: Overview and requirements Part 2: Preparing the data in ArcGIS for Desktop Part 3: Build a web map in ArcGIS Online Part
Basic Instruments 2 - Altimeters Nigel Page -
 Basic Instruments 2 - Altimeters Nigel Page - www.50k-or-bust.com Measurement of altitude in aviation is based almost entirely on air pressure. We know that air pressure decreases as we ascend. Although
Opening. Monster Guard. Grades 1-3. Teacher s Guide
 Teacher s Guide PLEASE NOTE: Students must complete the Initiation section of the Monster Guard app before they begin this activity, in order to gain access to the Earthquake training mission. Opening
To display grib files as an overlay on your normal charts you have to first activate the grib icon
 2019/03/09 20:43 1/22 OpenCPN has a grib weather file viewer plugin, aimed at being useful while under way. The grib plugin is an Internal Plugin, always distributed with OpenCPN, no separate download is
HURRICANE Information for the Teacher
 HURRICANE Information for the Teacher This hurricane simulation activity and STELLA model were adapted from materials developed by Jan Mons and Cathy Eaton of the Glynns Integration of Systems Thinking
WeatherHub2 Quick Start Guide
 WeatherHub2 Quick Start Guide Table of Contents 1 Introduction... 1 2 Packing List... 1 3 Connections... 1 4 IP Addressing... 2 5 Browser Access... 3 6 System Info... 3 7 Weather Station Settings... 4
Introduction to the College of DuPage NEXLAB Website
 Introduction to the College of DuPage NEXLAB Website The purpose of this lab is to familiarize yourself with our website so that you will have an easier time following along in class and will be able to
MaxSea TimeZero Navigator and Explorer Version 2 release
 MaxSea TimeZero Navigator and Explorer Version 2 release We are pleased to announce the release of MaxSea TimeZero Navigator and Explorer version 2. For more than 30 years, our main goal has always remained
Fog Chamber Testing the Label: Photo of Fog. Joshua Gutwill 10/29/1999
 Fog Chamber Testing the Label: Photo of Fog Joshua Gutwill 10/29/1999 Keywords: < > formative heat&temp exhibit interview 1 Goals/Context Fog Chamber Interview Results Testing Label: Photo of fog on Golden
Uta Bilow, Carsten Bittrich, Constanze Hasterok, Konrad Jende, Michael Kobel, Christian Rudolph, Felix Socher, Julia Woithe
 ATLAS W path Instructions for tutors Version from 2 February 2018 Uta Bilow, Carsten Bittrich, Constanze Hasterok, Konrad Jende, Michael Kobel, Christian Rudolph, Felix Socher, Julia Woithe Technische
MAHAPATRA218FALL12 ( MPMAHAPATRA218FALL12 )
") Logged in as Rupak Mahapatra, Instructor Help Log Out MAHAPATRA218FALL12 ( MPMAHAPATRA218FALL12 ) My Courses Course Settings Course Home Assignments Roster Gradebook Item Library University Physics with
Logged in as Rupak Mahapatra, Instructor Help Log Out MAHAPATRA218FALL12 ( MPMAHAPATRA218FALL12 ) My Courses Course Settings Course Home Assignments Roster Gradebook Item Library University Physics with
Physics E-1ax, Fall 2014 Experiment 3. Experiment 3: Force. 2. Find your center of mass by balancing yourself on two force plates.
 Learning Goals Experiment 3: Force After you finish this lab, you will be able to: 1. Use Logger Pro to analyze video and calculate position, velocity, and acceleration. 2. Find your center of mass by
Navigating the Hurricane Highway Understanding Hurricanes With Google Earth
 Navigating the Hurricane Highway Understanding Hurricanes With Google Earth 2008 Amato Evan, Kelda Hutson, Steve Kluge, Lindsey Kropuenke, Margaret Mooney, and Joe Turk Images and data courtesy hurricanetracking.com,
Learning ArcGIS: Introduction to ArcCatalog 10.1
 Learning ArcGIS: Introduction to ArcCatalog 10.1 Estimated Time: 1 Hour Information systems help us to manage what we know by making it easier to organize, access, manipulate, and apply knowledge to the
Quantum Series Product Catalog
 Measuring and Managing Healthy Living Quantum Series Product Catalog RJL Sciences is an FDA registered company RJL Sciences, Inc. 33939 Harper Avenue Clinton Township, MI 48035 USA Voice: 1-800-528-4513
Relative Photometry with data from the Peter van de Kamp Observatory D. Cohen and E. Jensen (v.1.0 October 19, 2014)
") Relative Photometry with data from the Peter van de Kamp Observatory D. Cohen and E. Jensen (v.1.0 October 19, 2014) Context This document assumes familiarity with Image reduction and analysis at the Peter
Relative Photometry with data from the Peter van de Kamp Observatory D. Cohen and E. Jensen (v.1.0 October 19, 2014) Context This document assumes familiarity with Image reduction and analysis at the Peter
Graphical Data Analysis Minneapolis Community and Tech. College v Experimental Measurements. Graphical Analysis and Straight lines
 Graphical Data Analysis Minneapolis Community and Tech. College v.8.08 Experimental Measurements All experimentally measured numbers consist of one or more exact numbers that contain no uncertainty and
Week 8 Cookbook: Review and Reflection
 : Review and Reflection Week 8 Overview 8.1) Review and Reflection 8.2) Making Intelligent Maps: The map sheet as a blank canvas 8.3) Making Intelligent Maps: Base layers and analysis layers 8.4) ArcGIS
Safety in Numbers SKYWATCH 497. The affordable original.
 SKYWATCH 497 Safety in Numbers The affordable original. For over 10 years, pilots have trusted SkyWatch Collision Avoidance Systems to help them fly safely. SkyWatch was the first Active Collision Avoidance
Moving into the information age: From records to Google Earth
 Moving into the information age: From records to Google Earth David R. R. Smith Psychology, School of Life Sciences, University of Hull e-mail: davidsmith.butterflies@gmail.com Introduction Many of us
Product Review: Two reviews that will help you anticipate and avoid foul weather woes. Weather on the Web
 Product Review: Two reviews that will help you anticipate and avoid foul weather woes. BY BOB FRITZ No, that first word in the title is not misspelled. Paul Hamilton has put together a dandy DVD, Weather
Give 4 advantages of using ICT in the collection of data. Give. Give 4 disadvantages in the use of ICT in the collection of data
 Give 4 advantages of using ICT in the collection of data can use a handheld GPS to get accurate location information which can be used to show data linked to specific locations within a GIS can collect
We note that Philly Wings is the farthest off, but the others should give a good east-west and north-south measure of the pressure surface slope.
 After entering a randomly selected east coast location of lat = 39 49.00 N, 75 26.00 W we get the following screen after pressing Show Stations. It shows the 10 closest stations with online pressure data
WindNinja Tutorial 3: Point Initialization
 WindNinja Tutorial 3: Point Initialization 6/27/2018 Introduction Welcome to WindNinja Tutorial 3: Point Initialization. This tutorial will step you through the process of downloading weather station data
Fold Analysis Challenge
 GETTING STARTED: The is designed to help geology students attain competency in basic structural analysis of folds using Google Earth. There are two versions, online and desktop. For the online version,
ipads/efbs and Weather the cockpit Captain Joe Burns Managing Director United Airlines Technology and Flight Test
 ipads/efbs and Weather the cockpit Captain Joe Burns Managing Director United Airlines Technology and Flight Test October 12, 2011 How we use weather- 40-50% of all primary delays due to Weather unpredictability!
Boyle s Law: A Multivariable Model and Interactive Animated Simulation
 Boyle s Law: A Multivariable Model and Interactive Animated Simulation Using tools available in Excel, we will turn a multivariable model into an interactive animated simulation. Projectile motion, Boyle's
Infrared Experiments of Thermal Energy and Heat Transfer
 Infrared Experiments of Thermal Energy and Heat Transfer You will explore thermal energy, thermal equilibrium, heat transfer, and latent heat in a series of hands-on activities augmented by the thermal
This will mark the bills as Paid in QuickBooks and will show us with one balance number in the faux RJO Exchange Account how much we owe RJO.
 PAYING & ENTERING RJO BILLS QuickBooks will not allow you to pay two separate vendors (like Stuller & Rembrandt Charm Co) on one check and have the payee be "RJO". So we have to use a 2 prong approach.
Lab Exploration #4: Solar Radiation & Temperature Part II: A More Complex Computer Model
 METR 104: Our Dynamic Weather (w/lab) Lab Exploration #4: Solar Radiation & Temperature Part II: A More Complex Computer Model Dr. Dave Dempsey, Department of Earth & Climate Sciences, SFSU, Spring 2014
Bloomsburg University Weather Viewer Quick Start Guide. Software Version 1.2 Date 4/7/2014
 Bloomsburg University Weather Viewer Quick Start Guide Software Version 1.2 Date 4/7/2014 Program Background / Objectives: The Bloomsburg Weather Viewer is a weather visualization program that is designed
TAKEOFF CONSIDERATIONS...
 CHAPTER 4 TAKEOFFS TAKEOFF CONSIDERATIONS.................. 2-37 AIRSPEED.................................. 2-37 TAKEOFF POWER............................ 2-38 RUNWAY LENGTH REQUIREMENT.............. 2-39
Future of Weather Capabilities in General Aviation Avionics
 Future of Weather Capabilities in General Aviation Avionics October 12, 2017 John S Uczekaj President and CEO Part 91 General Aviation Weather In the last several years strategic weather information in
The purpose of this lab is to investigate phases of matter, temperature, and heat energy.
 9460218_CH07_p081-090.qxd 1/20/10 9:46 PM Page 81 7 TEMPERATURE AND HEAT PURPOSE The purpose of this lab is to investigate phases of matter, temperature, and heat energy. SIMULATIONS States of Matter Figure
AOPA. Mitigating Turbulence Impacts in Aviation Operations. General Aviation Perspective
 AOPA Mitigating Turbulence Impacts in Aviation Operations General Aviation Perspective Rune Duke Senior Director, Airspace & Air Traffic Services Aircraft Owners & Pilots Association AOPA Air Safety Institute
MaxSea TimeZero App v2 MaxSea App User Guide
 MaxSea TimeZero App v2 MaxSea App User Guide 2015-05-27 Contents MAXSEA TIMEZERO APP OVERVIEW... 3 ROBUST TECHNOLOGY & DATA... 3 BASIC FEATURES... 3 WHAT S INSIDE?... 3 WHAT'S NEW IN VERSION 2.0... 4 FIRST
AWE: Aviation Weather Data Visualization Environment
 AWE: Aviation Weather Data Visualization Environment Lilly Spirkovska NASA Ames Research Center Suresh K. Lodha Univ. of California, Santa Cruz Abstract The two official sources for aviation weather reports
GIS Workshop UCLS_Fall Forum 2014 Sowmya Selvarajan, PhD TABLE OF CONTENTS
 TABLE OF CONTENTS TITLE PAGE NO. 1. ArcGIS Basics I 2 a. Open and Save a Map Document 2 b. Work with Map Layers 2 c. Navigate in a Map Document 4 d. Measure Distances 4 2. ArcGIS Basics II 5 a. Work with
1. Open IDV. There is a desktop link, choose version 3.0u1 or 3.0u2. It can take a few minutes to open.
 Page 1 Objectives: Become familiar with using a software package (IDV) to view satellite images Understand the differences between Visible, IR, and Microwave Imagery Observe the influence of dry air and
Astronomy 102 Lab: Stellar Parallax and Proper Motion
 Name: Astronomy 102 Lab: Stellar Parallax and Proper Motion If you own a laptop, please bring it to class. You will use Stellarium again. The Stellarium shortcuts you used in the first lab are on the inside
Watershed Modeling Orange County Hydrology Using GIS Data
 v. 10.0 WMS 10.0 Tutorial Watershed Modeling Orange County Hydrology Using GIS Data Learn how to delineate sub-basins and compute soil losses for Orange County (California) hydrologic modeling Objectives
M o d u l e k A i r c r a f t A e r o d y n a m i c s, S t r u c t u r e s a n d S y s t e m s
 Category A B1 B2 B3 08 Instrument systems (ATA 31) Level 1 2 3 M o d u l e 1 3-0 8 k A i r c r a f t A e r o d y n a m i c s, S t r u c t u r e s a n d S y s t e m s I n s t r u m e n t S y s t e m s -