SENSITIVITY OF SPACE-BASED PRECIPITATION MEASUREMENTS
|
|
|
- Beverley Young
- 5 years ago
- Views:
Transcription
1 SENSITIVITY OF SPACE-BASED PRECIPITATION MEASUREMENTS JP7.2 TO CHANGES IN MESOSCALE FEATURES Joseph Hoch *, Gregory J. Tripoli, Mark Kulie University of Wisconsin, Madison, Wisconsin 1. INTRODUCTION The period of January 7 th through January 11 th, 2005 brought tremendous amounts of rainfall and snowfall throughout the entire state of California. Areas such as Nordhoff Ridge and Opids Camp recorded over 25 inches of equivalent rainfall during the event. The storm caused millions of dollars in damage and at least 10 deaths due to mudslides. This storm was particularly damaging for the region as a similar storm system had just impacted the area from December 26 th through January 5 th, As is the case with many storms in California, the mountainous terrain of the region enhanced the precipitation. Orographically forced precipitation has been the focus of much research attention. Previous studies have commonly focused on the Sierra Nevada region because of the regular occurrence of this type of precipitation enhancement (Marwitz, 1987; Reynolds and Kuciauskas, 1988; Colle and Zeng, 2004; Dettinger et al., 2004; Galewsky and Sobel, 2005). Orographic precipitation is a challenging quantity to retrieve accurately using space-based passive microwave remote sensing techniques. This is due to the complex interactions between largescale dynamics and cloud microphysical processes. Inaccurate understanding of microphysics, such as characterizing the properties of precipitation-sized hydrometeors incorrectly, leads to rainfall retrieval error (Mugnai and Smith 1988; Kummerow and Giglio 1994). Platforms such as the Advanced Microwave Scanning Radiometer (AMSR) can be used to retrieve precipitation over the California region. Recently a new methodology for rainfall retrieval has been considered. Currently, precipitation estimates are made from Cloud Radiation Databases (CRD s) which contain thousands of microphysical profiles that relate * Corresponding author address: Joseph Hoch, Univ. of Wisconsin, Dept of Atmospheric and Oceanic Sciences, Madison, WI 53715; hoch@wisc.edu brightness temperatures to precipitation intensity. The new retrieval approach will include all the classic information of a CRD but also many large-scale dynamical and thermodynamical tags to further increase the constraints on any given bayesian-based retrieval approach. The Cloud Dynamics and Radiation Database (CDRD) will be formulated using the University of Wisconsin Non-hydrostatic Modeling System (UW-NMS), which is a cloud resolving model (Tripoli, 1992). In Section 2, the general CDRD concept is discussed. In Section 3, simulation results and sensitivity studies are presented for the January 7 th California event. The sensitivity of modeled microwave brightness temperatures to several parameters such as, topography elevation, sea surface temperatures, topography slope, and model resolution are discussed and evaluated for their importance as tags in the CDRD system design. Finally, conclusions are presented in section CDRD CONCEPT The CDRD system will inherently be a robust system. This system will avoid the use of inversion and will not have to make intangible mathematical or physical approximations to estimate retrieval. Bayesian retrieval methods and forward modeling will be the basis behind precipitation retrieval using the CDRD. At the time of retrieval a satellite overpass in conjunction with dynamic/thermodynamic information, possibly from soundings, ground sensors, or large-scale models (i.e., NAM, GFS, ECMWF), can be used to mine the CDRD for the appropriate microphysical profiles. These profiles will contain the following information at all 34 vertical layers of the UW-NMS simulations.
2 Total Condensate Mixing Ratio Rain Mixing Ratio Cloud Mixing Ratio Water Vapor Mixing Ratio Graupel Mixing Ratio Aggregate Mixing Ratio Pristine Crystal Mixing Ratio Surface Precipitation Rates (Rain, Snow, Aggregate, Pristine Crystal, Graupel) Surface Skin Temperature Q1, Q2 Temperature Pressure Height Zonal Wind (U) Meridional Wind (V) Vertical Velocity (w) The final list of dynamical and thermodynamical tags to be paired with these profiles is being compiled. Such tags will include mean sea level pressure, surface pressure, 3-D winds, stability indices, temperature profiles, and many others. Variables such as topography elevation, topography slope, sea surface temperature, and model resolution are all evaluated as potential variables for the CDRD system. If slight changes in any potential tag result in large brightness temperature shifts then these should be included in the CDRD database. The following California case study is used to investigate the sensitivities. 3. CASE STUDY The UW-NMS is used for simulating the four-day event. A three grid nesting system is used with an outer grid resolution of 50km, middle grid resolution of 10km, and an inner grid resolution of 2km. The largest timestep on the outermost grid is 90 seconds, 22.5 seconds on the middle grid nest, and seconds on the innermost grid. The UW- NMS is particularly good at simulating orographically enhanced precipitation due to its unique terrain system, a variable step topography system. Similar mesoscale models represent terrain in various other ways, such as terrain following systems or step topography systems. Terrain following systems have a difficult time resolving very steep topography. Step topography systems have a hard time resolving subtle changes in topography. The UW-NMS terrain system is capable of handling both these cases very well (Tripoli, 1992). The model used for radiative transfer calculations is the Successive Order of Interaction (SOI) Radiative Transfer Model, developed by Ralf Bennartz and collaborators at the University of Wisconsin. The SOI is a onedimensional azimuthally averaged, planeparallel radiative transfer model. This model includes the effects of scattering from all hydrometeors. The SOI ignores atmospheric polarization but not surface polarization (Heiginger, O Dell, Bennartz, and Greenwald 2005). This is a hybrid model which uses both the doubling method and the Neumann method. The Neumann method involves successive order of scattering to obtain the upwelling radiance. Figure 1 shows the synoptic setup that lead to the intense rainfall over the California region. This image is courtesy of the California Nevada River Forecast Center. The main branch of the jet stream brought a low-pressure system off the coast of British Columbia. A relatively strong subtropical jet stream provided the necessary moisture over the entire region. The high-pressure system further west in the Pacific Ocean set up a blocking pattern that kept the jet stream in the shown position for several days. Another low-pressure system became stationary off the coast of California helping to further stream subtropical moisture into the region. During the four day period the precipitable water reached values as high as 1.5 inches. As impulses moved onto the California coast, winds flowing counterclockwise intersected the Sierra Nevada mountain chain and caused heavy orographic precipitation enhancement. The UW-NMS did an excellent job simulating this particular orographic event. Figure 2 shows several synoptic parameters predicted for January 7 th, 2005 at 12Z. Contours of mean sea level pressure show the stalled lowpressure system positioned off the northern California coast. There is a large amount of liquid water content along with low 5km pressure contours clearly showing the two low-pressure systems, including the stationary low off the British Columbia coastline. Also shown is the 3- dimensional wind field. This plot shows the structure of the jet stream over the region. Notice that 1-km wind vectors point nearly perpendicular to the Sierra Nevada mountain range. Neiman et al. showed that winds
3 perpendicular to a mountain range at 1km are one of the best predictors of orographic precipitation. (2002). To verify the accuracy of the simulations stage IV radar/gauge data is used from the National Centers for Environmental Prediction (NCEP). This data is available over the CONUS at 4km resolution. Figure 3 shows the comparison for accumulated precipitation during the four-day period, January 7 th 11 th. These plots show that the UW-NMS is very successful in precipitation prediction for this synoptic/mesoscale event. To get a sense for how much precipitation is being influenced by the topography of the region the same simulation was run with no mountains. Figure 4 shows the difference in UW-NMS predicted precipitation amounts for the no mountain run minus the control run. Values less than -2 inches are overlaid onto a topography map of California, also produced by the UW-NMS. The largest differences in precipitation exist directly over the mountain ranges. Since the model produces realistic results radiative transfer calculations are run for the same time period using the SOI model. Any particular brightness temperatures can be simulated with the SOI. Figure 4 shows four simulated microwave brightness temperatures fields at 36.5, 89.0, 150.0, and GHz frequencies. These plots correspond to January 8 th, 2005 at 12Z. A significant barrier in microwave remote sensing is simulating accurate brightness temperatures over land. For the purposes of this sensitivity experiment a constant land emissivity of 0.9 was used. Land emissivities may range from in many cases. Since our focus is mainly on precipitating regions the land emissivity becomes less of a problem since precipitation, if heavy enough, can block out some land effects. The brightness temperature fields show many interesting features. For example, the GHz frequency, which is a water vapor absorption band, seems to show the presence of gravity waves. These waves are positioned correctly with respect to the Sierra Nevada range. For the purposes of the sensitivity testing, four variables of particular interest are selected: elevation, slope, sea surface temperature, and resolution. New simulations are run for all of the following cases: (a) elevation is increased/ decreased 500 meters throughout the inner domain, (b) topography slope of the Sierra Nevada chain is increased gradually by raising topography by multiples of 30 meters, starting at the bases of the mountain range (increased 30m) and ending at the apex (increased 600m), (c) sea surface temperatures are increased/decreased 5 degrees Kelvin, and (d) resolution of the innermost grid is increased to 1.6 km and decreased to 6.6km. Figure 6 shows the change in brightness temperatures for each different adjusted simulation. In each case the new simulation brightness temperature fields are subtracted from the control run brightness temperatures. All of the UW-NMS grids are based on a 252 x 252 grid domain. The scatter plots show the difference in brightness temperatures at each point. As expected, all investigated parameters show the capability to change the brightness temperatures by a significant amount (20K +). For some parameters, such as the increased sea surface temperature experiment, the brightness temperatures fluctuate by over 100K at some points on the grid. Sensitivity studies with radar reflectivity factor showed similar results with the same four parameters. The changes in radar reflectivity are statistically significant when compared to the control run. 4. CONCLUSIONS The above simulations show that the four parameters in question, topography elevation, sea surface temperature, topography slope, and model resolution, play an important role in accurately determining brightness temperatures and radar reflectivity factor. Slight changes in any of these parameters change modeled brightness temperatures by a statistically significant amount. The global CDRD, being developed for improved passive microwave precipitation retrieval, will include several dynamical and thermodynamical tags to further constrain a bayesian based retrieval algorithm. This concept builds on the current CRD approach. This study has shown that the four parameters in question should be included in a database used for precipitation retrieval purposes. A final list of tags is being compiled and the CDRD is expected to be available in the near future.
4 5. REFERENCES Colle B. A., Y. Zeng, 2004: Bulk Microphysical Sensitivities within the MM5 for Orographic Precipitation. Part I: The Sierra 1986 Event, Mon. Wea. Rev., 132, ACKNOWLEDGMENTS The authors would like to thank Ralf Bennartz and Chris O Dell with their help on the SOI radiative transfer model. Dettinger M., K. Redmond, D. Cayan, 2004: Winter Orographic Precipitation Ratios in the Sierra Nevada Large-Scale Atmospheric Circulations and Hydrologic Consequences, J. Hydrometeor., 5, Galewsky J., A. Sobel, 2005: Moist Dynamics and Orographic Precipitation in Northern and Central California during the New Year s Flood of 1997, Mon. Wea. Rev., 6, Heiginger A. K., C. O Dell, R. Bennartz, T. Greenwald, 2005: The Successive Order of Interaction Radiative Transfer Model, Part I: Model Development, J. Atmos. Sci., submitted. Kummerow C., L. Giglio, 1994: A Passive Microwave Technique for Estimating Rainfall and Vertical Structure Information from Space. Part II: Applications to SSM/I Data, J. Appl. Meteor., 33, Marwitz J. D., 1987: Deep Orographic Storms over the Sierra Nevada. Part II: The Precipitation Processes, J. Atmos. Sci., 44, Neiman P. J., F. M. Ralph, A. B. White, D. E. Kingsmill, P.O. G. Persson, 2002: The Statistical Relationship between Upslope Flow and Rainfall in California s Coastal Mountains: Observations during CALJET, Mon. Wea. Rev., 130, Reynolds D. W., A. P. Kuciauskas, 1988: Remote and In Situ Observations of Sierra Nevada Winter Mountain Clouds: Relationships between Mesoscale Structure, Precipitation and Liquid Water, J. Appl. Meteor., 27, Smith E. A., A. Mugnai, 1988: Radiative Transfer to Space through a Precipitation Cloud at Multiple Microwave Frequencies. Part II: Results and Analysis, J. Appl. Meteor., 27, Tripoli G. J., 1992: A Nonhydrostatic Mesoscale Model Designed to Simulate Scale Interaction, Mon. Wea. Rev., 120,
 Synoptic Setup January 07 12 th, 2005 Figure 2.")
 5 km Pressure")
5 Figure 1. (Left) Synoptic Setup January th, 2005 Figure 2. (Below) (a) Mean Sea Level Pressure and 1km Winds, (b) Log of Liquid Water Content, (c) 5 km Pressure Contours, (d) 3-D Wind Field Valid January 7 th, Z
 (12Z Jan 07 12Z Jan 10) from UW-NMS Right: 4 Day Accumulated Rainfall")
6 Figure 3. Left: 4 Day Accumulated Rainfall (in) (12Z Jan 07 12Z Jan 10) from UW-NMS Right: 4 Day Accumulated Rainfall (in) (12Z Jan 07 12Z Jan 10) from NCEP Stage 4 Radar Data Yellow Contour 3 inches Black Contour 7 inches
 minus")
7 Figure 4. No Mountains Accumulated Precipitation (in) minus Control Run Accumulated Precipitation (in)

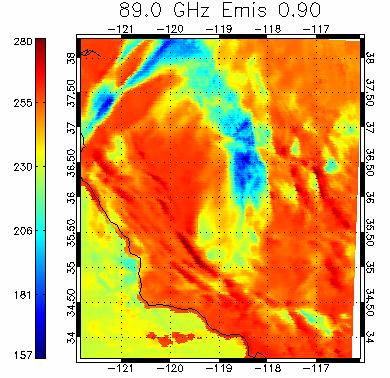
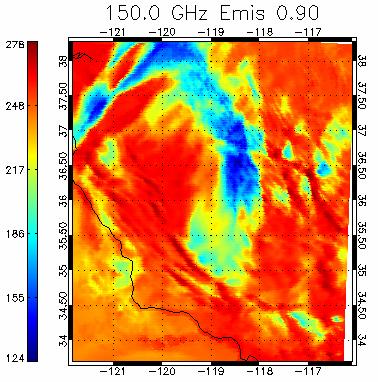
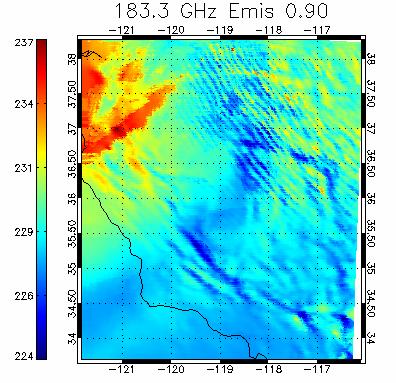
8 Figure 5. Selected brightness temperatures (K) for 12Z January 8 th, 2005
9


10 Figure 6. Differences in brightness temperatures for 89 GHz using different sensitivity tests
NEW TECHNIQUE FOR CLOUD MODEL CONTROLLED PRECIPITATION RETRIEVAL: CLOUD DYNAMICS AND RADIATION DATABASE (CDRD)
") NEW TECHNIQUE FOR CLOUD MODEL CONTROLLED PRECIPITATION RETRIEVAL: CLOUD DYNAMICS AND RADIATION DATABASE (CDRD) P 1.21 DATA MINING APPLICATIONS AT GLOBAL AND REGIONAL SCALES 1 Joseph Hoch *, 2 C.M. Medaglia,
NEW TECHNIQUE FOR CLOUD MODEL CONTROLLED PRECIPITATION RETRIEVAL: CLOUD DYNAMICS AND RADIATION DATABASE (CDRD) P 1.21 DATA MINING APPLICATIONS AT GLOBAL AND REGIONAL SCALES 1 Joseph Hoch *, 2 C.M. Medaglia,
LARGE-SCALE WRF-SIMULATED PROXY ATMOSPHERIC PROFILE DATASETS USED TO SUPPORT GOES-R RESEARCH ACTIVITIES
 LARGE-SCALE WRF-SIMULATED PROXY ATMOSPHERIC PROFILE DATASETS USED TO SUPPORT GOES-R RESEARCH ACTIVITIES Jason Otkin, Hung-Lung Huang, Tom Greenwald, Erik Olson, and Justin Sieglaff Cooperative Institute
National Weather Service-Pennsylvania State University Weather Events
 National Weather Service-Pennsylvania State University Weather Events Abstract: West Coast Heavy Precipitation Event of January 2012 by Richard H. Grumm National Weather Service State College PA 16803
SNOWFALL RATE RETRIEVAL USING AMSU/MHS PASSIVE MICROWAVE DATA
 SNOWFALL RATE RETRIEVAL USING AMSU/MHS PASSIVE MICROWAVE DATA Huan Meng 1, Ralph Ferraro 1, Banghua Yan 2 1 NOAA/NESDIS/STAR, 5200 Auth Road Room 701, Camp Spring, MD, USA 20746 2 Perot Systems Government
Precipitation Structure and Processes of Typhoon Nari (2001): A Modeling Propsective
: A Modeling Propsective") Precipitation Structure and Processes of Typhoon Nari (2001): A Modeling Propsective Ming-Jen Yang Institute of Hydrological Sciences, National Central University 1. Introduction Typhoon Nari (2001) struck
Precipitation Structure and Processes of Typhoon Nari (2001): A Modeling Propsective Ming-Jen Yang Institute of Hydrological Sciences, National Central University 1. Introduction Typhoon Nari (2001) struck
New Zealand Heavy Rainfall and Floods
 New Zealand Heavy Rainfall and Floods 1. Introduction Three days of heavy rainfall associated with a deep upper-level low (Fig. 1) brought flooding to portions of New Zealand (Fig. 2). The flooding was
Remote Sensing of Precipitation
 Lecture Notes Prepared by Prof. J. Francis Spring 2003 Remote Sensing of Precipitation Primary reference: Chapter 9 of KVH I. Motivation -- why do we need to measure precipitation with remote sensing instruments?
Fast passive microwave radiative transfer in precipitating clouds: Towards direct radiance assimliation
 Fast passive microwave radiative transfer in precipitating clouds: Towards direct radiance assimliation Ralf Bennartz *, Thomas Greenwald, Chris O Dell University of Wisconsin-Madison Andrew Heidinger
8.2 Numerical Study of Relationships between Convective Vertical Velocity, Radar Reflectivity Profiles, and Passive Microwave Brightness Temperatures
 8.2 Numerical Study of Relationships between Convective Vertical Velocity, Radar Reflectivity Profiles, and Passive Microwave Brightness Temperatures Yaping Li, Edward J. Zipser, Steven K. Krueger, and
2. Methods and data. 1 NWS Reno, NV report circulated in the LA Times story maximum wind was observed at 0900 AM 8 January 2017.
 The California Extreme Precipitation Event of 8-10 January 2017 By Richard H. Grumm and Charles Ross National Weather Service State College, PA 16803 1. Introduction A strong Pacific jet and a surge of
Talk Overview. Concepts. Climatology. Monitoring. Applications
 Atmospheric Rivers Talk Overview Concepts Climatology Monitoring Applications Satellite View Where is the storm? Where is the impact? Atmospheric Rivers Plume or fire hose of tropical moisture Heavy precipitation
Maximization of Historical Severe Precipitation Events over American, Yuba and Feather River Basins
 Maximization of Historical Severe Precipitation Events over merican, Yuba and Feather River Basins M. L. Kavvas 1, K. Ishida 1, S. Jang 1, N. Ohara 2, Z.Q.Chen 3, and M. nderson 3 1 University Of California,
Myung-Sook Park, Russell L. Elsberry and Michael M. Bell. Department of Meteorology, Naval Postgraduate School, Monterey, California, USA
 Latent heating rate profiles at different tropical cyclone stages during 2008 Tropical Cyclone Structure experiment: Comparison of ELDORA and TRMM PR retrievals Myung-Sook Park, Russell L. Elsberry and
Benjamin J. Moore. Education. Professional experience
 Benjamin J. Moore Department of Atmospheric and Environmental Sciences University at Albany, State University of New York 1400 Washington Avenue Albany, New York, 12222 phone: +1 507 398 7427 email: bjmoore@albany.edu
Mesoscale predictability under various synoptic regimes
 Nonlinear Processes in Geophysics (2001) 8: 429 438 Nonlinear Processes in Geophysics c European Geophysical Society 2001 Mesoscale predictability under various synoptic regimes W. A. Nuss and D. K. Miller
291. IMPACT OF AIRS THERMODYNAMIC PROFILES ON PRECIPITATION FORECASTS FOR ATMOSPHERIC RIVER CASES AFFECTING THE WESTERN UNITED STATES
 291. IMPACT OF AIRS THERMODYNAMIC PROFILES ON PRECIPITATION FORECASTS FOR ATMOSPHERIC RIVER CASES AFFECTING THE WESTERN UNITED STATES Clay B. Blankenship, USRA, Huntsville, Alabama Bradley T. Zavodsky
Observational analysis of storms and flooding events in the Pacific Northwest. Introduction
 Observational analysis of storms and flooding events in the Pacific Northwest Jake Crouch UNCA ATMS Class of 2007 April 18, 2009 Cloud and Precipitation Processes and Patterns Group Introduction Average
Modeling rainfall diurnal variation of the North American monsoon core using different spatial resolutions
 Modeling rainfall diurnal variation of the North American monsoon core using different spatial resolutions Jialun Li, X. Gao, K.-L. Hsu, B. Imam, and S. Sorooshian Department of Civil and Environmental
Lecture 19: Operational Remote Sensing in Visible, IR, and Microwave Channels
 MET 4994 Remote Sensing: Radar and Satellite Meteorology MET 5994 Remote Sensing in Meteorology Lecture 19: Operational Remote Sensing in Visible, IR, and Microwave Channels Before you use data from any
P1.23 HISTOGRAM MATCHING OF ASMR-E AND TMI BRIGHTNESS TEMPERATURES
 P1.23 HISTOGRAM MATCHING OF ASMR-E AND TMI BRIGHTNESS TEMPERATURES Thomas A. Jones* and Daniel J. Cecil Department of Atmospheric Science University of Alabama in Huntsville Huntsville, AL 1. Introduction
Cooperative Institute for Research in Environmental Sciences (CIRES) CU-Boulder 2. National Oceanic and Atmospheric Administration
 CU-Boulder 2. National Oceanic and Atmospheric Administration") Moisture transport during the inland penetrating atmospheric river of early November 006 in the Pacific Northwest: A high-resolution model-based study Michael J. Mueller 1 and Kelly Mahoney 1 Cooperative
Moisture transport during the inland penetrating atmospheric river of early November 006 in the Pacific Northwest: A high-resolution model-based study Michael J. Mueller 1 and Kelly Mahoney 1 Cooperative
SATELLITE APPLICATION FACILITY ON SUPPORT TO OPERATIONAL HYDROLOGY AND WATER MANAGEMENT (H-SAF)
") SATELLITE APPLICATION FACILITY ON SUPPORT TO OPERATIONAL HYDROLOGY AND WATER MANAGEMENT (H-SAF) VISITING SCIENTIST ACTIVITY IN SUPPORT OF WP 2400 VS 310 PROGRAMME ACTIVITY REPORT Generation of an European
SATELLITE APPLICATION FACILITY ON SUPPORT TO OPERATIONAL HYDROLOGY AND WATER MANAGEMENT (H-SAF) VISITING SCIENTIST ACTIVITY IN SUPPORT OF WP 2400 VS 310 PROGRAMME ACTIVITY REPORT Generation of an European
Hydrologic Research Laboratory Department of Civil and Environmental Engineering University of California, Davis
 Physically-Based Estimation of Maximum Precipitation: Preliminary Results on Application to American River Basin for the December,1996-January,1997 Flood Event Hydrologic Research Laboratory Department
National Weather Service-Pennsylvania State University Weather Events
 National Weather Service-Pennsylvania State University Weather Events Heavy Rain 7-8 December 2011 by Richard H. Grumm National Weather Service State College PA 16803 Abstract:. A mid-level short-wave
APPLICATIONS WITH METEOROLOGICAL SATELLITES. W. Paul Menzel. Office of Research and Applications NOAA/NESDIS University of Wisconsin Madison, WI
 APPLICATIONS WITH METEOROLOGICAL SATELLITES by W. Paul Menzel Office of Research and Applications NOAA/NESDIS University of Wisconsin Madison, WI July 2004 Unpublished Work Copyright Pending TABLE OF CONTENTS
Atmospheric rivers induced heavy precipitation and flooding in the western U.S. simulated by the WRF regional climate model
 GEOPHYSICAL RESEARCH LETTERS, VOL. 36, L03820, doi:10.1029/2008gl036445, 2009 Atmospheric rivers induced heavy precipitation and flooding in the western U.S. simulated by the WRF regional climate model
A FROZEN DROP PRECIPITATION MECHANISM OVER AN OPEN OCEAN AND ITS EFFECT ON RAIN, CLOUD PATTERN, AND HEATING
 A FROZEN DROP PRECIPITATION MECHANISM OVER AN OPEN OCEAN AND ITS EFFECT ON RAIN, CLOUD PATTERN, AND HEATING 13.6 Tsutomu Takahashi* University of Hawaii, Honolulu, Hawaii Kazunori Shimura JFE Techno-Research
IPWG s Potential Role in a Snow Hydrology Mission
 IPWG s Potential Role in a Snow Hydrology Mission Chris Kidd The University of Birmingham Birmingham, United Kingdom International Precipitation Working Group Ralph Ferraro NOAA/NESDIS College Park, MD
Assimilation of precipitation-related observations into global NWP models
 Assimilation of precipitation-related observations into global NWP models Alan Geer, Katrin Lonitz, Philippe Lopez, Fabrizio Baordo, Niels Bormann, Peter Lean, Stephen English Slide 1 H-SAF workshop 4
MET Lecture 20 Mountain Snowstorms (CH16)
") MET 4300 Lecture 20 Mountain Snowstorms (CH16) Learning Objectives Provide an overview of the importance and impacts of mountain snowstorms in the western US Describe how topography influence precipitation
MET 4300 Lecture 20 Mountain Snowstorms (CH16) Learning Objectives Provide an overview of the importance and impacts of mountain snowstorms in the western US Describe how topography influence precipitation
Satellite and Aircraft Observations of Snowfall Signature at Microwave Frequencies. Yoo-Jeong Noh and Guosheng Liu
 Satellite and Aircraft Observations of Snowfall Signature at Microwave Frequencies Yoo-Jeong Noh and Guosheng Liu Department of Meteorology, Florida State University Tallahassee, Florida, USA Corresponding
Using Data Assimilation to Explore Precipitation - Cloud System - Environment Interactions
 Using Data Assimilation to Explore Precipitation - Cloud System - Environment Interactions Derek J. Posselt Collaborators: Samantha Tushaus, Richard Rotunno, Marcello Miglietta, Craig Bishop, Marcus van
P2.57 PRECIPITATION STRUCTURE IN MIDLATITUDE CYCLONES
 P2.57 PRECIPITATION STRUCTURE IN MIDLATITUDE CYCLONES Paul R. Field 1, Robert Wood 2 1. National Center for Atmospheric Research, Boulder, Colorado. 2. University of Washington, Seattle, Washington. 1.
ASSIMILATION OF CLOUDY AMSU-A MICROWAVE RADIANCES IN 4D-VAR 1. Stephen English, Una O Keeffe and Martin Sharpe
 ASSIMILATION OF CLOUDY AMSU-A MICROWAVE RADIANCES IN 4D-VAR 1 Stephen English, Una O Keeffe and Martin Sharpe Met Office, FitzRoy Road, Exeter, EX1 3PB Abstract The assimilation of cloud-affected satellite
CASE STUDY OF THE NOVEMBER WINDSTORM IN SOUTH CENTRAL COLORADO
 32 CASE STUDY OF THE 12-13 NOVEMBER WINDSTORM IN SOUTH CENTRAL COLORADO Paul Wolyn * NOAA/NWS Pueblo, CO 1. INTRODUCTION During the evening and early morning of 12-13 November 2011, a damaging downslope
Sensitivity of precipitation forecasts to cumulus parameterizations in Catalonia (NE Spain)
") Sensitivity of precipitation forecasts to cumulus parameterizations in Catalonia (NE Spain) Jordi Mercader (1), Bernat Codina (1), Abdelmalik Sairouni (2), Jordi Cunillera (2) (1) Dept. of Astronomy and
Sensitivity of precipitation forecasts to cumulus parameterizations in Catalonia (NE Spain) Jordi Mercader (1), Bernat Codina (1), Abdelmalik Sairouni (2), Jordi Cunillera (2) (1) Dept. of Astronomy and
The impact of assimilation of microwave radiance in HWRF on the forecast over the western Pacific Ocean
 The impact of assimilation of microwave radiance in HWRF on the forecast over the western Pacific Ocean Chun-Chieh Chao, 1 Chien-Ben Chou 2 and Huei-Ping Huang 3 1Meteorological Informatics Business Division,
Landfalling Impacts of Atmospheric Rivers: From Extreme Events to Long-term Consequences
 Landfalling Impacts of Atmospheric Rivers: From Extreme Events to Long-term Consequences Paul J. Neiman 1, F.M. Ralph 1, G.A. Wick 1, M. Hughes 1, J. D. Lundquist 2, M.D. Dettinger 3, D.R. Cayan 3, L.W.
Quantifying Global Uncertainties in a Simple Microwave Rainfall Algorithm
 JANUARY 2006 K U M M E R O W E T A L. 23 Quantifying Global Uncertainties in a Simple Microwave Rainfall Algorithm CHRISTIAN KUMMEROW, WESLEY BERG, JODY THOMAS-STAHLE, AND HIROHIKO MASUNAGA Department
Daniel J. Cecil 1 Mariana O. Felix 1 Clay B. Blankenship 2. University of Alabama - Huntsville. University Space Research Alliance
 12A.4 SEVERE STORM ENVIRONMENTS ON DIFFERENT CONTINENTS Daniel J. Cecil 1 Mariana O. Felix 1 Clay B. Blankenship 2 1 University of Alabama - Huntsville 2 University Space Research Alliance 1. INTRODUCTION
F O U N D A T I O N A L C O U R S E
 F O U N D A T I O N A L C O U R S E December 6, 2018 Satellite Foundational Course for JPSS (SatFC-J) F O U N D A T I O N A L C O U R S E Introduction to Microwave Remote Sensing (with a focus on passive
High Resolution Modeling of Multi-scale Cloud and Precipitation Systems Using a Cloud-Resolving Model
 Chapter 1 Atmospheric and Oceanic Simulation High Resolution Modeling of Multi-scale Cloud and Precipitation Systems Using a Cloud-Resolving Model Project Representative Kazuhisa Tsuboki Author Kazuhisa
P3.26 DEVELOPMENT OF A SNOWFALL RETRIEVAL ALGORITHM USING DATA AT HIGH MICROWAVE FREQUENCIES
 P3.26 DEVELOPMENT OF A SNOWFALL RETRIEVAL ALGORITHM USING DATA AT HIGH MICROWAVE FREQUENCIES Yoo-Jeong Noh*, Guosheng Liu, and Eun-Kyoung Seo Florida State University, Tallahassee, FL 32306, USA 1. INTRODUCTION
DEPARTMENT OF GEOSCIENCES SAN FRANCISCO STATE UNIVERSITY. Metr Fall 2012 Test #1 200 pts. Part I. Surface Chart Interpretation.
 DEPARTMENT OF GEOSCIENCES SAN FRANCISCO STATE UNIVERSITY NAME Metr 356.01 Fall 2012 Test #1 200 pts Part I. Surface Chart Interpretation. Figure 1. Surface Chart for 1500Z 7 September 2007 1 1. Pressure
Snowfall Detection and Rate Retrieval from ATMS
 Snowfall Detection and Rate Retrieval from ATMS Jun Dong 1, Huan Meng 2, Cezar Kongoli 1, Ralph Ferraro 2, Banghua Yan 2, Nai-Yu Wang 1, Bradley Zavodsky 3 1 University of Maryland/ESSIC/Cooperative Institute
Recent improvements in the all-sky assimilation of microwave radiances at the ECMWF
 Recent improvements in the all-sky assimilation of microwave radiances at the ECMWF Katrin Lonitz, Alan Geer and many more katrin.lonitz@ecmwf.int ECMWF January 30, 2018 clear sky assimilation all-sky
L. McMurdie, R. Houze, J. Zagrodnik, W. Petersen, M. Schwaller
 L. McMurdie, R. Houze, J. Zagrodnik, W. Petersen, M. Schwaller International Atmospheric Rivers Conference, San Diego, CA, 9 August 2016 Goals of OLYMPEX Validate GPM satellite radar and passive microwave
P6.16 A 16-YEAR CLIMATOLOGY OF GLOBAL RAINFALL FROM SSM/I HIGHLIGHTING MORNING VERSUS EVENING DIFFERENCES 2. RESULTS
 P6.16 A 16-YEAR CLIMATOLOGY OF GLOBAL RAINFALL FROM SSM/I HIGHLIGHTING MORNING VERSUS EVENING DIFFERENCES Andrew J. Negri 1*, Robert F. Adler 1, and J. Marshall Shepherd 1 George Huffman 2, Michael Manyin
Inter-comparison of CRTM and RTTOV in NCEP Global Model
 Inter-comparison of CRTM and RTTOV in NCEP Global Model Emily H. C. Liu 1, Andrew Collard 2, Ruiyu Sun 2, Yanqiu Zhu 2 Paul van Delst 2, Dave Groff 2, John Derber 3 1 SRG@NOAA/NCEP/EMC 2 IMSG@NOAA/NCEP/EMC
TWO CASES OF HEAVY RAIN ON THE MEDITERRANEAN SIDE OF THE ALPS IN MAP. Robert Houze 1 and Socorro Medina University of Washington
 1.1 TWO CASES OF HEAVY RAIN ON THE MEDITERRANEAN SIDE OF THE ALPS IN MAP Robert Houze 1 and Socorro Medina University of Washington Matthias Steiner Princeton University 1. INTRODUCTION The Mesoscale Alpine
WRF Model Simulated Proxy Datasets Used for GOES-R Research Activities
 WRF Model Simulated Proxy Datasets Used for GOES-R Research Activities Jason Otkin Cooperative Institute for Meteorological Satellite Studies Space Science and Engineering Center University of Wisconsin
Significant cyclone activity occurs in the Mediterranean
 TRMM and Lightning Observations of a Low-Pressure System over the Eastern Mediterranean BY K. LAGOUVARDOS AND V. KOTRONI Significant cyclone activity occurs in the Mediterranean area, mainly during the
GIFTS- A SYSTEM FOR WIND PROFILING FROM GEOSTATIONARY SATELLITES
 GIFTS- A SYSTEM FOR WIND PROFILING FROM GEOSTATIONARY SATELLITES William Smith, Wallace Harrison, Dwayne Hinton, Vickie Parsons and Allen Larar NASA LaRC, Hampton Virginia (USA) Henry Revercomb 1, Allen
NWP SAF. Quantitative precipitation estimation from satellite data. Satellite Application Facility for Numerical Weather Prediction
 NWP SAF Satellite Application Facility for Numerical Weather Prediction Document NWPSAF-MO-VS-011 Version 1.0 15 April 2006 Quantitative precipitation estimation from satellite data Sante Laviola University
DEPARTMENT OF EARTH & CLIMATE SCIENCES Name SAN FRANCISCO STATE UNIVERSITY Nov 29, ERTH 360 Test #2 200 pts
 DEPARTMENT OF EARTH & CLIMATE SCIENCES Name SAN FRANCISCO STATE UNIVERSITY Nov 29, 2018 ERTH 360 Test #2 200 pts Each question is worth 4 points. Indicate your BEST CHOICE for each question on the Scantron
The southern express: Winter storm of January 2010 By Richard H. Grumm National Weather Service
 The southern express: Winter storm of 28-30 January 2010 By Richard H. Grumm National Weather Service 1. INTRODUCTION A storm system of Pacific origin tracked across the southern United States from 27-31
The Devastating Western European Winter Storm February 2010 By Richard H. Grumm National Weather Service
 The Devastating Western European Winter Storm 27-28 February 2010 By Richard H. Grumm National Weather Service 1. INTRODUCTION A strong late winter storm, called Xynthia 1, raced across Western Europe
West Coast Multi-Day heavy Precipitation Event 28 November-2 December 2012-Draft
 West Coast Multi-Day heavy Precipitation Event 28 November-2 December 2012-Draft By Richard H. Grumm and Charles Ross National Weather Service State College, PA 16803 Contributions by the Albany MAP and
Charles A. Doswell III, Harold E. Brooks, and Robert A. Maddox
 Charles A. Doswell III, Harold E. Brooks, and Robert A. Maddox Flash floods account for the greatest number of fatalities among convective storm-related events but it still remains difficult to forecast
A Microwave Snow Emissivity Model
 A Microwave Snow Emissivity Model Fuzhong Weng Joint Center for Satellite Data Assimilation NOAA/NESDIS/Office of Research and Applications, Camp Springs, Maryland and Banghua Yan Decision Systems Technologies
Assessment of Ensemble Forecasts
 Assessment of Ensemble Forecasts S. L. Mullen Univ. of Arizona HEPEX Workshop, 7 March 2004 Talk Overview Ensemble Performance for Precipitation Global EPS and Mesoscale 12 km RSM Biases, Event Discrimination
Combining Satellite & Model Information for Snowfall Retrieval
 Combining Satellite & Model Information for Snowfall Retrieval Yoo-Jeong Noh Cooperative Institute for Research in the Atmosphere Colorado State University CIRA/Colorado State University 5th Annual CoRP
ATS 351, Spring 2010 Lab #9 Weather Radar - 55 points
 ATS 351, Spring 2010 Lab #9 Weather Radar - 55 points 1. (5 points) If a radar has a maximum unambiguous range of 300km, what is its PRF? (The speed of light, c, is equal to 3x10 8 m/s) The equation to
Severe storms over the Mediterranean Sea: A satellite and model analysis
 National Research Council of Italy Severe storms over the Mediterranean Sea: A satellite and model analysis V. Levizzani, S. Laviola, A. Malvaldi, M. M. Miglietta, and E. Cattani 6 th International Precipitation
An Annual Cycle of Arctic Cloud Microphysics
 An Annual Cycle of Arctic Cloud Microphysics M. D. Shupe Science and Technology Corporation National Oceanic and Atmospheric Administration Environmental Technology Laboratory Boulder, Colorado T. Uttal
NUMERICAL SIMULATION OF WATERSPOUTS OBSERVED IN THE TYRRHENIAN SEA
 NUMERICAL SIMULATION OF WATERSPOUTS OBSERVED IN THE TYRRHENIAN SEA 4M.1 by G. J. Tripoli (1)*, Carlo Medaglia (2), A. Mugnai (2), Eric Smith (3) (1) University of Wisconsin, USA (2) Istituto di Scienza
Classification of hydrometeors using microwave brightness. temperature data from AMSU-B over Iran
 Iranian Journal of Geophysics, Vol. 9, No. 5, 2016, Page 24-39 Classification of hydrometeors using microwave brightness temperature data from AMSU-B over Iran Abolhasan Gheiby 1* and Majid Azadi 2 1 Assistant
National Weather Service-Pennsylvania State University Weather Events
 National Weather Service-Pennsylvania State University Weather Events New Zealand heavy rain and flood event-draft by Richard H. Grumm National Weather Service State College PA 16803 Abstract:. A record
Meteorological Satellite Image Interpretations, Part III. Acknowledgement: Dr. S. Kidder at Colorado State Univ.
 Meteorological Satellite Image Interpretations, Part III Acknowledgement: Dr. S. Kidder at Colorado State Univ. Dates EAS417 Topics Jan 30 Introduction & Matlab tutorial Feb 1 Satellite orbits & navigation
OBSERVATIONS OF WINTER STORMS WITH 2-D VIDEO DISDROMETER AND POLARIMETRIC RADAR
 P. OBSERVATIONS OF WINTER STORMS WITH -D VIDEO DISDROMETER AND POLARIMETRIC RADAR Kyoko Ikeda*, Edward A. Brandes, and Guifu Zhang National Center for Atmospheric Research, Boulder, Colorado. Introduction
MODEL TYPE (Adapted from COMET online NWP modules) 1. Introduction
 1. Introduction") MODEL TYPE (Adapted from COMET online NWP modules) 1. Introduction Grid point and spectral models are based on the same set of primitive equations. However, each type formulates and solves the equations
MODEL TYPE (Adapted from COMET online NWP modules) 1. Introduction Grid point and spectral models are based on the same set of primitive equations. However, each type formulates and solves the equations
Northeastern United States Snowstorm of 9 February 2017
 Northeastern United States Snowstorm of 9 February 2017 By Richard H. Grumm and Charles Ross National Weather Service State College, PA 1. Overview A strong shortwave produced a stripe of precipitation
The effect of ice fall speed in the structure of surface precipitation
 The effect of ice fall speed in the structure of surface precipitation 10th International SRNWP-Workshop on Non-Hydrostatic Modelling. 14 th May 2013 Jorge Bornemann, Paul Field, Kalli Furtado, Mark Weeks,
David W. Reynolds * National Weather Service WFO San Francisco Bay Area Monterey, CA
 3.2 THE MADDEN JULIAN OSCILLATION: ITS POTENTIAL FOR WEEK TWO FLOOD OUTLOOKS AND RESERVOIR MANAGEMENT DECISIONS IN CALIFORNIA David W. Reynolds * National Weather Service WFO San Francisco Bay Area Monterey,
Stratiform and Convective Classification of Rainfall Using SSM/I 85-GHz Brightness Temperature Observations
 570 JOURNAL OF ATMOSPHERIC AND OCEANIC TECHNOLOGY VOLUME 14 Stratiform and Convective Classification of Rainfall Using SSM/I 85-GHz Brightness Temperature Observations EMMANOUIL N. ANAGNOSTOU Department
THE INFLUENCE OF THE GREAT LAKES ON NORTHWEST SNOWFALL IN THE SOUTHERN APPALACHIANS
 P2.18 THE INFLUENCE OF THE GREAT LAKES ON NORTHWEST SNOWFALL IN THE SOUTHERN APPALACHIANS Robbie Munroe* and Doug K. Miller University of North Carolina at Asheville, Asheville, North Carolina B. Holloway
MESO-NH cloud forecast verification with satellite observation
 MESO-NH cloud forecast verification with satellite observation Jean-Pierre CHABOUREAU Laboratoire d Aérologie, University of Toulouse and CNRS, France http://mesonh.aero.obs-mip.fr/chaboureau/ DTC Verification
3.5 A CASE STUDY OF MESOSCALE AND PLUME DISPERSION MODELING FOR A FEBRUARY 2004 CLOUD SEEDING EVENT IN THE WALKER RIVER BASIN OF CALIFORNIA/NEVADA
 3.5 A CASE STUDY OF MESOSCALE AND PLUME DISPERSION MODELING FOR A FEBRUARY 2004 CLOUD SEEDING EVENT IN THE WALKER RIVER BASIN OF CALIFORNIA/NEVADA Arlen W. Huggins* Darko Koracin Domagoj Podnar Ming Xiao
over the Pacific and Atlantic basins
 7D.5 Meridional moisture transport by tropical synoptic scale disturbances over the Pacific and Atlantic basins Chia-chi Wang and Gudrun Magnusdottir University of California, Irvine, California 1. Introduction
THE INFLUENCE OF HIGHLY RESOLVED SEA SURFACE TEMPERATURES ON METEOROLOGICAL SIMULATIONS OFF THE SOUTHEAST US COAST
 THE INFLUENCE OF HIGHLY RESOLVED SEA SURFACE TEMPERATURES ON METEOROLOGICAL SIMULATIONS OFF THE SOUTHEAST US COAST Peter Childs, Sethu Raman, and Ryan Boyles State Climate Office of North Carolina and
March 11, A CCP Weather and Climate.notebook. Weather & Climate BEFORE YOU TEACH LESSON
 BEFORE YOU TEACH LESSON 1 Before You Teach Before You Read Reading Passage After You Read SMART Response Printable Reading Passage 2 Before You Read Reading Passage As a class, brainstorm the meanings
2.6 INVESTIGATION OF 2-3 FEB 1998 CALIFORNIA EXTRATROPICAL STORM USING COAMPS TM
 2.6 INVESTIGATION OF 2-3 FEB 1998 CALIFORNIA EXTRATROPICAL STORM USING COAMPS TM Brian J. Gaudet and J.M. Schmidt Naval Research Laboratory Monterey. 1. INTRODUCTION During the 1997-1998 winter season,
Direct assimilation of all-sky microwave radiances at ECMWF
 Direct assimilation of all-sky microwave radiances at ECMWF Peter Bauer, Alan Geer, Philippe Lopez, Deborah Salmond European Centre for Medium-Range Weather Forecasts Reading, Berkshire, UK Slide 1 17
Rainfall estimation over the Taiwan Island from TRMM/TMI data
 P1.19 Rainfall estimation over the Taiwan Island from TRMM/TMI data Wann-Jin Chen 1, Ming-Da Tsai 1, Gin-Rong Liu 2, Jen-Chi Hu 1 and Mau-Hsing Chang 1 1 Dept. of Applied Physics, Chung Cheng Institute
Progress Report Year 2 Progress Report (July 2013-June 2014) NASA Reference #: NNX12AQ76G
 NASA Reference #: NNX12AQ76G") Progress Report Year 2 Progress Report (July 2013-June 2014) NASA Reference #: NNX12AQ76G Project Title: SNOWFALL FROM SPACE: A SYNERGISTIC MULTI-SENSOR STRATEGY TO IMPROVE SPACEBORNE SNOWFALL ESTIMATES
Progress Report Year 2 Progress Report (July 2013-June 2014) NASA Reference #: NNX12AQ76G Project Title: SNOWFALL FROM SPACE: A SYNERGISTIC MULTI-SENSOR STRATEGY TO IMPROVE SPACEBORNE SNOWFALL ESTIMATES
Data Short description Parameters to be used for analysis SYNOP. Surface observations by ships, oil rigs and moored buoys
 3.2 Observational Data 3.2.1 Data used in the analysis Data Short description Parameters to be used for analysis SYNOP Surface observations at fixed stations over land P,, T, Rh SHIP BUOY TEMP PILOT Aircraft
Multi-scale Predictability Aspects of a Severe European Winter Storm
 1 Multi-scale Predictability Aspects of a Severe European Winter Storm NASA MODIS James D. Doyle, C. Amerault, P. A. Reinecke, C. Reynolds Naval Research Laboratory, Monterey, CA Mesoscale Predictability
Winter Storm of 15 December 2005 By Richard H. Grumm National Weather Service Office State College, PA 16803
 Winter Storm of 15 December 2005 By Richard H. Grumm National Weather Service Office State College, PA 16803 1. INTRODUCTION A complex winter storm brought snow, sleet, and freezing rain to central Pennsylvania.
Raindrop Size Distributions and Z-R Relations in Coastal Rainfall For Periods With and Without a Radar Brightband
 American Meteorological Society 11 th Conference on Mesoscale Processes October 2005, Albuquerque, NM JP4J.1 Raindrop Size Distributions and Z-R Relations in Coastal Rainfall For Periods With and Without
1. INTRODUCTION. March. Local time used in text to define dates. 1 Due to UTC time the went passed 0000 UTC 31
 New England Record Maker Rain Event of 29-30 March 2010 By Richard H. Grumm National Weather Service Contributions by Frank Nocera National Weather Service Office Taunton, MA 1. INTRODUCTION The second
Pilots watch the clouds, because clouds can indicate the kind of weather in store for a flight.
 Low stratus Cumulonimbus Pilots watch the clouds, because clouds can indicate the kind of weather in store for a flight. FILL IN THE BLANKS OR CIRCLE ONE: A. Stratus means flat or on one level. Low stratus
SNOW CLIMATOLOGY OF THE EASTERN SIERRA NEVADA. Susan Burak, graduate student Hydrologic Sciences University of Nevada, Reno
 SNOW CLIMATOLOGY OF THE EASTERN SIERRA NEVADA Susan Burak, graduate student Hydrologic Sciences University of Nevada, Reno David Walker, graduate student Department of Geography/154 University of Nevada
INVESTIGATION FOR A POSSIBLE INFLUENCE OF IOANNINA AND METSOVO LAKES (EPIRUS, NW GREECE), ON PRECIPITATION, DURING THE WARM PERIOD OF THE YEAR
, ON PRECIPITATION, DURING THE WARM PERIOD OF THE YEAR") Proceedings of the 13 th International Conference of Environmental Science and Technology Athens, Greece, 5-7 September 2013 INVESTIGATION FOR A POSSIBLE INFLUENCE OF IOANNINA AND METSOVO LAKES (EPIRUS,
Proceedings of the 13 th International Conference of Environmental Science and Technology Athens, Greece, 5-7 September 2013 INVESTIGATION FOR A POSSIBLE INFLUENCE OF IOANNINA AND METSOVO LAKES (EPIRUS,
Cold air outbreak over the Kuroshio Extension Region
 Cold air outbreak over the Kuroshio Extension Region Jensen, T. G. 1, T. Campbell 1, T. A. Smith 1, R. J. Small 2 and R. Allard 1 1 Naval Research Laboratory, 2 Jacobs Engineering NRL, Code 7320, Stennis
1. Base your answer to the following question on the weather map below, which shows a weather system that is affecting part of the United States.
 1. Base your answer to the following question on the weather map below, which shows a weather system that is affecting part of the United States. Which sequence of events forms the clouds associated with
Modeling Challenges At High Latitudes. Judith Curry Georgia Institute of Technology
 Modeling Challenges At High Latitudes Judith Curry Georgia Institute of Technology Physical Process Parameterizations Radiative transfer Surface turbulent fluxes Cloudy boundary layer Cloud microphysics
ATMOSPHERIC CIRCULATION AND WIND
 ATMOSPHERIC CIRCULATION AND WIND The source of water for precipitation is the moisture laden air masses that circulate through the atmosphere. Atmospheric circulation is affected by the location on the
El Niño, Climate Change and Water Supply Variability
 El Niño, Climate Change and Water Supply Variability Talk Overview El Niño and California California Climate Variability and Change Water Management in the Face of Change California s topography affects
2016 INTERNATIONAL ATMOSPHERIC RIVERS CONFERENCE SAN DIEGO, CA 8-11 August 2016
 ATMOSPHERIC RIVERS AND ENHANCED INTEGRATED VAPOR TRANSPORT EPISODES: THEIR ROLE IN DAMAGING FRONTAL PASSAGES IN SOUTHERN CALIFORNIA WITH AN EMPHASIS ON STRONG WINDS 2016 INTERNATIONAL ATMOSPHERIC RIVERS
Climate and the Atmosphere
 Climate and Biomes Climate Objectives: Understand how weather is affected by: 1. Variations in the amount of incoming solar radiation 2. The earth s annual path around the sun 3. The earth s daily rotation