Forecasting Precipitation Distributions Associated with Cool-Season 500-hPa Cutoff Cyclones in the Northeastern United States
|
|
|
- Magdalene Dean
- 5 years ago
- Views:
Transcription
1 Forecasting Precipitation Distributions Associated with Cool-Season 500-hPa Cutoff Cyclones in the Northeastern United States Melissa Payer, Lance F. Bosart, Daniel Keyser Department of Atmospheric and Environmental Sciences University at Albany, SUNY Neil A. Stuart and Thomas A. Wasula NOAA/NWS, Albany, NY M.S. Thesis Presentation 8 July 2010 NOAA/CSTAR Grant NA07NWS
2 Motivation Forecasting precipitation distributions associated with 500-hPa cool-season cutoff cyclones can be a challenge in the Northeast U.S. (NE) Forecast uncertainties often arise due to variation in cutoff cyclone speed/location and interaction with the complex topography in the NE Identifying signatures differentiating between precipitation distributions would help forecasters
3 Objectives Create composites of cutoff cyclones categorized by tilt, structure, and precipitation amount Perform case studies of difficult-to-forecast cutoff cyclones as well as cutoff cyclones associated with varying precipitation distributions Identify signatures differentiating between various precipitation distributions
4 Outline Overview of cutoff cyclones and precipitation Precipitation distribution Influence of terrain Cyclone-relative composites Average location of cutoff cyclones Brief overview of three composite categories Case study 1 4 January 2010 cutoff cyclone
5 Cutoff Cyclones and Precipitation Hsieh (1949) documented the precipitation distribution associated with a 500-hPa cutoff cyclone Precipitation was distributed asymmetrically about the system Light precipitation was located near the cyclone core while heavy precipitation was observed southeast of the cyclone center
6 Cutoff Cyclones and Precipitation Klein et al. (1968) examined precipitation distributions associated with cutoff cyclones in the western U.S. 300, 500, 700, 850 hpa The most intense (Class III) cyclones were found to have precipitation occurring in the southeast quadrant For weak systems the precipitation is generally located near the center of the cyclone in the southwest quadrant
7 Cutoff Cyclones and Precipitation Aiyyer and Atallah (2002) studied precipitation associated with 500-hPa cutoff cyclones in the NE Approximately 30% of annual precipitation in the NE can be attributed to 500-hPa cutoff cyclones The optimal location for cutoff cyclones producing heavy precipitation in the NE is to the west of the region During the cool season the precipitation is strongly modified by upslope flow and lake-effect enhancement Fracasso (2004) completed a climatology of cool-season (Oct May) 500-hPa cutoff cyclones in the NE Observed enhanced precipitation amounts collocated with higher terrain

8 Cutoff Cyclones and Precipitation Scalora (2009) examined warm-season (June Sept) 500-hPa cutoff cyclones in the NE N = 4/20 cases Classified 20 cutoff cyclone cases into five categories based on tilt of 500-hPa cutoff cyclone Developed conceptual models to identify where precipitation and severe weather will be most significant
9 Data Cyclone-relative Composites 1.0 GFS analysis data 2.5 NCEP NCAR reanalysis data Case Study 0.5 GFS analysis data 2.5 NCEP NCAR reanalysis data (climatologies created for ) Standardized anomalies fields were created from 1.0 GFS analyses with respect to climatology 6-h National Precipitation Verification Unit (NPVU) QPE NEXRAD base reflectivity Hourly surface observation data
10 Methodology Analysis period: Cool season (1 Oct 30 Apr) 2004/ /09 Cutoff cyclone domain: N, W Cutoff cyclone criteria: 30-m height rise in all directions Duration >12 h Precipitation domain: New England, NY, PA, NJ Cutoff cyclone days were defined as a 24-h period from 1200 to 1200 UTC in which a cutoff cyclone was present in domain

11 Methodology Analysis period: Cool season (1 Oct 30 Apr) 2004/ /09 Cutoff cyclone domain: N, W Cutoff cyclone criteria: 30-m height rise in all directions Duration >12 h Precipitation domain: New England, NY, PA, NJ Cutoff cyclone days were defined as a 24-h period from 1200 to 1200 UTC in which a cutoff cyclone was present in domain
12 Cyclone-relative Composites
13 Composite Methodology Each cutoff cyclone day (n=384) was categorized by 1) Precipitation amount observed: heavy precipitation (HP), light precipitation (LP), or no precipitation (NP) HP: >5% of precipitation domain received 25 mm (n=100) LP: <5% of precipitation domain received 25 mm (n=250) NP: no precipitation observed in the domain (n=34)
 Tilt: negative, neutral, or positive Scalora")
14 Composite Methodology Each cutoff cyclone day (N=384) was categorized by 1) Precipitation amount observed 2) Tilt: negative, neutral, or positive Scalora (2009)
15 Composite Methodology Each cutoff cyclone day (N=384) was categorized by 1) Precipitation amount observed 2) Tilt 3) Structure: cutoff or trough cutoff: presence of 250-hPa zonal wind standardized anomaly of 2.0 σ or below on the poleward side of the cyclone (i.e., purely separated from the background westerly flow) trough: does not meet the cutoff criteria (essentially a closed low embedded within a large-scale trough) Note: Since there were so few NP cutoff cyclone days they were not separated into cutoff/trough
16 Average Location of Cutoff Cyclones
, and 850-hPa potential temperature (K, dashed")
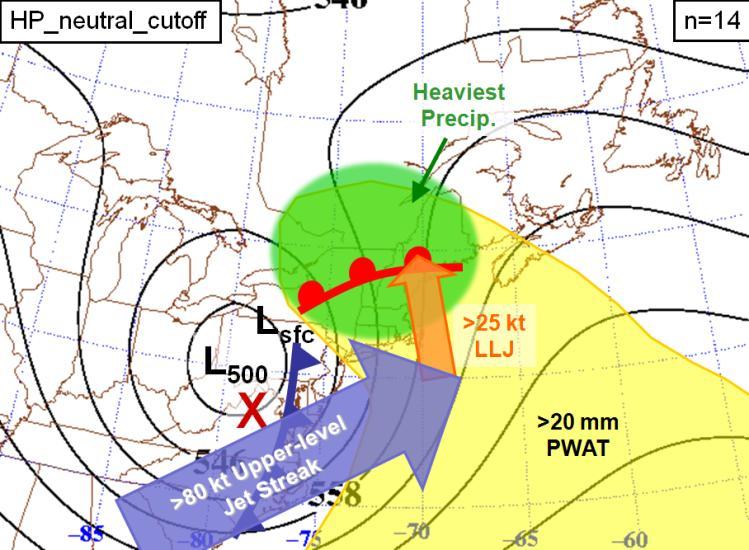
17 Composite: HP_neutral_cutoff m s 1 n= hPa wind (m s 1, shaded), 500-hPa geo. height (dam, solid contours), and 850-hPa potential temperature (K, dashed contours)
, MSLP (hpa, solid contours), 850-hPa wind (>30 kt, barbs),")
18 Composite: HP_neutral_cutoff σ n=14 Stand. anom. of precipitable water (σ, shaded), MSLP (hpa, solid contours), 850-hPa wind (>30 kt, barbs), and precipitable water (mm, dashed contours)
19 Composite Summary: HP_neutral_cutoff

20 Composite Summary: LP_neutral_cutoff
21 Composite Summary Location of 500-hPa cutoff cyclone center largely determines precipitation amount HP cutoff cyclones located over eastern Great Lakes LP cutoff cyclones located over the precipitation domain NP cutoff cyclones located to the northeast of the precipitation domain Location of heaviest precipitation varies Eastern quadrant for HP cutoff cyclones Western quadrants for LP cutoff cyclones HP cutoff cyclone composites indicate favorable forcing for ascent in the exit region of the upper-level jet streak and moisture transport at low levels over the precipitation domain
22 Case Study 1 4 January 2010 Cutoff Cyclone
23 Overview Long duration event (cutoff cyclone in domain for ~60 h) Cutoff cyclone stalled over the Atlantic and retrograded into the Gulf of Maine Record-breaking snowfall was observed at Burlington, VT with an event total of 37.6 in. Numerical models showed considerable variability leading up to the event Just prior to the event, the NAM seemed to capture the terrain enhancement well but QPF amounts were too high


24 Track and Precipitation Distribution mm 1 4 January hPa mean geo. heights (dam) and track of cutoff cyclone every 6 h 1 4 January day NPVU QPE (mm)
25 Daily Precipitation Distributions mm 1 January 2 January 3 January 4 January 24-h NPVU QPE (mm)
26 2 January 2010 mm 24-h NPVU QPE (mm) ending 1200 UTC 3 January 2010

, and divergence (10 5 s 1, dashed")
27 2 January 2010: 250 hpa 0000 UTC 3 January 0600 UTC 3 January m s hPa geo. height (dam, solid contours), wind (m s 1, shaded), and divergence (10 5 s 1, dashed contours)
, and 250-hPa geo.")
28 2 January 2010: 250 hpa 0000 UTC 3 January Standardized anomalies of 250-hPa zonal wind (σ, shaded), and 250-hPa geo. height (dam, solid contours) σ

, and wind (kt,")
29 2 January 2010: 500 hpa 0000 UTC 3 January 0600 UTC 3 January 10 5 s hPa geo. height (dam, solid contours), absolute vorticity (10 5 s 1, shaded), and wind (kt, barbs)
 1 (3 h) 1, shaded], potential temperature (K, solid contours), and wind")
30 2 January 2010: 925 hpa 0000 UTC 3 January 0600 UTC 3 January K (100 km) 1 (3 h) hPa frontogenesis [K (100 km) 1 (3 h) 1, shaded], potential temperature (K, solid contours), and wind (kt, barbs)

31 2 January 2010: 850 hpa 0000 UTC 3 January Standardized anomalies of precipitable water (σ, shaded), 850-hPa geo. height (dam, solid contours), wind (kt, barbs), and precipitable water (mm, dashed contours) σ
 and surface")
32 2 January 2010: Radar dbz 1000 UTC 3 January Base reflectivity (dbz) and surface observations
33 2 January 2010 Summary (1 of 2) Two primary regions of moderate precipitation (10 20 mm) 1) Precipitation throughout Maine was enhanced by favorable forcing for ascent in the exit region of an easterly jet streak poleward of the cutoff cyclone northeasterly low-level flow advecting anomalous (+1 to +3σ) moisture into the region frontogenesis along a southwestward-moving warm front
34 2 January 2010 Summary (2 of 2) Two primary regions of moderate precipitation (10 20 mm) 2) Precipitation across northern portions of New York, Vermont, and New Hampshire was primarily associated with a westward-moving lobe of cyclonic absolute vorticity advection upslope flow along the western slopes of the Berkshires and Green Mountains

35 2 January 2010 Conceptual Summary
36 3 January 2010 mm 24-h NPVU QPE (mm) ending 1200 UTC 4 January 2010
, temperature ( C, shaded), and wind (>30 kt,")
37 1800 UTC 3 3 January 2010: UTC hpa 4 January C 1200 UTC 3 January 850-hPa geo. height (dam, solid contours), temperature ( C, shaded), and wind (>30 kt, barbs)
 and surface")
38 3 January 2010: Radar dbz 1300 UTC 3 January Base reflectivity (dbz) and surface observations
39 3 January 2010 Summary Synoptic-scale forcing persisted, contributing to light precipitation amounts in southern New England Low-level flow was modified by the terrain effects and lakeeffect enhancement Precipitation in western New York was primarily due to northwesterly low-level flow, resulting in lake-effect snow bands off of Lakes Erie and Ontario Precipitation along the New York/Vermont border was associated with low-level channeling flow through the Champlain Valley providing favorable conditions for a lake-effect snow band ongoing enhanced precipitation along the western slopes of the Green Mountains
40 Conclusions Use of conceptual models may increase situational awareness in forecasting precipitation distributions associated with cool-season 500-hPa cutoff cyclones Key factors influencing precipitation: Location of 500-hPa cutoff cyclone center Support for ascent provided by an upper-level jet streak Onshore low-level flow contributing to moisture transport Surface boundaries acting to locally enhance precipitation Low-level flow can be modified by the topography of the NE resulting in enhancement or suppression of precipitation in the vicinity of higher terrain
41 Acknowledgements Lance Bosart and Dan Keyser NWS Focal Points Tom Wasula and Neil Stuart Matt Scalora My fellow graduate students Jonas, Jay, Tom, Ben, Heather, Nick, Alan, Tim, and Scott My professors Paul, Mathias, Vince, Ryan, Chris Kevin Tyle Patti Seguin, Maria Moon, and Barbara Zampella My family and Steve
42 References Aiyyer, A.R., and E.H. Atallah, 2002: Precipitation associated with 500 hpa closed cyclones. 4 th Northeast Operational Regional Workshop, 5 6 November 2002, Albany, NY. Fracasso, A.R., 2004: Case studies of cool season 500 hpa cutoff cyclone precipitation distribution. Masters of Science Thesis, Department of Earth and Atmospheric Sciences, University at Albany/SUNY, Albany, NY, 121 pp. Hsieh, Y.P., 1949: An investigation of a selected cold vortex over North America. J. Meteor., 6, Klein, W.H., D.L. Jorgensen, and A.F. Korte, 1968: Relation between upper air lows and winter precipitation in the western plateau states. Mon. Wea. Rev., 96, Scalora, M., 2009: Forecasting distributions of warm-season precipitation associated with 500-hPa cutoff cyclones. Masters of Science Thesis, Department of Atmospheric and Environmental Sciences, University at Albany/SUNY, Albany, NY, 146 pp.
43

44 Composite Summary: NP_neutral

, and Q-vector")
45 2 January 2010: 700 hpa 0000 UTC 3 January 0600 UTC 3 January Pa m 2 s hPa geo. height (dam, solid contours), temperature ( C, dashed contours), Q vectors (>5 x 10 7 Pa m 1 s 1, arrows), and Q-vector convergence/divergence (10 12 Pa m 2 s 1, shaded)
, and omega (μb s 1, dashed contours; red-upward,")
46 2 January 2010: Cross-section K (100 km) 1 (3 h) UTC 3 January Frontogenesis [K (100 km) 1 (3 h) 1, shaded], potential temperature (K, solid contours), and omega (μb s 1, dashed contours; red-upward, blue-downward)
The Collaborative Science, Technology, and Applied Research (CSTAR) Program. Title:
 Program. Title:") The Collaborative Science, Technology, and Applied Research (CSTAR) Program Title: Cooperative Research with the National Weather Service on Cool- and Warm-Season Precipitation Forecasting over the Northeastern
The Collaborative Science, Technology, and Applied Research (CSTAR) Program Title: Cooperative Research with the National Weather Service on Cool- and Warm-Season Precipitation Forecasting over the Northeastern
Appalachian Lee Troughs and their Association with Severe Thunderstorms
 Appalachian Lee Troughs and their Association with Severe Thunderstorms Daniel B. Thompson, Lance F. Bosart and Daniel Keyser Department of Atmospheric and Environmental Sciences University at Albany/SUNY,
Multiscale Analyses of Inland Tropical Cyclone Midlatitude Jet Interactions: Camille (1969) and Danny (1997)
 and Danny (1997)") Multiscale Analyses of Inland Tropical Cyclone Midlatitude Jet Interactions: Camille (1969) and Danny (1997) Matthew Potter, Lance Bosart, and Daniel Keyser Department of Atmospheric and Environmental
Multiscale Analyses of Inland Tropical Cyclone Midlatitude Jet Interactions: Camille (1969) and Danny (1997) Matthew Potter, Lance Bosart, and Daniel Keyser Department of Atmospheric and Environmental
Early May Cut-off low and Mid-Atlantic rains
 Abstract: Early May Cut-off low and Mid-Atlantic rains By Richard H. Grumm National Weather Service State College, PA A deep 500 hpa cutoff developed in the southern Plains on 3 May 2013. It produced a
Forecasting Precipitation Distributions. Associated with Cool-Season 500-hPa Cutoff Cyclones. in the Northeastern United States.
 Forecasting Precipitation Distributions Associated with Cool-Season 500-hPa Cutoff Cyclones in the Northeastern United States Abstract of a thesis presented to the Faculty of the University at Albany,
The Collaborative Science, Technology, and Applied Research (CSTAR) Program. Title:
 Program. Title:") The Collaborative Science, Technology, and Applied Research (CSTAR) Program Title: Cooperative Research with the National Weather Service on Cool- and Warm-Season Precipitation Forecasting over the Northeastern
The Collaborative Science, Technology, and Applied Research (CSTAR) Program Title: Cooperative Research with the National Weather Service on Cool- and Warm-Season Precipitation Forecasting over the Northeastern
Northeastern United States Snowstorm of 9 February 2017
 Northeastern United States Snowstorm of 9 February 2017 By Richard H. Grumm and Charles Ross National Weather Service State College, PA 1. Overview A strong shortwave produced a stripe of precipitation
Summary of November Central U.S. Winter Storm By Christopher Hedge
 Summary of November 12-13 2010 Central U.S. Winter Storm By Christopher Hedge Event Overview The first significant snowfall of the 2010-2011 season affected portions of the plains and upper Mississippi
National Weather Service-Pennsylvania State University Weather Events
 National Weather Service-Pennsylvania State University Weather Events Heavy rainfall of 23 November 2011 by Richard H. Grumm National Weather Service State College PA 16803 Abstract:. A fast moving mid-tropospheric
Impacts of the April 2013 Mean trough over central North America
 Impacts of the April 2013 Mean trough over central North America By Richard H. Grumm National Weather Service State College, PA Abstract: The mean 500 hpa flow over North America featured a trough over
Synoptic Meteorology II: Frontogenesis Examples Figure 1
 Synoptic Meteorology II: Frontogenesis Examples The below images, taken from the 1200 UTC 17 January 2019 GFS forecast run, provide examples of the contributions of deformation and divergence to frontogenesis.
and 24 mm, hPa lapse rates between 3 and 4 K km 1, lifted index values
 3.2 Composite analysis 3.2.1 Pure gradient composites The composite initial NE report in the pure gradient northwest composite (N = 32) occurs where the mean sea level pressure (MSLP) gradient is strongest
Memorial Day Weekend 2013: Snow and Cold
 Abstract: Memorial Day Weekend 2013: Snow and Cold By Richard H. Grumm National Weather Service State College, PA A slow moving 500 hpa low and associated unseasonably cold air in the lower troposphere
The Impact of the Extratropical Transition of Typhoon Dale (1996) on the Early Wintertime Stratospheric Circulation
 on the Early Wintertime Stratospheric Circulation") The Impact of the Extratropical Transition of Typhoon Dale (1996) on the Early 1996-97 Wintertime Stratospheric Circulation Andrea L. Lang 1, Jason M. Cordeira 2, Lance F. Bosart 1 and Daniel Keyser 1
The Impact of the Extratropical Transition of Typhoon Dale (1996) on the Early 1996-97 Wintertime Stratospheric Circulation Andrea L. Lang 1, Jason M. Cordeira 2, Lance F. Bosart 1 and Daniel Keyser 1
5A.3 THE USE OF ENSEMBLE AND ANOMALY DATA TO ANTICIPATE EXTREME FLOOD EVENTS IN THE NORTHEASTERN U.S.
 5A.3 THE USE OF ENSEMBLE AND ANOMALY DATA TO ANTICIPATE EXTREME FLOOD EVENTS IN THE NORTHEASTERN U.S. Neil A. Stuart(1), Richard H. Grumm(2), John Cannon(3), and Walt Drag(4) (1)NOAA/National Weather Service,
Pre-Christmas Warm-up December 2013-Draft
 Pre-Christmas Warm-up 21-23 December 2013-Draft By Richard H. Grumm National Weather Service State College, PA 1. Overview A large ridge over the west-central Atlantic (Fig.1) and trough moving into eastern
National Weather Service-Pennsylvania State University Weather Events
 National Weather Service-Pennsylvania State University Weather Events Abstract: West Coast Heavy Precipitation Event of January 2012 by Richard H. Grumm National Weather Service State College PA 16803
Heavy Rainfall Event of June 2013
 Heavy Rainfall Event of 10-11 June 2013 By Richard H. Grumm National Weather Service State College, PA 1. Overview A 500 hpa short-wave moved over the eastern United States (Fig. 1) brought a surge of
Winter Storm of 15 December 2005 By Richard H. Grumm National Weather Service Office State College, PA 16803
 Winter Storm of 15 December 2005 By Richard H. Grumm National Weather Service Office State College, PA 16803 1. INTRODUCTION A complex winter storm brought snow, sleet, and freezing rain to central Pennsylvania.
Shawn M. Milrad Atmospheric Science Program Department of Geography University of Kansas Lawrence, Kansas
 Shawn M. Milrad Atmospheric Science Program Department of Geography University of Kansas Lawrence, Kansas Eyad H. Atallah and John R. Gyakum Department of Atmospheric and Oceanic Sciences McGill University
Hurricane Harvey the Name says it all. by Richard H. Grumm and Charles Ross National Weather Service office State College, PA
 Hurricane Harvey the Name says it all by Richard H. Grumm and Charles Ross National Weather Service office State College, PA 16803. 1. Overview Hurricane Harvey crossed the Texas coast (Fig. 1) as a category
Tropical Storm Hermine: Heavy rainfall in western Gulf By Richard H. Grumm National Weather Service Office State College, PA 16803
 Tropical Storm Hermine: Heavy rainfall in western Gulf By Richard H. Grumm National Weather Service Office State College, PA 16803 1. INTRODUCTION Tropical storm Hermine, the eighth named tropical system
The Father s Day 2002 Severe Weather Outbreak across New York and Western New England
 P 1.5 22nd Conference on Severe Local Storms Hyannis, MA, 4-8 October 2004 The Father s Day 2002 Severe Weather Outbreak across New York and Western New England Thomas A. Wasula NOAA/National Weather Service,
Eastern United States Ice Storm of December 2008 By Richard H. Grumm National Weather Service State College, PA 16803
 Eastern United States Ice Storm of 11-12 December 2008 By Richard H. Grumm National Weather Service State College, PA 16803 1. INTRODUCTION A significant ice storm affected the eastern United States on
Summary of High Wind Event of 7 March 2004
 Summary of High Wind Event of 7 March 2004 This event was characterized by a very strong jet streak that developed over North Carolina by 00 UTC 8 March, as seen in the Eta model analysis at 300 mb, with
National Weather Service-Pennsylvania State University Weather Events
 National Weather Service-Pennsylvania State University Weather Events Historic Ohio Valley January Severe weather and Tornado Event by Richard H. Grumm National Weather Service State College PA 16803 and
1. INTRODUCTION: 2. DATA AND METHODOLOGY:
 27th Conference on Hurricanes and Tropical Meteorology, 24-28 April 2006, Monterey, CA 3A.4 SUPERTYPHOON DALE (1996): A REMARKABLE STORM FROM BIRTH THROUGH EXTRATROPICAL TRANSITION TO EXPLOSIVE REINTENSIFICATION
Heavy rains and precipitable water anomalies August 2010 By Richard H. Grumm And Jason Krekeler National Weather Service State College, PA 16803
 Heavy rains and precipitable water anomalies 17-19 August 2010 By Richard H. Grumm And Jason Krekeler National Weather Service State College, PA 16803 1. INTRODUCTION Heavy rain fell over the Gulf States,
P9.5 An Application of a Cutoff Low Forecaster Pattern Recognition Model to the 30 June - 2 July 2009 Significant Event for the Northeast
 P9.5 An Application of a Cutoff Low Forecaster Pattern Recognition Model to the 30 June - 2 July 2009 Significant Event for the Northeast Thomas A. Wasula* and Neil A. Stuart NOAA/National Weather Service,
Mid Atlantic Heavy rainfall event 1. Overview 2. Methods and Data 3. Pattern
 1. Overview Mid Atlantic Heavy rainfall event With an inertial gravity wave? By Richard H. Grumm National Weather Service, State College, PA 16803 Contributions from the Albany MAP An unseasonably strong
2 July 2013 Flash Flood Event
 2 July 2013 Flash Flood Event By Richard H. Grumm and Charles Ross National Weather Service State College, PA 1. Overview A retrograding 500 hpa cyclone and anticyclone (Fig. 1) set up deep southerly flow
Severe Weather with a strong cold front: 2-3 April 2006 By Richard H. Grumm National Weather Service Office State College, PA 16803
 Severe Weather with a strong cold front: 2-3 April 2006 By Richard H. Grumm National Weather Service Office State College, PA 16803 1. INTRODUCTION A strong cold front brought severe weather to much of
Warm Episode over Indian Sub-continent March 2010 By Richard Grumm National Weather Service State College Contributions by Lance Bosart SUNY Albany
 Warm Episode over Indian Sub-continent March 2010 By Richard Grumm National Weather Service State College Contributions by Lance Bosart SUNY Albany 1. INTRODUCTION A massive subtropical ridge formed over
11B.1 INFLUENCE OF DIABATIC POTENTIAL VORTICITY ANOMALIES UPON WARM CONVEYOR BELT FLOW. PART I: FEBRUARY 2003
 INFLUENCE OF DIABATIC POTENTIAL VORTICITY ANOMALIES UPON WARM CONVEYOR BELT FLOW. PART I: 14-15 FEBRUARY 2003 Philip N. Schumacher, NOAA/NWS, Sioux Falls, SD Joshua M. Boustead, NOAA/NWS, Valley, NE Martin
New Zealand Heavy Rainfall and Floods
 New Zealand Heavy Rainfall and Floods 1. Introduction Three days of heavy rainfall associated with a deep upper-level low (Fig. 1) brought flooding to portions of New Zealand (Fig. 2). The flooding was
Final Examination, MEA 443 Fall 2008, Lackmann
 Place an X here to count it double! Name: Final Examination, MEA 443 Fall 2008, Lackmann If you wish to have the final exam count double and replace your midterm score, place an X in the box above. As
1. INTRODUCTION. For brevity times are referred to in the format of 20/1800 for 20 August UTC. 3. RESULTS
 Heavy rains and precipitable water anomalies 20-23 August 2010-Draft By Jason Krekeler And Richard Grumm National Weather Service State College, PA 16803 1. INTRODUCTION Heavy rain fell across the central
Synoptic Meteorology II: Petterssen-Sutcliffe Development Theory Application March 2015
 Synoptic Meteorology II: Petterssen-Sutcliffe Development Theory Application 10-12 March 2015 In our lecture on Petterssen-Sutcliffe Development Theory, we outlined the principle of selfdevelopment in
Joshua M. Boustead *1 NOAA/NWS WFO Omaha/Valley, NE. Philip N. Schumacher NOAA/NWS WFO Sioux Falls, SD
 11B.2 Influence of Diabatic Potential Vorticity Anomalies upon Warm Conveyor Belt Flow. Part II: 3-5 January 2005 Joshua M. Boustead *1 NOAA/NWS WFO Omaha/Valley, NE Philip N. Schumacher NOAA/NWS WFO Sioux
Low-end derecho of 19 August 2017
 Low-end derecho of 19 August 2017 By Richard H. Grumm and Charles Ross National Weather Service State College, PA 1. Overview A cluster of thunderstorms developed in eastern Ohio around 1800 UTC on 19
The Long-lived eastern US tornadic supercell of 20 July 2017
 1. Overview The Long-lived eastern US tornadic supercell of 20 July 2017 By Richard H. Grumm and Elissa A Smith National Weather Service State College, PA A long lived supercell developed near the eastern
National Weather Service-Pennsylvania State University Weather Events
 National Weather Service-Pennsylvania State University Weather Events Heavy Rain 7-8 December 2011 by Richard H. Grumm National Weather Service State College PA 16803 Abstract:. A mid-level short-wave
Influence of Topography on Convective. Patterns across the Greater Capital Region of. New York
 Influence of Topography on Convective Patterns across the Greater Capital Region of New York Honors College Undergraduate Research Thesis (8 May 2016) Rachel O Donnell and Professor Brian Tang Department
NWS-PSU Case Study Site 2010 Severe Weather Case
 NWS-PSU Case Study Site 2010 Severe Weather Case New Years Eve Severe Weather Event of 31 December 2010 by Richard H. Grumm National Weather Service State College PA 16083 Abstract: A surge of warm humid
MET 3502 Synoptic Meteorology. Lecture 8: September 16, AIRMASSES, FRONTS and FRONTAL ANALYSIS (2)
") MET 3502 Synoptic Meteorology Lecture 8: September 16, 2010 AIRMASSES, FRONTS and FRONTAL ANALYSIS (2) Identifying a cold front on a surface weather map: 1. Surface front is located at the leading edge
MET 3502 Synoptic Meteorology Lecture 8: September 16, 2010 AIRMASSES, FRONTS and FRONTAL ANALYSIS (2) Identifying a cold front on a surface weather map: 1. Surface front is located at the leading edge
Subtropical and Hybrid Systems IWTC VII Topic 1.6
 Subtropical and Hybrid Systems IWTC VII Topic 1.6 John R. Gyakum Department of Atmospheric and Oceanic Sciences McGill University, Montreal Canada Working group: John L. Beven II, Lance F. Bosart, Fermin
Mesoscale Frontal Waves Associated with Landfalling Atmospheric Rivers
 Mesoscale Frontal Waves Associated with Landfalling Atmospheric Rivers FIRO Science Task Group Workshop May 30, 2017 Andrew Martin, Brian Kawzenuk, Julie Kalansky, Anna Wilson, F. Martin Ralph Contacts:
Quasi-Geostrophic Implications
 Chapter 10 Quasi-Geostrophic Implications When you look at a weather chart with all its isolines and plotted data, you need a framework upon which to interpret what you see. Quasi-geostrophic theory provides
MJO Influence in Continental United States Temperatures
 MJO Influence in Continental United States Temperatures An honors thesis presented to the Department of Atmospheric Science, University at Albany, State University Of New York in partial fulfillment of
TC Danny formed as a tropical depression in the northern Gulf of Mexico at 1200
 4. TC Danny Multiscale Analysis 4.1. Introduction 4.1.1. TC Track TC Danny formed as a tropical depression in the northern Gulf of Mexico at 1200 UTC 16 July 1997 and then slowly moved toward the northeast
The southern express: Winter storm of January 2010 By Richard H. Grumm National Weather Service
 The southern express: Winter storm of 28-30 January 2010 By Richard H. Grumm National Weather Service 1. INTRODUCTION A storm system of Pacific origin tracked across the southern United States from 27-31
Tropical Waves. John Cangialosi and Lixion Avila National Hurricane Center. WMO Region IV Tropical Cyclone Workshop
 Tropical Waves John Cangialosi and Lixion Avila National Hurricane Center WMO Region IV Tropical Cyclone Workshop Outline Basic definition Schematic diagrams/interactions Operational products/forecasts
Lec 10: Interpreting Weather Maps
 Lec 10: Interpreting Weather Maps Case Study: October 2011 Nor easter FIU MET 3502 Synoptic Hurricane Forecasts Genesis: on large scale weather maps or satellite images, look for tropical waves (Africa
Minor Winter Flooding Event in northwestern Pennsylvania January 2017
 1. Overview Minor Winter Flooding Event in northwestern Pennsylvania 12-13 January 2017 By Richard H. Grumm National Weather Service State College, PA A combination of snow melt, frozen ground, and areas
General Circulation. Nili Harnik DEES, Lamont-Doherty Earth Observatory
 General Circulation Nili Harnik DEES, Lamont-Doherty Earth Observatory nili@ldeo.columbia.edu Latitudinal Radiation Imbalance The annual mean, averaged around latitude circles, of the balance between the
Thanksgiving Eve snow of November 2014
 1. Overview Thanksgiving Eve snow of 26-27 November 2014 By Richard H. Grumm National Weather Service State College, PA An early season east coast winter storm (ECWS: DeGaetano et al. 2002) brought snow
Multi-day severe event of May 2013
 Abstract: Multi-day severe event of 18-22 May 2013 By Richard H. Grumm and Charles Ross National Weather Service State College, PA A relatively slow moving Trough over the western United States and a ridge
National Weather Service-Pennsylvania State University Weather Events
 National Weather Service-Pennsylvania State University Weather Events The southern Express: High Impact Spring Storm of 14-17 April 2011 by Richard H. Grumm National Weather Service State College PA 16803
Mid Atlantic Severe Event of 1 May 2017 Central Pennsylvania QLCS event By Richard H. Grumm National Weather Service, State College, PA 16803
 1. Overview Mid Atlantic Severe Event of 1 May 2017 Central Pennsylvania QLCS event By Richard H. Grumm National Weather Service, State College, PA 16803 A strong upper-level wave (Fig.1) moving into a
1. INTRODUCTION * Figure 1. National Weather Service Storm Prediction Center (SPC) storm reports for December 1, 2006.
 storm reports for December 1, 2006.") P1.14 FORECAST ISSUES RELATED TO THE UNPRECEDENTED SEVERE AND HIGH WIND EVENT OF DECEMBER 2006 by Greg A. DeVoir* and Richard H. Grumm National Weather Service Office State College, PA 16803 1. INTRODUCTION
P1.14 FORECAST ISSUES RELATED TO THE UNPRECEDENTED SEVERE AND HIGH WIND EVENT OF DECEMBER 2006 by Greg A. DeVoir* and Richard H. Grumm National Weather Service Office State College, PA 16803 1. INTRODUCTION
Eastern United States Wild Weather April 2014-Draft
 1. Overview Eastern United States Wild Weather 27-30 April 2014-Draft Significant quantitative precipitation bust By Richard H. Grumm National Weather Service State College, PA and Joel Maruschak Over
The Collaborative Science, Technology, and Applied Research (CSTAR) Program. Title:
 Program. Title:") The Collaborative Science, Technology, and Applied Research (CSTAR) Program Title: Continuing Studies of Cool- and Warm-Season Precipitation Events over the Northeastern United States University: University
The Collaborative Science, Technology, and Applied Research (CSTAR) Program Title: Continuing Studies of Cool- and Warm-Season Precipitation Events over the Northeastern United States University: University
P3.17 THE DEVELOPMENT OF MULTIPLE LOW-LEVEL MESOCYCLONES WITHIN A SUPERCELL. Joshua M. Boustead *1 NOAA/NWS Weather Forecast Office, Topeka, KS
 P3.17 THE DEVELOPMENT OF MULTIPLE LOW-LEVEL MESOCYCLONES WITHIN A SUPERCELL Joshua M. Boustead *1 NOAA/NWS Weather Forecast Office, Topeka, KS Philip N. Schumacher NOAA/NWS Weather Forecaster Office, Sioux
National Weather Service-Pennsylvania State University Weather Events
 National Weather Service-Pennsylvania State University Weather Events Eastern United States Winter Storm and Severe Event of 28-29 February 2012 by Richard H. Grumm National Weather Service State College
Orographically enhanced heavy rainfall of 23 May 2010 By Richard H. Grumm National Weather Service Office State College, PA 16803
 Orographically enhanced heavy rainfall of 23 May 2010 By Richard H. Grumm National Weather Service Office State College, PA 16803 1. INTRODUCTION During the overnight hours and into the early morning of
Winter Storm of February 2008 By Richard H. Grumm National Weather Service Office State College PA 16803
 1. INTRODUCTION Winter Storm of 11-13 February 2008 By Richard H. Grumm National Weather Service Office State College PA 16803 A potent winter storm brought snow, sleet, freezing rain, and rain to the
CPTEC and NCEP Model Forecast Drift and South America during the Southern Hemisphere Summer
 CPTEC and NCEP Model Forecast Drift and South America during the Southern Hemisphere Summer José Antonio Aravéquia 1 Pedro L. Silva Dias 2 (1) Center for Weather Forecasting and Climate Research National
Utilizing Ensemble-based Anomalies to Anticipate Significant Events A New Display Tool
 Utilizing Ensemble-based Anomalies to Anticipate Significant Events A New Display Tool Randy Graham 1, Rich Grumm 2, Nanette Hosenfeld 1, Trevor Alcott 3 1 NOAA/NWS Salt Lake City UT 2 NOAA/NWS State College
National Weather Service-Pennsylvania State University Weather Events
 National Weather Service-Pennsylvania State University Weather Events Southern Express 18-19 February 2012: Probabilities, Potentials and uncertainty by Richard H. Grumm National Weather Service State
The Impact of air-sea interaction on the extratropical transition of tropical cyclones
 The Impact of air-sea interaction on the extratropical transition of tropical cyclones Sarah Jones Institut für Meteorologie und Klimaforschung Universität Karlsruhe / Forschungszentrum Karlsruhe 1. Introduction
Benjamin J. Moore. Education. Professional experience
 Benjamin J. Moore Department of Atmospheric and Environmental Sciences University at Albany, State University of New York 1400 Washington Avenue Albany, New York, 12222 phone: +1 507 398 7427 email: bjmoore@albany.edu
The Collaborative Science, Technology, and Applied Research (CSTAR) Program. Title:
 Program. Title:") The Collaborative Science, Technology, and Applied Research (CSTAR) Program Title: Continuing Studies of Cool- and Warm-Season Precipitation Events over the Northeastern United States and Cooperative Research
The Collaborative Science, Technology, and Applied Research (CSTAR) Program Title: Continuing Studies of Cool- and Warm-Season Precipitation Events over the Northeastern United States and Cooperative Research
Lower-Tropospheric Height Tendencies Associated with the Shearwise and Transverse Components of Quasigeostrophic Vertical Motion
 JULY 2007 N O T E S A N D C O R R E S P O N D E N C E 2803 Lower-Tropospheric Height Tendencies Associated with the Shearwise and Transverse Components of Quasigeostrophic Vertical Motion JONATHAN E. MARTIN
10B.2 THE ROLE OF THE OCCLUSION PROCESS IN THE EXTRATROPICAL-TO-TROPICAL TRANSITION OF ATLANTIC HURRICANE KAREN
 10B.2 THE ROLE OF THE OCCLUSION PROCESS IN THE EXTRATROPICAL-TO-TROPICAL TRANSITION OF ATLANTIC HURRICANE KAREN Andrew L. Hulme* and Jonathan E. Martin University of Wisconsin-Madison, Madison, Wisconsin
Global Wind Patterns
 Name: Earth Science: Date: Period: Global Wind Patterns 1. Which factor causes global wind patterns? a. changes in the distance between Earth and the Moon b. unequal heating of Earth s surface by the Sun
The feature of atmospheric circulation in the extremely warm winter 2006/2007
 The feature of atmospheric circulation in the extremely warm winter 2006/2007 Hiroshi Hasegawa 1, Yayoi Harada 1, Hiroshi Nakamigawa 1, Atsushi Goto 1 1 Climate Prediction Division, Japan Meteorological
The Devastating Western European Winter Storm February 2010 By Richard H. Grumm National Weather Service
 The Devastating Western European Winter Storm 27-28 February 2010 By Richard H. Grumm National Weather Service 1. INTRODUCTION A strong late winter storm, called Xynthia 1, raced across Western Europe
Thanksgiving Snow and Arctic Front 25 November 2005 By Richard H. Grumm National Weather Service State College, PA 16801
 Thanksgiving Snow and Arctic Front 25 November 2005 By Richard H. Grumm National Weather Service State College, PA 16801 1. INTRODUCTION An approaching arctic front brought light snow to most of western
Satellites, Weather and Climate Module??: Polar Vortex
 Satellites, Weather and Climate Module??: Polar Vortex SWAC Jan 2014 AKA Circumpolar Vortex Science or Hype? Will there be one this year? Today s objectives Pre and Post exams What is the Polar Vortex
CASE STUDY OF THE NOVEMBER WINDSTORM IN SOUTH CENTRAL COLORADO
 32 CASE STUDY OF THE 12-13 NOVEMBER WINDSTORM IN SOUTH CENTRAL COLORADO Paul Wolyn * NOAA/NWS Pueblo, CO 1. INTRODUCTION During the evening and early morning of 12-13 November 2011, a damaging downslope
The Deep South snowfall of February 2010 By Richard H. Grumm National Weather Service Office, State College, PA 16803
 The Deep South snowfall of 11-13 February 2010 By Richard H. Grumm National Weather Service Office, State College, PA 16803 1. INTRODUCTION A surface cyclone tracked across Mexico and the Gulf of Mexico
SUPPLEMENTARY INFORMATION
 Figure S1. Summary of the climatic responses to the Gulf Stream. On the offshore flank of the SST front (black dashed curve) of the Gulf Stream (green long arrow), surface wind convergence associated with
ENSO Cycle: Recent Evolution, Current Status and Predictions. Update prepared by Climate Prediction Center / NCEP 23 April 2012
 ENSO Cycle: Recent Evolution, Current Status and Predictions Update prepared by Climate Prediction Center / NCEP 23 April 2012 Outline Overview Recent Evolution and Current Conditions Oceanic Niño Index
P2.4 THE IMPACT OF TROPICAL CYCLONE REMNANTS ON THE RAINFALL OF THE NORTH AMERICAN SOUTHWEST REGION
 P2.4 THE IMPACT OF TROPICAL CYCLONE REMNANTS ON THE RAINFALL OF THE NORTH AMERICAN SOUTHWEST REGION by Elizabeth A. Ritchie 1 and David Szenasi University of New Mexico 1. INTRODUCTION New Mexico has a
Deep Cyclone and rapid moving severe weather event of 5-6 June 2010 By Richard H. Grumm National Weather Service Office State College, PA 16803
 Deep Cyclone and rapid moving severe weather event of 5-6 June 2010 By Richard H. Grumm National Weather Service Office State College, PA 16803 1. INTRODUCTION A rapidly deepening surface cyclone raced
1. INTRODUCTION. The super storm of March 1993 produced severe weather and tornadoes as it s trailing cold front pushed through Florida (Kocin eta 1l
 1. INTRODUCTION Super Tuesday and awful Wednesday: the 5-6 February 2008 Severe Weather Outbreak By Richard H. Grumm National Weather Service State College, PA And Seth Binau National Weather Service,
Record snow blankets the United Kingdom 5-6 January 2010
 1. INTRODUCTION Record snow blankets the United Kingdom 5-6 January 2010 By Richard H. Grumm National Weather Service Office State College, PA 16803 A rare winter storm brought heavy snow the United Kingdom
Southern Heavy rain and floods of 8-10 March 2016 by Richard H. Grumm National Weather Service State College, PA 16803
 Southern Heavy rain and floods of 8-10 March 2016 by Richard H. Grumm National Weather Service State College, PA 16803 1. Introduction Heavy rains (Fig. 1) produced record flooding in northeastern Texas
16C.6 Genesis of Atlantic tropical storms from African Easterly Waves a comparison of two contrasting years
 16C.6 Genesis of Atlantic tropical storms from African Easterly Waves a comparison of two contrasting years Susanna Hopsch 1 Department of Earth and Atmospheric Sciences, University at Albany, Albany,
ENSO Cycle: Recent Evolution, Current Status and Predictions. Update prepared by Climate Prediction Center / NCEP 25 February 2013
 ENSO Cycle: Recent Evolution, Current Status and Predictions Update prepared by Climate Prediction Center / NCEP 25 February 2013 Outline Overview Recent Evolution and Current Conditions Oceanic Niño Index
East Coast Heavy Rainfall of January 2010 By Richard H. Grumm National Weather Service
 1. INTRODUCTION A strong storm moved across the United States from 21 January through 25 January 2010 (Fig. 1). This storm produced record rainfall and snowfall in the western United States from 20-22
National Weather Service-Pennsylvania State University Weather Events
 National Weather Service-Pennsylvania State University Weather Events New Zealand heavy rain and flood event-draft by Richard H. Grumm National Weather Service State College PA 16803 Abstract:. A record
Role of Multiple-Level Tropospheric Circulations in Forcing ENSO Winter Precipitation Anomalies
 3102 MONTHLY WEATHER REVIEW Role of Multiple-Level Tropospheric Circulations in Forcing ENSO Winter Precipitation Anomalies SHAWN R. SMITH, PHAEDRA M. GREEN,* ALAN P. LEONARDI, AND JAMES J. O BRIEN Center
ENSO Cycle: Recent Evolution, Current Status and Predictions. Update prepared by Climate Prediction Center / NCEP 5 August 2013
 ENSO Cycle: Recent Evolution, Current Status and Predictions Update prepared by Climate Prediction Center / NCEP 5 August 2013 Outline Overview Recent Evolution and Current Conditions Oceanic Niño Index
The high latitude blocking and impacts on Asia
 The high latitude blocking and impacts on Asia By Richard H. Grumm National Weather Service Office State College, PA 16803 1. INTRODUCTION An episode of high latitude blocking during the month of December
Eastern United States Winter Storm of 1-2 February 2015-DRAFT Northeast Ground Hog Storm
 Eastern United States Winter Storm of 1-2 February 2015-DRAFT Northeast Ground Hog Storm By Richard H. Grumm National Weather Service State College, PA 1. Overview A major Winter Storm brought precipitation
ENSO: Recent Evolution, Current Status and Predictions. Update prepared by: Climate Prediction Center / NCEP 9 November 2015
 ENSO: Recent Evolution, Current Status and Predictions Update prepared by: Climate Prediction Center / NCEP 9 November 2015 Outline Summary Recent Evolution and Current Conditions Oceanic Niño Index (ONI)
ENSO Cycle: Recent Evolution, Current Status and Predictions. Update prepared by Climate Prediction Center / NCEP 15 July 2013
 ENSO Cycle: Recent Evolution, Current Status and Predictions Update prepared by Climate Prediction Center / NCEP 15 July 2013 Outline Overview Recent Evolution and Current Conditions Oceanic Niño Index
L.O Students will learn about factors that influences the environment
 Name L.O Students will learn about factors that influences the environment Date 1. At the present time, glaciers occur mostly in areas of A) high latitude or high altitude B) low latitude or low altitude
Southern United States Winter Storm of 28 January 2014-v1. High Impact Snow on Edge of Forecast Precipitation Shield
 Southern United States Winter Storm of 28 January 2014-v1 High Impact Snow on Edge of Forecast Precipitation Shield by Richard H. Grumm National Weather Service State College, PA 16803 and 1. Introduction