There is evidence of a widespread reduction in solar radiation at the earth s surface, often referred to as global dimming, lasted from the mid-1950s
|
|
|
- Nancy Harrington
- 5 years ago
- Views:
Transcription
1 1
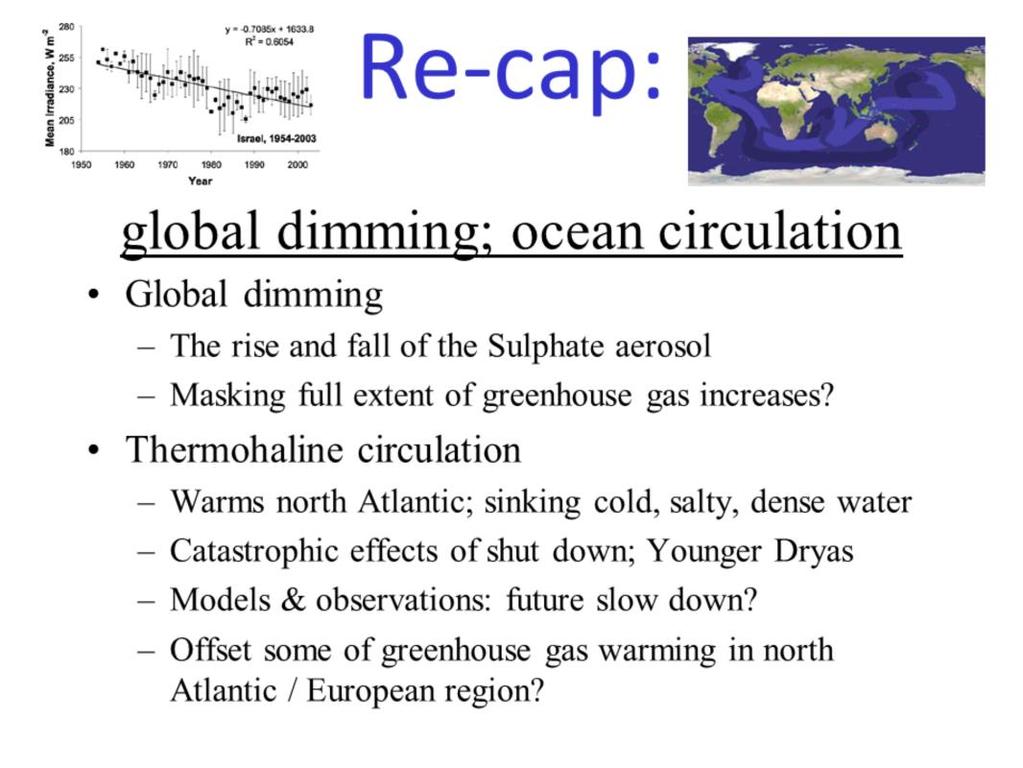
2 There is evidence of a widespread reduction in solar radiation at the earth s surface, often referred to as global dimming, lasted from the mid-1950s until the mid-1980s when a recovery, referred to as global brightening, started. Some evidence suggests that this effect is not so much global as land-based since surface measurements of sunlight are primarily available only over the land. 2
3 Almost as soon as global dimming was generally accepted, scientists discovered global brightening! The downward trends in sunlight at the surface seemed to reverse in the 1980s and become an upward trend. Where was the missing sunlight going? Some of it may have been absorbed in the atmosphere (in which case the Earth still received the suns energy) but satellite measurements suggest that some of the sunlight may have been reflected back to space. What was the likely cause? 3
4 Recent research suggests that the dimming effect may have masked global warming and that the reversal of this trend in the 1990s contributed to the strong warming in this decade (although recovery from the eruption of Mt. Pinatubo and natural fluctuations in the ocean probably also contributed to this). The dimming effect is thought to relate to increases in aerosols, by-products in the combustion of fossil fuels, especially coal. This is backed up by analysing changes in the diurnal temperature range. Aerosols cool the surface in the day so if there are more aerosols one might expect the range in temperatures between night and day reduces with increased aerosol. This was indeed found to have occurred from Since the 1980s, the diurnal temperature range has remained stable suggesting an end to the increase in aerosols. 4

5 The above plot illustrates the influence of industrial emissions on atmospheric sulphate concentrations, which produce negative radiative forcing (cooling influence on climate). Shown is the time history of the concentrations of sulphate, not in the atmosphere but in ice cores in Greenland (shown by lines; from which the episodic effects of volcanic eruptions have been removed). Such data indicate the local deposition of sulphate aerosols at the site, reflecting sulphur dioxide (SO2) emissions at mid-latitudes in the Northern Hemisphere. This record, albeit more regional than that of the globally-mixed greenhouse gases, demonstrates the large growth in anthropogenic SO2 emissions during the Industrial Era. The pluses denote the relevant regional estimated SO2 emissions (right-hand scale). [From IPCC 2001 report] 5

6 Climate model simulations include the changes in Sulphate Aerosols and also simulate global dimming. Recall that the IPCC reports identify that Sulphate aerosols offset the warming effect of greenhouse gas increases although the uncertainty in representing this effect is high, especially concerning the indirect effect on clouds. Interestingly, simulations and basic physics indicate that dimming is also caused by increases in water vapour in the atmosphere as temperatures rise (recall that as well as absorbing thermal infra-red radiation, the gaseous water vapour also absorbs sunlight therefore shading the surface slightly). 6

7 The burning of fossil fuels, in addition to adding CO 2 to the atmosphere, also added Sulphate aerosols. These aerosols have a cooling effect on climate by reflecting some of the sunlight back to space, and consequently depriving the surface of this sunlight. This is the result of the direct effects of the aerosols and their indirect effect on clouds (brighter, more long-lived clouds). The dimming effect was noticed by scientists making measurements of solar raditaion at the surface since the 1950s and has recently been termed global dimming. Following acid rain concerns in the 1980s, pollution acts helped to reduce this aerosol pollution in some regions (e.g. N America, Europe) leading to a reversal of the dimming or brightening. The dimming effect may have masked some of the greenhouse-gas induced warming since the 1960s in some regions although this effect is represented in climate model simulations. 7

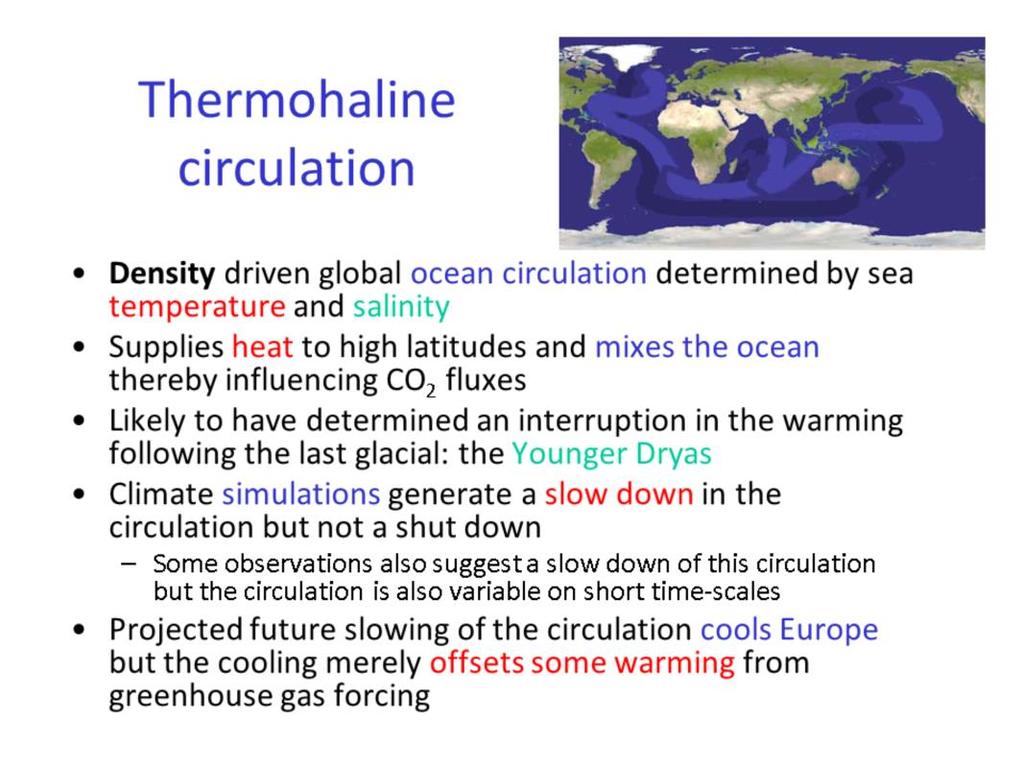
8 The thermohaline circulation (THC) is a term for the global density-driven circulation of the oceans. Derivation is from thermo- for heat and -haline for salt, which together determine the density of sea water. Wind driven surface currents (such as the Gulf Stream) head polewards from the equatorial Atlantic Ocean, cooling and becoming salty through evaporation all the while and eventually sinking at high latitudes (forming North Atlantic Deep Water). This dense water then flows into the ocean basins. Extensive mixing therefore takes place between the ocean basins, reducing differences between them and making the Earth's ocean a global system. On their journey, the water masses transport both energy (in the form of heat) and matter (solids, dissolved substances and gases) around the globe. As such, the state of the circulation has a large impact on the climate of the Earth. 8

9 The thermohaline circulation is sometimes called the ocean conveyor belt, the global conveyor belt, or, most commonly, the meridional overturning circulation (often abbreviated as MOC). The thermohaline circulation is important for climate because it supplies heat to high latitudes and mixes the ocean thereby influencing the amount of carbon dioxide that is absorbed or outgassed. It is one of the reasons why European climate is relatively warm for its latitude but not the only reason. 9

10 There have been some concerns expressed that global warming could lead to massive changes in ocean currents such as the Gulf Stream. Currents in the ocean are responsible for about half the work of the climate system in redistributing heat between the equator and the poles. The current system in the N Atlantic is driven by convection which takes place in two areas, near Labrador and in the Greenland-Iceland-Norway sea. Here, the surface water is cooled by arctic winds, and sinks a few thousand metres to the bottom of the ocean. This cool dense water then flows southwards, with a flow equivalent to a hundred Amazon rivers, crossing the equator and heading south. The sinking cold water in the north has the effect of drawing northwards warm near-surface water from the Gulf of Mexico, which travels across the North Atlantic. 10

11 The warm near-surface current moving north eastwards from the Gulf of Mexico is often called the Gulf Stream, but is more properly referred to as the North Atlantic Drift. The heat which it transports towards north-west Europe is part of the reason why countries such as the British Isles and Norway are a lot warmer than, for example, those parts of western Canada at the same latitudes. This global ocean circulation, which extends to other oceans of the world, is known as the thermohaline circulation (THC), as it is driven by differences in temperature and salinity of the water masses. 11

12 The Younger Dryas saw a rapid return to glacial conditions in the higher latitudes of the Northern Hemisphere between 12,900 11,500 years before present (BP) in sharp contrast to the warming of the preceding interstadial deglaciation. The transitions each occurred over a period of a decade or so. Thermally fractionated nitrogen and argon isotope data from Greenland ice core GISP2 indicates that the summit of Greenland was ~15 C colder than today during the Younger Dryas. In the UK, coleopteran (fossil beetle) evidence suggests mean annual temperature dropped to approximately -5 C, and periglacial conditions prevailed in lowland areas, while icefields and glaciers formed in upland areas. Nothing of the size, extent, or rapidity of this period of abrupt climate change has been experienced since. 12
13 The prevailing theory holds that the Younger Dryas was caused by a significant reduction or shutdown of the North Atlantic thermohaline circulation in response to a sudden influx of fresh water from Lake Agassiz and deglaciation in North America. The global climate would then have become locked into the new state until freezing removed the fresh water "lid" from the north Atlantic Ocean. This theory does not explain why South America cooled first. Previous glacial terminations probably did not have younger-dryas like events, suggesting that whatever the mechanism is, it has a random component [text from Wikipedia]. There is strong evidence that the Gulf Stream has switched off more than once over the last ten thousand years, due to natural causes.. 13

14 The warming of surface waters in the convection areas, due to the man-made greenhouse effect, will reduce their density. We also expect there to be increased rainfall over the convection areas, and this freshwater will also act to reduce the density of surface waters. Increased precipitation in high latitudes in a warmer world will also increase the outflow of fresh water from rivers this has already been observed and, as mentioned earlier, recent work at the Hadley Centre has been able to attribute this to man-made climate change. And lastly, as the amount of sea ice decreases, a further mechanism for driving convection (the seasonal freezing of sea ice which rejects salt and thus make surface waters denser) will also decrease. Climate model simulations indicate (above) that if the thermohaline circulation were to shut off completely, UK temperatures would cool by 3-5 o C but this is highly unlikely. 14
15 The IPCC (2013) states that it is very likely that Atlantic Meridional Overturning ocean circulation will weaken over the 21 st century. However, simulations indicate that it is unlikely to shut down completely. The Hadley Centre climate model experiments above show a weakening of this circulation: larger negative values indicate a stronger circulation (the unit of current strength is a sverdrup, a million cubic metres of water per second). The resulting cooling of the North Atlantic region due to a weakening of the overturning ocean circulation will only offset some of the warming due to increasing concentrations of greenhouse gases. 15
16 Observations suggest that the Atlantic meridional overturning circulation (AMOC) has been slowing down. It is only since 2004 that the Rapid Array has been measuring these changes accurately at 26oN and it remains to be seen whether this decline is part of a longer term trend relating to global warming or part of natural variability of the ocean. 16
17 17
18 18

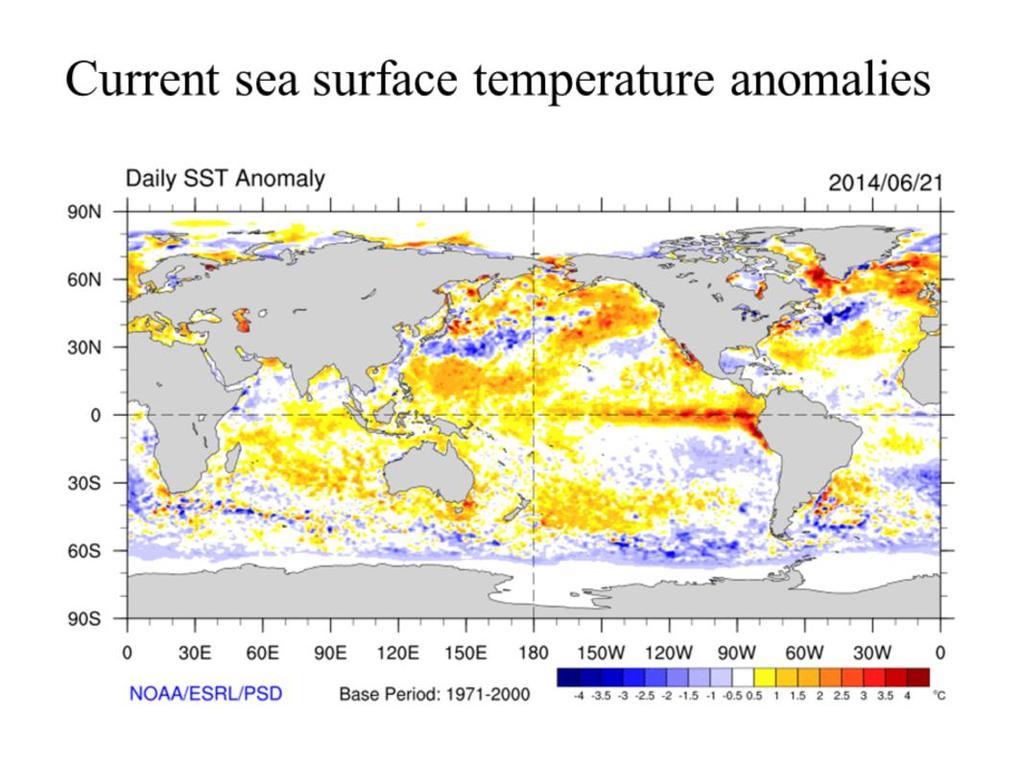
19 El Niño-Southern Oscillation (ENSO) is a global-scale interaction between the atmosphere and the oceans. Its effects are strongest in the Pacific and climate in the southern hemisphere are profound. 19

20 Under normal conditions, trade winds blow from east to west, piling up warm water and associated convective storms over the Indonesian region. The wind-driven ocean currents produce upwelling in the east-pacific, providing cool, nutrient rich water, excellent for fish stocks. Under El Niño conditions, the winds and ocean currents decline and the east Pacific warms. Convection and rain move from Indonesia over the central Pacific and fish stocks decline in the east. There are knock on effects across the globe. Following the rapid decline of El Niño conditions, the system often overshoots to produce a reverse El Niño (or exagerated normal conditions) termed La Niña. 20

21 The changes in ocean temperature and height (dependent on temperature and winds) slops backward and forward in an oscillation from El Niño to la Niña and back again every few years. 21
22 22
23 There have been more La Niña events in the 2000s than the 1980s or 1990s and this probably reflects decadal variability. Recent research also demonstrates that there are different types of El Niño with eastern Pacific events affecting global temperatures more than central Pacific events. The last big El Niño was 1997/98. An El Niño is currently developing (2014); the chaotic nature of these oscillations, involving so many interactions, limits our ability to make predictions. Climate models simulate ongoing El Niño variability in the future. Combined with the projected intensification of droughts and flooding events with warming of climate it is expected that variability associated with El Niño will also become larger and potentially more damaging. 23
24 24
 are causing a perturbation to the carbon balance of the")
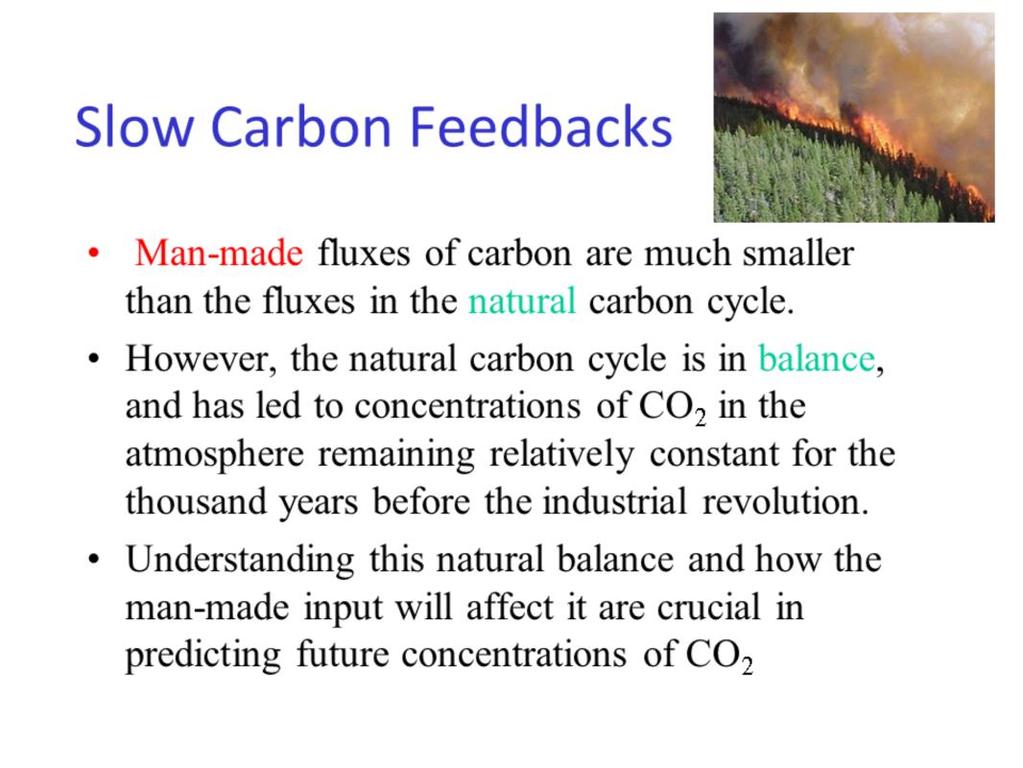
25 The emission of CO 2 into the atmosphere (7.8 Giga tonnes of Carbon, GtC, per year) is small relative to the natural fluxes between land/ocean and atmosphere (170 GtC/year). Crucially, however, the natural carbon budget is in balance, so the emissions of CO 2 from fossil fuel burning (and land use changes) are causing a perturbation to the carbon balance of the atmosphere not seen for more than years based upon ice core measurements. Some of the excess CO 2 in the atmosphere is absorbed by the land and ocean but a large amount is stored in the atmosphere as CO 2. This build up of Carbon in the atmosphere at the rate of 4 GtC per year primarily reflects the increased atmospheric concentrations of CO 2. Changes in this carbon balance in the future may yield a further slow positive feedback to climate change 25
26 Current changes in CO 2 at Mauna Loa (and other measuring stations) show a yearly cycle relating to changes in vegetation and changes in ocean emission and absorption of the gas. Superimposed upon these cycles are a longer term trend; CO 2 concentrations are rising at about 2 parts per million every year. This is faster than any other time over the past million years, based on 850,000 year long ice core records. It is important to be able capture the trend as well as the yearly cycles and also fluctuations relating to the El Nino Southern Oscillation if we are to have confidence in our carbon-cycle models and the resulting slow carbon feedbacks. 26
27 As global temperatures rise, and rainfall patterns change, several changes to carbon absorption are likely to take place. Firstly, in the right conditions, CO 2 fertilises vegetation and speeds up its growth; this will absorb more of our CO 2. Secondly, higher temperatures and more rainfall will encourage growth of high latitude forests, and this will also help to mop up more of our CO 2. However, as soils get warmer, the microbial action which breaks down humus works faster, and this will cause more CO 2 to be emitted into the atmosphere. Lastly, higher temperatures (and thus higher evaporation) and lower rainfall are predicted for some forests in the tropics, and this is predicted to cause them to die back, with their carbon store being returned to the atmosphere. The majority of climate models simulate that the land and ocean will continue to take up carbon in the future. However, a minority of models indicate a decrease in land uptake of carbon (for example see the simulation above) leading to a positive carbon cycle feedback. Over glacial time-scales the carbon cycle feedbacks are positive (amplifying effect on temperature changes). 27
28 28
 and elevated carbon dioxide concentrations it is")
29 The future orbital parameters are predictable. Due to low eccentricity (combination of regular 100,000 and 400,000 cycles) and elevated carbon dioxide concentrations it is unlikely that we will finish the current interglacial for another 50,000 years. 29

30 The Earth is going to be a very different place 250 million years from now. Africa is going to smash into Europe as Australia migrates north to merge with Asia. Meanwhile the Atlantic Ocean will probably widen for a spell before it reverses course and later disappears. The formation of a new super-continent is suggested by some scientists although this is highly uncertain. What will this mean for climate? There are 3 factors that are thought to make ice ages more likely: 1) A continent sits on top of a pole, as Antarctica does today. 2) A polar sea is almost land-locked, as the Arctic Ocean is today. 3) A supercontinent covers most of the equator, as Rodinia did during the Cryogenian period. Since the above suggested configuration of the continents meets precisely none of these criteria, it is unlikely that this hypothesised period will be too parky! In addition, the sun is likely to become slowly brighter over the next 5 billion years, producing a warming trend. A very long forecast 30
31 31

32 32
Weather & Ocean Currents
 Weather & Ocean Currents Earth is heated unevenly Causes: Earth is round Earth is tilted on an axis Earth s orbit is eliptical Effects: Convection = vertical circular currents caused by temperature differences
Website Lecture 3 The Physical Environment Part 1
 Website http://websites.rcc.edu/halama Lecture 3 The Physical Environment Part 1 1 Lectures 3 & 4 1. Biogeochemical Cycling 2. Solar Radiation 3. The Atmosphere 4. The Global Ocean 5. Weather and Climate
NATS 101 Section 13: Lecture 32. Paleoclimate
 NATS 101 Section 13: Lecture 32 Paleoclimate Natural changes in the Earth s climate also occur at much longer timescales The study of prehistoric climates and their variability is called paleoclimate.
MAR110 LECTURE #28 Climate Change I
 25 November 2007 MAR 110 Lec28 Climate Change I 1 MAR110 LECTURE #28 Climate Change I Figure 28.1 Climate Change Diagnostics Drought and flooding represent just a couple of hazards related to climate variability
MAR110 LECTURE #22 Climate Change
 MAR 110: Lecture 22 Outline Climate Change 1 MAR110 LECTURE #22 Climate Change Climate Change Diagnostics Drought and flooding represent just a couple of hazards related to climate variability (O) The
Environmental Science Chapter 13 Atmosphere and Climate Change Review
 Environmental Science Chapter 13 Atmosphere and Climate Change Review Multiple Choice Identify the choice that best completes the statement or answers the question. 1. Climate in a region is a. the long-term,
Ocean s Influence on Weather and Climate
 Earth is often called the Blue Planet because so much of its surface (about 71%) is covered by water. Of all the water on Earth, about 96.5%, is held in the world s oceans. As you can imagine, these oceans
At it s most extreme very low pressure off Indonesia, every high off SA, ~8 o C difference over the Pacific and ½ m water level differential) ENSO is
 ENSO is") This summer : El Niño (ENSO) and the NAO (Ocean/Atmosphere coupling teleconnections) A teleconnection (as used in the atmospheric sciences) refers to climate anomalies that are related across very large
This summer : El Niño (ENSO) and the NAO (Ocean/Atmosphere coupling teleconnections) A teleconnection (as used in the atmospheric sciences) refers to climate anomalies that are related across very large
Please be ready for today by:
 Please be ready for today by: 1. HW out for a stamp 2. Paper and pencil/pen for notes 3. Be ready to discuss what you know about El Nino after you view the video clip What is El Nino? El Nino Basics El
Climate Change 2007: The Physical Science Basis
 Climate Change 2007: The Physical Science Basis Working Group I Contribution to the IPCC Fourth Assessment Report Presented by R.K. Pachauri, IPCC Chair and Bubu Jallow, WG 1 Vice Chair Nairobi, 6 February
Climate and the Atmosphere
 Climate and Biomes Climate Objectives: Understand how weather is affected by: 1. Variations in the amount of incoming solar radiation 2. The earth s annual path around the sun 3. The earth s daily rotation
Reminders: Week 14 Assessment closes tonight Watch for Week 15 Assessment (will close Wednesday, Dec. 13)
") Wednesday, December 6, 2017 The Pleistocene Glaciations, Continued (Chapter 14) Reminders: Week 14 Assessment closes tonight Watch for Week 15 Assessment (will close Wednesday, Dec. 13) Homework 5 due
Wednesday, December 6, 2017 The Pleistocene Glaciations, Continued (Chapter 14) Reminders: Week 14 Assessment closes tonight Watch for Week 15 Assessment (will close Wednesday, Dec. 13) Homework 5 due
Welcome to ATMS 111 Global Warming.
 Welcome to ATMS 111 Global Warming http://www.atmos.washington.edu/2010q1/111 Isotopic Evidence 16 O isotopes "light 18 O isotopes "heavy" Evaporation favors light Rain favors heavy Cloud above ice is
1 Our Dynamic Climate Guiding Question: What factors determine Earth s climate?
 LESSON 1 Our Dynamic Climate Guiding Question: What factors determine Earth s climate? Describe factors that affect how the sun warms Earth. Discuss the role of wind patterns in determining climate. Explain
Climate Variability and Change Past, Present and Future An Overview
 Climate Variability and Change Past, Present and Future An Overview Dr Jim Salinger National Institute of Water and Atmospheric Research Auckland, New Zealand INTERNATIONAL WORKSHOP ON REDUCING VULNERABILITY
Deep Ocean Circulation & implications for Earth s climate
 Deep Ocean Circulation & implications for Earth s climate I. Ocean Layers and circulation types 1) Ocean Layers Ocean is strongly Stratified Consists of distinct LAYERS controlled by density takes huge
ATOC OUR CHANGING ENVIRONMENT
 ATOC 1060-002 OUR CHANGING ENVIRONMENT Class 22 (Chp 15, Chp 14 Pages 288-290) Objectives of Today s Class Chp 15 Global Warming, Part 1: Recent and Future Climate: Recent climate: The Holocene Climate
Chapter outline. Reference 12/13/2016
 Chapter 2. observation CC EST 5103 Climate Change Science Rezaul Karim Environmental Science & Technology Jessore University of science & Technology Chapter outline Temperature in the instrumental record
Winds and Global Circulation
 Winds and Global Circulation Atmospheric Pressure Winds Global Wind and Pressure Patterns Oceans and Ocean Currents El Nino How is Energy Transported to its escape zones? Both atmospheric and ocean transport
Chapter Introduction. Earth. Change. Chapter Wrap-Up
 Chapter Introduction Lesson 1 Lesson 2 Lesson 3 Climates of Earth Chapter Wrap-Up Climate Cycles Recent Climate Change What is climate and how does it impact life on Earth? What do you think? Before you
Surface Circulation Ocean current Surface Currents:
 All Write Round Robin G1. What makes up the ocean water? G2. What is the source of the salt found in ocean water? G3. How does the water temperature affect the density of ocean water? G4. How does the
Ocean Mixing and Climate Change
 Ocean Mixing and Climate Change Factors inducing seawater mixing Different densities Wind stirring Internal waves breaking Tidal Bottom topography Biogenic Mixing (??) In general, any motion favoring turbulent
MAR 110 LECTURE #10 The Oceanic Conveyor Belt Oceanic Thermohaline Circulation
 1 MAR 110 LECTURE #10 The Oceanic Conveyor Belt Oceanic Thermohaline Circulation Ocean Climate Temperature Zones The pattern of approximately parallel oceanic surface isotherms (lines of constant temperature)
Rapid Climate Change: Heinrich/Bolling- Allerod Events and the Thermohaline Circulation. By: Andy Lesage April 13, 2010 Atmos.
 Rapid Climate Change: Heinrich/Bolling- Allerod Events and the Thermohaline Circulation By: Andy Lesage April 13, 2010 Atmos. 6030 Outline Background Heinrich Event I/Bolling-Allerod Transition (Liu et
The Planetary Circulation System
 12 The Planetary Circulation System Learning Goals After studying this chapter, students should be able to: 1. describe and account for the global patterns of pressure, wind patterns and ocean currents
Climate 1: The Climate System
 Climate 1: The Climate System Prof. Franco Prodi Institute of Atmospheric Sciences and Climate National Research Council Via P. Gobetti, 101 40129 BOLOGNA SIF, School of Energy, Varenna, July 2014 CLIMATE
Climate Changes due to Natural Processes
 Climate Changes due to Natural Processes 2.6.2a Summarize natural processes that can and have affected global climate (particularly El Niño/La Niña, volcanic eruptions, sunspots, shifts in Earth's orbit,
Oceanography Quiz 2. Multiple Choice Identify the choice that best completes the statement or answers the question.
 Oceanography Quiz 2 Multiple Choice Identify the choice that best completes the statement or answers the question. 1. The highest and lowest tides are known as the spring tides. When do these occur? a.
Chapter 4. Understanding the Weather. Weather is short-term and caused by various air and ocean circulations
 Video: Meteorologist Paul Douglas April 2013 Understanding the Weather Weather is short-term and caused by various air and ocean circulations There are natural climate cycle that cause large climate changes
Extremes of Weather and the Latest Climate Change Science. Prof. Richard Allan, Department of Meteorology University of Reading
 Extremes of Weather and the Latest Climate Change Science Prof. Richard Allan, Department of Meteorology University of Reading Extreme weather climate change Recent extreme weather focusses debate on climate
How Will Melting Ice Sheets Affect Us?
 PASSAGE 4 How Will Melting Ice Sheets Affect Us? Variation is normal. During the last ice age, for example, ice sheets also covered much of North America and Scandinavia. Why is what s happening now different
The Climate System and Climate Models. Gerald A. Meehl National Center for Atmospheric Research Boulder, Colorado
 The Climate System and Climate Models Gerald A. Meehl National Center for Atmospheric Research Boulder, Colorado The climate system includes all components of the physical earth system that affect weather
Water percolating through hot lava dissolves soluble minerals containing chlorine, bromine and sulphur compounds
 Figure 5 The sources of dissolved ions in sea water. Water falls as rain Compounds containing mainly calcium, magnesium, carbonate and silicate ions are leached from the soil Rivers carry ions in solution
Climate Change. April 21, 2009
 Climate Change Chapter 16 April 21, 2009 Reconstructing Past Climates Techniques Glacial landscapes (fossils) CLIMAP (ocean sediment) Ice cores (layering of precipitation) p Otoliths (CaCO 3 in fish sensory
Earth/Environmental Science Oceanography
 Earth/Environmental Science Oceanography Name Part I. Modeling Deep Ocean Currents LAB: Ocean Circulation and Climate DIRECTIONS DO NOT RINSE the container between solutions! A. Effect of Temperature 1.
Wind: Global Systems Chapter 10
 Wind: Global Systems Chapter 10 General Circulation of the Atmosphere General circulation of the atmosphere describes average wind patterns and is useful for understanding climate Over the earth, incoming
Prentice Hall EARTH SCIENCE
 Prentice Hall EARTH SCIENCE Tarbuck Lutgens Chapter 21 Climate 21.1 Factors That Affect Climate Factors That Affect Climate Latitude As latitude increases, the intensity of solar energy decreases. The
Name Date Class. growth rings of trees, fossilized pollen, and ocean. in the northern hemisphere.
 Lesson Outline LESSON 2 A. Long-Term Cycles 1. A(n) climate cycle takes much longer than a lifetime to complete. a. To learn about long-term climate cycles, scientists study natural records, such as growth
Observation: predictable patterns of ecosystem distribution across Earth. Observation: predictable patterns of ecosystem distribution across Earth 1.
 Climate Chap. 2 Introduction I. Forces that drive climate and their global patterns A. Solar Input Earth s energy budget B. Seasonal cycles C. Atmospheric circulation D. Oceanic circulation E. Landform
Today we will discuss global climate: how it has changed in the past, and how the current status and possible future look.
 Global Climate Change Today we will discuss global climate: how it has changed in the past, and how the current status and possible future look. If you live in an area such as the Mississippi delta (pictured)
ENVE203 Environmental Engineering Ecology (Oct 15, 2012)
") ENVE203 Environmental Engineering Ecology (Oct 15, 2012) Elif Soyer Ecosystem and Physical Environment Atmosphere, Ocean, Weather & Climate, Internal Planetary Processes Atmospheric Circulation Different
ENVE203 Environmental Engineering Ecology (Oct 15, 2012) Elif Soyer Ecosystem and Physical Environment Atmosphere, Ocean, Weather & Climate, Internal Planetary Processes Atmospheric Circulation Different
2. Fargo, North Dakota receives more snow than Charleston, South Carolina.
 2015 National Tournament Division B Meteorology Section 1: Weather versus Climate Chose the answer that best answers the question 1. The sky is partly cloudy this morning in Lincoln, Nebraska. 2. Fargo,
Topic 6: Insolation and the Seasons
 Topic 6: Insolation and the Seasons Solar Radiation and Insolation Insolation: In Sol ation The Sun is the primary source of energy for the earth. The rate at which energy is radiated is called Intensity
Contents. Section 1: Climate Factors. Section 2: Climate Types. Section 3: Climate Effects
 Contents Section 1: Climate Factors 1. Weather or Climate?.... 2 2. Elements of Climate.... 4 3. Factors Affecting Climate.... 10 4. Comparing Climates.... 15 5. Quiz 1.... 20 Section 2: Climate Types
Table of Contents. Chapter: Atmosphere. Section 1: Earth's Atmosphere. Section 2: Energy Transfer in the Atmosphere. Section 3: Air Movement
 Table of Contents Chapter: Atmosphere Section 1: Earth's Atmosphere Section 2: Energy Transfer in the Atmosphere Section 3: Air Movement Table of Contents Chapter 4: Atmosphere Section 1: Earth's Atmosphere
Climate Variability Natural and Anthropogenic
 Climate Variability Natural and Anthropogenic Jim Renwick NIWA Climate Research j.renwick@niwa.co.nz Climate equilibrium and climate forcings Natural forcings Anthropogenic forcings Feedbacks Natural variability
Projections of future climate change
 Projections of future climate change Matthew Collins 1,2 and Catherine A. Senior 2 1 Centre for Global Atmospheric Modelling, Department of Meteorology, University of Reading 2 Met Office Hadley Centre,
6. What has been the most effective erosive agent in the climate system? a. Water b. Ice c. Wind
 Multiple Choice. 1. Heinrich Events a. Show increased abundance of warm-water species of planktic foraminifera b. Show greater intensity since the last deglaciation c. Show increased accumulation of ice-rafted
What is the IPCC? Intergovernmental Panel on Climate Change
 IPCC WG1 FAQ What is the IPCC? Intergovernmental Panel on Climate Change The IPCC is a scientific intergovernmental body set up by the World Meteorological Organization (WMO) and by the United Nations
Introduction to Climate Change
 Ch 19 Climate Change Introduction to Climate Change Throughout time, the earth's climate has always been changing produced ice ages Hence, climate variations have been noted in the past what physical processes
Where is all the water?
 Where is all the water? The distribution of water at the Earth's surface % of total Oceans 97.25 Ice caps and glaciers 2.05 Groundwater 0.68 Lakes 0.01 Soils 0.005 Atmosphere (as vapour) 0.001 Rivers 0.0001
Global climate change
 Global climate change What is climate change? This winter was really cold! Temp difference ( C): Jan 2004 vs. Jan 2002-2003 Make your own maps at: http://www.giss.nasa.gov/data/update/gistemp/maps/ 1 What
Global warming and Extremes of Weather. Prof. Richard Allan, Department of Meteorology University of Reading
 Global warming and Extremes of Weather Prof. Richard Allan, Department of Meteorology University of Reading Extreme weather climate change Recent extreme weather focusses debate on climate change Can we
World Geography Chapter 3
 World Geography Chapter 3 Section 1 A. Introduction a. Weather b. Climate c. Both weather and climate are influenced by i. direct sunlight. ii. iii. iv. the features of the earth s surface. B. The Greenhouse
Science 1206 Chapter 1 - Inquiring about Weather
 Science 1206 Chapter 1 - Inquiring about Weather 1.1 - The Atmosphere: Energy Transfer and Properties (pp. 10-25) Weather and the Atmosphere weather the physical conditions of the atmosphere at a specific
3. Carbon Dioxide (CO 2 )
") 3. Carbon Dioxide (CO 2 ) Basic information on CO 2 with regard to environmental issues Carbon dioxide (CO 2 ) is a significant greenhouse gas that has strong absorption bands in the infrared region and
3. Carbon Dioxide (CO 2 ) Basic information on CO 2 with regard to environmental issues Carbon dioxide (CO 2 ) is a significant greenhouse gas that has strong absorption bands in the infrared region and
4 Changes in Climate. TAKE A LOOK 2. Explain Why is more land exposed during glacial periods than at other times?
 Name Class CHAPTER 3 Date Climate 4 Changes in Climate SECTION National Science Education Standards BEFORE YOU READ After you read this section, you should be able to answer these questions: ES 1k, 2a
1 What Is Climate? TAKE A LOOK 2. Explain Why do areas near the equator tend to have high temperatures?
 CHAPTER 17 1 What Is Climate? SECTION Climate BEFORE YOU READ After you read this section, you should be able to answer these questions: What is climate? What factors affect climate? How do climates differ
Match (one-to-one) the following (1 5) from the list (A E) below.
 the following (1 5) from the list (A E) below.") GEO 302C EXAM 1 Spring 2009 Name UID You may not refer to any other materials during the exam. For each question (except otherwise explicitly stated), select the best answer for that question. Read all
GEO 302C EXAM 1 Spring 2009 Name UID You may not refer to any other materials during the exam. For each question (except otherwise explicitly stated), select the best answer for that question. Read all
The surface of the ocean floor is as varied as the land. The five major oceans, from largest to smallest, are
 11.1 Ocean Basins The surface of the ocean floor is as varied as the land. The five major oceans, from largest to smallest, are w the Pacific w the Atlantic w the Indian w the Southern w the Arctic The
Global Weather Trade Winds etc.notebook February 17, 2017
 Global Weather 1 north pole northern hemisphere equator southern hemisphere south pole 2 We have seasons because of the Earth's tilt The seasons are opposite in the northern and southern hemispheres winter
2010 Pearson Education, Inc.
 Chapter 10 Planetary Atmospheres: Mars, Venus, Earth What is an atmosphere? An atmosphere is a (usually very thin) layer of gas that surrounds a world. How does the greenhouse effect warm a planet? No
Warm Up Vocabulary Check
 Warm Up Vocabulary Check Surface current Coriolis Effect global winds upwelling Gulf Stream deep current climate El Nino convection current continental deflection 1.The apparent curving of the path of
Weather Atmospheric condition in one place during a limited period of time Climate Weather patterns that an area typically experiences over a long
 Weather Atmospheric condition in one place during a limited period of time Climate Weather patterns that an area typically experiences over a long period of time Many factors influence weather & climate
Science of Global Warming and Climate Change
 Science of Global Warming and Climate Change Part 1 Science Dr. David H. Manz, P. Eng. University of Calgary May 2015 Weather vs. Climate Weather happens day to day (moment to moment) best forecast is
Future Climate Change
 Future Climate Change How do you know whether to trust a prediction about the future? All predictions are based on global circulation models (GCMs, AOGCMs) - model accuracy is verified by its ability to
1. Deglacial climate changes
 Review 3 Major Topics Deglacial climate changes (last 21,000 years) Millennial oscillations (thousands of years) Historical Climate Change (last 1000 years) Climate Changes Since the 1800s Climate Change
1 What Is Climate? TAKE A LOOK 2. Explain Why do areas near the equator tend to have high temperatures?
 CHAPTER 3 1 What Is Climate? SECTION Climate BEFORE YOU READ After you read this section, you should be able to answer these questions: What is climate? What factors affect climate? How do climates differ
Global Circulation. Local weather doesn t come from all directions equally Everyone s weather is part of the global circulation pattern
 Global Circulation Local weather doesn t come from all directions equally Everyone s weather is part of the global circulation pattern Wind rose shows % frequency of winds around the compass 1 Global Circulation
Version2 Fall True/False Indicate whether the sentence or statement is true or false.
 Version2 Fall 2004 True/False Indicate whether the sentence or statement is true or false. 1. Short residence time elements are found in the greatest concentration near their point of removal from the
1 Earth s Oceans. TAKE A LOOK 2. Identify What are the five main oceans?
 CHAPTER 13 1 Earth s Oceans SECTION Exploring the Oceans BEFORE YOU READ After you read this section, you should be able to answer these questions: What affects the salinity of ocean water? What affects
Chapter 14: Climate Change
 Chapter 14: Climate Change Goals of Period 14 Section 14.1: To review the energy balance of the Earth and the enhanced greenhouse effect Section 14.2: To examine evidence for climate change Section 14.3:
Weather Vs. Climate. Weather Vs. Climate. Chapter 14
 Weather Vs. Climate Chapter 14 Weather: Conditions of the atmosphere at a particular time and place, for short periods of time (days). Climate: Long-term averages of weather (Averaged over 30 yrs). Weather
Weather Atmospheric condition in one place during a limited period of time Climate Weather patterns that an area typically experiences over a long
 Weather Atmospheric condition in one place during a limited period of time Climate Weather patterns that an area typically experiences over a long period of time Many factors influence weather & climate
1 What Is Climate? TAKE A LOOK 2. Explain Why do areas near the equator tend to have high temperatures?
 CHAPTER 17 1 What Is Climate? SECTION Climate BEFORE YOU READ After you read this section, you should be able to answer these questions: What is climate? What factors affect climate? How do climates differ
HYDROSPHERE NOTES. Water cycle: The continuous movement of water into the air, onto land, and then back to water sources.
 Hon Environmental Science HYDROSPHERE NOTES The Hydrosphere and the Water Cycle: Water cycle: The continuous movement of water into the air, onto land, and then back to water sources. Evaporation: the
Major climate change triggers
 Major climate change triggers Variations in solar output Milankovitch cycles Elevation & distribution of continents Ocean interactions Atmospheric composition change (CO 2 and other volcanic gasses) Biological
Earth s Heat Budget. What causes the seasons? Seasons
 Earth s Heat Budget Solar energy and the global heat budget Transfer of heat drives weather and climate Ocean circulation A. Rotation of the Earth B. Distance from the Sun C. Variations of Earth s orbit
An Introduction to Coupled Models of the Atmosphere Ocean System
 An Introduction to Coupled Models of the Atmosphere Ocean System Jonathon S. Wright jswright@tsinghua.edu.cn Atmosphere Ocean Coupling 1. Important to climate on a wide range of time scales Diurnal to
8. Climate changes Short-term regional variations
 8. Climate changes 8.1. Short-term regional variations By short-term climate changes, we refer here to changes occurring over years to decades. Over this timescale, climate is influenced by interactions
Ruddiman CHAPTER 13. Earth during the LGM ca. 20 ka BP
 Ruddiman CHAPTER 13 Earth during the LGM ca. 20 ka BP The Last Glacial Maximum When? How much more ice than today? How much colder was it than today (global average)? How much lower were snowlines? Did
2018 Science Olympiad: Badger Invitational Meteorology Exam. Team Name: Team Motto:
 2018 Science Olympiad: Badger Invitational Meteorology Exam Team Name: Team Motto: This exam has 50 questions of various formats, plus 3 tie-breakers. Good luck! 1. On a globally-averaged basis, which
ATOC OUR CHANGING ENVIRONMENT Class 19 (Chp 6) Objectives of Today s Class: The Cryosphere [1] Components, time scales; [2] Seasonal snow
![ATOC OUR CHANGING ENVIRONMENT Class 19 (Chp 6) Objectives of Today s Class: The Cryosphere [1] Components, time scales; [2] Seasonal snow](/thumbs/95/126309683.jpg "ATOC OUR CHANGING ENVIRONMENT Class 19 (Chp 6) Objectives of Today s Class: The Cryosphere [1] Components, time scales; [2] Seasonal snow") ATOC 1060-002 OUR CHANGING ENVIRONMENT Class 19 (Chp 6) Objectives of Today s Class: The Cryosphere [1] Components, time scales; [2] Seasonal snow cover, permafrost, river and lake ice, ; [3]Glaciers and
ATOC 1060-002 OUR CHANGING ENVIRONMENT Class 19 (Chp 6) Objectives of Today s Class: The Cryosphere [1] Components, time scales; [2] Seasonal snow cover, permafrost, river and lake ice, ; [3]Glaciers and
3) What is the difference between latitude and longitude and what is their affect on local and world weather and climate?
 What is the difference between latitude and longitude and what is their affect on local and world weather and climate?") www.discoveryeducation.com 1) Describe the difference between climate and weather citing an example of each. Describe how water (ocean, lake, river) has a local effect on weather and climate and provide
www.discoveryeducation.com 1) Describe the difference between climate and weather citing an example of each. Describe how water (ocean, lake, river) has a local effect on weather and climate and provide
Assessment Schedule 2017 Earth and Space Science: Demonstrate understanding of processes in the atmosphere system (91414)
") NCEA Level 3 Earth and Space Science (91414) 2017 page 1 of 6 Assessment Schedule 2017 Earth and Space Science: Demonstrate understanding of processes in the atmosphere system (91414) Evidence Statement
NCEA Level 3 Earth and Space Science (91414) 2017 page 1 of 6 Assessment Schedule 2017 Earth and Space Science: Demonstrate understanding of processes in the atmosphere system (91414) Evidence Statement
Unit 2 Meteorology Test **Please do not write on this test** 5. El Nino & La Nina 6. Photosynthesis 7. Coriolis Effect 8.
 Matching (2 points each) 1. weather 2. climate 3. Greenhouse Effect 4. Convection Unit 2 Meteorology Test **Please do not write on this test** 5. El Nino & La Nina 6. Photosynthesis 7. Coriolis Effect
School Name Team # International Academy East Meteorology Test Graphs, Pictures, and Diagrams Diagram #1
 School Name Team # International Academy East Meteorology Test Graphs, Pictures, and Diagrams Diagram #1 Use the map above, and the locations marked A-F, to answer the following questions. 1. The center
Today. Jovian planets. but first - a little more Climate change
 Today Jovian planets but first - a little more Climate change Weather and Climate Weather is the ever-varying combination of wind, clouds, temperature, and pressure. Local complexity of weather makes it
Energy Systems, Structures and Processes Essential Standard: Analyze patterns of global climate change over time Learning Objective: Differentiate
 Energy Systems, Structures and Processes Essential Standard: Analyze patterns of global climate change over time Learning Objective: Differentiate between weather and climate Global Climate Focus Question
Chapter 10 Planetary Atmospheres Earth and the Other Terrestrial Worlds
 Chapter 10 Planetary Atmospheres Earth and the Other Terrestrial Worlds What is an atmosphere? 10.1 Atmospheric Basics Our goals for learning:! What is an atmosphere?! How does the greenhouse effect warm
Climate Change Lecture Notes
 Climate Change Lecture Notes (Topic 12A) page 1 Climate Change Lecture Notes Learning Outcomes for the Climate Change Unit 1. Students can list observations which suggest that the world is warming, and
Website Lecture 3 The Physical Environment Part 1
 Website http://websites.rcc.edu/halama Lecture 3 The Physical Environment Part 1 1 Lectures 3 & 4 1. Biogeochemical Cycling 2. Solar Radiation 3. The Atmosphere 4. The Global Ocean 5. Weather and Climate
1. Oceans. Example 2. oxygen.
 1. Oceans a) Basic facts: There are five oceans on earth, making up about 72% of the planet s surface and holding 97% of the hydrosphere. Oceans supply the planet with most of its oxygen, play a vital
Earth s Heat Budget. What causes the seasons? Seasons
 Earth s Heat Budget Solar energy and the global heat budget Transfer of heat drives weather and climate Ocean circulation A. Rotation of the Earth B. Distance from the Sun C. Variations of Earth s orbit
Factors That Affect Climate
 Factors That Affect Climate Factors That Affect Climate Latitude As latitude (horizontal lines) increases, the intensity of solar energy decreases. The tropical zone is between the tropic of Cancer and
Factors that Affect Climate
 Factors that Affect Climate What is climate? Climate is the average weather conditions over a long period of time Includes average temperatures and precipitation, wind patterns, humidity, air pressure
Day 1 of Global Warming. Copyright 2008 Pearson Education, Inc., publishing as Pearson Benjamin Cummings
 Day 1 of Global Warming Copyright 2008 Pearson Education, Inc., publishing as Pearson Benjamin Cummings The Atmosphere Atmosphere = the thin layer (1/100 th of Earth s diameter) of gases that surrounds
Biome type of plant and animal community that covers large geographic areas
 1 Physical Environment: Atmosphere and Oceans - Circulation EVPP 110 Lecture Fall 2003 Dr. Largen 2 Global Environments 3 Biome type of plant and animal community that covers large geographic areas Global
Chapter 15 Millennial Oscillations in Climate
 Chapter 15 Millennial Oscillations in Climate This chapter includes millennial oscillations during glaciations, millennial oscillations during the last 8000 years, causes of millennial-scale oscillations,
Prentice Hall EARTH SCIENCE
 Prentice Hall EARTH SCIENCE Tarbuck Lutgens Chapter 21 Climate 21.1 Factors That Affect Climate Factors That Affect Climate Latitude As latitude increases, the intensity of solar energy decreases. The