Analyzing Solar Energy Graphs: MY NASA DATA
|
|
|
- Theresa O’Brien’
- 5 years ago
- Views:
Transcription
1 LIVE INTERACTIVE YOUR DESKTOP Analyzing Solar Energy Graphs: MY NASA DATA Presented by: Alissa Keil September 12, 2011


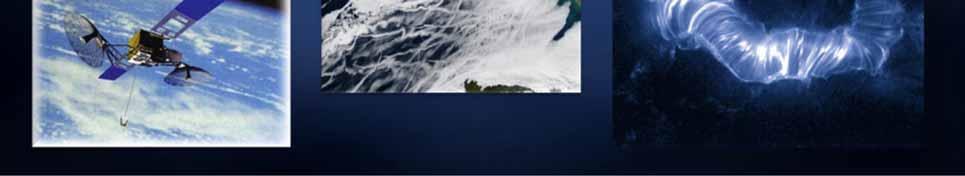
2 MY NASA DATA
3 Know your Earth video v=d2kh_z720ia
4 Overview Web based lessons (90 minutes) Problem solving Use real NASA data Set to the National Education Standards
5 My NASA Data Project National Standards: Math: Data Analysis and Probability Science Content: D Earth and Space Science Technology: Abilities for a Technological World AP Environmental Science Topics: Atmospheric circulation Solar electricity Solar energy Solar intensity and latitude
6 Possible ways to use lessons Analyzing graphs Solar energy, electricity and electromagnetic spectrum Science research classes as data analysis lesson Identifying geographical locations and climate
7 Has any one ever used the MY NASA DATA lessons in their classroom? Yes X No


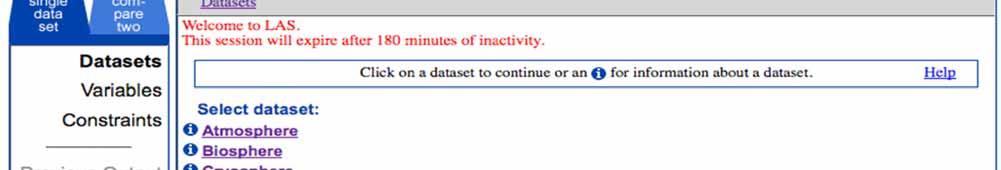
8 Data Collection 15 Earth Observing Satellites Information on: Atmosphere Biosphere Cryosphere Oceans Land Surface
9 Terra Collect information on Earth s changing climate. AQUA Collecting information on water in the Earth system Studies the fluxes of radiation from the Sun and From the Earth that combine to constitute the Earth s radiation balance. CERES Sensor- Cloud and Earth s Radiant Energy System Measure the total thermal radiation budget


10 Seasonal Changes in Energy orldofchange/decadaltemp.php
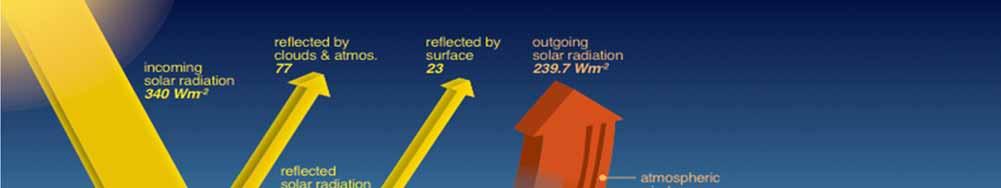
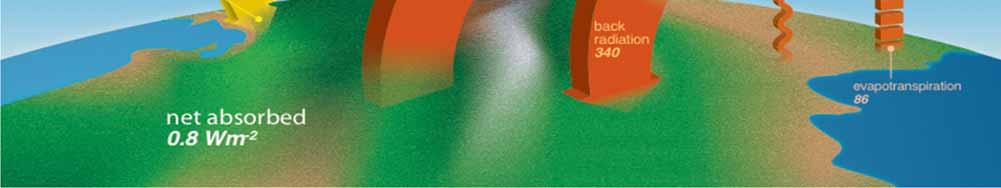
11 Let s pause for questions


12 My NASA Data

13 Featured Lesson Solar Cell Availability from Around the Country Purpose: To determine areas of the country which are most likely to produce solar energy by analyzing differences in incoming solar radiation graphs. Introduce as a rock star tour.


14 What do we need to know? Basic understanding of Solar Cells Be able to convert latitude and longitude into a city-state location Understand solar radiation
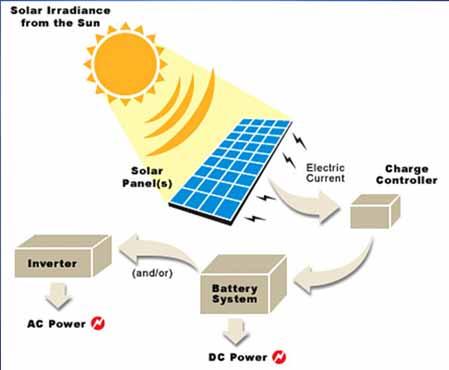
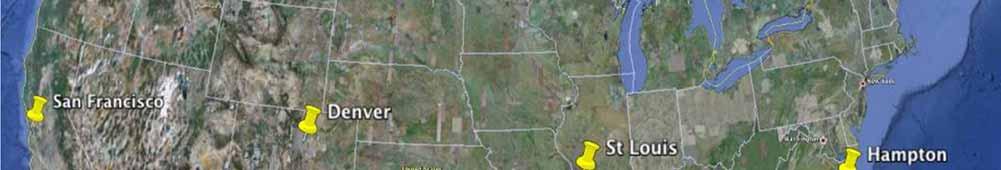
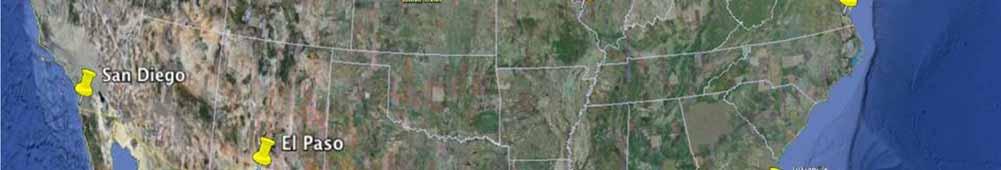
15 Solar Cells On a bright, sunny day, the sun's rays give off approximately 1,000 watts of energy per square meter of the planet's surface. -Photovoltaic solar pane array -Most are made of Silicon ( semiconductor)

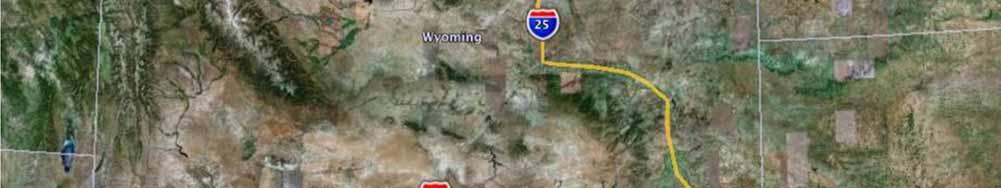
16


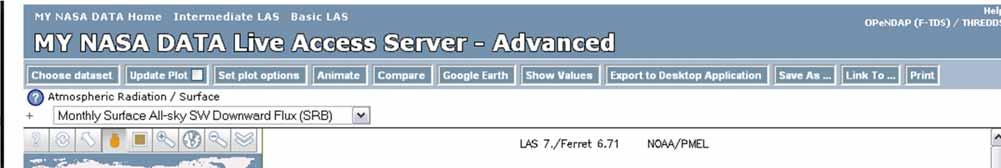
17 Monthly Surface All-Sky Short Wave Downward Flux data is used to generate the resultant plots. This data is gathered using the CERES instrument on the Terra and Aqua satellites Parameter being used Aqua Terra


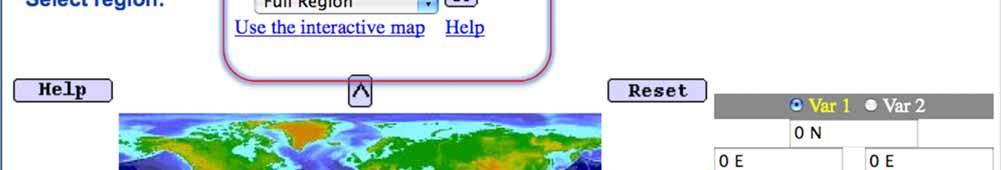
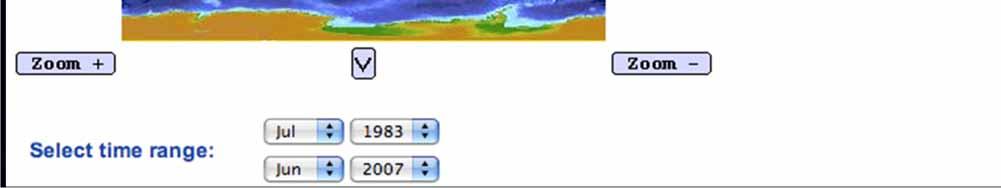
18 Earth s energy Budget


19 Computer lab Materials Classroom with only a few computers Classroom with only 1 computer connected to a video projector The MY NASA DATA web site has tips on classroom management for the use of the lessons
20 Let s pause for questions
21
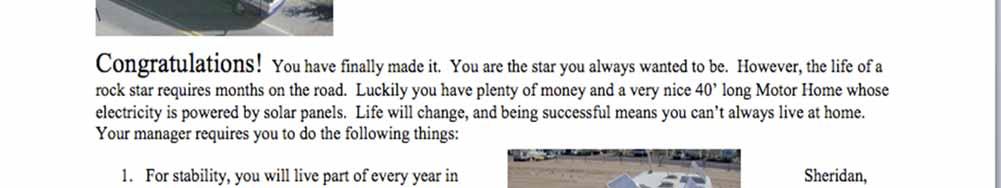
22 Congratulations! You have finally made it. You are now the star you always wanted to be. However, the life of a rock star requires months on the road. Luckily you have plenty of money and a very nice 40 long motor home whose electricity is powered by solar panels. Life will change, and being successful means you can t always live at home. Your manager requires you to do the following things
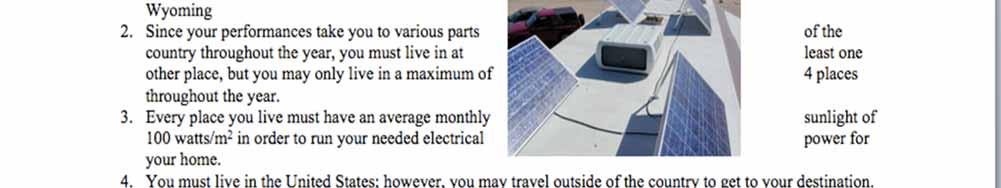
23 Constraints For stability, you will live part of every year in Sheridan, Wyoming. Since your performances take you to various parts of the country throughout the year, you must live in at least one other place, but you may only live in a maximum of 4 places throughout the year. Every place you live must have an average monthly sunlight of 100 watts/m 2 in order to run your needed electrical power for your home. You must live in the United States; however, you may travel outside of the country to get to your destination.
24 Determine the following: Where will you live each month of the year? How does the monthly average solar radiation compare to Sheridan? Find one place you might like to live during a particular season, but are unable to do so due to low solar radiation levels.
25 Procedures 1. Using My NASA Data Live Access Server (LAS) Found under Data access on the MY NASA Data home page Select the LAS advanced ( for high school students)
26 Let s pause for questions

27 My NASA Data
28 My NASA Data Website:

29 Lesson Steps

30 Lesson Steps Continued


31 Lesson Steps Continued

32 Lesson Steps Continued


33 Lesson Steps Continued

34
35 REPEAT PROCEDURE FOR DATA SET 2 Atmosphere Atmosphere radiation Surface Monthly Surface All-Sky SW Downward Flux

36 Lesson Steps Continued


37 Lesson Steps Continued

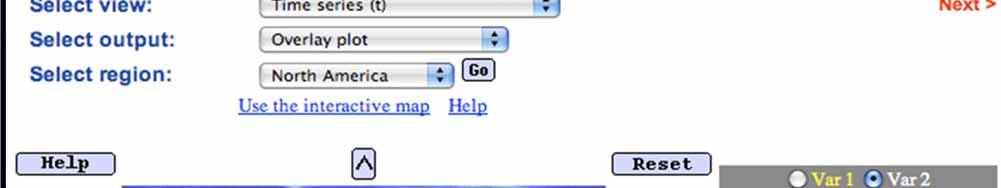

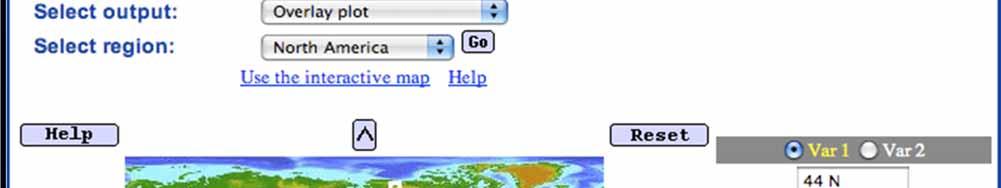
38 Lesson Steps Continued
39 Lesson Steps Continued

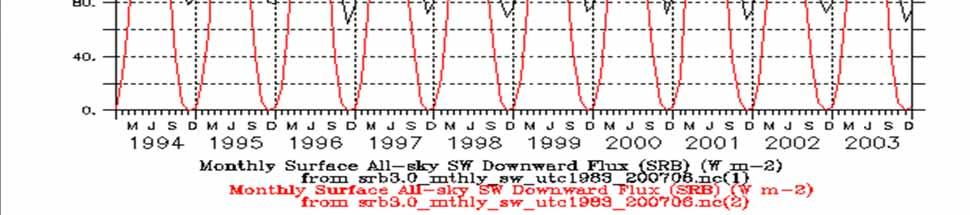
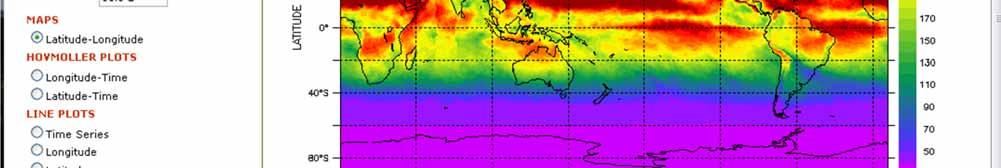
40 Sample Graph

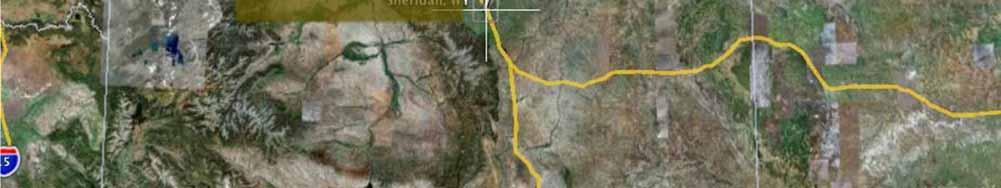

41 Sheridan, WY

42 Let s pause for questions
43 Let s try it out, rock stars Determine the following: Where will you live each month of the year? How does the monthly average solar radiation compare to Sheridan? Find one place you might like to live during a particular season, but are unable to do so due to low solar radiation levels. Remember your constraints: Must live part of year in Sheridan, WY Live one other place during the year; maximum of 4 places Must have average sunlight of 100 watts/m2 You must live in the US
44 Share your results! Month City/State lived Average solar radiation Places you couldn t live January February March April May June July August
45 Plot types found in Example 2 Overlay Plot

46 Plot types found in Example 2 Difference Plot


47 Possible Locations
48 Real World: Monitoring Earth's Energy Budget with CERES /D_Qmue54W14
49 NASA Explorer Schools Website- Virtual Campus Additional professional development
50 Have you heard of the NASA Explorer School Project? Yes X No Have you registered to be a participant? Yes X No

51

52

53
54 Thank you for joining us!

55 Thank you to the sponsor of tonight's Web Seminar: This web seminar contains information about programs, products, and services offered by third parties, as well as links to third-party websites. The presence of a listing or such information does not constitute an endorsement by NSTA of a particular company or organization, or its programs, products, or services.


56

57 National Science Teachers Association Dr. Francis Q. Eberle, Executive Director Zipporah Miller, Associate Executive Director Conferences and Programs Al Byers, Assistant Executive Director e-learning NSTA Web Seminars Paul Tingler, Director Jeff Layman, Technical Coordinator LIVE INTERACTIVE YOUR DESKTOP

58 September 13, 2011 ACS:The Science of Solar Power for Middle and High School Students September 14, 2011 NOAA: Interactive Visualization Tools for Climate September 15, 2011 NES: Properties of Living Things: Searching for Life on Mars
59 Web Seminar Evaluation: Click on the URL located on the Chat Window
60 Q and A with the Presenter(s)
NES: Weather and Climate: Satellite Meteorology
 LIVE INTERACTIVE LEARNING @ YOUR DESKTOP NES: Weather and Climate: Satellite Meteorology Presented by: Rudo Kashiri January 23, 2012 Weather and Climate: Satellite Meteorology Presented by Rudo Kashiri
NES: Meteorology: How Clouds Form
 LIVE INTERACTIVE LEARNING @ YOUR DESKTOP NES: Meteorology: How Clouds Form Presented by: Rudo Kashiri December 1, 2011 Meteorology: How Clouds Form Rudo Kashiri NES Education Specialist NASA Langley Research
MESSENGER: Staying Cool My Angle on Cooling Effects of Distance and Inclination
 LIVE INTERACTIVE LEARNING @ YOUR DESKTOP MESSENGER: Staying Cool My Angle on Cooling Effects of Distance and Inclination Presented by: Rudo Kashiri February 9, 2011 MESSENGER Mission to Mercury Presented
NES: Meterology: How Clouds Form
 LIVE INTERACTIVE LEARNING @ YOUR DESKTOP NES: Meterology: How Clouds Form Presented by: Rudo Kashiri August 30, 2011 Meteorology: How Clouds Form Rudo Kashiri NES Education Specialist Langley Research
The Search for Earth-like Worlds - How a Little Bit of Math Goes a Long Way!
 LIVE INTERACTIVE LEARNING @ YOUR DESKTOP The Search for Earth-like Worlds - How a Little Bit of Math Goes a Long Way! Presented by: Dr. Sten Odenwald March 31, 2011 Exoplanet Exploration Dr. Sten Odenwald
An Introduction to Earth s Climate
 LIVE INTERACTIVE LEARNING @ YOUR DESKTOP An Introduction to Earth s Climate Presented by: Dr. Lisa Gardiner Thursday, March 25, 2010 An Introduction to Earth s Climate A web seminar for the NSTA community
Electromagnetic Spectrum: Remote Sensing Ices on Mars
 LIVE INTERACTIVE LEARNING @ YOUR DESKTOP Electromagnetic Spectrum: Remote Sensing Ices on Mars Presented by: Rudo Kashiri February 21, 2013 6:30 p.m. 8:00 p.m. Eastern time 1 Introducing today s presenter
Electromagnetic Spectrum: Remote Sensing Ices on Mars
 LIVE INTERACTIVE LEARNING @ YOUR DESKTOP Electromagnetic Spectrum: Remote Sensing Ices on Mars Presented by: Rudo Kashiri October 4, 2012 7:30 p.m. 9:00 p.m. Eastern time 1 Introducing today s presenter
NES: Newton s Laws of Motion: Lunar Nautics
 LIVE INTERACTIVE LEARNING @ YOUR DESKTOP NES: Newton s Laws of Motion: Lunar Nautics Presented by: Rudo Kashiri March 19, 2012 Newton s Laws of Motion LUNAR NAUTICS Rudo Kashiri NES Education Specialist
NASA Eyes on Earth What s up? Satellites Presented by: Christopher Blair
 LIVE INTERACTIVE LEARNING @ YOUR DESKTOP NASA Eyes on Earth What s up? Satellites Presented by: Christopher Blair May 23, 2011 www.nasa.gov National Aeronautics and Space Administration NASA s Launch Services
Weather and Climate: Satellite Meteorology
 LIVE INTERACTIVE LEARNING @ YOUR DESKTOP Weather and Climate: Satellite Meteorology Presented by: Rudo Kashiri April 4, 2013 6:30 p.m. 8:00 p.m. Eastern time 1 2 http://learningcenter.nsta.org NSTA Learning
NES: Lunar Nautics Presenter: Rudo Kashiri
 LIVE INTERACTIVE LEARNING @ YOUR DESKTOP NES: Lunar Nautics Presenter: Rudo Kashiri July 21, 2011 LUNAR NAUTICS Rudo Kashiri NES Education Specialist NASA Langley research Center Presentation Outline Lunar
NSTA Web Seminar: Force and Motion: Stop Faking It!
 LIVE INTERACTIVE LEARNING @ YOUR DESKTOP NSTA Web Seminar: Force and Motion: Stop Faking It! Thursday, January 15, 2009 Force and Motion Circular motion Different frames of reference Gravitational forces
NES: Heat, Temperature and Energy: MESSENGER Cooling With Sunshades
 LIVE INTERACTIVE LEARNING @ YOUR DESKTOP NES: Heat, Temperature and Energy: MESSENGER Cooling With Sunshades Presented by: Jordan Snyder November 10, 2011 6:30 p.m. - 8:00 p.m. Eastern time Mercury Surface
New NASA Views of Storms in Space
 LIVE INTERACTIVE LEARNING @ YOUR DESKTOP New NASA Views of Storms in Space Presented by Dr. Eric Christian January 19, 2011 1 New NASA Views of Storms In Space The Sun as a Star Magnetism and the Sun Solar
Fingerprints of Life? Extremophiles: It s Just Right
 LIVE INTERACTIVE LEARNING @ YOUR DESKTOP Fingerprints of Life? Extremophiles: It s Just Right Presented by: Rudo Kashiri October 27, 2010 Presented by Rudo Kashiri NASA Explorer Schools Agenda Searching
LIVE INTERACTIVE YOUR DESKTOP. NSDL/NSTA Web Seminar Beyond Penguins and Polar Bears: Energy and the Polar Environment
 LIVE INTERACTIVE LEARNING @ YOUR DESKTOP NSDL/NSTA Web Seminar Beyond Penguins and Polar Bears: Energy and the Polar Environment Thursday, November 13, 2008 Today s NSDL Experts Jessica Fries-Gaither,
NASA/UCAR: Effects of Climate Change: Oceans and Ice
 LIVE INTERACTIVE LEARNING @ YOUR DESKTOP NASA/UCAR: Effects of Climate Change: Oceans and Ice Presented by: Becca Hatheway Thursday, October 14, 2010 6:30 p.m. - 8:00 p.m. Eastern time Effects of Climate
GRAIL: Exploring the Moon from Crust to Core
 LIVE INTERACTIVE LEARNING @ YOUR DESKTOP GRAIL: Exploring the Moon from Crust to Core Presented by: Dr. Sami Asmar and Don Boonstra June 2, 2011 Exploring the Lunar Interior Structure Crust To Core Via
NSDL/NSTA Web Seminar Beyond Penguins and Polar Bears: Integrating Science and Literacy in the K-5 Classroom-- Physical Science from the Poles
 LIVE INTERACTIVE LEARNING @ YOUR DESKTOP NSDL/NSTA Web Seminar Beyond Penguins and Polar Bears: Integrating Science and Literacy in the K-5 Classroom-- Physical Science from the Poles Wednesday, October
NSTA Web Seminar: Discover the Universe from Galileo to Today
 LIVE INTERACTIVE LEARNING @ YOUR DESKTOP NSTA Web Seminar: Discover the Universe from Galileo to Today Presented by: Dr. Natalie Batalha Tuesday, January 20, 2009 International Year of Astronomy: Advances
Introduction to the Next Generation Science Standards (NGSS) First Public Draft
 First Public Draft") LIVE INTERACTIVE LEARNING @ YOUR DESKTOP Introduction to the Next Generation Science Standards (NGSS) First Public Draft Presented by: Dr. Gerry Wheeler and Dr. Stephen Pruitt May 15, 2012 NGSS First Public
LIVE INTERACTIVE LEARNING @ YOUR DESKTOP Introduction to the Next Generation Science Standards (NGSS) First Public Draft Presented by: Dr. Gerry Wheeler and Dr. Stephen Pruitt May 15, 2012 NGSS First Public
LAB 2: Earth Sun Relations
 LAB 2: Earth Sun Relations Name School The amount of solar energy striking the Earth s atmosphere is not uniform; distances, angles and seasons play a dominant role on this distribution of radiation. Needless
TEACHER VERSION: Suggested student responses are included. Seasonal Cycles: the North Atlantic Phytoplankton Bloom
 Name: Date: Guiding Question: TEACHER VERSION: Suggested student responses are included. Seasonal Cycles: the North Atlantic Phytoplankton Bloom What are the factors that control the patterns/cycles of
NSF: Natural and Anthropogenic Climate Impacts as Evidenced in Ice Cores
 LIVE INTERACTIVE LEARNING @ YOUR DESKTOP NSF: Natural and Anthropogenic Climate Impacts as Evidenced in Ice Cores Presented by: Dr. Joseph McConnell and Linda Morris May 2, 2012 Natural and Anthropogenic
NGSS Crosscutting Concepts: Systems and System Models
 LIVE INTERACTIVE LEARNING @ YOUR DESKTOP NGSS Crosscutting Concepts: Systems and System Models Presented by: Ramon Lopez June 11, 2013 6:30 p.m. 8:00 p.m. Eastern time 1 2 http://learningcenter.nsta.org
Activity 2 MODELING LAB
 Activity 2 MODELING LAB PURPOSE. This activity sets up the rest of the ExoLab investigation, and is intended to help your students predict what the signal of an alien world might look like. They use the
A Conversation on NGSS: For Members, By Members
 LIVE INTERACTIVE LEARNING @ YOUR DESKTOP A Conversation on NGSS: For Members, By Members Presented by: Harold Pratt and Ted Willard January 22, 2013 6:30 p.m. 8:00 p.m. Eastern time 1 Introducing today
Unit: Climate and Weather General Task Effects of Earth s Tilt on Climate
 The following instructional plan is part of a GaDOE collection of Unit Frameworks, Performance Tasks, examples of Student Work, and Teacher Commentary. Many more GaDOE approved instructional plans are
LAB 3: THE SUN AND CLIMATE NAME: LAB PARTNER(S):
:") GEOG 101L PHYSICAL GEOGRAPHY LAB SAN DIEGO CITY COLLEGE SELKIN 1 LAB 3: THE SUN AND CLIMATE NAME: LAB PARTNER(S): The main objective of today s lab is for you to be able to visualize the sun s position
GEOG 101L PHYSICAL GEOGRAPHY LAB SAN DIEGO CITY COLLEGE SELKIN 1 LAB 3: THE SUN AND CLIMATE NAME: LAB PARTNER(S): The main objective of today s lab is for you to be able to visualize the sun s position
SUBJECT AREA(S): science, math, solar power, visible light, ultraviolet (UV), infrared (IR), energy, Watt, atmospheric conditions
: science, math, solar power, visible light, ultraviolet (UV), infrared (IR), energy, Watt, atmospheric conditions") Our Place in Space Cosmic Rays AUTHOR: Jamie Repasky GRADE LEVEL(S): 3-5 SUBJECT AREA(S): science, math, solar power, visible light, ultraviolet (UV), infrared (IR), energy, Watt, atmospheric conditions
Our Place in Space Cosmic Rays AUTHOR: Jamie Repasky GRADE LEVEL(S): 3-5 SUBJECT AREA(S): science, math, solar power, visible light, ultraviolet (UV), infrared (IR), energy, Watt, atmospheric conditions
Tuckahoe Union Free School District Earth Science Curriculum Map/Scope and Sequence. Compiled by: Mark Dineen
 Tuckahoe Union Free School District Earth Science Curriculum Map/Scope and Sequence Compiled by: Mark Dineen SEPTEMBER Tuckahoe Union Free School District Curriculum Map- Earth Science Mr. Dineen Texts:
Page 1. Name:
 Name: 1) What is the primary reason New York State is warmer in July than in February? A) The altitude of the noon Sun is greater in February. B) The insolation in New York is greater in July. C) The Earth
Solar Radiant Heating and Angle of Incidence NS 696 V: Weather and Climate for Educators
 Solar Radiant Heating and Angle of Incidence NS 696 V: Weather and Climate for Educators State Science Standards: Standard 1 Students apply the processes of scientific investigation and design, conduct,
MAPPING MARS TEACHER PAGE
 TEACHER PAGE Background Information This lesson introduces students to some common map projections and representations (e.g., globes or close-ups) and asks them to consider the ways that each representation
ACS: ENTROPY: MIXING AND OIL SPILLS
 LIVE INTERACTIVE LEARNING @ YOUR DESKTOP ACS: ENTROPY: MIXING AND OIL SPILLS Presented by: Jerry Bell and Pat Deibert and Bonnie Bloom November 23, 2010 1 Pat Bonnie Jerry ENTROPY: MIXING AND OIL SPILLS
National Center for Atmospheric Research: Climate Discovery Teacher s Guide
 Lesson Summary Students use a photo of the Bhutan glaciers in order to investigate the different effects albedo has on solar absorption. Prior Knowledge & Skills Graphing skills Data collection skills
Lab Activity: Climate Variables
 Name: Date: Period: Water and Climate The Physical Setting: Earth Science Lab Activity: Climate Variables INTRODUCTION:! The state of the atmosphere continually changes over time in response to the uneven
Agricultural Science Climatology Semester 2, Anne Green / Richard Thompson
 Agricultural Science Climatology Semester 2, 2006 Anne Green / Richard Thompson http://www.physics.usyd.edu.au/ag/agschome.htm Course Coordinator: Mike Wheatland Course Goals Evaluate & interpret information,
Dear Teacher, Overview Page 1
 Dear Teacher, You are about to involve your students in one of the most exciting frontiers of science the search for other worlds and life in solar systems beyond our own! Using the MicroObservatory telescopes,
Using Stories from ChemMatters to Teach Introductory Chemistry
 LIVE INTERACTIVE LEARNING @ YOUR DESKTOP Using Stories from ChemMatters to Teach Introductory Chemistry Presented by: Michael Tinnesand and Debbie Pusateri October 7, 2010 1 Introductory Activity Gaining
16th Year. In-Class Grade 6 Astronomy & Flight Workshops
 16th Year In-Class Grade 6 Astronomy & Flight Workshops www.cosmicconnections.ca (416) 728-0062 2017 2018 You and your students will embrace the glories of the night sky right in your classroom. Grade
T. Dale Bess 1 and Takmeng Wong Atmospheric Sciences Division Langley Research Center, NASA Hampton, VA G. Louis Smith
 P1.7 ONE YEAR OF DAILY AVERAGED LONGWAVE RADIATION MEASUREMENTS FOR ENVIRONMENTAL AND CLIMATE CHANGE STUDIES T. Dale Bess 1 and Takmeng Wong Atmospheric Sciences Division Langley Research Center, NASA
SHAPING OUR FUTURE: THE CLIMATE CHALLENGE KS3 LESSON 1 TEACHER GUIDE HOW IS OUR CLIMATE CHANGING?
 SHAPING OUR FUTURE: THE CLIMATE CHALLENGE KS3 LESSON 1 TEACHER GUIDE HOW IS OUR CLIMATE CHANGING? KS3 LESSON 1 TEACHER GUIDE HOW IS OUR CLIMATE CHANGING? Learning objective: To understand, through the
NSDL/NSTA Web Seminar: Celebrating Astronomy: A Star s Story
 LIVE INTERACTIVE LEARNING @ YOUR DESKTOP NSDL/NSTA Web Seminar: Celebrating Astronomy: A Star s Story Thursday, September 25, 2008 Today s NSDL experts: Dr. Susana Deustua, Researcher, Space Telescope
How Telescopes Have Changed Our View of the Universe Webinar I: Anti-matter Eyes on the Gamma-ray Skies
 LIVE INTERACTIVE LEARNING @ YOUR DESKTOP NASA/NSTA Web Seminar Series How Telescopes Have Changed Our View of the Universe Webinar I: Anti-matter Eyes on the Gamma-ray Skies Presenter: Dr. Lynn Cominsky
My Map Activity MINNESOTA SOCIAL STUDIES STANDARDS & BENCHMARKS
 My Map Activity OVERVIEW & OBJECTIVES Students will learn the basics of Google Maps while using geospatial data to create their neighborhood map with the places they spend time. They will also collect
LESSON PLAN - Optimum Orientation of Solar Panels Using Soltrex Data
 LESSON PLAN - Optimum Orientation of Solar Panels Using Soltrex Data Title of Lesson: Optimum Orientation of Solar Panels Using Soltrex Data Description of class: High School physics, astronomy, or environmental
Which Earth latitude receives the greatest intensity of insolation when Earth is at the position shown in the diagram? A) 0 B) 23 N C) 55 N D) 90 N
 0 B) 23 N C) 55 N D) 90 N") 1. In which list are the forms of electromagnetic energy arranged in order from longest to shortest wavelengths? A) gamma rays, x-rays, ultraviolet rays, visible light B) radio waves, infrared rays, visible
1. In which list are the forms of electromagnetic energy arranged in order from longest to shortest wavelengths? A) gamma rays, x-rays, ultraviolet rays, visible light B) radio waves, infrared rays, visible
2. What is a phytoplankton bloom and when does it generally occur in the North Atlantic?
 Name: Date: Guiding Question: Seasonal Cycles: the North Atlantic Phytoplankton Bloom What are the factors that control the patterns/cycles of phytoplankton growth in the North Atlantic Ocean? Introduction
NSDL/NSTA Web Seminar: Celebrating Astronomy: A Star s Story
 LIVE INTERACTIVE LEARNING @ YOUR DESKTOP NSDL/NSTA Web Seminar: Celebrating Astronomy: A Star s Story Thursday, September 25, 2008 6:30 p.m. to 8:00 p.m. Eastern time Agenda: 1. Introductions 2. Tech-help
Earth Science: Earth's Place in the Universe Unit 2: The Moon
 Slide 1 / 127 Slide 2 / 127 New Jersey Center for Teaching and Learning Progressive Science Initiative This material is made freely available at www.njctl.org and is intended for the non-commercial use
LETTER TO FAMILY. Science News. Cut here and paste onto school letterhead before making copies. Dear Family,
 LETTER TO FAMILY Cut here and paste onto school letterhead before making copies. Dear Family, Science News We are about to begin a study of objects in the sky the Sun, Moon, and planets. We ll start with
NASA/UCAR/NESTA: Clues to Climates of the Past
 LIVE INTERACTIVE LEARNING @ YOUR DESKTOP NASA/UCAR/NESTA: Clues to Climates of the Past Presented by: Dr. Randy Russell Tuesday, September 28, 2010 6:30 p.m. - 8:00 p.m. Eastern time Clues to Climates
FOLLOW THE ENERGY! EARTH S DYNAMIC CLIMATE SYSTEM
 Investigation 1B FOLLOW THE ENERGY! EARTH S DYNAMIC CLIMATE SYSTEM Driving Question How does energy enter, flow through, and exit Earth s climate system? Educational Outcomes To consider Earth s climate
Shapes in the Sky. A Planetarium Lab Lesson and Classroom Activities for Grades K-1
 A Planetarium Lab Lesson and Classroom Activities for Grades K-1 Students observe a geometric shape (star, or constellation patterns) for each season; how the sky changes daily and seasonally; compass
P1.34 MULTISEASONALVALIDATION OF GOES-BASED INSOLATION ESTIMATES. Jason A. Otkin*, Martha C. Anderson*, and John R. Mecikalski #
 P1.34 MULTISEASONALVALIDATION OF GOES-BASED INSOLATION ESTIMATES Jason A. Otkin*, Martha C. Anderson*, and John R. Mecikalski # *Cooperative Institute for Meteorological Satellite Studies, University of
LIVE INTERACTIVE YOUR DESKTOP. NSDL/NSTA Web Seminar: Chemistry Comes Alive III: Water
 LIVE INTERACTIVE LEARNING @ YOUR DESKTOP NSDL/NSTA Web Seminar: Chemistry Comes Alive III: Water Tuesday, December 9, 2008 Today s NSDL Experts Dr. John Moore, W. T. Lippincott Professor, University of
Interannual variability of top-ofatmosphere. CERES instruments
 Interannual variability of top-ofatmosphere albedo observed by CERES instruments Seiji Kato NASA Langley Research Center Hampton, VA SORCE Science team meeting, Sedona, Arizona, Sep. 13-16, 2011 TOA irradiance
Which graph best shows the relationship between intensity of insolation and position on the Earth's surface? A) B) C) D)
 B) C) D)") 1. The hottest climates on Earth are located near the Equator because this region A) is usually closest to the Sun B) reflects the greatest amount of insolation C) receives the most hours of daylight D)
1. The hottest climates on Earth are located near the Equator because this region A) is usually closest to the Sun B) reflects the greatest amount of insolation C) receives the most hours of daylight D)
Analyzing the Earth Using Remote Sensing
 Analyzing the Earth Using Remote Sensing Instructors: Dr. Brian Vant- Hull: Steinman 185, 212-650- 8514 brianvh@ce.ccny.cuny.edu Ms. Hannah Aizenman: NAC 7/311, 212-650- 6295 haizenman@ccny.cuny.edu Dr.
THE HEAT BUDGET OF THE EARTH: A HANDS-ON INVESTIGATION
 THE HEAT BUDGET OF THE EARTH: A HANDS-ON INVESTIGATION Roy Plotnick and Gene Harris, University of Illinois at Chicago Fintan Gogarty - Four Seasons Co. Mayo..eclipse.co.uk/artdirectireland Context of
Lesson 9 Overview. DRIVING QUESTION: What is the greenhouse effect and how does it affect Earth s surface temperature?
 Lesson 9 Overview DRIVING QUESTION: What is the greenhouse effect and how does it affect Earth s surface temperature? LEARNING GOAL: Students develop and use models of the greenhouse effect to construct
Student Exploration: Seasons in 3D
 Name: Date: Student Exploration: Seasons in 3D Vocabulary: axis, equinox, latitude, Northern Hemisphere, revolve, rotate, solar energy, solar intensity, Southern Hemisphere, summer solstice, winter solstice
1. Weather and climate.
 Lecture 31. Introduction to climate and climate change. Part 1. Objectives: 1. Weather and climate. 2. Earth s radiation budget. 3. Clouds and radiation field. Readings: Turco: p. 320-349; Brimblecombe:
Tell students that Earth is the only planet in our solar system known to have life. Ask:
 This website would like to remind you: Your browser (Safari 7) is out of date. Update your browser for more security, comfort and the best experience on this site. Activityengage The Vastness of Space
HURRICANE Information for the Teacher
 HURRICANE Information for the Teacher This hurricane simulation activity and STELLA model were adapted from materials developed by Jan Mons and Cathy Eaton of the Glynns Integration of Systems Thinking
Lesson: Why We Have Seasons
 Drexel-SDP GK-12 LESSON Lesson: Why We Have Seasons Subject Area(s) Earth and Space Associated Unit Astronomy, module 2 Lesson Title Lesson: Why We Have Seasons Grade Level 6 (3-7) Lesson # 4 of 4 Lesson
Effects of Global Warming on Coastal Cities: A Katrina Case Study
 Effects of Global Warming on Coastal Cities: A Katrina Case Study Introduction This lesson was created to discuss the possible effects of temperatures increasing worldwide, with a focus on the events that
Boy Scout Badge Workshop ASTRONOMY
 Boy Scout Badge Workshop ASTRONOMY Welcome to the Schenectady Museum & Suits-Bueche Planetarium! During this workshop, you will explore the museum, see a show in the planetarium, and try out some other
CCMR Educational Programs
 CCMR Educational Programs Title: Date Created: August 10, 2006 Latest Revision: August 10, 2006 Author(s): Myriam Ibarra Appropriate Level: Grades 8-10 Abstract: Energy and the Angle of Insolation Sun
Lecture 3. Background materials. Planetary radiative equilibrium TOA outgoing radiation = TOA incoming radiation Figure 3.1
 Lecture 3. Changes in planetary albedo. Is there a clear signal caused by aerosols and clouds? Outline: 1. Background materials. 2. Papers for class discussion: Palle et al., Changes in Earth s reflectance
Solar Time, Angles, and Irradiance Calculator: User Manual
 Solar Time, Angles, and Irradiance Calculator: User Manual Circular 674 Thomas Jenkins and Gabriel Bolivar-Mendoza 1 Cooperative Extension Service Engineering New Mexico Resource Network College of Agricultural,
Third Grade Math and Science DBQ Weather and Climate/Representing and Interpreting Charts and Data - Teacher s Guide
 Third Grade Math and Science DBQ Weather and Climate/Representing and Interpreting Charts and Data - Teacher s Guide A document based question (DBQ) is an authentic assessment where students interact with
Topic # 6 ATMOSPHERIC STRUCTURE & CHEMICAL COMPOSITION Part II. Plus wrap up of some other topics
 Topic # 6 ATMOSPHERIC STRUCTURE & CHEMICAL COMPOSITION Part II Plus wrap up of some other topics THE POWER OF COLLABORATIVE LEARNING! Individual Test Class mean REMEMBER: Your group is there to HELP YOU
For further information, and additional background on the American Meteorological Society s Education Program, please contact:
 Project ATMOSPHERE This guide is one of a series produced by Project ATMOSPHERE, an initiative of the American Meteorological Society. Project ATMOSPHERE has created and trained a network of resource agents
Earth Science COURSE DESCRIPTION: PREREQUISITES: COURSE LENGTH: REQUIRED TEXT: MATERIALS LIST:
 Earth Science COURSE DESCRIPTION: This course provides students with a solid earth science curriculum, focusing on geology, oceanography, astronomy, weather, and climate. The program consists of online
Mapping rainfall and flooding
 Mapping rainfall and flooding BY DAVID WALBERT Although Hurricane Floyd was the biggest storm of 1999 and the one most remembered, eastern North Carolina was hit by three hurricanes in a six-week period
Third Grade Math and Science DBQ Weather and Climate/Representing and Interpreting Charts and Data
 Third Grade Math and Science DBQ Weather and Climate/Representing and Interpreting Charts and Data A document based question (DBQ) is an authentic assessment where students interact with content related
Prentice Hall EARTH SCIENCE. Tarbuck Lutgens
 Prentice Hall EARTH SCIENCE Tarbuck Lutgens Chapter 17 The Atmosphere: Structure and Temperature 17.1 Atmosphere Characteristics Composition of the Atmosphere Weather is constantly changing, and it refers
Motion of the Sun. View Comments
 Login 2017 Survey to Improve Photovoltaic Education Christiana Honsberg and Stuart Bowden View Comments Instructions 1. Introduction 2. Properties of Sunlight 2.1. Basics of Light Properties of Light Energy
SCI112: Earth Science
 SCI112: Earth Science In this course, students focus on geology, oceanography, astronomy, weather, and climate. Students follow a program of online study days that alternate with review-and-assessment
Fleming County Schools Long Range Plan Teacher(s):
:") School Calendar Days Unit Title Standards August 2015 10 11 12 13 14 1-3 Get To Know You (2) Newton s Third Law of Motion (10) 17 18 19 20 21 4-8 Newton s Third Law of Motion 24 25 26 27 28 9-13 September
School Calendar Days Unit Title Standards August 2015 10 11 12 13 14 1-3 Get To Know You (2) Newton s Third Law of Motion (10) 17 18 19 20 21 4-8 Newton s Third Law of Motion 24 25 26 27 28 9-13 September
Global Climate Change
 Global Climate Change Overview: Students will learn about global climate change, what causes global warming, and scientific projections about climate change in the near future. Levels V-VI Grades 9-12
Comprehensive Earth Science
 Comprehensive Earth Science COURSE DESCRIPTION: This course provides students with a comprehensive earth science curriculum, focusing on geology, oceanography, astronomy, weather, and climate. The program
World Space Week. Age 5-11 A FREE RESOURCE PACK FROM EDUCATIONCITY. Topical Teaching Resources. Suitability
 A FREE RESOURCE PACK FROM EDUCATIONCITY World Space Week Age 5-11 Topical Teaching Resources Suitability Free school resources by EducationCity. This may be reproduced for class use. World Space Week Topical
Topic(s): Moon, Topography, Metrics, Geography, Space Science, Longitude, Latitude, Map skills
: Moon, Topography, Metrics, Geography, Space Science, Longitude, Latitude, Map skills") Title: Moon Maneuvers Author: Wynne Clarke Anderson Subject(s): Science, Mathematics Topic(s): Moon, Topography, Metrics, Geography, Space Science, Longitude, Latitude, Map skills Grade/Level: 5 8 Objective:
Title: Moon Maneuvers Author: Wynne Clarke Anderson Subject(s): Science, Mathematics Topic(s): Moon, Topography, Metrics, Geography, Space Science, Longitude, Latitude, Map skills Grade/Level: 5 8 Objective:
What Patterns Can Be Observed in a Year?
 LESSON 3 What Patterns Can Be Observed in a Year? From this vantage point, you can see the moon, sun, stars, and Earth. From Earth s surface, there are patterns to how the sun, moon, and stars appear in
Himawari-8 BUFR Development for Winds Processing and Radiances Cloud Mask, Cloud Phase, Cloud Height
 Sandy Supplemental Grant Recipient Quarterly Progress Report Himawari-8 BUFR Development for Winds Processing and Radiances Award Number: NA14NES4830006 The National Oceanic and Atmospheric Administration
Energy: Warming the earth and Atmosphere. air temperature. Overview of the Earth s Atmosphere 9/10/2012. Composition. Chapter 3.
 Overview of the Earth s Atmosphere Composition 99% of the atmosphere is within 30km of the Earth s surface. N 2 78% and O 2 21% The percentages represent a constant amount of gas but cycles of destruction
Introduction to Photovoltaics
 INTRODUCTION Objectives Understand the photovoltaic effect. Understand the properties of light. Describe frequency and wavelength. Understand the factors that determine available light energy. Use software
Arctic Impacts. Details. Materials. Learning Resources
 Details Learning Resources Completion Time: About one period Permission: Download, Share, and Remix Arctic Impacts Overview Lake El gygytgyn (67. o N, 17 o E) is one of the best preserved large asteroid
The Atmosphere: Structure and Temperature
 Chapter The Atmosphere: Structure and Temperature Geologists have uncovered evidence of when Earth was first able to support oxygenrich atmosphere similar to what we experience today and more so, take
Solar System Test - Grade 5
 Solar System Test - Grade 5 Multiple Choice Directions: Identify the choice that best completes the statement or answers the question. Write this answer on your answer document. 1. The tilt of Earth s
Making a Climograph: GLOBE Data Explorations
 Making a Climograph: A GLOBE Data Exploration Purpose Students learn how to construct and interpret climographs and understand how climate differs from weather. Overview Students calculate and graph maximum
LAB 19. Lab 19. Differences in Regional Climate: Why Do Two Cities Located at the Same Latitude and Near a Body of Water Have Such Different Climates?
 Lab Handout Lab 19. Differences in Regional Climate: Why Do Two Cities Located at the Same Latitude and Near a Body of Water Have Such Different Climates? Introduction Weather describes the current atmospheric
Space! Science Year 5/6B Autumn 2. Earth and Space. Session 2. Resource Pack
 Science Year 5/6B Autumn 2 Earth and Space Space! Session 2 Resource Pack Original resource copyright Hamilton Trust, who give permission for it to be adapted as wished by individual users. We refer you
EARTH/SPACE SCIENCE. Earth Materials and Changes
 EARTH/SPACE SCIENCE This Earth/Space science course is designed to continue student investigations of the earth sciences that began in grades K-8 while providing students the experiences and necessary
Photogeology In Terrain Evaluation (Part 1) Prof. Javed N Malik. Department of Earth Sciences Indian Institute of Technology, Kanpur
 Prof. Javed N Malik. Department of Earth Sciences Indian Institute of Technology, Kanpur") Photogeology In Terrain Evaluation (Part 1) Prof. Javed N Malik. Department of Earth Sciences Indian Institute of Technology, Kanpur Lecture 01 Introduction to Remote Sensing Photogeology Hello everybody.
Photogeology In Terrain Evaluation (Part 1) Prof. Javed N Malik. Department of Earth Sciences Indian Institute of Technology, Kanpur Lecture 01 Introduction to Remote Sensing Photogeology Hello everybody.
Challenger Center Teacher Resources for Engaging Students in Science, Technology, Engineering, and Math
 Challenger Center Teacher Resources for Engaging Students in Science, Technology, Engineering, and Math Designed for Grades 5-8 These resources are brought to you by: Earth vs. Mars Prep Time 10 minutes