Chapter 12: Estimation
|
|
|
- Elwin Washington
- 5 years ago
- Views:
Transcription
1 Chapter 12: Estimation
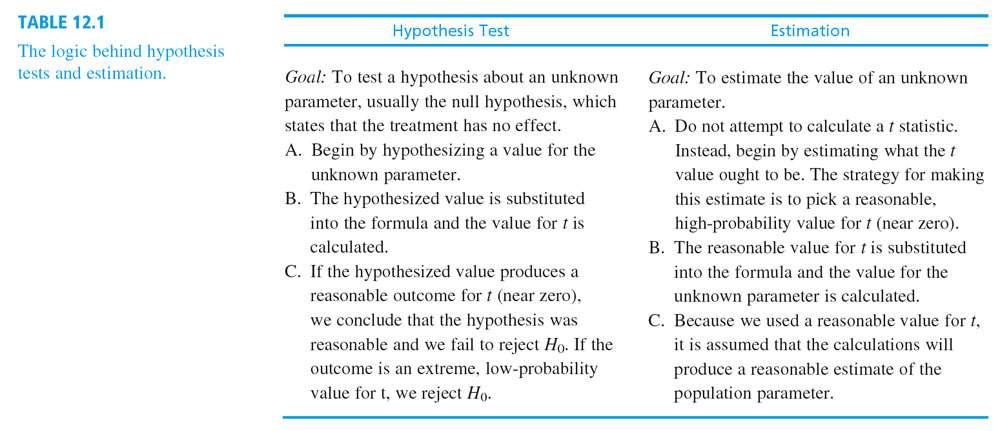
2 Estimation In general terms, estimation uses a sample statistic as the basis for estimating the value of the corresponding population parameter. Although estimation and hypothesis testing are similar in many respects, they are complementary inferential processes. A hypothesis test is used to determine whether or not a treatment has an effect, while estimation is used to determine how much effect.
3 Estimation (cont.) This complementary nature is demonstrated when estimation is used after a hypothesis test that resulted in rejecting the null hypothesis. In this situation, the hypothesis test has established that a treatment effect exists and the next logical step is to determine how much effect.
4 Estimation (cont.) It is also common to use estimation in situations where a researcher simply wants to learn about an unknown population. In this case, a sample is selected from the population and the sample data are then used to estimate the population parameters.
5 Estimation (cont.) You should keep in mind that even though estimation and hypothesis testing are inferential procedures, these two techniques differ in terms of the type of question they address. A hypothesis test, for example, addresses the somewhat academic question concerning the existence of a treatment effect. Estimation, on the other hand, is directed toward the more practical question of how much effect.

6
7
8 Estimation (cont.) The estimation process can produce either a point estimate or an interval estimate. A point estimate is a single value and has the advantage of being very precise. For example, based on sample data, you might estimate that the mean age for students at the state college is μ = 21.5 years.
9 Estimation (cont.) An interval estimate consists of a range of values and has the advantage of providing greater confidence than a point estimate. For example, you might estimate that the mean age for students is somewhere between 20 and 23 years. Note that the interval estimate is less precise, but gives more confidence. For this reason, interval estimates are usually called confidence intervals.
10 Estimation with the Three t Statistics There is an estimation procedure that accompanies each of the three t tests presented in the preceding three chapters. The estimation process begins with the same t statistic that is used for the corresponding hypothesis test.
11 Estimation with the Three t Statistics (cont.) These all have the same conceptual structure: sample statistic - unknown parameter t = standard error The basic estimation equation is obtained by solving this equation for the unknown parameter: unknown parameter = statistic ± (t)(standard error)
12 Estimation with the Three t Statistics (cont.) For the single sample t, the unknown parameter is the population mean, μ. For the independent-measures t, the parameter is the difference between population means, μ 1 - μ 2, and for the repeated-measures t, the unknown parameter is the population mean difference, μ D. To use the estimation equation, you first must obtain a value for t by estimating the location of the data within the appropriate t distribution.
13 Estimation with the Three t Statistics (cont.) For a point estimate, a value of zero is used for t, yielding a single value for your estimate of the unknown population parameter. For interval estimates, you first select a level of confidence and then find the corresponding interval range of t values in the t distribution table. The estimated value for t (or range of values) is then substituted in the equation along with the values for the sample statistic and the standard error. The equation is then solved for the unknown parameter.
14 Factors Influencing the Width of a Confidence Interval If other factors are held constant, increasing the level of confidence (for example, from 80% to 90%), will cause in increase in the width of the confidence interval. To obtain greater confidence, you must use a wider range of t statistic values, which results in a wider interval.
15 Factors Influencing the Width of a Confidence Interval (cont.) On the other hand, increasing the sample size will cause a decrease in the width of the confidence interval. In simple terms, a larger sample gives you more information, which means that you can estimate the population parameter with more precision.
16
POLI 443 Applied Political Research
 POLI 443 Applied Political Research Session 4 Tests of Hypotheses The Normal Curve Lecturer: Prof. A. Essuman-Johnson, Dept. of Political Science Contact Information: aessuman-johnson@ug.edu.gh College
Visual interpretation with normal approximation
 Visual interpretation with normal approximation H 0 is true: H 1 is true: p =0.06 25 33 Reject H 0 α =0.05 (Type I error rate) Fail to reject H 0 β =0.6468 (Type II error rate) 30 Accept H 1 Visual interpretation
Study Ch. 9.3, #47 53 (45 51), 55 61, (55 59)
, 55 61, (55 59)") GOALS: 1. Understand that 2 approaches of hypothesis testing exist: classical or critical value, and p value. We will use the p value approach. 2. Understand the critical value for the classical approach
GOALS: 1. Understand that 2 approaches of hypothesis testing exist: classical or critical value, and p value. We will use the p value approach. 2. Understand the critical value for the classical approach
Lecture 28 Chi-Square Analysis
 Lecture 28 STAT 225 Introduction to Probability Models April 23, 2014 Whitney Huang Purdue University 28.1 χ 2 test for For a given contingency table, we want to test if two have a relationship or not
Spearman Rho Correlation
 Spearman Rho Correlation Learning Objectives After studying this Chapter, you should be able to: know when to use Spearman rho, Calculate Spearman rho coefficient, Interpret the correlation coefficient,
Introduction to Statistical Data Analysis Lecture 5: Confidence Intervals
 Introduction to Statistical Data Analysis Lecture 5: Confidence Intervals James V. Lambers Department of Mathematics The University of Southern Mississippi James V. Lambers Statistical Data Analysis 1
PSYC 331 STATISTICS FOR PSYCHOLOGISTS
 PSYC 331 STATISTICS FOR PSYCHOLOGISTS Session 4 A PARAMETRIC STATISTICAL TEST FOR MORE THAN TWO POPULATIONS Lecturer: Dr. Paul Narh Doku, Dept of Psychology, UG Contact Information: pndoku@ug.edu.gh College
Last two weeks: Sample, population and sampling distributions finished with estimation & confidence intervals
 Past weeks: Measures of central tendency (mean, mode, median) Measures of dispersion (standard deviation, variance, range, etc). Working with the normal curve Last two weeks: Sample, population and sampling
AMS7: WEEK 7. CLASS 1. More on Hypothesis Testing Monday May 11th, 2015
 AMS7: WEEK 7. CLASS 1 More on Hypothesis Testing Monday May 11th, 2015 Testing a Claim about a Standard Deviation or a Variance We want to test claims about or 2 Example: Newborn babies from mothers taking
Last week: Sample, population and sampling distributions finished with estimation & confidence intervals
 Past weeks: Measures of central tendency (mean, mode, median) Measures of dispersion (standard deviation, variance, range, etc). Working with the normal curve Last week: Sample, population and sampling
Sampling distribution of t. 2. Sampling distribution of t. 3. Example: Gas mileage investigation. II. Inferential Statistics (8) t =
 t =") 2. The distribution of t values that would be obtained if a value of t were calculated for each sample mean for all possible random of a given size from a population _ t ratio: (X - µ hyp ) t s x The result
2. The distribution of t values that would be obtained if a value of t were calculated for each sample mean for all possible random of a given size from a population _ t ratio: (X - µ hyp ) t s x The result
Module 8: Linear Regression. The Applied Research Center
 Module 8: Linear Regression The Applied Research Center Module 8 Overview } Purpose of Linear Regression } Scatter Diagrams } Regression Equation } Regression Results } Example Purpose } To predict scores
Stat 231 Exam 2 Fall 2013
 Stat 231 Exam 2 Fall 2013 I have neither given nor received unauthorized assistance on this exam. Name Signed Date Name Printed 1 1. Some IE 361 students worked with a manufacturer on quantifying the capability
Inferences About Two Proportions
 Inferences About Two Proportions Quantitative Methods II Plan for Today Sampling two populations Confidence intervals for differences of two proportions Testing the difference of proportions Examples 1
Chapter 24. Comparing Means. Copyright 2010 Pearson Education, Inc.
 Chapter 24 Comparing Means Copyright 2010 Pearson Education, Inc. Plot the Data The natural display for comparing two groups is boxplots of the data for the two groups, placed side-by-side. For example:
Chapter 23. Inferences About Means. Monday, May 6, 13. Copyright 2009 Pearson Education, Inc.
 Chapter 23 Inferences About Means Sampling Distributions of Means Now that we know how to create confidence intervals and test hypotheses about proportions, we do the same for means. Just as we did before,
Examine characteristics of a sample and make inferences about the population
 Chapter 11 Introduction to Inferential Analysis Learning Objectives Understand inferential statistics Explain the difference between a population and a sample Explain the difference between parameter and
Statistics Primer. ORC Staff: Jayme Palka Peter Boedeker Marcus Fagan Trey Dejong
 Statistics Primer ORC Staff: Jayme Palka Peter Boedeker Marcus Fagan Trey Dejong 1 Quick Overview of Statistics 2 Descriptive vs. Inferential Statistics Descriptive Statistics: summarize and describe data
How do we compare the relative performance among competing models?
 How do we compare the relative performance among competing models? 1 Comparing Data Mining Methods Frequent problem: we want to know which of the two learning techniques is better How to reliably say Model
Sampling. What is the purpose of sampling: Sampling Terms. Sampling and Sampling Distributions
 Sampling and Sampling Distributions Normal Distribution Aims of Sampling Basic Principles of Probability Types of Random Samples Sampling Distributions Sampling Distribution of the Mean Standard Error
Confidence Interval Estimation
 Department of Psychology and Human Development Vanderbilt University 1 Introduction 2 3 4 5 Relationship to the 2-Tailed Hypothesis Test Relationship to the 1-Tailed Hypothesis Test 6 7 Introduction In
EXAM 3 Math 1342 Elementary Statistics 6-7
 EXAM 3 Math 1342 Elementary Statistics 6-7 Name Date ********************************************************************************************************************************************** MULTIPLE
Second Midterm Exam Economics 410 Thurs., April 2, 2009
 Second Midterm Exam Economics 410 Thurs., April 2, 2009 Show All Work. Only partial credit will be given for correct answers if we can not figure out how they were derived. Note that we have not put equal
Math 628 In-class Exam 2 04/03/2013
 Math 628 In-class Exam 2 04/03/2013 Name: KU ID: Note: Show ALL work clearly in the space provided. In order to receive full credit on a problem, solution methods must be complete, logical and understandable.
Information Sources. Class webpage (also linked to my.ucdavis page for the class):
:") STATISTICS 108 Outline for today: Go over syllabus Provide requested information I will hand out blank paper and ask questions Brief introduction and hands-on activity Information Sources Class webpage
STATISTICS 108 Outline for today: Go over syllabus Provide requested information I will hand out blank paper and ask questions Brief introduction and hands-on activity Information Sources Class webpage
LAB 2. HYPOTHESIS TESTING IN THE BIOLOGICAL SCIENCES- Part 2
 LAB 2. HYPOTHESIS TESTING IN THE BIOLOGICAL SCIENCES- Part 2 Data Analysis: The mean egg masses (g) of the two different types of eggs may be exactly the same, in which case you may be tempted to accept
A3. Statistical Inference
 Appendi / A3. Statistical Inference / Mean, One Sample-1 A3. Statistical Inference Population Mean μ of a Random Variable with known standard deviation σ, and random sample of size n 1 Before selecting
Lecture Slides. Elementary Statistics Eleventh Edition. by Mario F. Triola. and the Triola Statistics Series 9.1-1
 Lecture Slides Elementary Statistics Eleventh Edition and the Triola Statistics Series by Mario F. Triola Copyright 2010, 2007, 2004 Pearson Education, Inc. All Rights Reserved. 9.1-1 Chapter 9 Inferences
Lecture 30. DATA 8 Summer Regression Inference
 DATA 8 Summer 2018 Lecture 30 Regression Inference Slides created by John DeNero (denero@berkeley.edu) and Ani Adhikari (adhikari@berkeley.edu) Contributions by Fahad Kamran (fhdkmrn@berkeley.edu) and
Inferential Statistics
 Inferential Statistics Part 1 Sampling Distributions, Point Estimates & Confidence Intervals Inferential statistics are used to draw inferences (make conclusions/judgements) about a population from a sample.
Chapter 12 - Lecture 2 Inferences about regression coefficient
 Chapter 12 - Lecture 2 Inferences about regression coefficient April 19th, 2010 Facts about slope Test Statistic Confidence interval Hypothesis testing Test using ANOVA Table Facts about slope In previous
Lecture Slides. Elementary Statistics. by Mario F. Triola. and the Triola Statistics Series
 Lecture Slides Elementary Statistics Tenth Edition and the Triola Statistics Series by Mario F. Triola Slide 1 Chapter 9 Inferences from Two Samples 9-1 Overview 9-2 Inferences About Two Proportions 9-3
a. See the textbook for examples of proving logical equivalence using truth tables. b. There is a real number x for which f (x) < 0. (x 1) 2 > 0.
 < 0. (x 1) 2 > 0.") For some problems, several sample proofs are given here. Problem 1. a. See the textbook for examples of proving logical equivalence using truth tables. b. There is a real number x for which f (x) < 0.
For some problems, several sample proofs are given here. Problem 1. a. See the textbook for examples of proving logical equivalence using truth tables. b. There is a real number x for which f (x) < 0.
INTRODUCTION TO ANALYSIS OF VARIANCE
 CHAPTER 22 INTRODUCTION TO ANALYSIS OF VARIANCE Chapter 18 on inferences about population means illustrated two hypothesis testing situations: for one population mean and for the difference between two
AMS 315/576 Lecture Notes. Chapter 11. Simple Linear Regression
 AMS 315/576 Lecture Notes Chapter 11. Simple Linear Regression 11.1 Motivation A restaurant opening on a reservations-only basis would like to use the number of advance reservations x to predict the number
Lecture 26: Chapter 10, Section 2 Inference for Quantitative Variable Confidence Interval with t
 Lecture 26: Chapter 10, Section 2 Inference for Quantitative Variable Confidence Interval with t t Confidence Interval for Population Mean Comparing z and t Confidence Intervals When neither z nor t Applies
T.I.H.E. IT 233 Statistics and Probability: Sem. 1: 2013 ESTIMATION AND HYPOTHESIS TESTING OF TWO POPULATIONS
 ESTIMATION AND HYPOTHESIS TESTING OF TWO POPULATIONS In our work on hypothesis testing, we used the value of a sample statistic to challenge an accepted value of a population parameter. We focused only
The t-statistic. Student s t Test
 The t-statistic 1 Student s t Test When the population standard deviation is not known, you cannot use a z score hypothesis test Use Student s t test instead Student s t, or t test is, conceptually, very
Review: General Approach to Hypothesis Testing. 1. Define the research question and formulate the appropriate null and alternative hypotheses.
 1 Review: Let X 1, X,..., X n denote n independent random variables sampled from some distribution might not be normal!) with mean µ) and standard deviation σ). Then X µ σ n In other words, X is approximately
Two-Sample Inferential Statistics
 The t Test for Two Independent Samples 1 Two-Sample Inferential Statistics In an experiment there are two or more conditions One condition is often called the control condition in which the treatment is
Estimating the accuracy of a hypothesis Setting. Assume a binary classification setting
 Estimating the accuracy of a hypothesis Setting Assume a binary classification setting Assume input/output pairs (x, y) are sampled from an unknown probability distribution D = p(x, y) Train a binary classifier
Keppel, G. & Wickens, T.D. Design and Analysis Chapter 2: Sources of Variability and Sums of Squares
 Keppel, G. & Wickens, T.D. Design and Analysis Chapter 2: Sources of Variability and Sums of Squares K&W introduce the notion of a simple experiment with two conditions. Note that the raw data (p. 16)
Solutions to Practice Test 2 Math 4753 Summer 2005
 Solutions to Practice Test Math 4753 Summer 005 This test is worth 00 points. Questions 5 are worth 4 points each. Circle the letter of the correct answer. Each question in Question 6 9 is worth the same
0 0'0 2S ~~ Employment category
 Analyze Phase 331 60000 50000 40000 30000 20000 10000 O~----,------.------,------,,------,------.------,----- N = 227 136 27 41 32 5 ' V~ 00 0' 00 00 i-.~ fl' ~G ~~ ~O~ ()0 -S 0 -S ~~ 0 ~~ 0 ~G d> ~0~
Answer Key: Problem Set 6
 : Problem Set 6 1. Consider a linear model to explain monthly beer consumption: beer = + inc + price + educ + female + u 0 1 3 4 E ( u inc, price, educ, female ) = 0 ( u inc price educ female) σ inc var,,,
Chapter 7 Comparison of two independent samples
 Chapter 7 Comparison of two independent samples 7.1 Introduction Population 1 µ σ 1 1 N 1 Sample 1 y s 1 1 n 1 Population µ σ N Sample y s n 1, : population means 1, : population standard deviations N
6.4 Type I and Type II Errors
 6.4 Type I and Type II Errors Ulrich Hoensch Friday, March 22, 2013 Null and Alternative Hypothesis Neyman-Pearson Approach to Statistical Inference: A statistical test (also known as a hypothesis test)
Inference in Regression Analysis
 Inference in Regression Analysis Dr. Frank Wood Frank Wood, fwood@stat.columbia.edu Linear Regression Models Lecture 4, Slide 1 Today: Normal Error Regression Model Y i = β 0 + β 1 X i + ǫ i Y i value
The t-distribution. Patrick Breheny. October 13. z tests The χ 2 -distribution The t-distribution Summary
 Patrick Breheny October 13 Patrick Breheny Biostatistical Methods I (BIOS 5710) 1/25 Introduction Introduction What s wrong with z-tests? So far we ve (thoroughly!) discussed how to carry out hypothesis
Power and sample size calculations
 Patrick Breheny October 20 Patrick Breheny University of Iowa Biostatistical Methods I (BIOS 5710) 1 / 26 Planning a study Introduction What is power? Why is it important? Setup One of the most important
STA Module 11 Inferences for Two Population Means
 STA 2023 Module 11 Inferences for Two Population Means Learning Objectives Upon completing this module, you should be able to: 1. Perform inferences based on independent simple random samples to compare
STA Rev. F Learning Objectives. Two Population Means. Module 11 Inferences for Two Population Means
 STA 2023 Module 11 Inferences for Two Population Means Learning Objectives Upon completing this module, you should be able to: 1. Perform inferences based on independent simple random samples to compare
M(t) = 1 t. (1 t), 6 M (0) = 20 P (95. X i 110) i=1
 = 1 t. (1 t), 6 M (0) = 20 P (95. X i 110) i=1") Math 66/566 - Midterm Solutions NOTE: These solutions are for both the 66 and 566 exam. The problems are the same until questions and 5. 1. The moment generating function of a random variable X is M(t)
Math 66/566 - Midterm Solutions NOTE: These solutions are for both the 66 and 566 exam. The problems are the same until questions and 5. 1. The moment generating function of a random variable X is M(t)
Hypothesis Testing and Confidence Intervals (Part 2): Cohen s d, Logic of Testing, and Confidence Intervals
: Cohen s d, Logic of Testing, and Confidence Intervals") Hypothesis Testing and Confidence Intervals (Part 2): Cohen s d, Logic of Testing, and Confidence Intervals Lecture 9 Justin Kern April 9, 2018 Measuring Effect Size: Cohen s d Simply finding whether a
Hypothesis Testing and Confidence Intervals (Part 2): Cohen s d, Logic of Testing, and Confidence Intervals Lecture 9 Justin Kern April 9, 2018 Measuring Effect Size: Cohen s d Simply finding whether a
Statistical Inference. Why Use Statistical Inference. Point Estimates. Point Estimates. Greg C Elvers
 Statistical Inference Greg C Elvers 1 Why Use Statistical Inference Whenever we collect data, we want our results to be true for the entire population and not just the sample that we used But our sample
Understanding p Values
 Understanding p Values James H. Steiger Vanderbilt University James H. Steiger Vanderbilt University Understanding p Values 1 / 29 Introduction Introduction In this module, we introduce the notion of a
Comparing Means from Two-Sample
 Comparing Means from Two-Sample Kwonsang Lee University of Pennsylvania kwonlee@wharton.upenn.edu April 3, 2015 Kwonsang Lee STAT111 April 3, 2015 1 / 22 Inference from One-Sample We have two options to
Do not copy, post, or distribute
 14 CORRELATION ANALYSIS AND LINEAR REGRESSION Assessing the Covariability of Two Quantitative Properties 14.0 LEARNING OBJECTIVES In this chapter, we discuss two related techniques for assessing a possible
Paired Samples. Lecture 37 Sections 11.1, 11.2, Robb T. Koether. Hampden-Sydney College. Mon, Apr 2, 2012
 Paired Samples Lecture 37 Sections 11.1, 11.2, 11.3 Robb T. Koether Hampden-Sydney College Mon, Apr 2, 2012 Robb T. Koether (Hampden-Sydney College) Paired Samples Mon, Apr 2, 2012 1 / 17 Outline 1 Dependent
STA Module 10 Comparing Two Proportions
 STA 2023 Module 10 Comparing Two Proportions Learning Objectives Upon completing this module, you should be able to: 1. Perform large-sample inferences (hypothesis test and confidence intervals) to compare
Lecture on Null Hypothesis Testing & Temporal Correlation
 Lecture on Null Hypothesis Testing & Temporal Correlation CS 590.21 Analysis and Modeling of Brain Networks Department of Computer Science University of Crete Acknowledgement Resources used in the slides
POLI 443 Applied Political Research
 POLI 443 Applied Political Research Session 6: Tests of Hypotheses Contingency Analysis Lecturer: Prof. A. Essuman-Johnson, Dept. of Political Science Contact Information: aessuman-johnson@ug.edu.gh College
Hypothesis Testing. Week 04. Presented by : W. Rofianto
 Hypothesis Testing Week 04 Presented by : W. Rofianto Tests about a Population Mean: σ unknown Test Statistic t x 0 s / n This test statistic has a t distribution with n - 1 degrees of freedom. Example:
Hypothesis testing (cont d)
") Hypothesis testing (cont d) Ulrich Heintz Brown University 4/12/2016 Ulrich Heintz - PHYS 1560 Lecture 11 1 Hypothesis testing Is our hypothesis about the fundamental physics correct? We will not be able
Hypothesis testing (cont d) Ulrich Heintz Brown University 4/12/2016 Ulrich Heintz - PHYS 1560 Lecture 11 1 Hypothesis testing Is our hypothesis about the fundamental physics correct? We will not be able
Homework 2: Simple Linear Regression
 STAT 4385 Applied Regression Analysis Homework : Simple Linear Regression (Simple Linear Regression) Thirty (n = 30) College graduates who have recently entered the job market. For each student, the CGPA
Section 9.4. Notation. Requirements. Definition. Inferences About Two Means (Matched Pairs) Examples
 Examples") Objective Section 9.4 Inferences About Two Means (Matched Pairs) Compare of two matched-paired means using two samples from each population. Hypothesis Tests and Confidence Intervals of two dependent means
Objective Section 9.4 Inferences About Two Means (Matched Pairs) Compare of two matched-paired means using two samples from each population. Hypothesis Tests and Confidence Intervals of two dependent means
i=1 X i/n i=1 (X i X) 2 /(n 1). Find the constant c so that the statistic c(x X n+1 )/S has a t-distribution. If n = 8, determine k such that
 2 /(n 1). Find the constant c so that the statistic c(x X n+1 )/S has a t-distribution. If n = 8, determine k such that") Math 47 Homework Assignment 4 Problem 411 Let X 1, X,, X n, X n+1 be a random sample of size n + 1, n > 1, from a distribution that is N(µ, σ ) Let X = n i=1 X i/n and S = n i=1 (X i X) /(n 1) Find the
Math 47 Homework Assignment 4 Problem 411 Let X 1, X,, X n, X n+1 be a random sample of size n + 1, n > 1, from a distribution that is N(µ, σ ) Let X = n i=1 X i/n and S = n i=1 (X i X) /(n 1) Find the
Hypothesis Testing One Sample Tests
 STATISTICS Lecture no. 13 Department of Econometrics FEM UO Brno office 69a, tel. 973 442029 email:jiri.neubauer@unob.cz 12. 1. 2010 Tests on Mean of a Normal distribution Tests on Variance of a Normal
STAT 515 fa 2016 Lec Statistical inference - hypothesis testing
 STAT 515 fa 2016 Lec 20-21 Statistical inference - hypothesis testing Karl B. Gregory Wednesday, Oct 12th Contents 1 Statistical inference 1 1.1 Forms of the null and alternate hypothesis for µ and p....................
Chapter 9 Inferences from Two Samples
 Chapter 9 Inferences from Two Samples 9-1 Review and Preview 9-2 Two Proportions 9-3 Two Means: Independent Samples 9-4 Two Dependent Samples (Matched Pairs) 9-5 Two Variances or Standard Deviations Review
CHAPTER 10 Comparing Two Populations or Groups
 CHAPTER 10 Comparing Two Populations or Groups 10.1 Comparing Two Proportions The Practice of Statistics, 5th Edition Starnes, Tabor, Yates, Moore Bedford Freeman Worth Publishers Comparing Two Proportions
Econometrics Review questions for exam
 Econometrics Review questions for exam Nathaniel Higgins nhiggins@jhu.edu, 1. Suppose you have a model: y = β 0 x 1 + u You propose the model above and then estimate the model using OLS to obtain: ŷ =
Advanced Experimental Design
 Advanced Experimental Design Topic Four Hypothesis testing (z and t tests) & Power Agenda Hypothesis testing Sampling distributions/central limit theorem z test (σ known) One sample z & Confidence intervals
Political Science 236 Hypothesis Testing: Review and Bootstrapping
 Political Science 236 Hypothesis Testing: Review and Bootstrapping Rocío Titiunik Fall 2007 1 Hypothesis Testing Definition 1.1 Hypothesis. A hypothesis is a statement about a population parameter The
Review of probability and statistics 1 / 31
 Review of probability and statistics 1 / 31 2 / 31 Why? This chapter follows Stock and Watson (all graphs are from Stock and Watson). You may as well refer to the appendix in Wooldridge or any other introduction
Psychology 282 Lecture #4 Outline Inferences in SLR
 Psychology 282 Lecture #4 Outline Inferences in SLR Assumptions To this point we have not had to make any distributional assumptions. Principle of least squares requires no assumptions. Can use correlations
Chapter 11 - Lecture 1 Single Factor ANOVA
 Chapter 11 - Lecture 1 Single Factor ANOVA April 7th, 2010 Means Variance Sum of Squares Review In Chapter 9 we have seen how to make hypothesis testing for one population mean. In Chapter 10 we have seen
In addition to the interactions reported in the main text, we separately
 Experiment 3 In addition to the interactions reported in the main text, we separately examined effects of value on list 1 and effects of value on recall averaged across lists 2-8. For list 1, a 2 x 3 (item
Slides for Data Mining by I. H. Witten and E. Frank
 Slides for Data Mining by I. H. Witten and E. Frank Predicting performance Assume the estimated error rate is 5%. How close is this to the true error rate? Depends on the amount of test data Prediction
CIVL /8904 T R A F F I C F L O W T H E O R Y L E C T U R E - 8
 CIVL - 7904/8904 T R A F F I C F L O W T H E O R Y L E C T U R E - 8 Chi-square Test How to determine the interval from a continuous distribution I = Range 1 + 3.322(logN) I-> Range of the class interval
FRANKLIN UNIVERSITY PROFICIENCY EXAM (FUPE) STUDY GUIDE
 STUDY GUIDE") FRANKLIN UNIVERSITY PROFICIENCY EXAM (FUPE) STUDY GUIDE Course Title: Probability and Statistics (MATH 80) Recommended Textbook(s): Number & Type of Questions: Probability and Statistics for Engineers
FRANKLIN UNIVERSITY PROFICIENCY EXAM (FUPE) STUDY GUIDE Course Title: Probability and Statistics (MATH 80) Recommended Textbook(s): Number & Type of Questions: Probability and Statistics for Engineers
Evaluation. Andrea Passerini Machine Learning. Evaluation
 Andrea Passerini passerini@disi.unitn.it Machine Learning Basic concepts requires to define performance measures to be optimized Performance of learning algorithms cannot be evaluated on entire domain
Statistics Part IV Confidence Limits and Hypothesis Testing. Joe Nahas University of Notre Dame
 Statistics Part IV Confidence Limits and Hypothesis Testing Joe Nahas University of Notre Dame Statistic Outline (cont.) 3. Graphical Display of Data A. Histogram B. Box Plot C. Normal Probability Plot
Dover- Sherborn High School Mathematics Curriculum Probability and Statistics
 Mathematics Curriculum A. DESCRIPTION This is a full year courses designed to introduce students to the basic elements of statistics and probability. Emphasis is placed on understanding terminology and
The Purpose of Hypothesis Testing
 Section 8 1A:! An Introduction to Hypothesis Testing The Purpose of Hypothesis Testing See s Candy states that a box of it s candy weighs 16 oz. They do not mean that every single box weights exactly 16
Big Data Analysis with Apache Spark UC#BERKELEY
 Big Data Analysis with Apache Spark UC#BERKELEY This Lecture: Relation between Variables An association A trend» Positive association or Negative association A pattern» Could be any discernible shape»
Sampling Distributions: Central Limit Theorem
 Review for Exam 2 Sampling Distributions: Central Limit Theorem Conceptually, we can break up the theorem into three parts: 1. The mean (µ M ) of a population of sample means (M) is equal to the mean (µ)
Evaluation requires to define performance measures to be optimized
 Evaluation Basic concepts Evaluation requires to define performance measures to be optimized Performance of learning algorithms cannot be evaluated on entire domain (generalization error) approximation
Parameter Estimation, Sampling Distributions & Hypothesis Testing
 Parameter Estimation, Sampling Distributions & Hypothesis Testing Parameter Estimation & Hypothesis Testing In doing research, we are usually interested in some feature of a population distribution (which
D. A 90% confidence interval for the ratio of two variances is (.023,1.99). Based on the confidence interval you will fail to reject H 0 =!
. Based on the confidence interval you will fail to reject H 0 =!") SMAM 314 Review for Exam 3 1. Mark the following statements true (T) or false(f) A. A null hypothesis that is rejected at α=.01 will always be rejected at α=.05. Β. One hundred 90% confidence intervals
SMAM 314 Review for Exam 3 1. Mark the following statements true (T) or false(f) A. A null hypothesis that is rejected at α=.01 will always be rejected at α=.05. Β. One hundred 90% confidence intervals
Chapter 22. Comparing Two Proportions. Bin Zou STAT 141 University of Alberta Winter / 15
 Chapter 22 Comparing Two Proportions Bin Zou (bzou@ualberta.ca) STAT 141 University of Alberta Winter 2015 1 / 15 Introduction In Ch.19 and Ch.20, we studied confidence interval and test for proportions,
Cogs 14B: Introduction to Statistical Analysis
 Cogs 14B: Introduction to Statistical Analysis Statistical Tools: Description vs. Prediction/Inference Description Averages Variability Correlation Prediction (Inference) Regression Confidence intervals/
Soc 3811 Basic Social Statistics Second Midterm Exam Spring Your Name [50 points]: ID #: ANSWERS
![Soc 3811 Basic Social Statistics Second Midterm Exam Spring Your Name [50 points]: ID #: ANSWERS](/thumbs/87/95432281.jpg "Soc 3811 Basic Social Statistics Second Midterm Exam Spring Your Name [50 points]: ID #: ANSWERS") Soc 3811 Basic Social Statistics Second idterm Exam Spring 010 our Name [50 points]: ID #: INSTRUCTIONS: ANSERS (A) rite your name on the line at top front of every sheet. (B) If you use a page of notes
Soc 3811 Basic Social Statistics Second idterm Exam Spring 010 our Name [50 points]: ID #: INSTRUCTIONS: ANSERS (A) rite your name on the line at top front of every sheet. (B) If you use a page of notes
23. MORE HYPOTHESIS TESTING
 23. MORE HYPOTHESIS TESTING The Logic Behind Hypothesis Testing For simplicity, consider testing H 0 : µ = µ 0 against the two-sided alternative H A : µ µ 0. Even if H 0 is true (so that the expectation
Lecture Slides. Elementary Statistics Tenth Edition. by Mario F. Triola. and the Triola Statistics Series
 Lecture Slides Elementary Statistics Tenth Edition and the Triola Statistics Series by Mario F. Triola Slide 1 Chapter 7 Estimates and Sample Sizes 7-1 Overview 7-2 Estimating a Population Proportion 7-3
Chapter 24. Comparing Means
 Chapter 4 Comparing Means!1 /34 Homework p579, 5, 7, 8, 10, 11, 17, 31, 3! /34 !3 /34 Objective Students test null and alternate hypothesis about two!4 /34 Plot the Data The intuitive display for comparing
Pubh 8482: Sequential Analysis
 Pubh 8482: Sequential Analysis Joseph S. Koopmeiners Division of Biostatistics University of Minnesota Week 8 P-values When reporting results, we usually report p-values in place of reporting whether or
Warm-up Using the given data Create a scatterplot Find the regression line
 Time at the lunch table Caloric intake 21.4 472 30.8 498 37.7 335 32.8 423 39.5 437 22.8 508 34.1 431 33.9 479 43.8 454 42.4 450 43.1 410 29.2 504 31.3 437 28.6 489 32.9 436 30.6 480 35.1 439 33.0 444
AP Statistics Ch 12 Inference for Proportions
 Ch 12.1 Inference for a Population Proportion Conditions for Inference The statistic that estimates the parameter p (population proportion) is the sample proportion p ˆ. p ˆ = Count of successes in the
10/4/2013. Hypothesis Testing & z-test. Hypothesis Testing. Hypothesis Testing
 & z-test Lecture Set 11 We have a coin and are trying to determine if it is biased or unbiased What should we assume? Why? Flip coin n = 100 times E(Heads) = 50 Why? Assume we count 53 Heads... What could