Probabilistic Models of Past Climate Change
|
|
|
- Erin Greer
- 5 years ago
- Views:
Transcription
1 Probabilistic Models of Past Climate Change Julien Emile-Geay USC College, Department of Earth Sciences SIAM International Conference on Data Mining Anaheim, California April 27, 2012
 Bala Rajaratnam (Stanford) Tapio")

2 Probabilistic Models of Past Climate Change Julien Emile-Geay (USC) with: Dominique Guillot (USC) Bala Rajaratnam (Stanford) Tapio Schneider (CalTech) acknowledgements: Jianghao Wang (USC) Outline: 1. Mathematical Problem 2. Gaussian Graphical Models 3. Some results 4. Error estimates
3 Reconstructing Past Climates Why paleoclimatology? Is it warmer now than in AD 1000? ( Hockey Stick problem) Is the rate of warming anomalous? What are the spatiotemporal characteristics of natural climate variability? How (un)certain is all this? Statistical challenges Short training set (calibration) Very high-dimensional (p >n) Noisy, autocorrelated predictors No straightforward spatial model Temperature Anomaly ( C) Temperature Anomaly ( C) 0 CPS land with uncertainties EIV land with uncertainties EIV land+ocn with uncertainties Mann and Jones (2003) Esper et al. (2002) Moberg et al. (2005) HAD Instrumental Record CRU Instrumental Record Northern Hemisphere CPS land with uncertainties EIV land with uncertainties EIV land+ocn with uncertainties Mann and Jones (2003) Esper et al. (2002) Moberg et al. (2005) HAD Instrumental Record CRU Instrumental Record CPS land+ocn with uncertainties Briffa et al. (2001) Crowley and Lowery (2000) Mann et al. (1999) Jones et al. (1998) Oerlemans (2005) Mann et al. (2003) Optimal Borehole Huang et al. (2000) Borehole Mann et al., PNAS, 2008 Julien Emile-Geay


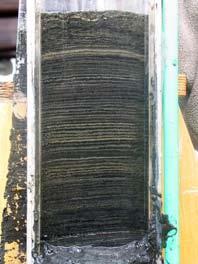

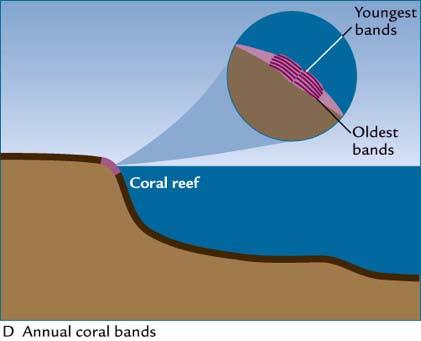
4 High-resolution paleoclimate proxies Speleothems Tree Rings Ice cores Sediment cores Corals


5 High-precision dating Ruddiman, 2006
6 Climate Field Reconstruction A missing data problem backcast T from proxy observations multivariate inference A high-dimensional problem e.g. Mann et al [2008] database p = p i +p p = n =150 Instrumental Temperature T 1,, T pi Proxies P 1,,P pp Covariance matrix captures relationship between temperature and proxies sample covariance matrix is rank-deficient unknown P 1,,P pp estimation is impossible from the sample covariance matrix: it must be regularized 0
7 Regularized Covariance Estimation (1) Maximum Likelihood Estimation using l2-penalized likelihood and Expectation-Maximization [Dempster, Laird and Rubin, 1977] L 2 (Σ,h)= n 2 tr(σ 1 S) n 2 Σ 1 + h i<j σ ij 2 2 (2) Regularized Solution: ˆΣ aa = VΛ 2 V T F Λ V T ˆΣam (Fourier coefficients) ˆB = V Diag(f j ) Λ F with fj the filter factors Tikhonov Regularization ( Ridge regression ) f j = λ j 2 /(λ j 2 + h 2 ) Julien Emile-Geay USC 2012
 e.g.")
8 Explicit Spatial Modeling C ij = f(d i j ) e.g. kriging Limitations: isotropic rigid subjective Julien Emile-Geay USC 2012


9 Graphical models: spatial modeling Land/Ocean boundaries Mountain ranges Teleconnections / climate patterns 5/21
10 Marginal vs Conditional Independence Marginal independence: X i X j Σ ij =0 Conditional independence: X i X j {rest of variables} Ω ij =0. Example: Ω = Σ =
11 Discovering conditional independence relations Exploiting conditional independence relations: Conditional independence relations are inherent to climate fields: Knowledge of such relations zeros in Ω dimension reduction; Can be discovered using 1 type optimization methods. Graphical lasso: Friedman, Hastie & Tibshirani [2008] max Ω>0 log-likelihood(ω)+ρ Ω ij. i,j Ω 1 Graphical maximum likelihood estimate: ˆΣ G = max likelihood(σ) Σ 1 P + G Best covariance matrix compatible with the CI structure. Benefits: Adding a 1 penalty favors sparse estimates of Ω; Sparse estimates achieve the necessary dimension reduction for proper estimation of Σ. 7/21
12 Flexible covariance representation Temperature neighbors of selected point 80 o N 40 o N 0 o 40 o S 80 o S 180 o W 120 o W 60 o W 0 o 60 o E 120 o E 180 o W HadCRUT3v data, Julien Emile-Geay USC 2012
13 Example of graph (HadCRUT3v data) Julien Emile-Geay USC 2011
14 e Graphical EM (GraphEM) algorithm (2) Compute Dempster, Laird & Rubin, 1977 Schneider, 2001 (1) µ 0, Σ 0 CI structure ˆΣ = ˆΣ G (Regularization) Update Compute regression coefficients (5) {µ, Σ} ˆB = ˆΣ + aa ˆΣ am (3) ˆx m = ˆµ m +(x a ˆµ a )ˆB Guillot et al, JASA, submitted (4) Estimate unknown values from the available ones

15 A virtual climate laboratory Standard deviation of CSM1.4 millennial run CSM1.4 specs: - Coupled General Circulation Model - Plausible surrogate climate - Generate pseudoproxies as statistically-degraded, subsampled version of the temperature field σ (K) Julien Emile-Geay USC 2012
16 Pseudoproxy Tests The GraphEM methodology is tested on synthetic proxies derived from a forced simulation of the NCAR CSM1.4 model (including volcanic and solar forcing) P p (s, t) =T (s, t)+ξ(s, t)/snr where ξ is a standard, uncorrelated Gaussian process Signal to noise ratio: SNR = ρ 1 ρ 2 MSE = i Test Statistic: (ŷ i y i ) 2 Case SNR = SNR = 1 SNR = 0.5 SNR = 0.25
17 Error reduction % MSE reduction, GraphEM - RegEM TTLS SNR = 0.5 >= <= 40 Julien Emile-Geay USC 2012
18 North American reconstructions (100 noise realizations) GGM+TTLS MSE improvement (%) 65 1 Global mean reconstructions TTLS GGM+TTLS Target Temperature deviation (C) Time (years) Substantial reduction in MSE Much improved risk properties Julien Emile-Geay USC 2012
19 Coral-based sea-surface temperature reconstructions 40 o N Proxy representation by age (47 records) 30 o N 20 o N 10 o N 0 o 10 o S 20 o S 30 o S 18 O Sr/Ca other 40 o S Most ancient age resolved Proxy availability over time # proxies O Sr/Ca other Time Julien Emile-Geay USC 2012
20 Bootstrap error estimates NINO3.4 reconstruction Temperature deviation (oc) Narrower confidence intervals, but 2 regularization problems persist RegEM TTLS 95% CI GraphEM TTLS 95% CI 6 # proxies available Time (year) Time Julien Emile-Geay USC 2012
21 Coral-based SST uncertainties: GraphEM TTLS Spatial estimate of the uncertainties t = 1650 t = 1675 t = 1700 t = t = 1750 t = 1775 t = 1800 t = t = 1850 t = 1875 t = 1900 t = t = 1950 t = 1975 t = 1995
22 Conclusions Paleoclimate Reconstructions High-dimensional, multivariate inference problem Should benefit from latest advances in statistics Gaussian Graphical Models Enable flexible covariance estimation, reduce errors Model selection, not regularization ( 2 still needed) Choice of graph: spatial truncation? Current and future developments GraphEM: Analysis of uncertainties (bootstrap interval coverage rate) Application to up-to-date proxy databases (coral, multiproxy) Bayesian Modeling Closed-form Bayes estimators with graphical covariance structure Incorporation into Bayesian hierarchical models

23 questions, comments, data, preprints:
24 Bayes Bayesian Hierarchical Models Pr(par obs) = Pr(obs par) Pr(par) Theorem Posterior Likelihood Prior 3 levels of conditioning: Y : Climate Process (s,t) W : Latent Process (s,t) (unobserved) Z : Observed Process (s,t) Scientific understanding can be encoded at the appropriate level p Y; W I;j ; W P;j ; qj Z I;j ; Z P;k ff ðyjqþg WI;j ; W P;k Y; q " Y N I h I;j ZI;jWI;j ; q #" Y N P h P;k ZP;kWP;k ; q # pðqþ: j ¼ 1 k ¼ 1 Posterior Likelihood Prior Tingley et al, 2012 Julien Emile-Geay IMSC11
25 Full Proxy Network for Climate Field Reconstruction (1138 records) 80 o N 60 o N 40 o N 20 o N 0 o 20 o S 40 o S 60 o S 80 o S 180 o W 120 o W 60 o W 0 o 60 o E 120 o E 180 o W # proxies Tree Ring Width Tree Ring MXD Ice core Coral Speleothem Documentary Sediment Composite Proxy availability over time Time
MATH 829: Introduction to Data Mining and Analysis Graphical Models III - Gaussian Graphical Models (cont.)
") 1/12 MATH 829: Introduction to Data Mining and Analysis Graphical Models III - Gaussian Graphical Models (cont.) Dominique Guillot Departments of Mathematical Sciences University of Delaware May 6, 2016
1/12 MATH 829: Introduction to Data Mining and Analysis Graphical Models III - Gaussian Graphical Models (cont.) Dominique Guillot Departments of Mathematical Sciences University of Delaware May 6, 2016
Paleoclimate constraints on ENSO statistics
 Paleoclimate constraints on ENSO statistics Julien Emile-Geay USC Earth Sciences & Center for Applied Mathematical Sciences Workshop on ENSO diversity, Boulder, CO // Feb 8, 23 Three Questions. have ENSO
NOTES AND CORRESPONDENCE
 5666 J O U R N A L O F C L I M A T E VOLUME 20 NOTES AND CORRESPONDENCE Comments on Testing the Fidelity of Methods Used in Proxy-Based Reconstructions of Past Climate : The Role of the Standardization
Comment on Testing the Fidelity of Methods Used in Proxy-Based Reconstructions of Past Climate : The role of the standardization interval
 Comment on Testing the Fidelity of Methods Used in Proxy-Based Reconstructions of Past Climate : The role of the standardization interval Jason E. Smerdon and Alexey Kaplan Lamont-Doherty Earth Observatory,
!"#$%&'()*+, ==== == OIP !"#$%& National Research Council of the National Academies. !"!"#$ G. R. North! "!"#21 1/4 "#$%&'()*+
*+, ==== == OIP !#$%& National Research Council of the National Academies. !!#$ G. R. North! !#21 1/4 #$%&'()*+") ==== www.climatechange.cn P = N OMMT N % Vol.3, No. 1 January, 2 0 0 7 ADVANCES IN CLIMATE CHANGE RESEARCH!"1673-1719 (2007) 01-0014-06 %&'()*+, N=!= NIO == OIP N OIP!" NMMUTN O=!" #$%&'()*+ NMMMUN P=!"=
==== www.climatechange.cn P = N OMMT N % Vol.3, No. 1 January, 2 0 0 7 ADVANCES IN CLIMATE CHANGE RESEARCH!"1673-1719 (2007) 01-0014-06 %&'()*+, N=!= NIO == OIP N OIP!" NMMUTN O=!" #$%&'()*+ NMMMUN P=!"=
Reply to comment by Rutherford et al. on Erroneous Model. Field Representations in Multiple Pseudoproxy Studies: Corrections and Implications
 /D7H;)LOHWH[VW\FOVEVWELE &OLFNKHUHWRGRZQORDG/D7H;)LOHWH[VW\FOVEVWELEBMFOLPBVPHUGRQHWDOWH[ Generated using version 3.0 of the official AMS L A TEX template 1 Reply to comment by Rutherford et al. on Erroneous
Surface Temperature Reconstructions for the Last 2,000 Years. Statement of
 Surface Temperature Reconstructions for the Last 2,000 Years Statement of Gerald R. North, Ph.D. Chairman, Committee on Surface Temperature Reconstructions for the Last 2,000 Years National Research Council
Evaluation of proxy-based millennial reconstruction methods
 Clim Dyn DOI 10.1007/s0038-007-0351-9 Evaluation of proxy-based millennial reconstruction methods Terry C. K. Lee Æ Francis W. Zwiers Æ Min Tsao Received: 3 July 007 / Accepted: 9 November 007 Ó Springer-Verlag
Reply MICHAEL E. MANN
 15 JULY 2007 N O T E S A N D C O R R E S P O N D E N C E 3699 Reply MICHAEL E. MANN Department of Meteorology, and Earth and Environmental Systems Institute, The Pennsylvania State University, University
MATH 829: Introduction to Data Mining and Analysis Graphical Models II - Gaussian Graphical Models
 1/13 MATH 829: Introduction to Data Mining and Analysis Graphical Models II - Gaussian Graphical Models Dominique Guillot Departments of Mathematical Sciences University of Delaware May 4, 2016 Recall
Reconstructing the NH Mean Temperature: Can Underestimation of Trends and Variability Be Avoided?
 674 J O U R N A L O F C L I M A T E VOLUME 24 Reconstructing the NH Mean Temperature: Can Underestimation of Trends and Variability Be Avoided? BO CHRISTIANSEN Danish Meteorological Institute, Copenhagen,
Spatial performance of four climate field reconstruction methods targeting the Common Era
 GEOPHYSICAL RESEARCH LETTERS, VOL. 38,, doi:10.1029/2011gl047372, 2011 Spatial performance of four climate field reconstruction methods targeting the Common Era J. E. Smerdon, 1 A. Kaplan, 1 E. Zorita,
The Temperature Proxy Controversy
 School of Mathematics February 8, 2012 Overview Introduction 1 Introduction 2 3 4 A provocative statement Figures often beguile me, particularly when I have the arranging of them myself; in which case
Possible causes of data model discrepancy in the temperature history of the last Millennium
 This is a post-peer-review, pre-copyedit version of an article published in Scientific Reports. The final authenticated version is available online at: http://dx.doi.org/10.1038/s41598-018-25862-2 Possible
Climate Over the Past Two Millennia
 Annu. Rev. Earth Planet. Sci. 2007. 35:111 36 First published online as a Review in Advance on December 6, 2006 The Annual Review of Earth and Planetary Sciences is online at earth.annualreviews.org This
Towards a Fast Bayesian. Climate Reconstruction 1
 Towards a Fast Bayesian Climate Reconstruction 1 Peter Green April 2016 1 A thesis submitted for the degree of Doctor of Philosophy at the University of Otago, Dunedin, New Zealand. Contents Abstract 7
Recent Climate History - The Instrumental Era.
 2002 Recent Climate History - The Instrumental Era. Figure 1. Reconstructed surface temperature record. Strong warming in the first and late part of the century. El Ninos and major volcanic eruptions are
Uncertainty quantification and visualization for functional random variables
 Uncertainty quantification and visualization for functional random variables MascotNum Workshop 2014 S. Nanty 1,3 C. Helbert 2 A. Marrel 1 N. Pérot 1 C. Prieur 3 1 CEA, DEN/DER/SESI/LSMR, F-13108, Saint-Paul-lez-Durance,
Regression, Ridge Regression, Lasso
 Regression, Ridge Regression, Lasso Fabio G. Cozman - fgcozman@usp.br October 2, 2018 A general definition Regression studies the relationship between a response variable Y and covariates X 1,..., X n.
Lecture 28: Observed Climate Variability and Change
 Lecture 28: Observed Climate Variability and Change 1. Introduction This chapter focuses on 6 questions - Has the climate warmed? Has the climate become wetter? Are the atmosphere/ocean circulations changing?
Effect of scaling and regression on reconstructed temperature amplitude for the past millennium
 GEOPHYSICAL RESEARCH LETTERS, VOL. 32, L07711, doi:10.1029/2004gl021236, 2005 Effect of scaling and regression on reconstructed temperature amplitude for the past millennium Jan Esper and David C. Frank
Bayesian PalaeoClimate Reconstruction from proxies:
 Bayesian PalaeoClimate Reconstruction from proxies: Framework Bayesian modelling of space-time processes General Circulation Models Space time stochastic process C = {C(x,t) = Multivariate climate at all
Effect of scaling and regression on reconstructed temperature amplitude for the past millennium
 GEOPHYSICAL RESEARCH LETTERS, VOL. 32, L07711, doi:10.1029/2004gl021236, 2005 Effect of scaling and regression on reconstructed temperature amplitude for the past millennium Jan Esper and David C. Frank
Climate Change and Global Warming
 Climate Change and Global Warming Michael E. Mann Department of Environmental Sciences University of Virginia ETP 401 Guest Lecture University of Virginia April 12, 2005 `The balance of evidence suggests
Advanced Introduction to Machine Learning CMU-10715
 Advanced Introduction to Machine Learning CMU-10715 Gaussian Processes Barnabás Póczos http://www.gaussianprocess.org/ 2 Some of these slides in the intro are taken from D. Lizotte, R. Parr, C. Guesterin
Probabilistic Low-Rank Matrix Completion with Adaptive Spectral Regularization Algorithms
 Probabilistic Low-Rank Matrix Completion with Adaptive Spectral Regularization Algorithms François Caron Department of Statistics, Oxford STATLEARN 2014, Paris April 7, 2014 Joint work with Adrien Todeschini,
Chapter 17: Undirected Graphical Models
 Chapter 17: Undirected Graphical Models The Elements of Statistical Learning Biaobin Jiang Department of Biological Sciences Purdue University bjiang@purdue.edu October 30, 2014 Biaobin Jiang (Purdue)
Proximity-Based Anomaly Detection using Sparse Structure Learning
 Proximity-Based Anomaly Detection using Sparse Structure Learning Tsuyoshi Idé (IBM Tokyo Research Lab) Aurelie C. Lozano, Naoki Abe, and Yan Liu (IBM T. J. Watson Research Center) 2009/04/ SDM 2009 /
Regularized PCA to denoise and visualise data
 Regularized PCA to denoise and visualise data Marie Verbanck Julie Josse François Husson Laboratoire de statistique, Agrocampus Ouest, Rennes, France CNAM, Paris, 16 janvier 2013 1 / 30 Outline 1 PCA 2
DISCUSSION OF: A STATISTICAL ANALYSIS OF MULTIPLE TEMPERATURE PROXIES: ARE RECONSTRUCTIONS OF SURFACE TEMPERATURES OVER THE LAST 1000 YEARS RELIABLE?
 Submitted to the Annals of Applied Statistics arxiv: math.pr/0000000 DISCUSSION OF: A STATISTICAL ANALYSIS OF MULTIPLE TEMPERATURE PROXIES: ARE RECONSTRUCTIONS OF SURFACE TEMPERATURES OVER THE LAST 1000
Proxy reconstructions of Pacific decadal variability. March 8, 2006
 Proxy reconstructions of Pacific decadal variability Michael N. Evans Laboratory of Tree-Ring Research/Geosciences/Atmospheric Sciences ATMO/GEOS 513 web pages: http://ic.ltrr.arizona.edu/ic/enso/ March
Lecture 3. Linear Regression II Bastian Leibe RWTH Aachen
 Advanced Machine Learning Lecture 3 Linear Regression II 02.11.2015 Bastian Leibe RWTH Aachen http://www.vision.rwth-aachen.de/ leibe@vision.rwth-aachen.de This Lecture: Advanced Machine Learning Regression
A Pseudoproxy Evaluation of Bayesian Hierarchical Modeling and Canonical Correlation Analysis for Climate Field Reconstructions over Europe*
 1FEBRUARY 2013 W E R N E R E T A L. 851 A Pseudoproxy Evaluation of Bayesian Hierarchical Modeling and Canonical Correlation Analysis for Climate Field Reconstructions over Europe* JOHANNES P. WERNER AND
Point-to-point response to reviewers comments
 Point-to-point response to reviewers comments Reviewer #1 1) The authors analyze only one millennial reconstruction (Jones, 1998) with the argument that it is the only one available. This is incorrect.
CS Homework 3. October 15, 2009
 CS 294 - Homework 3 October 15, 2009 If you have questions, contact Alexandre Bouchard (bouchard@cs.berkeley.edu) for part 1 and Alex Simma (asimma@eecs.berkeley.edu) for part 2. Also check the class website
Default Priors and Effcient Posterior Computation in Bayesian
 Default Priors and Effcient Posterior Computation in Bayesian Factor Analysis January 16, 2010 Presented by Eric Wang, Duke University Background and Motivation A Brief Review of Parameter Expansion Literature
A Methodology for Robust Multiproxy Paleoclimate. Reconstructions and Modeling of Temperature. Conditional Quantiles
 A Methodology for Robust Multiproxy Paleoclimate Reconstructions and Modeling of Temperature Conditional Quantiles Lucas Janson Departments of Mathematics & Statistics Stanford University, Stanford, CA
Statistical Sciences Symposium, 2014
 College of Letters and Science Department of Statistics UC Davis Statistical Sciences Symposium, 2014 Spatial-Temporal Statistics: Methods and Applications SATURDAY April 26 8:30 a.m. 5:15 p.m. Mathematical
Historical Changes in Climate
 Historical Changes in Climate Medieval Warm Period (MWP) Little Ice Age (LIA) Lamb, 1969 Hunters in the snow by Pieter Bruegel, 1565 Retreat of the Rhone Glacier shown by comparing the drawing from 1750
Bayesian linear regression
 Bayesian linear regression Linear regression is the basis of most statistical modeling. The model is Y i = X T i β + ε i, where Y i is the continuous response X i = (X i1,..., X ip ) T is the corresponding
Inverse Covariance Estimation with Missing Data using the Concave-Convex Procedure
 Inverse Covariance Estimation with Missing Data using the Concave-Convex Procedure Jérôme Thai 1 Timothy Hunter 1 Anayo Akametalu 1 Claire Tomlin 1 Alex Bayen 1,2 1 Department of Electrical Engineering
Learning Gaussian Graphical Models with Unknown Group Sparsity
 Learning Gaussian Graphical Models with Unknown Group Sparsity Kevin Murphy Ben Marlin Depts. of Statistics & Computer Science Univ. British Columbia Canada Connections Graphical models Density estimation
Proxy-Based Northern Hemisphere Surface Temperature Reconstructions: Sensitivity to Method, Predictor Network, Target Season, and Target Domain
 University of Massachusetts Amherst From the SelectedWorks of Raymond S Bradley July, 2005 Proxy-Based Northern Hemisphere Surface Temperature Reconstructions: Sensitivity to Method, Predictor Network,
Parameter Estimation in the Spatio-Temporal Mixed Effects Model Analysis of Massive Spatio-Temporal Data Sets
 Parameter Estimation in the Spatio-Temporal Mixed Effects Model Analysis of Massive Spatio-Temporal Data Sets Matthias Katzfuß Advisor: Dr. Noel Cressie Department of Statistics The Ohio State University
Observed Climate Variability and Change: Evidence and Issues Related to Uncertainty
 Observed Climate Variability and Change: Evidence and Issues Related to Uncertainty David R. Easterling National Climatic Data Center Asheville, North Carolina Overview Some examples of observed climate
Machine Learning Techniques for Computer Vision
 Machine Learning Techniques for Computer Vision Part 2: Unsupervised Learning Microsoft Research Cambridge x 3 1 0.5 0.2 0 0.5 0.3 0 0.5 1 ECCV 2004, Prague x 2 x 1 Overview of Part 2 Mixture models EM
A Bayesian Perspective on Residential Demand Response Using Smart Meter Data
 A Bayesian Perspective on Residential Demand Response Using Smart Meter Data Datong-Paul Zhou, Maximilian Balandat, and Claire Tomlin University of California, Berkeley [datong.zhou, balandat, tomlin]@eecs.berkeley.edu
Dimension Reduction. David M. Blei. April 23, 2012
 Dimension Reduction David M. Blei April 23, 2012 1 Basic idea Goal: Compute a reduced representation of data from p -dimensional to q-dimensional, where q < p. x 1,...,x p z 1,...,z q (1) We want to do
Linear Dynamical Systems
 Linear Dynamical Systems Sargur N. srihari@cedar.buffalo.edu Machine Learning Course: http://www.cedar.buffalo.edu/~srihari/cse574/index.html Two Models Described by Same Graph Latent variables Observations
Gaussian Graphical Models and Graphical Lasso
 ELE 538B: Sparsity, Structure and Inference Gaussian Graphical Models and Graphical Lasso Yuxin Chen Princeton University, Spring 2017 Multivariate Gaussians Consider a random vector x N (0, Σ) with pdf
Bayesian Inference on Joint Mixture Models for Survival-Longitudinal Data with Multiple Features. Yangxin Huang
 Bayesian Inference on Joint Mixture Models for Survival-Longitudinal Data with Multiple Features Yangxin Huang Department of Epidemiology and Biostatistics, COPH, USF, Tampa, FL yhuang@health.usf.edu January
y(x) = x w + ε(x), (1)
 = x w + ε(x), (1)") Linear regression We are ready to consider our first machine-learning problem: linear regression. Suppose that e are interested in the values of a function y(x): R d R, here x is a d-dimensional vector-valued
Linear regression We are ready to consider our first machine-learning problem: linear regression. Suppose that e are interested in the values of a function y(x): R d R, here x is a d-dimensional vector-valued
Graphical Model Selection
 May 6, 2013 Trevor Hastie, Stanford Statistics 1 Graphical Model Selection Trevor Hastie Stanford University joint work with Jerome Friedman, Rob Tibshirani, Rahul Mazumder and Jason Lee May 6, 2013 Trevor
THE HOCKEY STICK CONTROVERSY AND PCA
 THE HOCKEY STICK CONTROVERSY AND PCA 1 In 1998/1999, Mann, Bradley and Hughes (MBH) wrote two papers reconstructing temperatures over the last 1000 years from proxy data (tree rings, corals, ice cores
Supporting Online Material for
 www.sciencemag.org/cgi/content/full/326/5957/1256/dc1 Supporting Online Material for Global Signatures and Dynamical Origins of the Little Ice Age and Medieval Climate Anomaly Michael E. Mann,* Zhihua
F & B Approaches to a simple model
 A6523 Signal Modeling, Statistical Inference and Data Mining in Astrophysics Spring 215 http://www.astro.cornell.edu/~cordes/a6523 Lecture 11 Applications: Model comparison Challenges in large-scale surveys
Today s Climate in Perspective: Hendrick Avercamp ( ) ~1608; Rijksmuseum, Amsterdam
 ~1608; Rijksmuseum, Amsterdam") Today s Climate in Perspective: Paleoclimate Evidence Hendrick Avercamp (1585-1634) ~1608; Rijksmuseum, Amsterdam Observations Instrumental surface temperature records? (Le Treut et al., 2007 IPCC AR4
Today s Climate in Perspective: Paleoclimate Evidence Hendrick Avercamp (1585-1634) ~1608; Rijksmuseum, Amsterdam Observations Instrumental surface temperature records? (Le Treut et al., 2007 IPCC AR4
Parametric Inference Maximum Likelihood Inference Exponential Families Expectation Maximization (EM) Bayesian Inference Statistical Decison Theory
 Bayesian Inference Statistical Decison Theory") Statistical Inference Parametric Inference Maximum Likelihood Inference Exponential Families Expectation Maximization (EM) Bayesian Inference Statistical Decison Theory IP, José Bioucas Dias, IST, 2007
Statistical Inference Parametric Inference Maximum Likelihood Inference Exponential Families Expectation Maximization (EM) Bayesian Inference Statistical Decison Theory IP, José Bioucas Dias, IST, 2007
Neutron inverse kinetics via Gaussian Processes
 Neutron inverse kinetics via Gaussian Processes P. Picca Politecnico di Torino, Torino, Italy R. Furfaro University of Arizona, Tucson, Arizona Outline Introduction Review of inverse kinetics techniques
PILCO: A Model-Based and Data-Efficient Approach to Policy Search
 PILCO: A Model-Based and Data-Efficient Approach to Policy Search (M.P. Deisenroth and C.E. Rasmussen) CSC2541 November 4, 2016 PILCO Graphical Model PILCO Probabilistic Inference for Learning COntrol
Climate Change Insights from the. Centuries
 Climate Change Insights from the Paleoclimate Record of Past Centuries Michael E. Mann Penn State University with contributions from: Caspar Ammann, Raymond Bradley, Elizabeth Crespin, Jeff Donnelly, Greg
Introduction to Probabilistic Graphical Models: Exercises
 Introduction to Probabilistic Graphical Models: Exercises Cédric Archambeau Xerox Research Centre Europe cedric.archambeau@xrce.xerox.com Pascal Bootcamp Marseille, France, July 2010 Exercise 1: basics
Sparse Gaussian Markov Random Field Mixtures for Anomaly Detection
 Sparse Gaussian Markov Random Field Mixtures for Anomaly Detection Tsuyoshi Idé ( Ide-san ), Ankush Khandelwal*, Jayant Kalagnanam IBM Research, T. J. Watson Research Center (*Currently with University
Virtual Sensors and Large-Scale Gaussian Processes
 Virtual Sensors and Large-Scale Gaussian Processes Ashok N. Srivastava, Ph.D. Principal Investigator, IVHM Project Group Lead, Intelligent Data Understanding ashok.n.srivastava@nasa.gov Coauthors: Kamalika
Probabilistic Reasoning in Deep Learning
 Probabilistic Reasoning in Deep Learning Dr Konstantina Palla, PhD palla@stats.ox.ac.uk September 2017 Deep Learning Indaba, Johannesburgh Konstantina Palla 1 / 39 OVERVIEW OF THE TALK Basics of Bayesian
STA414/2104 Statistical Methods for Machine Learning II
 STA414/2104 Statistical Methods for Machine Learning II Murat A. Erdogdu & David Duvenaud Department of Computer Science Department of Statistical Sciences Lecture 3 Slide credits: Russ Salakhutdinov Announcements
Random Fields in Bayesian Inference: Effects of the Random Field Discretization
 Random Fields in Bayesian Inference: Effects of the Random Field Discretization Felipe Uribe a, Iason Papaioannou a, Wolfgang Betz a, Elisabeth Ullmann b, Daniel Straub a a Engineering Risk Analysis Group,
Stochastic Spectral Approaches to Bayesian Inference
 Stochastic Spectral Approaches to Bayesian Inference Prof. Nathan L. Gibson Department of Mathematics Applied Mathematics and Computation Seminar March 4, 2011 Prof. Gibson (OSU) Spectral Approaches to
Separating Forced from Chaotic Climate Variability over the Past Millennium
 6954 J O U R N A L O F C L I M A T E VOLUME 26 Separating Forced from Chaotic Climate Variability over the Past Millennium ANDREW P. SCHURER AND GABRIELE C. HEGERL School of GeoSciences, The University
Bayesian Networks: Construction, Inference, Learning and Causal Interpretation. Volker Tresp Summer 2016
 Bayesian Networks: Construction, Inference, Learning and Causal Interpretation Volker Tresp Summer 2016 1 Introduction So far we were mostly concerned with supervised learning: we predicted one or several
Measurement error as missing data: the case of epidemiologic assays. Roderick J. Little
 Measurement error as missing data: the case of epidemiologic assays Roderick J. Little Outline Discuss two related calibration topics where classical methods are deficient (A) Limit of quantification methods
8.6 Bayesian neural networks (BNN) [Book, Sect. 6.7]
![8.6 Bayesian neural networks (BNN) [Book, Sect. 6.7]](/thumbs/81/83120300.jpg "8.6 Bayesian neural networks (BNN) [Book, Sect. 6.7]") 8.6 Bayesian neural networks (BNN) [Book, Sect. 6.7] While cross-validation allows one to find the weight penalty parameters which would give the model good generalization capability, the separation of
8.6 Bayesian neural networks (BNN) [Book, Sect. 6.7] While cross-validation allows one to find the weight penalty parameters which would give the model good generalization capability, the separation of
A Bayesian Nonparametric Approach to Monotone Missing Data in Longitudinal Studies with Informative Missingness
 A Bayesian Nonparametric Approach to Monotone Missing Data in Longitudinal Studies with Informative Missingness A. Linero and M. Daniels UF, UT-Austin SRC 2014, Galveston, TX 1 Background 2 Working model
How wrong are climate field reconstruction techniques in reconstructing a climate with long-range memory?
 Paper 3 How wrong are climate field reconstruction techniques in reconstructing a climate with long-range memory? Manuscript in preparation, to be submitted to Climate of the Past. 1 116 How wrong are
The ocean s overall role in climate
 The ocean s overall role in climate - moderates climate in time (diurnally, annually) - redistributes heat spatially in the largescale ocean circulation - lower albedo (sea ice higher albedo) - dry atmosphere
STA 4273H: Statistical Machine Learning
 STA 4273H: Statistical Machine Learning Russ Salakhutdinov Department of Statistics! rsalakhu@utstat.toronto.edu! http://www.utstat.utoronto.ca/~rsalakhu/ Sidney Smith Hall, Room 6002 Lecture 11 Project
CORRESPONDENCE ANDERS MOBERG. Department of Physical Geography and Quaternary Geology, Stockholm University, Stockholm, Sweden
 15 NOVEMBER 2012 C O R R E S P O N D E N C E 7991 CORRESPONDENCE Comments on Reconstruction of the Extratropical NH Mean Temperature over the Last Millennium with a Method That Preserves Low-Frequency
Comparing Non-informative Priors for Estimation and Prediction in Spatial Models
 Environmentrics 00, 1 12 DOI: 10.1002/env.XXXX Comparing Non-informative Priors for Estimation and Prediction in Spatial Models Regina Wu a and Cari G. Kaufman a Summary: Fitting a Bayesian model to spatial
Semi-parametric estimation of non-stationary Pickands functions
 Semi-parametric estimation of non-stationary Pickands functions Linda Mhalla 1 Joint work with: Valérie Chavez-Demoulin 2 and Philippe Naveau 3 1 Geneva School of Economics and Management, University of
High-dimensional covariance estimation based on Gaussian graphical models
 High-dimensional covariance estimation based on Gaussian graphical models Shuheng Zhou Department of Statistics, The University of Michigan, Ann Arbor IMA workshop on High Dimensional Phenomena Sept. 26,
Least Squares Regression
 CIS 50: Machine Learning Spring 08: Lecture 4 Least Squares Regression Lecturer: Shivani Agarwal Disclaimer: These notes are designed to be a supplement to the lecture. They may or may not cover all the
Gaussian processes and bayesian optimization Stanisław Jastrzębski. kudkudak.github.io kudkudak
 Gaussian processes and bayesian optimization Stanisław Jastrzębski kudkudak.github.io kudkudak Plan Goal: talk about modern hyperparameter optimization algorithms Bayes reminder: equivalent linear regression
Permutation-invariant regularization of large covariance matrices. Liza Levina
 Liza Levina Permutation-invariant covariance regularization 1/42 Permutation-invariant regularization of large covariance matrices Liza Levina Department of Statistics University of Michigan Joint work
L 0 methods. H.J. Kappen Donders Institute for Neuroscience Radboud University, Nijmegen, the Netherlands. December 5, 2011.
 L methods H.J. Kappen Donders Institute for Neuroscience Radboud University, Nijmegen, the Netherlands December 5, 2 Bert Kappen Outline George McCullochs model The Variational Garrote Bert Kappen L methods
A Robust Approach to Regularized Discriminant Analysis
 A Robust Approach to Regularized Discriminant Analysis Moritz Gschwandtner Department of Statistics and Probability Theory Vienna University of Technology, Austria Österreichische Statistiktage, Graz,
Bayesian Methods for Machine Learning
 Bayesian Methods for Machine Learning CS 584: Big Data Analytics Material adapted from Radford Neal s tutorial (http://ftp.cs.utoronto.ca/pub/radford/bayes-tut.pdf), Zoubin Ghahramni (http://hunch.net/~coms-4771/zoubin_ghahramani_bayesian_learning.pdf),
On the verification of climate reconstructions
 Clim. Past, 3, 397 49, 27 www.clim-past.net/3/397/27/ Author(s) 27. This work is licensed under a Creative Commons License. Climate of the Past On the verification of climate reconstructions G. Bürger
Hierarchical Modeling for Univariate Spatial Data
 Hierarchical Modeling for Univariate Spatial Data Geography 890, Hierarchical Bayesian Models for Environmental Spatial Data Analysis February 15, 2011 1 Spatial Domain 2 Geography 890 Spatial Domain This
letters to nature ... Highly variable Northern Hemisphere temperatures reconstructed from low- and high-resolution proxy data
 ... Highly variable Northern Hemisphere temperatures reconstructed from low- and high-resolution proxy data Anders Moberg 1, Dmitry M. Sonechkin 2, Karin Holmgren 3, Nina M. Datsenko 2 & Wibjörn Karlén
PMR Learning as Inference
 Outline PMR Learning as Inference Probabilistic Modelling and Reasoning Amos Storkey Modelling 2 The Exponential Family 3 Bayesian Sets School of Informatics, University of Edinburgh Amos Storkey PMR Learning
A New Bayesian Variable Selection Method: The Bayesian Lasso with Pseudo Variables
 A New Bayesian Variable Selection Method: The Bayesian Lasso with Pseudo Variables Qi Tang (Joint work with Kam-Wah Tsui and Sijian Wang) Department of Statistics University of Wisconsin-Madison Feb. 8,
MS-C1620 Statistical inference
 MS-C1620 Statistical inference 10 Linear regression III Joni Virta Department of Mathematics and Systems Analysis School of Science Aalto University Academic year 2018 2019 Period III - IV 1 / 32 Contents
Bayesian data analysis in practice: Three simple examples
 Bayesian data analysis in practice: Three simple examples Martin P. Tingley Introduction These notes cover three examples I presented at Climatea on 5 October 0. Matlab code is available by request to
Physician Performance Assessment / Spatial Inference of Pollutant Concentrations
 Physician Performance Assessment / Spatial Inference of Pollutant Concentrations Dawn Woodard Operations Research & Information Engineering Cornell University Johns Hopkins Dept. of Biostatistics, April
Detection of Human Influence on a New, Validated 1500-Year Temperature Reconstruction
 650 J O U R N A L O F C L I M A T E VOLUME 20 Detection of Human Influence on a New, Validated 1500-Year Temperature Reconstruction GABRIELE C. HEGERL,* THOMAS J. CROWLEY,* MYLES ALLEN, WILLIAM T. HYDE,*
An Introduction to Graphical Lasso
 An Introduction to Graphical Lasso Bo Chang Graphical Models Reading Group May 15, 2015 Bo Chang (UBC) Graphical Lasso May 15, 2015 1 / 16 Undirected Graphical Models An undirected graph, each vertex represents
ECE521 lecture 4: 19 January Optimization, MLE, regularization
 ECE521 lecture 4: 19 January 2017 Optimization, MLE, regularization First four lectures Lectures 1 and 2: Intro to ML Probability review Types of loss functions and algorithms Lecture 3: KNN Convexity
Statistics 203: Introduction to Regression and Analysis of Variance Penalized models
 Statistics 203: Introduction to Regression and Analysis of Variance Penalized models Jonathan Taylor - p. 1/15 Today s class Bias-Variance tradeoff. Penalized regression. Cross-validation. - p. 2/15 Bias-variance
Bo Li. National Center for Atmospheric Research. Based on joint work with:
 Nonparametric Assessment of Properties of Space-time Covariance Functions and its Application in Paleoclimate Reconstruction Bo Li National Center for Atmospheric Research Based on joint work with: Marc
Nonparametric Bayes tensor factorizations for big data
 Nonparametric Bayes tensor factorizations for big data David Dunson Department of Statistical Science, Duke University Funded from NIH R01-ES017240, R01-ES017436 & DARPA N66001-09-C-2082 Motivation Conditional