Hierarchical State Estimation Using Phasor Measurement Units
|
|
|
- Abner Smith
- 5 years ago
- Views:
Transcription
 and Yeo-Jun Yoon (KPX) IEEE PES GM, Calgary, Canada State Estmaton Workng Group Meetng July")
1 Herarchcal State Estmaton Usng Phasor Measurement Unts Al Abur Northeastern Unversty Benny Zhao (CA-ISO) and Yeo-Jun Yoon (KPX) IEEE PES GM, Calgary, Canada State Estmaton Workng Group Meetng July 28, 2009

2 Mult-area Operaton P L P G Independent System Operator
3 Challenge: How to montor the system state? Centralzed / Flat Soluton: Data ntensve. Dmenson grows wth system sze (areas). Data base/format must be standardzed. Large amounts of data and measurements must be exchanged between areas and ISO. Vulnerable to dsturbances to the central or any one of the area SCADA systems.
4 Challenge: How to montor the system state? Herarchcal Soluton: Each area uses ts own data. Problem sze does not grow sgnfcantly wth number of areas. Each area has ts own SE and Data-base. Lmted number of data and measurements must be exchanged between areas and ISO. Partal system montorng s possble durng ndvdual area falures.
5 Problem Statement and Constrants Areas are reluctant to share network data and measurements due to competton. Overall system state must be estmated based on lmted measurements from each area. Gross errors (bad data) n measurements must be detected, dentfed and corrected even f they appear at the area boundares. If the entre system s not observable, all states assocated wth the observable slands wll have to be estmated.
 s the estmated value of z.")
6 State Estmaton Problem Mnmze J ( x) = r T R 1 r Subject to z = h( x) + r R s the covarance of measurement errors. h(x) s the estmated value of z. x s the estmated state vector.
7 Herarchcal State Estmaton Each area SE estmates ts own state. Coordnator SE merges the solutons, and processes bad data for boundary measurements. Coordnator SE Area 1 SE Area 2 SE Area L SE
8 Measurement Decomposton k Boundary m P k : unusable P m : unusable P km : unusable P mk : unusable area 1 k m area 2 P k : unusable by 2 P m : unusable by 1 May not be avalable to area 2. May not be avalable to area 1.
9 Proposed Decomposton Area 1 Internal bus Area 3 Boundary bus External bus Area 2
10 Proposed Decomposton Defne the state vector for each area : X nt Area X ext X = X X X nt b ext X b
11 Proposed Decomposton Measurement vector for each area : Area Z c Z p Z c Z Unusable Measurements Z = c Z p Conventonal Measurements p Z Phasor (PMU) Measurements


![Else, employ optmal meter placement [1] methods to address ths problem.](/docs-images/84/90690379/images/12-8.jpg "[1] Magnago, F.H. and Abur, A.")
12 Propertes of z Should render an observable area. External boundary buses may or may not be observable. Redundancy must be suffcent to make the nternal bad data detectable and dentfable. Else, employ optmal meter placement [1] methods to address ths problem. [1] Magnago, F.H. and Abur, A., "Unfed Approach to Robust Meter Placement aganst Bad Data and Branch Outages, IEEE Trans. on Power Systems, Vol.15, No.3, August 2000, pp
2 j = 1 σ 2 j j z = h (ˆ x) + r j j")
13 Area State Estmaton Mnmze Subject to where: e N(0, σ 2) j j m : number of measurements n z z ˆ = h (ˆ x) estmated measurement j j x ˆ ˆ nt x = xˆ estmated state b xˆ ext m 1 ( r )2 j = 1 σ 2 j j z = h (ˆ x) + r j j j 1 j m
14 Measurements Receved and Used by the Coordnator s SE Each area state estmates are treated as pseudomeasurements wth the followng dstrbuton: N( xˆ, Λ ) where : Λ G [ ] 1 = G [ ] T [ ] 1[ ] = H R H [ H ] = h / x R jk = j cov( e ) k
15 Boundary measurements from each area Z b. Any avalable PMU measurements from area, Z p. Network data at area boundares. Boundary Meas. PMU Te-lnes + Frst ter nternal lnes
16 Coordnator s SE Mnmze k j = 1 1 R jj ( r )2 j e j Subject to z = h (ˆ x ) + r j j b j 1 j k N(0, σ 2 ) boundary measurements j N(0, σ 2 ) PMU measurements pj N(0, Λ ) area state estmates jj
17 = = = L p z p z L b z b z L x x x j Z L b x b x b X j e dag jj R 1 1 ˆ 2 ˆ 1 ˆ 1 )} {cov( Note: Multple pseudo-measurements for the boundary states. k m 1 2 ˆ2, ˆ1 ˆ2, ˆ1, x m x m k x k x
 or ntermedate teraton results.")
18 Propertes No boundary measurements are dscarded. All detectable / dentfable bad data are detected and dentfed. PMU measurements are effectvely used, but not requred for ths scheme to work. Areas do not share network data (nternal system detals) or ntermedate teraton results. They only provde boundary network model and measurements and ther estmated states.

19 IEEE 14 Bus System : Two Area Example


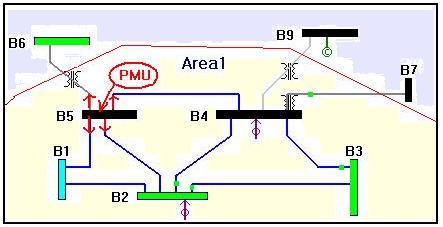
20 COORDINATOR AREA 2 AREA 1
21 Estmaton Results wth Gaussan errors (No Bad Data) -Measurements- Inj. Flow Volt.Mag Phase I-real I-mag Boundary External Integrated Area Area Coordnator Error S.D Computed Computed -Estmaton Results- Degrees of Freedom Ch- Square lmt Objectve functon J(x) Largest Normalzed Resdual Integrated Area Area Coordnator

22 Bad Data Processng (P nj at Bus 6) Note that P 6 becomes crtcal after decomposton. Bad data can not be detected by the SE of area 2.
23 Bad Data Identfcaton Results Area 2 SE Ch-square lmt (0.99% ) Objectve functon J(x) Measurement Type Largest Normalzed Resdual I-real (9,10) I-mag (9,7) I-real (9,14) Coordnator SE Ch-square lmt (0.99% ) Objectve functon J(x) Measurement Type Largest Normalzed Resdual Pnj (6) I-real (5,6) Qnj (6)

24 Conclusons A herarchcal state estmaton approach s proposed. The man advantage of the proposed set up s that ndvdual area state estmators can operate ndependently and do not have to share network data or measurements wth any neghbors. Coordnaton s accomplshed va a central coordnator, such as an ISO, whch receves state estmaton solutons from ndvdual areas and coordnates them.


25 Conclusons... Coordnator also carres out bad data processng functon n order to detect mssed bad data by ndvdual area estmators due to the reduced redundancy at area boundares durng ndvdual area estmatons. Havng PMU measurements greatly facltates but are not requred for the herarchcal soluton.
State Estimation. Ali Abur Northeastern University, USA. September 28, 2016 Fall 2016 CURENT Course Lecture Notes
 State Estmaton Al Abur Northeastern Unversty, USA September 8, 06 Fall 06 CURENT Course Lecture Notes Operatng States of a Power System Al Abur NORMAL STATE SECURE or INSECURE RESTORATIVE STATE EMERGENCY
Lecture 12: Classification
 Lecture : Classfcaton g Dscrmnant functons g The optmal Bayes classfer g Quadratc classfers g Eucldean and Mahalanobs metrcs g K Nearest Neghbor Classfers Intellgent Sensor Systems Rcardo Guterrez-Osuna
VQ widely used in coding speech, image, and video
 at Scalar quantzers are specal cases of vector quantzers (VQ): they are constraned to look at one sample at a tme (memoryless) VQ does not have such constrant better RD perfomance expected Source codng
Module 3 LOSSY IMAGE COMPRESSION SYSTEMS. Version 2 ECE IIT, Kharagpur
 Module 3 LOSSY IMAGE COMPRESSION SYSTEMS Verson ECE IIT, Kharagpur Lesson 6 Theory of Quantzaton Verson ECE IIT, Kharagpur Instructonal Objectves At the end of ths lesson, the students should be able to:
Amiri s Supply Chain Model. System Engineering b Department of Mathematics and Statistics c Odette School of Business
 Amr s Supply Chan Model by S. Ashtab a,, R.J. Caron b E. Selvarajah c a Department of Industral Manufacturng System Engneerng b Department of Mathematcs Statstcs c Odette School of Busness Unversty of
EEL 6266 Power System Operation and Control. Chapter 3 Economic Dispatch Using Dynamic Programming
 EEL 6266 Power System Operaton and Control Chapter 3 Economc Dspatch Usng Dynamc Programmng Pecewse Lnear Cost Functons Common practce many utltes prefer to represent ther generator cost functons as sngle-
Chapter 1. Probability
 Chapter. Probablty Mcroscopc propertes of matter: quantum mechancs, atomc and molecular propertes Macroscopc propertes of matter: thermodynamcs, E, H, C V, C p, S, A, G How do we relate these two propertes?
Psychology 282 Lecture #24 Outline Regression Diagnostics: Outliers
 Psychology 282 Lecture #24 Outlne Regresson Dagnostcs: Outlers In an earler lecture we studed the statstcal assumptons underlyng the regresson model, ncludng the followng ponts: Formal statement of assumptons.
MULTI-AREA POWER SYSTEM STATE ESTIMATION UTILIZING BOUNDARY. MEASUREMENTS AND PHASOR MEASUREMENT UNITS (PMUs) A Thesis MATTHEW A.
 A Thesis MATTHEW A.") MULI-AREA POWER SYSEM SAE ESIMAION UILIZING BOUNDARY MEASUREMENS AND PHASOR MEASUREMEN UNIS (PMUs) A hess by MAHEW A. FREEMAN Submtted to the Offce of Graduate Studes of exas A&M Unversty n partal fulfllment
MULI-AREA POWER SYSEM SAE ESIMAION UILIZING BOUNDARY MEASUREMENS AND PHASOR MEASUREMEN UNIS (PMUs) A hess by MAHEW A. FREEMAN Submtted to the Offce of Graduate Studes of exas A&M Unversty n partal fulfllment
The Geometry of Logit and Probit
 The Geometry of Logt and Probt Ths short note s meant as a supplement to Chapters and 3 of Spatal Models of Parlamentary Votng and the notaton and reference to fgures n the text below s to those two chapters.
= z 20 z n. (k 20) + 4 z k = 4
 + 4 z k = 4") Problem Set #7 solutons 7.2.. (a Fnd the coeffcent of z k n (z + z 5 + z 6 + z 7 + 5, k 20. We use the known seres expanson ( n+l ( z l l z n below: (z + z 5 + z 6 + z 7 + 5 (z 5 ( + z + z 2 + z + 5 5
Problem Set #7 solutons 7.2.. (a Fnd the coeffcent of z k n (z + z 5 + z 6 + z 7 + 5, k 20. We use the known seres expanson ( n+l ( z l l z n below: (z + z 5 + z 6 + z 7 + 5 (z 5 ( + z + z 2 + z + 5 5
x i1 =1 for all i (the constant ).
.") Chapter 5 The Multple Regresson Model Consder an economc model where the dependent varable s a functon of K explanatory varables. The economc model has the form: y = f ( x,x,..., ) xk Approxmate ths by
Chapter 5 The Multple Regresson Model Consder an economc model where the dependent varable s a functon of K explanatory varables. The economc model has the form: y = f ( x,x,..., ) xk Approxmate ths by
Chapter 9: Statistical Inference and the Relationship between Two Variables
 Chapter 9: Statstcal Inference and the Relatonshp between Two Varables Key Words The Regresson Model The Sample Regresson Equaton The Pearson Correlaton Coeffcent Learnng Outcomes After studyng ths chapter,
Spectral Clustering. Shannon Quinn
 Spectral Clusterng Shannon Qunn (wth thanks to Wllam Cohen of Carnege Mellon Unverst, and J. Leskovec, A. Raaraman, and J. Ullman of Stanford Unverst) Graph Parttonng Undrected graph B- parttonng task:
where I = (n x n) diagonal identity matrix with diagonal elements = 1 and off-diagonal elements = 0; and σ 2 e = variance of (Y X).
 diagonal identity matrix with diagonal elements = 1 and off-diagonal elements = 0; and σ 2 e = variance of (Y X).") 11.4.1 Estmaton of Multple Regresson Coeffcents In multple lnear regresson, we essentally solve n equatons for the p unnown parameters. hus n must e equal to or greater than p and n practce n should e
11.4.1 Estmaton of Multple Regresson Coeffcents In multple lnear regresson, we essentally solve n equatons for the p unnown parameters. hus n must e equal to or greater than p and n practce n should e
Composite Hypotheses testing
 Composte ypotheses testng In many hypothess testng problems there are many possble dstrbutons that can occur under each of the hypotheses. The output of the source s a set of parameters (ponts n a parameter
Distributed Weighted Least-Squares Estimation for Power Networks
 Preprnts of the 17th IFAC Symposum on System Identfcaton Bejng Internatonal Conventon Center October 19-21, 2015 Bejng, Chna Dstrbuted Weghted Least-Squares Estmaton for Power Networks Damán Marell Brett
Real-Time Systems. Multiprocessor scheduling. Multiprocessor scheduling. Multiprocessor scheduling
 Real-Tme Systems Multprocessor schedulng Specfcaton Implementaton Verfcaton Multprocessor schedulng -- -- Global schedulng How are tasks assgned to processors? Statc assgnment The processor(s) used for
Appendix B: Resampling Algorithms
 407 Appendx B: Resamplng Algorthms A common problem of all partcle flters s the degeneracy of weghts, whch conssts of the unbounded ncrease of the varance of the mportance weghts ω [ ] of the partcles
ISQS 6348 Final Open notes, no books. Points out of 100 in parentheses. Y 1 ε 2
 ISQS 6348 Fnal Open notes, no books. Ponts out of 100 n parentheses. 1. The followng path dagram s gven: ε 1 Y 1 ε F Y 1.A. (10) Wrte down the usual model and assumptons that are mpled by ths dagram. Soluton:
For now, let us focus on a specific model of neurons. These are simplified from reality but can achieve remarkable results.
 Neural Networks : Dervaton compled by Alvn Wan from Professor Jtendra Malk s lecture Ths type of computaton s called deep learnng and s the most popular method for many problems, such as computer vson
Chapter 13: Multiple Regression
 Chapter 13: Multple Regresson 13.1 Developng the multple-regresson Model The general model can be descrbed as: It smplfes for two ndependent varables: The sample ft parameter b 0, b 1, and b are used to
Chapter 2 - The Simple Linear Regression Model S =0. e i is a random error. S β2 β. This is a minimization problem. Solution is a calculus exercise.
 Chapter - The Smple Lnear Regresson Model The lnear regresson equaton s: where y + = β + β e for =,..., y and are observable varables e s a random error How can an estmaton rule be constructed for the
Statistics for Economics & Business
 Statstcs for Economcs & Busness Smple Lnear Regresson Learnng Objectves In ths chapter, you learn: How to use regresson analyss to predct the value of a dependent varable based on an ndependent varable
e i is a random error
 Chapter - The Smple Lnear Regresson Model The lnear regresson equaton s: where + β + β e for,..., and are observable varables e s a random error How can an estmaton rule be constructed for the unknown
4 Analysis of Variance (ANOVA) 5 ANOVA. 5.1 Introduction. 5.2 Fixed Effects ANOVA
 5 ANOVA. 5.1 Introduction. 5.2 Fixed Effects ANOVA") 4 Analyss of Varance (ANOVA) 5 ANOVA 51 Introducton ANOVA ANOVA s a way to estmate and test the means of multple populatons We wll start wth one-way ANOVA If the populatons ncluded n the study are selected
4 Analyss of Varance (ANOVA) 5 ANOVA 51 Introducton ANOVA ANOVA s a way to estmate and test the means of multple populatons We wll start wth one-way ANOVA If the populatons ncluded n the study are selected
Linear Regression Analysis: Terminology and Notation
 ECON 35* -- Secton : Basc Concepts of Regresson Analyss (Page ) Lnear Regresson Analyss: Termnology and Notaton Consder the generc verson of the smple (two-varable) lnear regresson model. It s represented
The Multiple Classical Linear Regression Model (CLRM): Specification and Assumptions. 1. Introduction
: Specification and Assumptions. 1. Introduction") ECONOMICS 5* -- NOTE (Summary) ECON 5* -- NOTE The Multple Classcal Lnear Regresson Model (CLRM): Specfcaton and Assumptons. Introducton CLRM stands for the Classcal Lnear Regresson Model. The CLRM s also
ECONOMICS 5* -- NOTE (Summary) ECON 5* -- NOTE The Multple Classcal Lnear Regresson Model (CLRM): Specfcaton and Assumptons. Introducton CLRM stands for the Classcal Lnear Regresson Model. The CLRM s also
Econ107 Applied Econometrics Topic 3: Classical Model (Studenmund, Chapter 4)
") I. Classcal Assumptons Econ7 Appled Econometrcs Topc 3: Classcal Model (Studenmund, Chapter 4) We have defned OLS and studed some algebrac propertes of OLS. In ths topc we wll study statstcal propertes
I. Classcal Assumptons Econ7 Appled Econometrcs Topc 3: Classcal Model (Studenmund, Chapter 4) We have defned OLS and studed some algebrac propertes of OLS. In ths topc we wll study statstcal propertes
A Hybrid Variational Iteration Method for Blasius Equation
 Avalable at http://pvamu.edu/aam Appl. Appl. Math. ISSN: 1932-9466 Vol. 10, Issue 1 (June 2015), pp. 223-229 Applcatons and Appled Mathematcs: An Internatonal Journal (AAM) A Hybrd Varatonal Iteraton Method
Tornado and Luby Transform Codes. Ashish Khisti Presentation October 22, 2003
 Tornado and Luby Transform Codes Ashsh Khst 6.454 Presentaton October 22, 2003 Background: Erasure Channel Elas[956] studed the Erasure Channel β x x β β x 2 m x 2 k? Capacty of Noseless Erasure Channel
Parameter estimation class 5
 Parameter estmaton class 5 Multple Ve Geometr Comp 9-89 Marc Pollefes Content Background: Projectve geometr (D, 3D), Parameter estmaton, Algortm evaluaton. Sngle Ve: Camera model, Calbraton, Sngle Ve Geometr.
Maximum Likelihood Estimation of Binary Dependent Variables Models: Probit and Logit. 1. General Formulation of Binary Dependent Variables Models
 ECO 452 -- OE 4: Probt and Logt Models ECO 452 -- OE 4 Maxmum Lkelhood Estmaton of Bnary Dependent Varables Models: Probt and Logt hs note demonstrates how to formulate bnary dependent varables models
Lecture Notes on Linear Regression
 Lecture Notes on Lnear Regresson Feng L fl@sdueducn Shandong Unversty, Chna Lnear Regresson Problem In regresson problem, we am at predct a contnuous target value gven an nput feature vector We assume
Primer on High-Order Moment Estimators
 Prmer on Hgh-Order Moment Estmators Ton M. Whted July 2007 The Errors-n-Varables Model We wll start wth the classcal EIV for one msmeasured regressor. The general case s n Erckson and Whted Econometrc
Negative Binomial Regression
 STATGRAPHICS Rev. 9/16/2013 Negatve Bnomal Regresson Summary... 1 Data Input... 3 Statstcal Model... 3 Analyss Summary... 4 Analyss Optons... 7 Plot of Ftted Model... 8 Observed Versus Predcted... 10 Predctons...
Dr. Shalabh Department of Mathematics and Statistics Indian Institute of Technology Kanpur
 Analyss of Varance and Desgn of Exerments-I MODULE III LECTURE - 2 EXPERIMENTAL DESIGN MODELS Dr. Shalabh Deartment of Mathematcs and Statstcs Indan Insttute of Technology Kanur 2 We consder the models
Code_Aster. Identification of the model of Weibull
 Verson Ttre : Identfcaton du modèle de Webull Date : 2/09/2009 Page : /8 Responsable : PARROT Aurore Clé : R70209 Révson : Identfcaton of the model of Webull Summary One tackles here the problem of the
Generalized Linear Methods
 Generalzed Lnear Methods 1 Introducton In the Ensemble Methods the general dea s that usng a combnaton of several weak learner one could make a better learner. More formally, assume that we have a set
Maximum Likelihood Estimation of Binary Dependent Variables Models: Probit and Logit. 1. General Formulation of Binary Dependent Variables Models
 ECO 452 -- OE 4: Probt and Logt Models ECO 452 -- OE 4 Mamum Lkelhood Estmaton of Bnary Dependent Varables Models: Probt and Logt hs note demonstrates how to formulate bnary dependent varables models for
Module 3: Element Properties Lecture 1: Natural Coordinates
 Module 3: Element Propertes Lecture : Natural Coordnates Natural coordnate system s bascally a local coordnate system whch allows the specfcaton of a pont wthn the element by a set of dmensonless numbers
Parametric fractional imputation for missing data analysis. Jae Kwang Kim Survey Working Group Seminar March 29, 2010
 Parametrc fractonal mputaton for mssng data analyss Jae Kwang Km Survey Workng Group Semnar March 29, 2010 1 Outlne Introducton Proposed method Fractonal mputaton Approxmaton Varance estmaton Multple mputaton
Correlation and Regression. Correlation 9.1. Correlation. Chapter 9
 Chapter 9 Correlaton and Regresson 9. Correlaton Correlaton A correlaton s a relatonshp between two varables. The data can be represented b the ordered pars (, ) where s the ndependent (or eplanator) varable,
Chapter 3. Two-Variable Regression Model: The Problem of Estimation
 Chapter 3. Two-Varable Regresson Model: The Problem of Estmaton Ordnary Least Squares Method (OLS) Recall that, PRF: Y = β 1 + β X + u Thus, snce PRF s not drectly observable, t s estmated by SRF; that
a. (All your answers should be in the letter!
 Econ 301 Blkent Unversty Taskn Econometrcs Department of Economcs Md Term Exam I November 8, 015 Name For each hypothess testng n the exam complete the followng steps: Indcate the test statstc, ts crtcal
Tracking with Kalman Filter
 Trackng wth Kalman Flter Scott T. Acton Vrgna Image and Vdeo Analyss (VIVA), Charles L. Brown Department of Electrcal and Computer Engneerng Department of Bomedcal Engneerng Unversty of Vrgna, Charlottesvlle,
Dr. Shalabh Department of Mathematics and Statistics Indian Institute of Technology Kanpur
 Analyss of Varance and Desgn of Experment-I MODULE VIII LECTURE - 34 ANALYSIS OF VARIANCE IN RANDOM-EFFECTS MODEL AND MIXED-EFFECTS EFFECTS MODEL Dr Shalabh Department of Mathematcs and Statstcs Indan
LINEAR REGRESSION ANALYSIS. MODULE IX Lecture Multicollinearity
 LINEAR REGRESSION ANALYSIS MODULE IX Lecture - 31 Multcollnearty Dr. Shalabh Department of Mathematcs and Statstcs Indan Insttute of Technology Kanpur 6. Rdge regresson The OLSE s the best lnear unbased
Report on Image warping
 Report on Image warpng Xuan Ne, Dec. 20, 2004 Ths document summarzed the algorthms of our mage warpng soluton for further study, and there s a detaled descrpton about the mplementaton of these algorthms.
P R. Lecture 4. Theory and Applications of Pattern Recognition. Dept. of Electrical and Computer Engineering /
 Theory and Applcatons of Pattern Recognton 003, Rob Polkar, Rowan Unversty, Glassboro, NJ Lecture 4 Bayes Classfcaton Rule Dept. of Electrcal and Computer Engneerng 0909.40.0 / 0909.504.04 Theory & Applcatons
3.1 Expectation of Functions of Several Random Variables. )' be a k-dimensional discrete or continuous random vector, with joint PMF p (, E X E X1 E X
' be a k-dimensional discrete or continuous random vector, with joint PMF p (, E X E X1 E X") Statstcs 1: Probablty Theory II 37 3 EPECTATION OF SEVERAL RANDOM VARIABLES As n Probablty Theory I, the nterest n most stuatons les not on the actual dstrbuton of a random vector, but rather on a number
Statstcs 1: Probablty Theory II 37 3 EPECTATION OF SEVERAL RANDOM VARIABLES As n Probablty Theory I, the nterest n most stuatons les not on the actual dstrbuton of a random vector, but rather on a number
An identification algorithm of model kinetic parameters of the interfacial layer growth in fiber composites
 IOP Conference Seres: Materals Scence and Engneerng PAPER OPE ACCESS An dentfcaton algorthm of model knetc parameters of the nterfacal layer growth n fber compostes o cte ths artcle: V Zubov et al 216
On the Multicriteria Integer Network Flow Problem
 BULGARIAN ACADEMY OF SCIENCES CYBERNETICS AND INFORMATION TECHNOLOGIES Volume 5, No 2 Sofa 2005 On the Multcrtera Integer Network Flow Problem Vassl Vasslev, Marana Nkolova, Maryana Vassleva Insttute of
Chat eld, C. and A.J.Collins, Introduction to multivariate analysis. Chapman & Hall, 1980
 MT07: Multvarate Statstcal Methods Mke Tso: emal mke.tso@manchester.ac.uk Webpage for notes: http://www.maths.manchester.ac.uk/~mkt/new_teachng.htm. Introducton to multvarate data. Books Chat eld, C. and
Polynomial Regression Models
 LINEAR REGRESSION ANALYSIS MODULE XII Lecture - 6 Polynomal Regresson Models Dr. Shalabh Department of Mathematcs and Statstcs Indan Insttute of Technology Kanpur Test of sgnfcance To test the sgnfcance
MATH 829: Introduction to Data Mining and Analysis The EM algorithm (part 2)
") 1/16 MATH 829: Introducton to Data Mnng and Analyss The EM algorthm (part 2) Domnque Gullot Departments of Mathematcal Scences Unversty of Delaware Aprl 20, 2016 Recall 2/16 We are gven ndependent observatons
1/16 MATH 829: Introducton to Data Mnng and Analyss The EM algorthm (part 2) Domnque Gullot Departments of Mathematcal Scences Unversty of Delaware Aprl 20, 2016 Recall 2/16 We are gven ndependent observatons
On the Throughput of Clustered Photolithography Tools:
 On the hroughput of lustered Photolthography ools: Wafer Advancement and Intrnsc Equpment Loss Maruth Kumar Mutnur James R. Morrson, Ph.D. September 23, 2007 Presentaton Outlne Motvaton Model : Synchronous
Lecture 10 Support Vector Machines II
 Lecture 10 Support Vector Machnes II 22 February 2016 Taylor B. Arnold Yale Statstcs STAT 365/665 1/28 Notes: Problem 3 s posted and due ths upcomng Frday There was an early bug n the fake-test data; fxed
A PROBABILITY-DRIVEN SEARCH ALGORITHM FOR SOLVING MULTI-OBJECTIVE OPTIMIZATION PROBLEMS
 HCMC Unversty of Pedagogy Thong Nguyen Huu et al. A PROBABILITY-DRIVEN SEARCH ALGORITHM FOR SOLVING MULTI-OBJECTIVE OPTIMIZATION PROBLEMS Thong Nguyen Huu and Hao Tran Van Department of mathematcs-nformaton,
Econ107 Applied Econometrics Topic 9: Heteroskedasticity (Studenmund, Chapter 10)
") I. Defnton and Problems Econ7 Appled Econometrcs Topc 9: Heteroskedastcty (Studenmund, Chapter ) We now relax another classcal assumpton. Ths s a problem that arses often wth cross sectons of ndvduals,
I. Defnton and Problems Econ7 Appled Econometrcs Topc 9: Heteroskedastcty (Studenmund, Chapter ) We now relax another classcal assumpton. Ths s a problem that arses often wth cross sectons of ndvduals,
x = , so that calculated
 Stat 4, secton Sngle Factor ANOVA notes by Tm Plachowsk n chapter 8 we conducted hypothess tests n whch we compared a sngle sample s mean or proporton to some hypotheszed value Chapter 9 expanded ths to
Chapter 14 Simple Linear Regression Page 1. Introduction to regression analysis 14-2
 Chapter 4 Smple Lnear Regresson Page. Introducton to regresson analyss 4- The Regresson Equaton. Lnear Functons 4-4 3. Estmaton and nterpretaton of model parameters 4-6 4. Inference on the model parameters
Hydrological statistics. Hydrological statistics and extremes
 5--0 Stochastc Hydrology Hydrologcal statstcs and extremes Marc F.P. Berkens Professor of Hydrology Faculty of Geoscences Hydrologcal statstcs Mostly concernes wth the statstcal analyss of hydrologcal
Interactive Bi-Level Multi-Objective Integer. Non-linear Programming Problem
 Appled Mathematcal Scences Vol 5 0 no 65 3 33 Interactve B-Level Mult-Objectve Integer Non-lnear Programmng Problem O E Emam Department of Informaton Systems aculty of Computer Scence and nformaton Helwan
Feature Selection: Part 1
 CSE 546: Machne Learnng Lecture 5 Feature Selecton: Part 1 Instructor: Sham Kakade 1 Regresson n the hgh dmensonal settng How do we learn when the number of features d s greater than the sample sze n?
Systematic Error Illustration of Bias. Sources of Systematic Errors. Effects of Systematic Errors 9/23/2009. Instrument Errors Method Errors Personal
 9/3/009 Sstematc Error Illustraton of Bas Sources of Sstematc Errors Instrument Errors Method Errors Personal Prejudce Preconceved noton of true value umber bas Prefer 0/5 Small over large Even over odd
2016 Wiley. Study Session 2: Ethical and Professional Standards Application
 6 Wley Study Sesson : Ethcal and Professonal Standards Applcaton LESSON : CORRECTION ANALYSIS Readng 9: Correlaton and Regresson LOS 9a: Calculate and nterpret a sample covarance and a sample correlaton
Lecture 6: Introduction to Linear Regression
 Lecture 6: Introducton to Lnear Regresson An Manchakul amancha@jhsph.edu 24 Aprl 27 Lnear regresson: man dea Lnear regresson can be used to study an outcome as a lnear functon of a predctor Example: 6
A linear imaging system with white additive Gaussian noise on the observed data is modeled as follows:
 Supplementary Note Mathematcal bacground A lnear magng system wth whte addtve Gaussan nose on the observed data s modeled as follows: X = R ϕ V + G, () where X R are the expermental, two-dmensonal proecton
EEE 241: Linear Systems
 EEE : Lnear Systems Summary #: Backpropagaton BACKPROPAGATION The perceptron rule as well as the Wdrow Hoff learnng were desgned to tran sngle layer networks. They suffer from the same dsadvantage: they
Systems of Equations (SUR, GMM, and 3SLS)
") Lecture otes on Advanced Econometrcs Takash Yamano Fall Semester 4 Lecture 4: Sstems of Equatons (SUR, MM, and 3SLS) Seemngl Unrelated Regresson (SUR) Model Consder a set of lnear equatons: $ + ɛ $ + ɛ
Lecture otes on Advanced Econometrcs Takash Yamano Fall Semester 4 Lecture 4: Sstems of Equatons (SUR, MM, and 3SLS) Seemngl Unrelated Regresson (SUR) Model Consder a set of lnear equatons: $ + ɛ $ + ɛ
LOW BIAS INTEGRATED PATH ESTIMATORS. James M. Calvin
 Proceedngs of the 007 Wnter Smulaton Conference S G Henderson, B Bller, M-H Hseh, J Shortle, J D Tew, and R R Barton, eds LOW BIAS INTEGRATED PATH ESTIMATORS James M Calvn Department of Computer Scence
Neuro-Adaptive Design - I:
 Lecture 36 Neuro-Adaptve Desgn - I: A Robustfyng ool for Dynamc Inverson Desgn Dr. Radhakant Padh Asst. Professor Dept. of Aerospace Engneerng Indan Insttute of Scence - Bangalore Motvaton Perfect system
/ n ) are compared. The logic is: if the two
 are compared. The logic is: if the two") STAT C141, Sprng 2005 Lecture 13 Two sample tests One sample tests: examples of goodness of ft tests, where we are testng whether our data supports predctons. Two sample tests: called as tests of ndependence
STAT C141, Sprng 2005 Lecture 13 Two sample tests One sample tests: examples of goodness of ft tests, where we are testng whether our data supports predctons. Two sample tests: called as tests of ndependence
is the calculated value of the dependent variable at point i. The best parameters have values that minimize the squares of the errors
 Multple Lnear and Polynomal Regresson wth Statstcal Analyss Gven a set of data of measured (or observed) values of a dependent varable: y versus n ndependent varables x 1, x, x n, multple lnear regresson
ECONOMICS 351*-A Mid-Term Exam -- Fall Term 2000 Page 1 of 13 pages. QUEEN'S UNIVERSITY AT KINGSTON Department of Economics
 ECOOMICS 35*-A Md-Term Exam -- Fall Term 000 Page of 3 pages QUEE'S UIVERSITY AT KIGSTO Department of Economcs ECOOMICS 35* - Secton A Introductory Econometrcs Fall Term 000 MID-TERM EAM ASWERS MG Abbott
Communication-efficient Distributed Solutions to a System of Linear Equations with Laplacian Sparse Structure
 Communcaton-effcent Dstrbuted Solutons to a System of Lnear Equatons wth Laplacan Sparse Structure Peng Wang, Yuanq Gao, Nanpeng Yu, We Ren, Janmng Lan, and D Wu Abstract Two communcaton-effcent dstrbuted
Indeterminate pin-jointed frames (trusses)
") Indetermnate pn-jonted frames (trusses) Calculaton of member forces usng force method I. Statcal determnacy. The degree of freedom of any truss can be derved as: w= k d a =, where k s the number of all
Indetermnate pn-jonted frames (trusses) Calculaton of member forces usng force method I. Statcal determnacy. The degree of freedom of any truss can be derved as: w= k d a =, where k s the number of all
Winter 2008 CS567 Stochastic Linear/Integer Programming Guest Lecturer: Xu, Huan
 Wnter 2008 CS567 Stochastc Lnear/Integer Programmng Guest Lecturer: Xu, Huan Class 2: More Modelng Examples 1 Capacty Expanson Capacty expanson models optmal choces of the tmng and levels of nvestments
Goodness of fit and Wilks theorem
 DRAFT 0.0 Glen Cowan 3 June, 2013 Goodness of ft and Wlks theorem Suppose we model data y wth a lkelhood L(µ) that depends on a set of N parameters µ = (µ 1,...,µ N ). Defne the statstc t µ ln L(µ) L(ˆµ),
Role of Synchronized Measurements In Operation of Smart Grids
 Role of Synchronized Measurements In Operation of Smart Grids Ali Abur Electrical and Computer Engineering Department Northeastern University Boston, Massachusetts Boston University CISE Seminar November
IRO0140 Advanced space time-frequency signal processing
 IRO4 Advanced space tme-frequency sgnal processng Lecture Toomas Ruuben Takng nto account propertes of the sgnals, we can group these as followng: Regular and random sgnals (are all sgnal parameters determned
Chapter 14 Simple Linear Regression
 Chapter 4 Smple Lnear Regresson Chapter 4 - Smple Lnear Regresson Manageral decsons often are based on the relatonshp between two or more varables. Regresson analss can be used to develop an equaton showng
Lectures - Week 4 Matrix norms, Conditioning, Vector Spaces, Linear Independence, Spanning sets and Basis, Null space and Range of a Matrix
 Lectures - Week 4 Matrx norms, Condtonng, Vector Spaces, Lnear Independence, Spannng sets and Bass, Null space and Range of a Matrx Matrx Norms Now we turn to assocatng a number to each matrx. We could
Welfare Properties of General Equilibrium. What can be said about optimality properties of resource allocation implied by general equilibrium?
 APPLIED WELFARE ECONOMICS AND POLICY ANALYSIS Welfare Propertes of General Equlbrum What can be sad about optmalty propertes of resource allocaton mpled by general equlbrum? Any crteron used to compare
Dr. Shalabh Department of Mathematics and Statistics Indian Institute of Technology Kanpur
 Analyss of Varance and Desgn of Exerments-I MODULE II LECTURE - GENERAL LINEAR HYPOTHESIS AND ANALYSIS OF VARIANCE Dr. Shalabh Deartment of Mathematcs and Statstcs Indan Insttute of Technology Kanur 3.
Resource Allocation with a Budget Constraint for Computing Independent Tasks in the Cloud
 Resource Allocaton wth a Budget Constrant for Computng Independent Tasks n the Cloud Wemng Sh and Bo Hong School of Electrcal and Computer Engneerng Georga Insttute of Technology, USA 2nd IEEE Internatonal
Introduction to Regression
 Introducton to Regresson Dr Tom Ilvento Department of Food and Resource Economcs Overvew The last part of the course wll focus on Regresson Analyss Ths s one of the more powerful statstcal technques Provdes
Markov Chain Monte Carlo Lecture 6
 where (x 1,..., x N ) X N, N s called the populaton sze, f(x) f (x) for at least one {1, 2,..., N}, and those dfferent from f(x) are called the tral dstrbutons n terms of mportance samplng. Dfferent ways
A Bayesian Approach to Stein-Optimal Covariance Matrix Estimation
 A Bayesan Approach to Sten-Optmal Covarance Matrx Estmaton Ben Gllen Calforna Insttute of Technology Unversty of Calforna Irvne Econometrcs Semnar November 5 013 Estmatng Large Covarance Matrces Central
Minimizing Algebraic Error in Geometric Estimation Problems
 Mnmzng Algebrac n Geometrc Estmaton Problems Rchard I. Hartley G.E. Corporate Research and Development PO Box 8, Schenectady, NY 39 Emal : hartley@crd.ge.com Abstract Ths paper gves a wdely applcable technque
n α j x j = 0 j=1 has a nontrivial solution. Here A is the n k matrix whose jth column is the vector for all t j=0
 MODULE 2 Topcs: Lnear ndependence, bass and dmenson We have seen that f n a set of vectors one vector s a lnear combnaton of the remanng vectors n the set then the span of the set s unchanged f that vector
Foresighted Demand Side Management
 Foresghted Demand Sde Management 1 Yuanzhang Xao and Mhaela van der Schaar, Fellow, IEEE Department of Electrcal Engneerng, UCLA. {yxao,mhaela}@ee.ucla.edu. Abstract arxv:1401.2185v1 [cs.ma] 9 Jan 2014
ρ some λ THE INVERSE POWER METHOD (or INVERSE ITERATION) , for , or (more usually) to
 , for , or (more usually) to") THE INVERSE POWER METHOD (or INVERSE ITERATION) -- applcaton of the Power method to A some fxed constant ρ (whch s called a shft), x λ ρ If the egenpars of A are { ( λ, x ) } ( ), or (more usually) to,
THE INVERSE POWER METHOD (or INVERSE ITERATION) -- applcaton of the Power method to A some fxed constant ρ (whch s called a shft), x λ ρ If the egenpars of A are { ( λ, x ) } ( ), or (more usually) to,
Some Comments on Accelerating Convergence of Iterative Sequences Using Direct Inversion of the Iterative Subspace (DIIS)
") Some Comments on Acceleratng Convergence of Iteratve Sequences Usng Drect Inverson of the Iteratve Subspace (DIIS) C. Davd Sherrll School of Chemstry and Bochemstry Georga Insttute of Technology May 1998
Some Comments on Acceleratng Convergence of Iteratve Sequences Usng Drect Inverson of the Iteratve Subspace (DIIS) C. Davd Sherrll School of Chemstry and Bochemstry Georga Insttute of Technology May 1998
Comparison of Regression Lines
 STATGRAPHICS Rev. 9/13/2013 Comparson of Regresson Lnes Summary... 1 Data Input... 3 Analyss Summary... 4 Plot of Ftted Model... 6 Condtonal Sums of Squares... 6 Analyss Optons... 7 Forecasts... 8 Confdence
UNIVERSITY OF TORONTO Faculty of Arts and Science. December 2005 Examinations STA437H1F/STA1005HF. Duration - 3 hours
 UNIVERSITY OF TORONTO Faculty of Arts and Scence December 005 Examnatons STA47HF/STA005HF Duraton - hours AIDS ALLOWED: (to be suppled by the student) Non-programmable calculator One handwrtten 8.5'' x
Linear Approximation with Regularization and Moving Least Squares
 Lnear Approxmaton wth Regularzaton and Movng Least Squares Igor Grešovn May 007 Revson 4.6 (Revson : March 004). 5 4 3 0.5 3 3.5 4 Contents: Lnear Fttng...4. Weghted Least Squares n Functon Approxmaton...
Professor Chris Murray. Midterm Exam
 Econ 7 Econometrcs Sprng 4 Professor Chrs Murray McElhnney D cjmurray@uh.edu Mdterm Exam Wrte your answers on one sde of the blank whte paper that I have gven you.. Do not wrte your answers on ths exam.
Neural networks. Nuno Vasconcelos ECE Department, UCSD
 Neural networs Nuno Vasconcelos ECE Department, UCSD Classfcaton a classfcaton problem has two types of varables e.g. X - vector of observatons (features) n the world Y - state (class) of the world x X