Do we really need statistics in science?
|
|
|
- Tyler Reynolds
- 5 years ago
- Views:
Transcription
1 September 16, 2009 D we really need statistics in science? FWF Graduate Seminar Timthy M. Yung, Ph.D. Assciate Prfessr Department f Frestry, Wildlife & Fisheries Frest Prducts Center
2 Dn t wrry, it will be OK.
3 Overview Definitin f Statistics Variance ( 2 ) Randm variable (sample space) Prbability Definitin f Science 1 st Law f Statistics Key Assumptins Research Prgram


4 Statistics The Measurement f Uncertainty
5 Definitin f Statistics? Many, many definitins.mst peple in this rm wuld have different definitins Cmmn theme f mst definitins: iti.study f variance ( 2 )..quantifying variance.
 = VarX + VarY + 2Cv(X,Y) r, Var(aX + by) = a 2 VarX + b 2 VarY + 2abCv(X,Y) (X,Y independent): Var( X + Y) = VarX +")
6 Francis Galtn Variance ( 2 ) Cmpnents f a System If X and Y are tw randm variables, (X,Y dependent): Var(X + Y) = VarX + VarY + 2Cv(X,Y) r, Var(aX + by) = a 2 VarX + b 2 VarY + 2abCv(X,Y) (X,Y independent): Var( X + Y) = VarX + VarY
7 Generalizatin 2 Variance ( 2 ) Cmpnents f a System (dependent d randm variables): n n var[ X ] var[ X ] 2 cv[ X, X ] i i i j i i i j (independent randm variables): n var[ X ] var[ X ] i i n i i
8 2 Variance ( 2 ) Cmpnents f a System Reduce (r increase) variance (dependent randm variables): Var(X + Y) = VarX + VarY + 2Cv(X,Y) (X,Y independent): Var( X + Y) = VarX + VarY r Var( X + Y) = VarX + VarY What is the difficulty: quantifying 2
9 Randm Variable Randm variable (X) is allwed t vary within a sample space fr the set f real numbers e.g., weight, height, misture cntent, number f spts, distance traveled, survival rate, etc.
10 Tw dice: Randm Variable Outcmes: (2, 3, 4, 5, 6, 7, 8, 9, 10, 11, 12) Prbability f an utcme?
11 Tw dice: Randm Variable 6 Frequenc cy Outcmes
12 Tw dice: Randm Variable 6 Frequenc cy Outcmes
13 Sample Space Tw dice: 6 5 Die Die 2
14 Sample Space Tw dice: Lucky 7? 6 5 Die Die 2
15 Prbability bilit Density Functin Tw dice: (pdf) 6/36 Prbabilit ty 5/36 4/36 3/36 2/36 1/ Outcmes
16 Prbability bilit Density Functin Tw dice: 6/36 (pdf) Discrete Prbabilit ty 5/36 4/36 3/36 2/36 1/ Outcmes
17 Prbability Density Functin (Discrete pdfs) Bernulli Binmiali 1 ( ) x x f x p (1 p) n x f ( x ) p (1 p ) x n x Pissn f ( x ) e x x! Gemetric (r Pascal) Hypergemetric f( x) f ( x) p(1 p) x etc., etc. etc.. K M K x n x M n
18 Prbability bilit Density Functin (pdf) Cntinuus Nrmal r Gaussian (with = 0; = 1)
 The t statistic was invented by William Sealy Gsset The t statistic was invented by William Sealy Gsset (1876")
19 Prbability bilit Density Functin (pdf) Cntinuus (e.g., t distributin) The t statistic was invented by William Sealy Gsset The t statistic was invented by William Sealy Gsset ( ) fr cheaply mnitring the quality f beer brews. Student was his pen name.
20 Prbability Density Functin (Cntinuus pdfs) Nrmal f( x) 1 e 2 (1/2)[( x )/ ] 1 2 (1/2)[( x] Standard Nrmal f( x) e ( = 0; = 1) 2 p 1 ( ) p ( ) p (1 x / p) 2 Student s t f ( x) 1/ 2 2 ( p 1)/ 2 F distributin Weibull p q ( ) p/2 ( p/2) 1 ( ) 2 p x f x p q ( ) ( ) q [1 ( p/ q) x] 2 2 k x f( x) etc., etc. etc.. k 1 e k ( x/ ) 2 ( p q)/2


21 Why are the prbability density functins imprtant? Weibull Nrmal Nn-central t
22 Hw are yur data cllected frm sme sample space?
23 Statistical Methds Parametric Methds Analysis f variance (ANOVA) Chi-square test Crrelatin Factr Analysis Mann-Whitney U Mean Square Weighted Deviatin MSWD Pearsn prduct-mment crrelatin cefficient Regressin analysis Lgistic regressin Spearman's rank crrelatin cefficient Student's t-test Time Series Analysis etc., etc., etc. Nn-Parametric Methds Andersn-Darling test Cchran's Q Chen's kappa Efrn-Petrsian test Friedman tw-way analysis Kendall's tau Kendall's W Klmgrv-Smirnv test Kruskal-Wallis ne-way analysis Kuiper's test Wilcxn rank sum test Pitman's permutatin test Rank prducts Siegel-Tukey test Wilcxn signed-rank test. etc., etc., etc
24 Statistical Inference Statistical inference (r statistical inductin) is the use f statistics and randm sampling t make inferences cncerning sme unknwn aspect f the ppulatin.


25 Definitin f Science?
26 Definitin f Science? The wrd science cmes frm Latin "scientia," meaning knwledge. Science is an intellectual activity carried n by humans that is designed t discver infrmatin abut the natural wrld in which humans live and t discver the ways in which this infrmatin can be rganized dit int meaningful patterns It is dne thrugh bservatin f natural phenmena, and/r thrugh experimentatin that tries t simulate natural prcesses under cntrlled cnditins A primary aim f science is t cllect facts (data) An ultimate purpse f science is t discern the rder that exists between and amngst the varius facts..systematic knwledge-base r prescriptive practice that is capable f resulting in a predictin r predictable type f utcme
27 Definitin f Science? Scientific Reasning r Inference Deductive Reasning: Knwledge Thery Hypthesis Data
28 Definitin f Science? Scientific Reasning r Inference Deductive Reasning: Knwledge Thery Hypthesis Inductive Reasning: Data Data Hypthesis Thery Knwledge
29 D we really need Statistics in Science? Observatins (data) Meaningful patterns Experimentatin Discern rder between and amngst facts Hypthesis testing (r generatin) Predictin etc., etc., etc.
30 D we really need Statistics in Science? Hw will yu quantify variance ( 2 ) f bservatinal data withut the use f statistical methds? An apprximate answer t the right questin is wrth a gd deal mre than the exact answer t an apprximate prblem Jhn W. Tukey ( )
31 First Law f Applied Statistics (Gleser 1996).tw individuals using the same statistical methd n the same data shuld arrive at the same cnclusin.
32 Key Assumptins What is the questin (prblem definitin)? Sample space (bias?) Data quality Parametric (pdf) assumptin? Mst apprpriate methd t prvide the apprximate answer t a welldefined questin
33 Research Prgram (Bi-based Prducts Industries) Statistical Prcess Cntrl Decisin Thery Ensemble Prcess Mdeling Training Statistical Thinking
34 Statistical Prcess Cntrl 99.7% Special-Cause Variatin Upper Cntrl Limit ~ + 3 Standard Deviatins Meas surement Cmmn-Cause Variatin ~ 3 Standard Deviatins Average Special-Cause Variatin Lwer Cntrl Limit Time Ordered


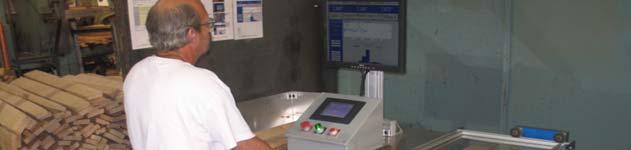
35 Statistical Prcess Cntrl Hardwd/Sftwd Sawmills Hypthesis, a priri, the use f real-time statistical prcess cntrl t mnitr and reduce lumber thickness variatin des nt imprve lumber recvery, lumber quality r financial perfrmance. 35
36 Statistical Prcess Cntrl Hardwd/Sftwd Sawmills Summary - Sawmill A Quercus rubra 36
37 Statistical Prcess Cntrl Hardwd/Sftwd Sawmills Cmpany Investment Return ROI A $15,000 $180,000 12:1 B $27,000 $752,000 28:1 C (sftwd) $13,000 $210,000 16:1 D $21,000 $147,000 7:1 Ttal: $76,000 $1,289,000 17:1 37


38 Statistical Prcess Cntrl Staves fr Burbn Barrels Hypthesis: A reductin in stave width variability and bilge variability in any f the 15 jinter wheels will reduce bth within and between barrel circumference variability 38


39 Statistical Prcess Cntrl Staves fr Burbn Barrels 39
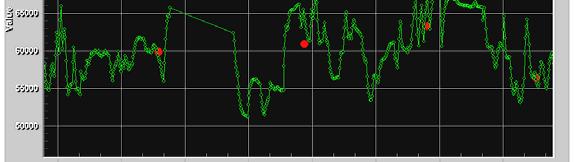
40 Statistical Prcess Cntrl Staves fr Burbn Barrels Stand dard Errr Jul '08 Aug '08 Sept '08 Oct '08 Nv '08 Dec '09 Mnth and Year Table 1 Wheel 1 Table 1 Wheel 2 Table 1 Wheel 3 Table 1 Wheel 4 Table 1 Wheel 5 Table 2 Wheel 1 Table 2 Wheel 2 Table 2 Wheel 3 Table 2 Wheel 4 Table 2 Wheel 5 Table 3 Wheel 1 Table 3 Wheel 2 Table 3 Wheel 3 Table 3 Wheel 4 Table 3 Wheel 5 40


41 Statistical Prcess Cntrl Staves fr Burbn Barrels Barrel circumference variatin was reduced Allwed fr increase in barrel target circumference size Yield per barrell (Official Prf Gallns) at Jack Daniels imprved by 0.3 OPG after SPC Additinal 938 barrels f Jack Daniels and apprximately $300,000 f cst savings ver the sixmnth study perid (estimated by Brwn Frman) 41


42 Ensemble Prcess Mdeling Questin: Can imprved methdlgies fr real-time prcess mdeling imprve the scientific understanding f undiscvered crrelatins in bi-based prducts manufacturing (facilitate t imprved causatin investigatin)?


43 Ensemble Prcess Mdeling Idea: Reduce generalized errr f predictin by cmbining predictins frm several mdels and varius types f algrithms int an ensemble MLR Regressin Trees Partial Least Squares Ridge Regressin Neural Netwrks Bxplts f MLR and RT Residuals fr Validatin Data MDF 0.750" IB Residual MLR MDF 0.750" (n=70) RT MDF 0.750" (n=70)


44 Ensemble Prcess Mdeling Several large prjects with USDA SBIR cmpetitive grants and private industry (T: $1.6M)


45 Ensemble Prcess Mdeling BiSAT Mdel: Mdeling system fr determining ptimal lcatins fr bimass using facilities in the eastern U.S. ( Quantity (dry tns)
46 Y Y Y 5 Ensemble Prcess Mdeling Regressin Trees 25 Regressin Tree: Piecewise estimate f a regressin functin Cnstructed by recursively partitining the data and sample space Y X X N X>1.5 N Yes X> Yes X X
47 Ensemble Prcess Mdeling Regressin Tree Mdels High Explanatry Value Quantile Regressin n= 100 Nde 2 (n=70) Rfi Refiner steam pressure 54.6 Refiner steam pressure > 54.6 Nde 3 (n=30) Dry fuel bin speed 27.7 Mean IB = 132 Dry fuel bin speed > 27.7 Press start cntrl Mean IB = 151 Press start cntrl > Mean IB = 143 Nde 4T (n=12) Press start cntrl Mean IB = 138 Nde 10T (n=19) Cre scavenger resin 6.0 Press start cntrl > 931 Mean IB = 144 Nde 11T (n=16) Cre scavenger resin > 6.0 Fiber temperature 89.7 Mean IB = 134 Nde 12T (n=11) Nde 6T (n=15) Fiber temperature > 89.7 Mean IB = 144 Nde 13T (n=12) Bx s (1979): All mdels are wrng but sme are useful IB Nde 7T (n=15) Observed Predicted Time Series


48 Training Statistical Thinking Cntinuus imprvement using statistical prcess cntrl fr the bibased prducts industries Advanced statistical seminars fr the bi-based prducts industries Applied design f experiments fr the bi-based prducts industries 48
49 Cnclusin Statistics is a key fundatin f science Bttm-line: Statistics helps minimize the risk f being wrng What makes a scientist great is the care that he/she takes in telling yu what is wrng with his/her results, s that yu will nt misuse them W. Edwards Deming ( )


50 Questins & Discussin html Fr Tday s Graduate, Just One Wrd: Statistics
Lecture 2: Supervised vs. unsupervised learning, bias-variance tradeoff
 Lecture 2: Supervised vs. unsupervised learning, bias-variance tradeff Reading: Chapter 2 STATS 202: Data mining and analysis September 27, 2017 1 / 20 Supervised vs. unsupervised learning In unsupervised
CAUSAL INFERENCE. Technical Track Session I. Phillippe Leite. The World Bank
 CAUSAL INFERENCE Technical Track Sessin I Phillippe Leite The Wrld Bank These slides were develped by Christel Vermeersch and mdified by Phillippe Leite fr the purpse f this wrkshp Plicy questins are causal
Distributions, spatial statistics and a Bayesian perspective
 Distributins, spatial statistics and a Bayesian perspective Dug Nychka Natinal Center fr Atmspheric Research Distributins and densities Cnditinal distributins and Bayes Thm Bivariate nrmal Spatial statistics
Lecture 2: Supervised vs. unsupervised learning, bias-variance tradeoff
 Lecture 2: Supervised vs. unsupervised learning, bias-variance tradeff Reading: Chapter 2 STATS 202: Data mining and analysis September 27, 2017 1 / 20 Supervised vs. unsupervised learning In unsupervised
Math 10 - Exam 1 Topics
 Math 10 - Exam 1 Tpics Types and Levels f data Categrical, Discrete r Cntinuus Nminal, Ordinal, Interval r Rati Descriptive Statistics Stem and Leaf Graph Dt Plt (Interpret) Gruped Data Relative and Cumulative
Part 3 Introduction to statistical classification techniques
 Part 3 Intrductin t statistical classificatin techniques Machine Learning, Part 3, March 07 Fabi Rli Preamble ØIn Part we have seen that if we knw: Psterir prbabilities P(ω i / ) Or the equivalent terms
Simple Linear Regression (single variable)
") Simple Linear Regressin (single variable) Intrductin t Machine Learning Marek Petrik January 31, 2017 Sme f the figures in this presentatin are taken frm An Intrductin t Statistical Learning, with applicatins
Simple Linear Regressin (single variable) Intrductin t Machine Learning Marek Petrik January 31, 2017 Sme f the figures in this presentatin are taken frm An Intrductin t Statistical Learning, with applicatins
Lab 1 The Scientific Method
 INTRODUCTION The fllwing labratry exercise is designed t give yu, the student, an pprtunity t explre unknwn systems, r universes, and hypthesize pssible rules which may gvern the behavir within them. Scientific
CHAPTER 24: INFERENCE IN REGRESSION. Chapter 24: Make inferences about the population from which the sample data came.
 MATH 1342 Ch. 24 April 25 and 27, 2013 Page 1 f 5 CHAPTER 24: INFERENCE IN REGRESSION Chapters 4 and 5: Relatinships between tw quantitative variables. Be able t Make a graph (scatterplt) Summarize the
Resampling Methods. Chapter 5. Chapter 5 1 / 52
 Resampling Methds Chapter 5 Chapter 5 1 / 52 1 51 Validatin set apprach 2 52 Crss validatin 3 53 Btstrap Chapter 5 2 / 52 Abut Resampling An imprtant statistical tl Pretending the data as ppulatin and
Internal vs. external validity. External validity. This section is based on Stock and Watson s Chapter 9.
 Sectin 7 Mdel Assessment This sectin is based n Stck and Watsn s Chapter 9. Internal vs. external validity Internal validity refers t whether the analysis is valid fr the ppulatin and sample being studied.
Name: Block: Date: Science 10: The Great Geyser Experiment A controlled experiment
 Science 10: The Great Geyser Experiment A cntrlled experiment Yu will prduce a GEYSER by drpping Ments int a bttle f diet pp Sme questins t think abut are: What are yu ging t test? What are yu ging t measure?
1b) =.215 1c).080/.215 =.372
 =.215 1c).080/.215 =.372") Practice Exam 1 - Answers 1. / \.1/ \.9 (D+) (D-) / \ / \.8 / \.2.15/ \.85 (T+) (T-) (T+) (T-).080.020.135.765 1b).080 +.135 =.215 1c).080/.215 =.372 2. The data shwn in the scatter plt is the distance
Practice Exam 1 - Answers 1. / \.1/ \.9 (D+) (D-) / \ / \.8 / \.2.15/ \.85 (T+) (T-) (T+) (T-).080.020.135.765 1b).080 +.135 =.215 1c).080/.215 =.372 2. The data shwn in the scatter plt is the distance
The general linear model and Statistical Parametric Mapping I: Introduction to the GLM
 The general linear mdel and Statistical Parametric Mapping I: Intrductin t the GLM Alexa Mrcm and Stefan Kiebel, Rik Hensn, Andrew Hlmes & J-B J Pline Overview Intrductin Essential cncepts Mdelling Design
Bootstrap Method > # Purpose: understand how bootstrap method works > obs=c(11.96, 5.03, 67.40, 16.07, 31.50, 7.73, 11.10, 22.38) > n=length(obs) >
 > n=length(obs) >") Btstrap Methd > # Purpse: understand hw btstrap methd wrks > bs=c(11.96, 5.03, 67.40, 16.07, 31.50, 7.73, 11.10, 22.38) > n=length(bs) > mean(bs) [1] 21.64625 > # estimate f lambda > lambda = 1/mean(bs);
Btstrap Methd > # Purpse: understand hw btstrap methd wrks > bs=c(11.96, 5.03, 67.40, 16.07, 31.50, 7.73, 11.10, 22.38) > n=length(bs) > mean(bs) [1] 21.64625 > # estimate f lambda > lambda = 1/mean(bs);
k-nearest Neighbor How to choose k Average of k points more reliable when: Large k: noise in attributes +o o noise in class labels
 Mtivating Example Memry-Based Learning Instance-Based Learning K-earest eighbr Inductive Assumptin Similar inputs map t similar utputs If nt true => learning is impssible If true => learning reduces t
PSU GISPOPSCI June 2011 Ordinary Least Squares & Spatial Linear Regression in GeoDa
 There are tw parts t this lab. The first is intended t demnstrate hw t request and interpret the spatial diagnstics f a standard OLS regressin mdel using GeDa. The diagnstics prvide infrmatin abut the
Statistics, Numerical Models and Ensembles
 Statistics, Numerical Mdels and Ensembles Duglas Nychka, Reinhard Furrer,, Dan Cley Claudia Tebaldi, Linda Mearns, Jerry Meehl and Richard Smith (UNC). Spatial predictin and data assimilatin Precipitatin
Modelling of Clock Behaviour. Don Percival. Applied Physics Laboratory University of Washington Seattle, Washington, USA
 Mdelling f Clck Behaviur Dn Percival Applied Physics Labratry University f Washingtn Seattle, Washingtn, USA verheads and paper fr talk available at http://faculty.washingtn.edu/dbp/talks.html 1 Overview
Checking the resolved resonance region in EXFOR database
 Checking the reslved resnance regin in EXFOR database Gttfried Bertn Sciété de Calcul Mathématique (SCM) Oscar Cabells OECD/NEA Data Bank JEFF Meetings - Sessin JEFF Experiments Nvember 0-4, 017 Bulgne-Billancurt,
Hypothesis Tests for One Population Mean
 Hypthesis Tests fr One Ppulatin Mean Chapter 9 Ala Abdelbaki Objective Objective: T estimate the value f ne ppulatin mean Inferential statistics using statistics in rder t estimate parameters We will be
Math Foundations 20 Work Plan
 Math Fundatins 20 Wrk Plan Units / Tpics 20.8 Demnstrate understanding f systems f linear inequalities in tw variables. Time Frame December 1-3 weeks 6-10 Majr Learning Indicatrs Identify situatins relevant
MATCHING TECHNIQUES. Technical Track Session VI. Emanuela Galasso. The World Bank
 MATCHING TECHNIQUES Technical Track Sessin VI Emanuela Galass The Wrld Bank These slides were develped by Christel Vermeersch and mdified by Emanuela Galass fr the purpse f this wrkshp When can we use
Lesson Plan. Recode: They will do a graphic organizer to sequence the steps of scientific method.
 Lessn Plan Reach: Ask the students if they ever ppped a bag f micrwave ppcrn and nticed hw many kernels were unppped at the bttm f the bag which made yu wnder if ther brands pp better than the ne yu are
, which yields. where z1. and z2
 The Gaussian r Nrmal PDF, Page 1 The Gaussian r Nrmal Prbability Density Functin Authr: Jhn M Cimbala, Penn State University Latest revisin: 11 September 13 The Gaussian r Nrmal Prbability Density Functin
7 TH GRADE MATH STANDARDS
 ALGEBRA STANDARDS Gal 1: Students will use the language f algebra t explre, describe, represent, and analyze number expressins and relatins 7 TH GRADE MATH STANDARDS 7.M.1.1: (Cmprehensin) Select, use,
A New Evaluation Measure. J. Joiner and L. Werner. The problems of evaluation and the needed criteria of evaluation
 III-l III. A New Evaluatin Measure J. Jiner and L. Werner Abstract The prblems f evaluatin and the needed criteria f evaluatin measures in the SMART system f infrmatin retrieval are reviewed and discussed.
Large Sample Hypothesis Tests for a Population Proportion
 Ntes-10.3a Large Sample Hypthesis Tests fr a Ppulatin Prprtin ***Cin Tss*** 1. A friend f yurs claims that when he tsses a cin he can cntrl the utcme. Yu are skeptical and want him t prve it. He tsses
Churn Prediction using Dynamic RFM-Augmented node2vec
 Churn Predictin using Dynamic RFM-Augmented nde2vec Sandra Mitrvić, Jchen de Weerdt, Bart Baesens & Wilfried Lemahieu Department f Decisin Sciences and Infrmatin Management, KU Leuven 18 September 2017,
NUMBERS, MATHEMATICS AND EQUATIONS
 AUSTRALIAN CURRICULUM PHYSICS GETTING STARTED WITH PHYSICS NUMBERS, MATHEMATICS AND EQUATIONS An integral part t the understanding f ur physical wrld is the use f mathematical mdels which can be used t
A Quick Overview of the. Framework for K 12 Science Education
 A Quick Overview f the NGSS EQuIP MODULE 1 Framewrk fr K 12 Science Educatin Mdule 1: A Quick Overview f the Framewrk fr K 12 Science Educatin This mdule prvides a brief backgrund n the Framewrk fr K-12
o o IMPORTANT REMINDERS Reports will be graded largely on their ability to clearly communicate results and important conclusions.
 BASD High Schl Frmal Lab Reprt GENERAL INFORMATION 12 pt Times New Rman fnt Duble-spaced, if required by yur teacher 1 inch margins n all sides (tp, bttm, left, and right) Always write in third persn (avid
Resampling Methods. Cross-validation, Bootstrapping. Marek Petrik 2/21/2017
 Resampling Methds Crss-validatin, Btstrapping Marek Petrik 2/21/2017 Sme f the figures in this presentatin are taken frm An Intrductin t Statistical Learning, with applicatins in R (Springer, 2013) with
Comparing Several Means: ANOVA. Group Means and Grand Mean
 STAT 511 ANOVA and Regressin 1 Cmparing Several Means: ANOVA Slide 1 Blue Lake snap beans were grwn in 12 pen-tp chambers which are subject t 4 treatments 3 each with O 3 and SO 2 present/absent. The ttal
WRITING THE REPORT. Organizing the report. Title Page. Table of Contents
 WRITING THE REPORT Organizing the reprt Mst reprts shuld be rganized in the fllwing manner. Smetime there is a valid reasn t include extra chapters in within the bdy f the reprt. 1. Title page 2. Executive
AP Statistics Practice Test Unit Three Exploring Relationships Between Variables. Name Period Date
 AP Statistics Practice Test Unit Three Explring Relatinships Between Variables Name Perid Date True r False: 1. Crrelatin and regressin require explanatry and respnse variables. 1. 2. Every least squares
Eric Klein and Ning Sa
 Week 12. Statistical Appraches t Netwrks: p1 and p* Wasserman and Faust Chapter 15: Statistical Analysis f Single Relatinal Netwrks There are fur tasks in psitinal analysis: 1) Define Equivalence 2) Measure
Introduction to Regression
 Intrductin t Regressin Administrivia Hmewrk 6 psted later tnight. Due Friday after Break. 2 Statistical Mdeling Thus far we ve talked abut Descriptive Statistics: This is the way my sample is Inferential
Five Whys How To Do It Better
 Five Whys Definitin. As explained in the previus article, we define rt cause as simply the uncvering f hw the current prblem came int being. Fr a simple causal chain, it is the entire chain. Fr a cmplex
Standard Title: Frequency Response and Frequency Bias Setting. Andrew Dressel Holly Hawkins Maureen Long Scott Miller
 Template fr Quality Review f NERC Reliability Standard BAL-003-1 Frequency Respnse and Frequency Bias Setting Basic Infrmatin: Prject number: 2007-12 Standard number: BAL-003-1 Prject title: Frequency
Admin. MDP Search Trees. Optimal Quantities. Reinforcement Learning
 Admin Reinfrcement Learning Cntent adapted frm Berkeley CS188 MDP Search Trees Each MDP state prjects an expectimax-like search tree Optimal Quantities The value (utility) f a state s: V*(s) = expected
INSTRUMENTAL VARIABLES
 INSTRUMENTAL VARIABLES Technical Track Sessin IV Sergi Urzua University f Maryland Instrumental Variables and IE Tw main uses f IV in impact evaluatin: 1. Crrect fr difference between assignment f treatment
Sequential Allocation with Minimal Switching
 In Cmputing Science and Statistics 28 (1996), pp. 567 572 Sequential Allcatin with Minimal Switching Quentin F. Stut 1 Janis Hardwick 1 EECS Dept., University f Michigan Statistics Dept., Purdue University
Unit 1: Introduction to Biology
 Name: Unit 1: Intrductin t Bilgy Theme: Frm mlecules t rganisms Students will be able t: 1.1 Plan and cnduct an investigatin: Define the questin, develp a hypthesis, design an experiment and cllect infrmatin,
Maximum A Posteriori (MAP) CS 109 Lecture 22 May 16th, 2016
 CS 109 Lecture 22 May 16th, 2016") Maximum A Psteriri (MAP) CS 109 Lecture 22 May 16th, 2016 Previusly in CS109 Game f Estimatrs Maximum Likelihd Nn spiler: this didn t happen Side Plt argmax argmax f lg Mther f ptimizatins? Reviving an
Maximum A Psteriri (MAP) CS 109 Lecture 22 May 16th, 2016 Previusly in CS109 Game f Estimatrs Maximum Likelihd Nn spiler: this didn t happen Side Plt argmax argmax f lg Mther f ptimizatins? Reviving an
4th Indian Institute of Astrophysics - PennState Astrostatistics School July, 2013 Vainu Bappu Observatory, Kavalur. Correlation and Regression
 4th Indian Institute f Astrphysics - PennState Astrstatistics Schl July, 2013 Vainu Bappu Observatry, Kavalur Crrelatin and Regressin Rahul Ry Indian Statistical Institute, Delhi. Crrelatin Cnsider a tw
Exam #1. A. Answer any 1 of the following 2 questions. CEE 371 October 8, Please grade the following questions: 1 or 2
 CEE 371 Octber 8, 2009 Exam #1 Clsed Bk, ne sheet f ntes allwed Please answer ne questin frm the first tw, ne frm the secnd tw and ne frm the last three. The ttal ptential number f pints is 100. Shw all
The standards are taught in the following sequence.
 B L U E V A L L E Y D I S T R I C T C U R R I C U L U M MATHEMATICS Third Grade In grade 3, instructinal time shuld fcus n fur critical areas: (1) develping understanding f multiplicatin and divisin and
COMP 551 Applied Machine Learning Lecture 4: Linear classification
 COMP 551 Applied Machine Learning Lecture 4: Linear classificatin Instructr: Jelle Pineau (jpineau@cs.mcgill.ca) Class web page: www.cs.mcgill.ca/~jpineau/cmp551 Unless therwise nted, all material psted
IB Sports, Exercise and Health Science Summer Assignment. Mrs. Christina Doyle Seneca Valley High School
 IB Sprts, Exercise and Health Science Summer Assignment Mrs. Christina Dyle Seneca Valley High Schl Welcme t IB Sprts, Exercise and Health Science! This curse incrprates the traditinal disciplines f anatmy
Fall 2013 Physics 172 Recitation 3 Momentum and Springs
 Fall 03 Physics 7 Recitatin 3 Mmentum and Springs Purpse: The purpse f this recitatin is t give yu experience wrking with mmentum and the mmentum update frmula. Readings: Chapter.3-.5 Learning Objectives:.3.
Early detection of mining truck failure by modelling its operation with neural networks classification algorithms
 RU, Rand GOLOSINSKI, T.S. Early detectin f mining truck failure by mdelling its peratin with neural netwrks classificatin algrithms. Applicatin f Cmputers and Operatins Research ill the Minerals Industries,
Professional Development. Implementing the NGSS: High School Physics
 Prfessinal Develpment Implementing the NGSS: High Schl Physics This is a dem. The 30-min vide webinar is available in the full PD. Get it here. Tday s Learning Objectives NGSS key cncepts why this is different
Public Key Cryptography. Tim van der Horst & Kent Seamons
 Public Key Cryptgraphy Tim van der Hrst & Kent Seamns Last Updated: Oct 5, 2017 Asymmetric Encryptin Why Public Key Crypt is Cl Has a linear slutin t the key distributin prblem Symmetric crypt has an expnential
MATCHING TECHNIQUES Technical Track Session VI Céline Ferré The World Bank
 MATCHING TECHNIQUES Technical Track Sessin VI Céline Ferré The Wrld Bank When can we use matching? What if the assignment t the treatment is nt dne randmly r based n an eligibility index, but n the basis
How do scientists measure trees? What is DBH?
 Hw d scientists measure trees? What is DBH? Purpse Students develp an understanding f tree size and hw scientists measure trees. Students bserve and measure tree ckies and explre the relatinship between
Exam #1. A. Answer any 1 of the following 2 questions. CEE 371 March 10, Please grade the following questions: 1 or 2
 CEE 371 March 10, 2009 Exam #1 Clsed Bk, ne sheet f ntes allwed Please answer ne questin frm the first tw, ne frm the secnd tw and ne frm the last three. The ttal ptential number f pints is 100. Shw all
Weathering. Title: Chemical and Mechanical Weathering. Grade Level: Subject/Content: Earth and Space Science
 Weathering Title: Chemical and Mechanical Weathering Grade Level: 9-12 Subject/Cntent: Earth and Space Science Summary f Lessn: Students will test hw chemical and mechanical weathering can affect a rck
What is Statistical Learning?
 What is Statistical Learning? Sales 5 10 15 20 25 Sales 5 10 15 20 25 Sales 5 10 15 20 25 0 50 100 200 300 TV 0 10 20 30 40 50 Radi 0 20 40 60 80 100 Newspaper Shwn are Sales vs TV, Radi and Newspaper,
NOTE ON A CASE-STUDY IN BOX-JENKINS SEASONAL FORECASTING OF TIME SERIES BY STEFFEN L. LAURITZEN TECHNICAL REPORT NO. 16 APRIL 1974
 NTE N A CASE-STUDY IN B-JENKINS SEASNAL FRECASTING F TIME SERIES BY STEFFEN L. LAURITZEN TECHNICAL REPRT N. 16 APRIL 1974 PREPARED UNDER CNTRACT N00014-67-A-0112-0030 (NR-042-034) FR THE FFICE F NAVAL
Perfrmance f Sensitizing Rules n Shewhart Cntrl Charts with Autcrrelated Data Key Wrds: Autregressive, Mving Average, Runs Tests, Shewhart Cntrl Chart
 Perfrmance f Sensitizing Rules n Shewhart Cntrl Charts with Autcrrelated Data Sandy D. Balkin Dennis K. J. Lin y Pennsylvania State University, University Park, PA 16802 Sandy Balkin is a graduate student
8 th Grade Math: Pre-Algebra
 Hardin Cunty Middle Schl (2013-2014) 1 8 th Grade Math: Pre-Algebra Curse Descriptin The purpse f this curse is t enhance student understanding, participatin, and real-life applicatin f middle-schl mathematics
End of Course Algebra I ~ Practice Test #2
 End f Curse Algebra I ~ Practice Test #2 Name: Perid: Date: 1: Order the fllwing frm greatest t least., 3, 8.9, 8,, 9.3 A. 8, 8.9,, 9.3, 3 B., 3, 8, 8.9,, 9.3 C. 9.3, 3,,, 8.9, 8 D. 3, 9.3,,, 8.9, 8 2:
Multiple Source Multiple. using Network Coding
 Multiple Surce Multiple Destinatin Tplgy Inference using Netwrk Cding Pegah Sattari EECS, UC Irvine Jint wrk with Athina Markpulu, at UCI, Christina Fraguli, at EPFL, Lausanne Outline Netwrk Tmgraphy Gal,
Computational modeling techniques
 Cmputatinal mdeling techniques Lecture 2: Mdeling change. In Petre Department f IT, Åb Akademi http://users.ab.fi/ipetre/cmpmd/ Cntent f the lecture Basic paradigm f mdeling change Examples Linear dynamical
EASTERN ARIZONA COLLEGE Introduction to Statistics
 EASTERN ARIZONA COLLEGE Intrductin t Statistics Curse Design 2014-2015 Curse Infrmatin Divisin Scial Sciences Curse Number PSY 220 Title Intrductin t Statistics Credits 3 Develped by Adam Stinchcmbe Lecture/Lab
Least Squares Optimal Filtering with Multirate Observations
 Prc. 36th Asilmar Cnf. n Signals, Systems, and Cmputers, Pacific Grve, CA, Nvember 2002 Least Squares Optimal Filtering with Multirate Observatins Charles W. herrien and Anthny H. Hawes Department f Electrical
Statistics Statistical method Variables Value Score Type of Research Level of Measurement...
 Lecture 1 Displaying data... 12 Statistics... 13 Statistical methd... 13 Variables... 13 Value... 15 Scre... 15 Type f Research... 15 Level f Measurement... 15 Numeric/Quantitative variables... 15 Ordinal/Rank-rder
Engineering Decision Methods
 GSOE9210 vicj@cse.unsw.edu.au www.cse.unsw.edu.au/~gs9210 Maximin and minimax regret 1 2 Indifference; equal preference 3 Graphing decisin prblems 4 Dminance The Maximin principle Maximin and minimax Regret
Writing Guidelines. (Updated: November 25, 2009) Forwards
 Forwards") Writing Guidelines (Updated: Nvember 25, 2009) Frwards I have fund in my review f the manuscripts frm ur students and research assciates, as well as thse submitted t varius jurnals by thers that the majr
Writing Guidelines (Updated: Nvember 25, 2009) Frwards I have fund in my review f the manuscripts frm ur students and research assciates, as well as thse submitted t varius jurnals by thers that the majr
ENSC Discrete Time Systems. Project Outline. Semester
 ENSC 49 - iscrete Time Systems Prject Outline Semester 006-1. Objectives The gal f the prject is t design a channel fading simulatr. Upn successful cmpletin f the prject, yu will reinfrce yur understanding
Competition and Invasion in a Microcosmic Setting
 University f Tennessee, Knxville Trace: Tennessee Research and Creative Exchange University f Tennessee Hnrs Thesis Prjects University f Tennessee Hnrs Prgram 5-2004 Cmpetitin and Invasin in a Micrcsmic
x 1 Outline IAML: Logistic Regression Decision Boundaries Example Data
 Outline IAML: Lgistic Regressin Charles Suttn and Victr Lavrenk Schl f Infrmatics Semester Lgistic functin Lgistic regressin Learning lgistic regressin Optimizatin The pwer f nn-linear basis functins Least-squares
Assessment Primer: Writing Instructional Objectives
 Assessment Primer: Writing Instructinal Objectives (Based n Preparing Instructinal Objectives by Mager 1962 and Preparing Instructinal Objectives: A critical tl in the develpment f effective instructin
CS:4420 Artificial Intelligence
 CS:4420 Artificial Intelligence Spring 2017 Learning frm Examples Cesare Tinelli The University f Iwa Cpyright 2004 17, Cesare Tinelli and Stuart Russell a a These ntes were riginally develped by Stuart
Relationships Between Frequency, Capacitance, Inductance and Reactance.
 P Physics Relatinships between f,, and. Relatinships Between Frequency, apacitance, nductance and Reactance. Purpse: T experimentally verify the relatinships between f, and. The data cllected will lead
Computational modeling techniques
 Cmputatinal mdeling techniques Lecture 4: Mdel checing fr ODE mdels In Petre Department f IT, Åb Aademi http://www.users.ab.fi/ipetre/cmpmd/ Cntent Stichimetric matrix Calculating the mass cnservatin relatins
1 The limitations of Hartree Fock approximation
 Chapter: Pst-Hartree Fck Methds - I The limitatins f Hartree Fck apprximatin The n electrn single determinant Hartree Fck wave functin is the variatinal best amng all pssible n electrn single determinants
ELE Final Exam - Dec. 2018
 ELE 509 Final Exam Dec 2018 1 Cnsider tw Gaussian randm sequences X[n] and Y[n] Assume that they are independent f each ther with means and autcvariances μ ' 3 μ * 4 C ' [m] 1 2 1 3 and C * [m] 3 1 10
BASD HIGH SCHOOL FORMAL LAB REPORT
 BASD HIGH SCHOOL FORMAL LAB REPORT *WARNING: After an explanatin f what t include in each sectin, there is an example f hw the sectin might lk using a sample experiment Keep in mind, the sample lab used
Do big losses in judgmental adjustments affect experts behaviour? Fotios Petropoulos, Robert Fildes and Paul Goodwin
 D big lsses in judgmental adjustments affect experts behaviur? Ftis Petrpuls, Rbert Fildes and Paul Gdwin This material has been created and cpyrighted by Lancaster Centre fr Frecasting, Lancaster University
MATHEMATICS SYLLABUS SECONDARY 5th YEAR
 Eurpean Schls Office f the Secretary-General Pedaggical Develpment Unit Ref. : 011-01-D-8-en- Orig. : EN MATHEMATICS SYLLABUS SECONDARY 5th YEAR 6 perid/week curse APPROVED BY THE JOINT TEACHING COMMITTEE
The blessing of dimensionality for kernel methods
 fr kernel methds Building classifiers in high dimensinal space Pierre Dupnt Pierre.Dupnt@ucluvain.be Classifiers define decisin surfaces in sme feature space where the data is either initially represented
Emphases in Common Core Standards for Mathematical Content Kindergarten High School
 Emphases in Cmmn Cre Standards fr Mathematical Cntent Kindergarten High Schl Cntent Emphases by Cluster March 12, 2012 Describes cntent emphases in the standards at the cluster level fr each grade. These
Linear Classification
 Linear Classificatin CS 54: Machine Learning Slides adapted frm Lee Cper, Jydeep Ghsh, and Sham Kakade Review: Linear Regressin CS 54 [Spring 07] - H Regressin Given an input vectr x T = (x, x,, xp), we
Chapter 3: Cluster Analysis
 Chapter 3: Cluster Analysis } 3.1 Basic Cncepts f Clustering 3.1.1 Cluster Analysis 3.1. Clustering Categries } 3. Partitining Methds 3..1 The principle 3.. K-Means Methd 3..3 K-Medids Methd 3..4 CLARA
If (IV) is (increased, decreased, changed), then (DV) will (increase, decrease, change) because (reason based on prior research).
 is (increased, decreased, changed), then (DV) will (increase, decrease, change) because (reason based on prior research).") Science Fair Prject Set Up Instructins 1) Hypthesis Statement 2) Materials List 3) Prcedures 4) Safety Instructins 5) Data Table 1) Hw t write a HYPOTHESIS STATEMENT Use the fllwing frmat: If (IV) is (increased,
Science Fair Prject Set Up Instructins 1) Hypthesis Statement 2) Materials List 3) Prcedures 4) Safety Instructins 5) Data Table 1) Hw t write a HYPOTHESIS STATEMENT Use the fllwing frmat: If (IV) is (increased,
Tree Structured Classifier
 Tree Structured Classifier Reference: Classificatin and Regressin Trees by L. Breiman, J. H. Friedman, R. A. Olshen, and C. J. Stne, Chapman & Hall, 98. A Medical Eample (CART): Predict high risk patients
Fibre-reinforced plastic composites Declaration of raw material characteristics Part 5: Additional requirements for core materials
 CEN/TC 249 N494 Date: 2010-02 pren xxx-5:2010 CEN/TC 249 Secretariat: NBN Fibre-reinfrced plastic cmpsites Declaratin f raw material characteristics Part 5: Additinal requirements fr cre materials Einführendes
Comparison of hybrid ensemble-4dvar with EnKF and 4DVar for regional-scale data assimilation
 Cmparisn f hybrid ensemble-4dvar with EnKF and 4DVar fr reginal-scale data assimilatin Jn Pterjy and Fuqing Zhang Department f Meterlgy The Pennsylvania State University Wednesday 18 th December, 2013
Agenda. What is Machine Learning? Learning Type of Learning: Supervised, Unsupervised and semi supervised Classification
 Agenda Artificial Intelligence and its applicatins Lecture 6 Supervised Learning Prfessr Daniel Yeung danyeung@ieee.rg Dr. Patrick Chan patrickchan@ieee.rg Suth China University f Technlgy, China Learning
CS 477/677 Analysis of Algorithms Fall 2007 Dr. George Bebis Course Project Due Date: 11/29/2007
 CS 477/677 Analysis f Algrithms Fall 2007 Dr. Gerge Bebis Curse Prject Due Date: 11/29/2007 Part1: Cmparisn f Srting Algrithms (70% f the prject grade) The bjective f the first part f the assignment is
THERMAL-VACUUM VERSUS THERMAL- ATMOSPHERIC TESTS OF ELECTRONIC ASSEMBLIES
 PREFERRED RELIABILITY PAGE 1 OF 5 PRACTICES PRACTICE NO. PT-TE-1409 THERMAL-VACUUM VERSUS THERMAL- ATMOSPHERIC Practice: Perfrm all thermal envirnmental tests n electrnic spaceflight hardware in a flight-like
UG Course Outline EC2203: Quantitative Methods II 2017/18
 UG Curse Outline EC2203: Quantitative Methds II 2017/18 Autumn: Instructr: Pierre0-Olivier Frtin Office: Hrtn H214 Phne: +44 (0) 1784 276474 E-mail: pierre-livier.frtin@rhul.ac.uk Office hurs: Tuesdays
Group Color: Subgroup Number: How Science Works. Grade 5. Module 2. Class Question: Scientist (Your Name): Teacher s Name: SciTrek Volunteer s Name:
: Teacher s Name: SciTrek Volunteer s Name:") Grup Clr: Subgrup Number: Hw Science Wrks Grade 5 Mdule 2 Class Questin: Scientist (Yur Name): Teacher s Name: SciTrek Vlunteer s Name: VOCABULARY Science: The study f the material wrld using human reasn.
Grup Clr: Subgrup Number: Hw Science Wrks Grade 5 Mdule 2 Class Questin: Scientist (Yur Name): Teacher s Name: SciTrek Vlunteer s Name: VOCABULARY Science: The study f the material wrld using human reasn.
Heat Management Methodology for Successful UV Processing on Heat Sensitive Substrates
 Heat Management Methdlgy fr Successful UV Prcessing n Heat Sensitive Substrates Juliet Midlik Prime UV Systems Abstract: Nw in 2005, UV systems pssess heat management cntrls that fine tune the exthermic
IN a recent article, Geary [1972] discussed the merit of taking first differences
![IN a recent article, Geary [1972] discussed the merit of taking first differences](/thumbs/75/71727501.jpg "IN a recent article, Geary [1972] discussed the merit of taking first differences") The Efficiency f Taking First Differences in Regressin Analysis: A Nte J. A. TILLMAN IN a recent article, Geary [1972] discussed the merit f taking first differences t deal with the prblems that trends
The Efficiency f Taking First Differences in Regressin Analysis: A Nte J. A. TILLMAN IN a recent article, Geary [1972] discussed the merit f taking first differences t deal with the prblems that trends
COMP 551 Applied Machine Learning Lecture 11: Support Vector Machines
 COMP 551 Applied Machine Learning Lecture 11: Supprt Vectr Machines Instructr: (jpineau@cs.mcgill.ca) Class web page: www.cs.mcgill.ca/~jpineau/cmp551 Unless therwise nted, all material psted fr this curse
SIZE BIAS IN LINE TRANSECT SAMPLING: A FIELD TEST. Mark C. Otto Statistics Research Division, Bureau of the Census Washington, D.C , U.S.A.
 SIZE BIAS IN LINE TRANSECT SAMPLING: A FIELD TEST Mark C. Ott Statistics Research Divisin, Bureau f the Census Washingtn, D.C. 20233, U.S.A. and Kenneth H. Pllck Department f Statistics, Nrth Carlina State
Excessive Social Imbalances and the Performance of Welfare States in the EU. Frank Vandenbroucke, Ron Diris and Gerlinde Verbist
 Excessive Scial Imbalances and the Perfrmance f Welfare States in the EU Frank Vandenbrucke, Rn Diris and Gerlinde Verbist Child pverty in the Eurzne, SILC 2008 35.00 30.00 25.00 20.00 15.00 10.00 5.00.00