International Joint Commission
|
|
|
- Stuart Morgan
- 6 years ago
- Views:
Transcription
1
2 " ""- ' PRELIMINARY REPORT TO International Joint Commission RELATING TO OFFICIAL REFERENCE RE LEVELS OF RAINY LAKE AND OTHER UPPER WATERS. PLATES, - BY P. C. BULLARD, S. S. SCOVIL, Majar, Corps of Engineers, Engineer for the United States Comulting Engineer, Engineer for the Dominion of Canada OlTAWA F. A. ACLAND PRINTER TO THE KING'S MOST EXCELLENT MAJESTY igao -
3 INTERNATIONAL JOINT COMMISSION JOHN H. BARTLETT, Chairman, FRED T. DUBOIS, P. C. MCCUMBER, GEORGE CHARLES A. MAQRATH, Chairman, SIR WILLIAM HEARST, K.C.M.G., W. KYTE, K.C. WILLIAM H. SMITH, Secretary. LAWRENCE J.. BURPEE, Secretary.
4 TABLE OF CONTENTS PLATE Profiles: Main Water Route. Saganaga Lake to Namakan Lake. and along International Boundary 1... Rating Curve of Discharge through Outlet of Northern Light Lake... 2 Rating Curve of Discharge through Outlet of Saganaga Lake... 3 Rating Curve of Discharge through Outlet of Basswood Lake... 4 Discharge Curve-Relation between Lake Stage and Outflow-Crooked Lake... 5 Discharge curve- elation between Lake Stage and Outflow-Lac La Croix... 6 Discharge Curve of Kettle River-Combined Channels below Kettle Falls... 7 Relation between Rate of Idow. Lake Level and Change in Stage of Namakan Lake- State of Nature... 8 Namakan Lake-Actual Natural Level Namakan Lake-Actual Level and Computed Natural Level Namakan Lake-Actual Level and Computed Natural Level Namakan Lake-Actual Level and Computed Natural Level; Namakan Lake-Actual Level and Computed Natural Level Namakan Lake-Actual Level and Computed Natural Level Namakan Lake-Actual Level and Computed Natural Level Namakan Lake-Actual Level and Computed Natural Level Namakan Lake-Actual Level and Computed Natural Level Discharge Curve of Rainy Lake-Relation between Lake Stage and Outflow Relation between Rate of Inflow. Lake Level and Change in Stage of Rainy Lake-* tate of Nature Rainy Lake-Actual Level and Computed Natural Level Rainy Lake-Actual Level and Computed Natural Level Rainy Lake-Actual Level and Computed Natural Level Rainy Lake-Actual Level and Computed Natural Level Rainy Lake-Actual Level and Computed Natural Level Rainy Lake-Actual Level and Computed Natural Level Rainy Lake-Actual Level and Computed Natural Level Rainy Lake--A ctual Level and Computed Natural Level Rainy Lake-Actual Level and Computed Natural Level Rainy Lake-Actual Level and Computed Natural Level Rating Curves-Outflow from Lake of the WoodsStage of Nature Relation between Rate of Inflow. Lake Level and Change in Stage of Lake of the Woods State of Nature Lake of the Woods-Actual Level and Computed Natural Level Lake of the Woods-Actual Level and Computed Natural Level Lake of the Woods-Actual Level and Computed Natural Level Lake of the Woods-Actual Level and Computed Natural Level Lake of the Woods-Actual Level and Computed Natural Level Lake of the Woods-Actual Level and Computed Natural Level Lake of the WoodsActual Level and Computed Natural Level Lake of the Woods-Actual Level and Computed Natural Level Lake of the Woods-Actual Level and Computed Natural Level Lake of the Woods-Actual Level and Computed Natural Level
5 I I.- L 0 0) I V) PROFILES w -. CT al s -- MAIN WATER ROUTE -9 ad m -I!I2 (SAGANAGA LAKE TO NAMAKAN LAKE) - C -- AND - 2 m Em Z ALONG INTERNATIONAL BOUNDARY -
6
7 DISCHARGE IN CUBIC' FEET PER SECOND - RATING CURVE
8 DISCHARGE IN CUBIC FEET PER SECOND
9 m XI 7 rn' , <, I r /I a I- // D 1249 T V) m P r $ 1248 m r u 3 C' DISCHARGE CURVE REUTION BEWEEN LAKE STAGE AND OUTFLOW CROOKED LAKE P z P ,000 2,000 3, ,000 6,000 7,OO 0 8,000 9,000 10,000 cn DISCHARGE IN CUBIC FEET PER SECOND * 1 fl I l0,i I I- I d --
10 A I s m a r m r - 2 5; I I86 #7 E r m r'l < 1184 I- 5 C I~ /I INTERNATIONAL JOINT COMMISSION A /,I I~,I r 10 I F RAINY LAKE REFERENCE DISCHARGE CURVE RELATION BETWEEN LAKE STAGE AND OUTFLOW 7 /I v,i I' ,000 4,000 6,000 8,O 00 10, , , E, DISCHARGE IN CUBIC FEET PER SECOND F $ z
11 i3p h 508 f 4 rn w 506 m < m r F' 0 C m = s INTERNATIONAL JOINT COMMISSION X RAINY, LAKE REFERENCE m D'ISCHARGE CURVE 2 > 0 * KETTLE RIVER z498 3 F C X s z? 496 u DISCHARGE IN CUBIC FEET PER SECOND

12 MEAN 10 DAY RATE OF INFLOW-THOUSAND CUBIC FEET PER SECOND
13 508 NAMAKAN LAKE ACTUAL NATURAL LEVEL

14
15

16
17
18
19
20
21 RAINY LAKE REFERENCE NAMAKAN LAKE I I I I I I 7 > 2 z? w.-
22 s rn w r $ 496 rn I - z r '7' -0 C ul I- 492 s 5' NAL JOINT COMMISSION X V, RAINY LAKE REFERENCE - R 490 D z DISCHARGE CURVE > u - x= g C 3 I I I I I I I I I I I I I I I I I I I I I I I I I I I I I I I I I I I I I I I I I I IO,OOO 12,000 14,ooo DISCHARGE IN CUBIC FEET PER SECOND lieproduced from the Report of the Consulting Engineers on the ~ake'of the Woods Levels.

23 ;49 8 r 497 > I; $496 rn 4 $ 495 I w m 494 S Z ;e G) Q xr 0 a RELATION BETW'EEN RATE OF INFLOW LAKE LEVEL AND CHANGE IN STAGE CI 486 w 0 I , MEAN 10 DAY RATE 0F.IWFLOW-THOUSAND CUBIC FEET PER SECOND 8!a P
24
25
26 JAN. FEE. MAR. APRIL MAY JUNE JULY AUG. SEPT. OCT. NOV. DEC. RAINY LAKE ACTUAL LEVEL AND COMPUTED NATURAL LEVEL
27
28
29
30
31
32
33

34 1062 r ' D x 1060 rn r- rn < m r I V, in > r m r : 4 C 1054 ' z P \ ' w 0 DISCHARGE-CUBIC FEET PER SECOND Reproduced from the Report of the Consulting Engineats on the Lake of the Woods Levels.

35 MEAN 10 DAY RATE OF INFLOW-THOUSAND CUBIC FEET PER SECOND Reproduced from the Report of the Consulting Engineers on the M e of the Woods Levele.
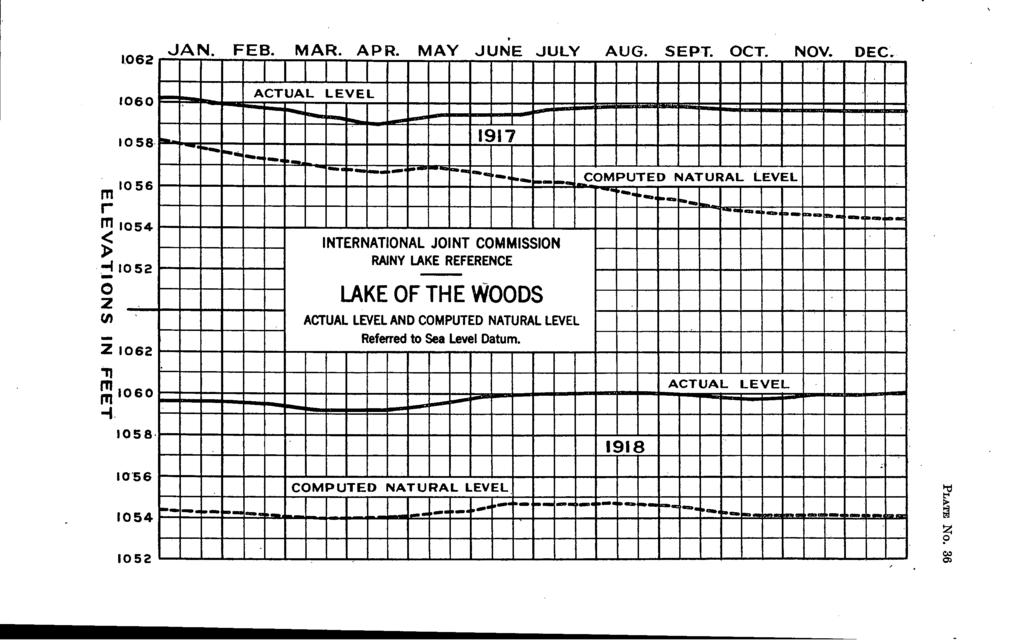
36

37
38

39
40

41

42
43
44

45
In the Matter of Emergency Regulation of the Level of
 INTERNATIONAL JOINT COMMISSION In the Matter of Emergency Regulation of the Level of Rainy Lake and of other Boundary Waters in the Rainy Lake Watershed. Supplementary Order to the Order Prescribing Method
INTERNATIONAL JOINT COMMISSION
 INTERNATIONAL JOINT COMMISSION In the Matter of Emergency Regulation of the Level of Rainy Lake and of other Boundary Waters in the Rainy Lake Watershed. CONSOLIDATION of the Order Prescribing Method of
GAMINGRE 8/1/ of 7
 FYE 09/30/92 JULY 92 0.00 254,550.00 0.00 0 0 0 0 0 0 0 0 0 254,550.00 0.00 0.00 0.00 0.00 254,550.00 AUG 10,616,710.31 5,299.95 845,656.83 84,565.68 61,084.86 23,480.82 339,734.73 135,893.89 67,946.95
Proposal to limit Namakan Lake to 1970 Upper Rule Curve for remainder of summer
 July 7, 214 Subject: Proposal to limit Namakan Lake to 197 Upper Rule Curve for remainder of summer Background: Flooding in 214 has resulted in the highest water levels on Namakan Lake since 1968, and
INTERNATIONAL JOINT COMMISSION. of Rainy Lake and of other Boundary Waters in the. Rainy Lake Watershed. CONSOLIDATION. of the
 Order for Rainy and Namakan Lake Page 1 of 11 INTERNATIONAL JOINT COMMISSION In the Matter of Emergency Regulation of the Level of Rainy Lake and of other Boundary Waters in the Rainy Lake Watershed. CONSOLIDATION
Flooding Performance Indicator Summary. Performance indicator: Flooding impacts on riparian property for Lake Ontario and the Upper St.
 Flooding Performance Indicator Summary Performance indicator: Flooding impacts on riparian property for Lake Ontario and the Upper St. Lawrence River Technical Workgroup: Coastal TWG Research by: Baird
LEVELS OF RAINY LAKE OTHER UPPER WATERS TEXT PRELIMINARY REPORT OFFICIAL REFERENCE. P. C. BULLAKD, S. S. SCOVIL, llfajor, Corps of Engineers,
 PRELIMINARY REPORT TO - International Joint Commission RELATING TO OFFICIAL REFERENCE RE LEVELS OF RAINY LAKE AND OTHER UPPER WATERS TEXT BY P. C. BULLAKD, S. S. SCOVIL, llfajor, Corps of Engineers, Cons'ulling
Activity Sheet Counting M&Ms
 Counting M&Ms Pour a half-pound bag of M&Ms onto a paper plate so that the candies are one layer thick. You will need to spread the M&Ms to the edges of the plate. Remove all the M&Ms that have the M showing
FORECAST-BASED OPERATIONS AT FOLSOM DAM AND LAKE
 FORECAST-BASED OPERATIONS AT FOLSOM DAM AND LAKE 255 237 237 237 217 217 217 200 200 200 0 163 131 Bridging the Gap163Conference 255 0 132 255 0 163 122 The Dana on Mission Bay San Diego, CA January 28,
PRELIMINARY DRAFT FOR DISCUSSION PURPOSES
 Memorandum To: David Thompson From: John Haapala CC: Dan McDonald Bob Montgomery Date: February 24, 2003 File #: 1003551 Re: Lake Wenatchee Historic Water Levels, Operation Model, and Flood Operation This
Folsom Dam Water Control Manual Update Joint Federal Project, Folsom Dam
 Folsom Dam Water Control Manual Update Joint Federal Project, Folsom Dam Public Workshop May 28, 2015 Library Galleria 828 I Street, Sacramento, CA US Army Corps of Engineers BUILDING STRONG WELCOME &
INTERNATIONAL RAINY LAKE BOARD OF CONTROL INTERNATIONAL RAINY RIVER WATER POLLUTION BOARD SPRING 2006 REPORT
 INTERNATIONAL RAINY LAKE BOARD OF CONTROL INTERNATIONAL RAINY RIVER WATER POLLUTION BOARD SPRING 26 REPORT Submitted to The International Joint Commission March 2, 26 TABLE OF CONTENTS 1 INTRODUCTION...
Attachment B to Technical Memorandum No.2. Operations Plan of Ross Valley Detention Basins
 Attachment B to Technical Memorandum No.2 Operations Plan of Ross Valley Detention Basins Operations Plan of Ross Valley Detention Basins Stetson Engineers Inc. January 26, 2011 1.0 Introduction Achieving
NRC Workshop Probabilistic Flood Hazard Assessment (PFHA) Jan 29-31, Mel Schaefer Ph.D. P.E. MGS Engineering Consultants, Inc.
 Jan 29-31, Mel Schaefer Ph.D. P.E. MGS Engineering Consultants, Inc.") Stochastic Event Flood Model (SEFM) Stochastic Modeling of Extreme Floods A Hydrological Tool for Analysis of Extreme Floods Mel Schaefer Ph.D. P.E. MGS Engineering Consultants, Inc. Olympia, WA NRC Workshop
Stochastic Event Flood Model (SEFM) Stochastic Modeling of Extreme Floods A Hydrological Tool for Analysis of Extreme Floods Mel Schaefer Ph.D. P.E. MGS Engineering Consultants, Inc. Olympia, WA NRC Workshop
A Report on a Statistical Model to Forecast Seasonal Inflows to Cowichan Lake
 A Report on a Statistical Model to Forecast Seasonal Inflows to Cowichan Lake Prepared by: Allan Chapman, MSc, PGeo Hydrologist, Chapman Geoscience Ltd., and Former Head, BC River Forecast Centre Victoria
Integrating Weather Forecasts into Folsom Reservoir Operations
 Integrating Weather Forecasts into Folsom Reservoir Operations California Extreme Precipitation Symposium September 6, 2016 Brad Moore, PE US Army Corps of Engineers Biography Brad Moore is a Lead Civil
2015 Fall Conditions Report
 2015 Fall Conditions Report Prepared by: Hydrologic Forecast Centre Date: December 21 st, 2015 Table of Contents Table of Figures... ii EXECUTIVE SUMMARY... 1 BACKGROUND... 2 SUMMER AND FALL PRECIPITATION...
Departures AYEYARWADY CHINDWIN MyaNMar
 departures AYEYARWADY CHINDWIN Myanmar 2018-2019 2018 5 Days/ 4 Nights 4 Days / 3 Nights 3 Days / 2 Nights 16 Aug 2018 Golden Land Voyage - - 18 Aug 2018 30 Aug 2018 Golden Land Voyage - 2 Sept 2018 1
Hydrogeology and Simulated Effects of Future Water Use and Drought in the North Fork Red River Alluvial Aquifer: Progress Report
 Hydrogeology and Simulated Effects of Future Water Use and Drought in the North Fork Red River Alluvial Aquifer: Progress Report Developed in partnership with the Oklahoma Water Resources Board S. Jerrod
Great Lakes Update. Great Lakes Winter and Spring Summary January June Vol. 187 Great Lakes Update August 2012
 Great Lakes Update Great Lakes Winter and Spring Summary January June 2012 The US Army Corps of Engineers (USACE) Detroit District monitors hydraulic and hydrologic conditions of the Great Lakes. This
Lake Winnebago Regulation Meeting
 Lake Winnebago Regulation Meeting USACE Detroit District October 9, 2014 US Army Corps of Engineers Agenda Basin Overview Major Stakeholders Maintenance a and Repair Work Weather Conditions 2013-20142014
Albeni Falls Operations Meeting 2015
 Albeni Falls Operations Meeting 2015 Katherine Rowden NWS Joel Fenolio Corps of Engineers Agenda Introductions Drought-Weather Conditions Free flow operations Review of Clarified Operations Albeni Falls
Module 5. Lecture 3: Channel routing methods
 Lecture 3: Channel routing methods Hydrologic flow routing 2. Channel Routing In very long channels the entire flood wave also travels a considerable distance resulting in a time redistribution and time
UNDERSTANDING GREAT LAKES WATER LEVEL FLUCTUATIONS AND CURRENT CONDITIONS APRIL 2013
 UNDERSTANDING GREAT LAKES WATER LEVEL FLUCTUATIONS AND CURRENT CONDITIONS IL 213 John Allis Chief, Great Lakes Hydraulics and Hydrology Office (313) 226-2137 John.T.Allis@usace.army.mil Keith Kompoltowicz
Where Was Mars At Your Birth?
 Where Was Mars At Your Birth? This chart will make it easy for you to determine your Mars sign. We ve listed each of the dates that Mars enters a new sign. If you were born after June 11, 1950, when Mars
2011 Flood: Technical Review of Lake Manitoba, Lake St. Martin and Assiniboine River Water Levels Summary
 2011 Flood: Technical Review of Lake Manitoba, Lake St. Martin and Assiniboine River Water Levels Summary October 2013 Introduction Manitoba experienced unprecedented flooding in 2011. While flooding was
Jackson County 2013 Weather Data
 Jackson County 2013 Weather Data 61 Years of Weather Data Recorded at the UF/IFAS Marianna North Florida Research and Education Center Doug Mayo Jackson County Extension Director 1952-2008 Rainfall Data
Water Supply Conditions and Outlook June 4, 2018
 Water Supply Conditions and Outlook June 4, 2018 Flow Forecasting & Operations Planning Water Security Agency Overview Water supply conditions across Saskatchewan are generally good with most reservoir
3.0 TECHNICAL FEASIBILITY
 3.0 TECHNICAL FEASIBILITY 3.1 INTRODUCTION To enable seasonal storage and release of water from Lake Wenatchee, an impoundment structure would need to be constructed on the lake outlet channel. The structure
ENGINE SERIAL NUMBERS
 ENGINE SERIAL NUMBERS The engine number was also the serial number of the car. Engines were numbered when they were completed, and for the most part went into a chassis within a day or so. However, some
Non-Glacial Watersheds of Uttarakhand
 Impact of Climate Change in the Non- Glacial Fed Himalayan River System: A Case Study From the Kosi River in District Almora, Uttarakhand State (India) J.S.Rawat Director Centre of Excellence for Natural
MARMOT CREEK BASIN: MANAGING FORESTS FOR WATER
 MARMOT CREEK BASIN: MANAGING FORESTS FOR WATER CABIN AND TWIN CREEK EXPERIMENTS 1962-1987 MARMOT CREEK SUBBASINS Subbasin Drainage Treatment Area (ha) (completion date) Cabin Creek 212 (50%)* Commercial
Sections 01, 02, & 04 (Bressoud and Ehren) 9 October, 2015
 9 October, 2015") Math 135, Applied Calculus First Midterm Exam Sections 01, 02, & 04 (Bressoud and Ehren) 9 October, 2015 This exam is worth 100 points. Show your work. Partial credit will be given for partially correct
Math 135, Applied Calculus First Midterm Exam Sections 01, 02, & 04 (Bressoud and Ehren) 9 October, 2015 This exam is worth 100 points. Show your work. Partial credit will be given for partially correct
Bushkill Creek 3 rd Street Dam Removal Analysis
 Bushkill Creek 3 rd Street Dam Removal Analysis HEC HMS Runoff and Routing Model Stephen Beavan, Melanie DeFazio, David Gold, Peter Mara and Dan Moran CE 421: Hydrology Fall 2010 December 15, 2010 Contents
Number System Chapter Questions
 Number System Chapter Questions. What is an integer?. Explain what absolute value represents.. Create an owing money example for comparing two negative numbers.. What is the Cartesian (Coordinate) plane?
Advanced /Surface Hydrology Dr. Jagadish Torlapati Fall 2017 MODULE 2 - ROUTING METHODS
 Routing MODULE - ROUTING METHODS Routing is the process of find the distribution of flow rate and depth in space and time along a river or storm sewer. Routing is also called Flow routing or flood routing.
(rev ) Important Dates Calendar FALL
 Important Dates Calendar FALL") (rev. 8-9-6) Important Dates Calendar 205-2 06 FALL 206-207 st 0 Weeks 2nd 0 Weeks Middle 8 Weeks Returning Students New Students Open Registration Begins New and Returning Students May 24 May 24 May 24
(rev. 8-9-6) Important Dates Calendar 205-2 06 FALL 206-207 st 0 Weeks 2nd 0 Weeks Middle 8 Weeks Returning Students New Students Open Registration Begins New and Returning Students May 24 May 24 May 24
INTERNATIONAL RAINY LAKE BOARD OF CONTROL (IRLBC) INTERNATIONAL RAINY RIVER WATER POLLUTION BOARD (IRRWPB) NEWSLETTER.
 INTERNATIONAL RAINY RIVER WATER POLLUTION BOARD (IRRWPB) NEWSLETTER.") INTERNATIONAL RAINY LAKE BOARD OF CONTROL (IRLBC) INTERNATIONAL RAINY RIVER WATER POLLUTION BOARD (IRRWPB) NEWSLETTER 2nd Quarter 212 This newsletter provides a summary of the activities of the International
INTERNATIONAL RAINY LAKE BOARD OF CONTROL (IRLBC) INTERNATIONAL RAINY RIVER WATER POLLUTION BOARD (IRRWPB) NEWSLETTER 2nd Quarter 212 This newsletter provides a summary of the activities of the International
The Climate of Oregon Climate Zone 4 Northern Cascades
 /05 E55 Unbound issue No. 9/ is Does not circulate Special Report 916 May 1993 The Climate of Oregon Climate Zone 4 Property of OREGON STATE UNIVERSITY Library Serials Corvallis, OR 97331-4503 Agricultural
Stream Discharge and the Water Budget
 Regents Earth Science Unit 6: Water Cycle & Climate Name: Lab # Stream Discharge and the Water Budget Introduction: The United States Geological Survey (USGS) measures and publishes values for the daily
Ontonagon River Assessment FIGURES
 FIGURES 95 Major Streams and Lakes 1 Pelton Creek 36 Imp Creek 2 Slate River 37 Imp Lake 3 Marshall Creek 38 Marion Lake 4 Trout Brook 39 Tamarack Lake 5 Lake Gogebic 40 Tamarack River 6 West Branch Ontonagon
National Integrated Drought Information System. Southeast US Pilot for Apalachicola- Flint-Chattahoochee River Basin 20-March-2012
 National Integrated Drought Information System Southeast US Pilot for Apalachicola- Flint-Chattahoochee River Basin 20-March-2012 Current drought status from Drought Monitor http://www.drought.unl.edu/dm/monitor.html
REDWOOD VALLEY SUBAREA
 Independent Science Review Panel Conceptual Model of Watershed Hydrology, Surface Water and Groundwater Interactions and Stream Ecology for the Russian River Watershed Appendices A-1 APPENDIX A A-2 REDWOOD
Folsom Dam Water Control Manual Update Joint Federal Project, Folsom Dam
 Folsom Dam Water Control Manual Update Joint Federal Project, Folsom Dam Public Workshop May 25, 2016 Sacramento Library Galleria 828 I Street, Sacramento, CA US Army Corps of Engineers BUILDING STRONG
Groundwater dynamics and surface water-groundwater interaction in a prograding delta island, Louisiana, USA
 Supplementary Information Groundwater dynamics and surface water-groundwater interaction in a prograding delta island, Louisiana, USA Michael T. O Connor 1* and Kevan B. Moffett 1,2 1 Department of Geological
City of Canton Treasurer s Report Month Ending July 31, 2018
 Treasurer s Report Month Ending July 31, 2018 Prepared by: Treasurer, Crystal Wilkinson Preliminary Report Summary of Monthly Inflows/Outflows - Supplemental Recap July-18 Fund Number 001 010 **020 **030
 Water Supply Forecast - THE DALLES http://www.nwrfc.noaa.gov/water_supply/ws_forecasts.php?id=tdao3 Page 1 of 1 3/7/2013 Close Archive Data/Normals Rankings Adjustments Verification Verify All Years Help
AN ASSESSMENT OF THE RELATIONSHIP BETWEEN RAINFALL AND LAKE VICTORIA LEVELS IN UGANDA
 AN ASSESSMENT OF THE RELATIONSHIP BETWEEN RAINFALL AND LAKE VICTORIA LEVELS IN UGANDA BY CATHERINE MULINDE BA (Environmental Management), PGD (Meteorology) Teaching Assistant Department of Geography, Meteorology
Unconventional Wisdom and the Effects of Dams on Downstream Coarse Sediment Supply. Byron Amerson, Jay Stallman, John Wooster, and Derek Booth
 Unconventional Wisdom and the Effects of Dams on Downstream Coarse Sediment Supply 3 February 2009 Byron Amerson, Jay Stallman, John Wooster, and Derek Booth Sultan River, WA OBJECTIVE Consider the landscape
Inflow Forecasting for Hydro Catchments. Ross Woods and Alistair McKerchar NIWA Christchurch
 Inflow Forecasting for Hydro Catchments Ross Woods and Alistair McKerchar NIWA Christchurch Inflows Water flowing into hydro storages Usually measured by monitoring the levels and outflows from hydro storages
Appendix C. Apalachicola-Chattahoochee-Flint (ACF) Basin Detailed Analysis
 Basin Detailed Analysis") Appendix C Apalachicola-Chattahoochee-Flint (ACF) Basin Detailed Analysis Appendix C - Apalachicola-Chattahoochee-Flint Basin Detailed Analysis 1 ACF BASIN 1.1 DESCRIPTION OF BASIN Streams of the Apalachicola-Chattahoochee-Flint
Appendix C Apalachicola-Chattahoochee-Flint (ACF) Basin Detailed Analysis Appendix C - Apalachicola-Chattahoochee-Flint Basin Detailed Analysis 1 ACF BASIN 1.1 DESCRIPTION OF BASIN Streams of the Apalachicola-Chattahoochee-Flint
Maximum 3-Day Reservoir Unimpaired Inflow Volumes For Selected Flood Events... (1,000 Acre-Feet)
") Maximum 3-Day Reservoir Unimpaired Inflow Volumes For Selected Flood Events... (1,000 Acre-Feet) 1 Maximum $Day Unregulated Inflow Volumes For Selected Flood Events (1,000 Acre-Feet)...... 1 Maximum SDay
Maximum 3-Day Reservoir Unimpaired Inflow Volumes For Selected Flood Events... (1,000 Acre-Feet) 1 Maximum $Day Unregulated Inflow Volumes For Selected Flood Events (1,000 Acre-Feet)...... 1 Maximum SDay
York Public Schools Math, Advanced Algebra. OBJECTIVES (What it looks like in the classroom) The learner will
 The learner will") York Public Schools Math, Advanced STRAND 1.1 NUMERATION /NUMBER SENSE 1.1.1 By the end of will describe and compare the relationships between subsets of real numbers. 1.1. By the end of will express the
York Public Schools Math, Advanced STRAND 1.1 NUMERATION /NUMBER SENSE 1.1.1 By the end of will describe and compare the relationships between subsets of real numbers. 1.1. By the end of will express the
2001 ANNUAL REPORT on INTERBASIN TRANSFERS for RTP South and the Towns of Cary, Apex, and Morrisville
 2001 ANNUAL REPORT on INTERBASIN TRANSFERS for RTP South and the Towns of Cary, Apex, and Morrisville Prepared for: Town of Cary Town of Apex Town of Morrisville RTP South/Wake County Submitted to: North
INMATE ESCAPES FLORIDA DEPARTMENT OF CORRECTIONS. July 2016 June 2017
 FLORIDA DEPARTMENT OF CORRECTIONS INMATE ESCAPES Julie L. Jones Secretary July 2016 June 2017 For Fiscal Year 2016-2017 Attempted Escapes Escapes Recaptures Short-term trends in inmate escapes Prepared
Changing Hydrology under a Changing Climate for a Coastal Plain Watershed
 Changing Hydrology under a Changing Climate for a Coastal Plain Watershed David Bosch USDA-ARS, Tifton, GA Jeff Arnold ARS Temple, TX and Peter Allen Baylor University, TX SEWRU Objectives 1. Project changes
A distributed runoff model for flood prediction in ungauged basins
 Predictions in Ungauged Basins: PUB Kick-off (Proceedings of the PUB Kick-off meeting held in Brasilia, 2 22 November 22). IAHS Publ. 39, 27. 267 A distributed runoff model for flood prediction in ungauged
CHAPTER 1 EXPRESSIONS, EQUATIONS, FUNCTIONS (ORDER OF OPERATIONS AND PROPERTIES OF NUMBERS)
") Aug 29 CHAPTER 1 EXPRESSIONS, EQUATIONS, FUNCTIONS (ORDER OF OPERATIONS AND PROPERTIES OF NUMBERS) Sept 5 No School Labor Day Holiday CHAPTER 1 EXPRESSIONS, EQUATIONS, FUNCTIONS (RELATIONS AND FUNCTIONS)
Aug 29 CHAPTER 1 EXPRESSIONS, EQUATIONS, FUNCTIONS (ORDER OF OPERATIONS AND PROPERTIES OF NUMBERS) Sept 5 No School Labor Day Holiday CHAPTER 1 EXPRESSIONS, EQUATIONS, FUNCTIONS (RELATIONS AND FUNCTIONS)
Mr. XYZ. Stock Market Trading and Investment Astrology Report. Report Duration: 12 months. Type: Both Stocks and Option. Date: Apr 12, 2011
 Mr. XYZ Stock Market Trading and Investment Astrology Report Report Duration: 12 months Type: Both Stocks and Option Date: Apr 12, 2011 KT Astrologer Website: http://www.softwareandfinance.com/magazine/astrology/kt_astrologer.php
Modeling of peak inflow dates for a snowmelt dominated basin Evan Heisman. CVEN 6833: Advanced Data Analysis Fall 2012 Prof. Balaji Rajagopalan
 Modeling of peak inflow dates for a snowmelt dominated basin Evan Heisman CVEN 6833: Advanced Data Analysis Fall 2012 Prof. Balaji Rajagopalan The Dworshak reservoir, a project operated by the Army Corps
Elevation (ft) 50th to 75th Percentile 25th to 50th Percentile Median Observed /1 11/1 12/1 1/1 2/1 3/1 4/1 5/1 6/1 7/1 8/1 9/1 Date
 50th to 75th Percentile 25th to 50th Percentile Median Observed /1 11/1 12/1 1/1 2/1 3/1 4/1 5/1 6/1 7/1 8/1 9/1 Date") Elevation (ft) 2470 2460 2450 2440 2430 2420 2410 2400 2390 2380 2370 2360 2350 2340 2330 2320 2310 2300 2290 2280 2270 2260 2250 2240 2230 2220 Bars Indicate 5th and 95th percentiles Lake Koocanusa Elevation
Elevation (ft) 2470 2460 2450 2440 2430 2420 2410 2400 2390 2380 2370 2360 2350 2340 2330 2320 2310 2300 2290 2280 2270 2260 2250 2240 2230 2220 Bars Indicate 5th and 95th percentiles Lake Koocanusa Elevation
The Climate of Oregon Climate Zone 5 High Plateau
 105 E55 Unbound issue i". 9 13oes not circulate CZe Special Report 917 May 1993 The Climate of Oregon Climate Zone 5 Property of OREGON STATE UNIVERSITY Library Serials Corvallis, OR 97331-4503 Agricultural
Jackson County 2018 Weather Data 67 Years of Weather Data Recorded at the UF/IFAS Marianna North Florida Research and Education Center
 Jackson County 2018 Weather Data 67 Years of Weather Data Recorded at the UF/IFAS Marianna North Florida Research and Education Center Doug Mayo Jackson County Extension Director 1952-2008 Rainfall Data
San Francisco Public Utilities Commission Hydrological Conditions Report For March 2016
 San Francisco Public Utilities Commission Hydrological Conditions Report For March 2016 J. Chester, C. Graham, A. Mazurkiewicz, & M. Tsang, April 7, 2016 Snow Surveyor Chris Graham crossing Huckleberry
a) Name the features marked P,Q, and R b) Differentiate between a normal faulty and a reverse fault. 2. Use the diagram below to answer question (a)
 Name the features marked P,Q, and R b) Differentiate between a normal faulty and a reverse fault. 2. Use the diagram below to answer question (a)") GEOGRAPHY PAPER 312 / 1 K.C.S.E 2002 SECTION A Answer all the questions in this section 1. The diagram below represents features produced by faulting. Use it to answer questions that follow. a) Name the
GEOGRAPHY PAPER 312 / 1 K.C.S.E 2002 SECTION A Answer all the questions in this section 1. The diagram below represents features produced by faulting. Use it to answer questions that follow. a) Name the
Jackson County 2014 Weather Data
 Jackson County 2014 Weather Data 62 Years of Weather Data Recorded at the UF/IFAS Marianna North Florida Research and Education Center Doug Mayo Jackson County Extension Director 1952-2008 Rainfall Data
Algae and Dissolved Oxygen Dynamics of Landa Lake and the Upper Spring Run
 Algae and Dissolved Oxygen Dynamics of Landa Lake and the Upper Spring Run Why study algae and dissolved oxygen dynamics of Landa Lake and the Upper Spring Run? During low-flow conditions, extensive algal
Long-term Precipitation Trends in Colorado. Nolan Doesken Colorado State Climatologist Presented: Friday, December 12, 2008
 Long-term Precipitation Trends in Colorado Nolan Doesken Colorado State Climatologist Presented: Friday, December 12, 28 Colorado Mean Annual Precipitation (1971-2) Of All Our Climate Observing Stations
San Francisco Public Utilities Commission Hydrological Conditions Report For April 2014
 San Francisco Public Utilities Commission Hydrological Conditions Report For April 2014 J. Chester, C. Graham, A. Mazurkiewicz, & M. Tsang, May 13, 2014 Snow in the High Country The view from Bond Pass
APR-SEP. Forecast Are in KAF % Average 10 % 30 Year. Forecast Period
 Water Supply Forecast - THE DALLES file://v:\nwrfc_forecast\2013\tdao3\04-05.html Page 1 of 1 4/8/2013 Header for Water Supply Information Page Close Archive Data/Normals Rankings Adjustments Verification
CLIMOGRAPH UNIT: s^io
 Narrre: Block: Date: CLIMOGRAPH UNIT: s^io The climate can be defined as the average amount of rainfall, and the average temperature in a region. The climate of a region affects the type of soil that is
ProposedLiquefiedNatural Gas(LNG) Projects innorthernb.c.
 Projects innorthernb.c.") ProposedLiquefiedNatural () Projects innorthernb.c. Liquefied Natural () Facilities PRINCE RUPERT Name Status Partners Location Capacity Small: 130,000 m 3 Large: 260,000 m 3 Name Status Proponent Details
ProposedLiquefiedNatural () Projects innorthernb.c. Liquefied Natural () Facilities PRINCE RUPERT Name Status Partners Location Capacity Small: 130,000 m 3 Large: 260,000 m 3 Name Status Proponent Details
Appendix E Plots from the Evaluation of the CNRFC Operational Hydrologic Model
 Appendix E Plots from the Evaluation of the CNRFC Operational Hydrologic Model APE-1 2 Trinity Lake Inflow 2 1 Simulated 1 1 1 2 2 Observed Figure APE-1. Simulated daily flow versus observed (FNF) flow
DAILY QUESTIONS 28 TH JUNE 18 REASONING - CALENDAR
 DAILY QUESTIONS 28 TH JUNE 18 REASONING - CALENDAR LEAP AND NON-LEAP YEAR *A non-leap year has 365 days whereas a leap year has 366 days. (as February has 29 days). *Every year which is divisible by 4
Lower Susquehanna River Reservoir System Proposed Modeling Enhancements
 Lower Susquehanna River Reservoir System Proposed Modeling Enhancements Presented at the Chesapeake Bay Program Scientific and Technical Advisory Committee (STAC) Workshop January 13, 2016 Overview Due
Hydrological Analysis of the Historical May 2017 Flooding Event in Montreal and Surrounding Areas
 McGill University Department of Bioresource Engineering Integrated Water Resources Management (IWRM) Program BREE 631: IWRM INTERNSHIP PROJECT Hydrological Analysis of the Historical May 2017 Flooding
Operator and Modeler Collaboration on Truckee- Carson River Operations Using Ensembles River Ware User Group Meeting Thursday February 1, 2018
 Operator and Modeler Collaboration on Truckee- Carson River Operations Using Ensembles River Ware User Group Meeting Thursday February 1, 2018 Caleb Erkman, P.E. PWRE David Wathen Deputy TROA Administrator
Impacts of climate change on flooding in the river Meuse
 Impacts of climate change on flooding in the river Meuse Martijn Booij University of Twente,, The Netherlands m.j.booij booij@utwente.nlnl 2003 in the Meuse basin Model appropriateness Appropriate model
9. PROBABLE MAXIMUM PRECIPITATION AND PROBABLE MAXIMUM FLOOD
 9. PROBABLE MAXIMUM PRECIPITATION AND PROBABLE MAXIMUM FLOOD 9.1. Introduction Due to the size of Watana Dam and the economic importance of the Project to the Railbelt, the Probable Maximum Flood (PMF)
TABLE -I RAINFALL RECORDED AT PORT BLAIR (MM) FROM 1949 TO 2009
 FROM 1949 TO 2009") A. RAINFALL TABLE -I RAINFALL RECORDED AT PORT BLAIR (MM) FROM 1949 TO 2009 MONTH/YEAR 1949 1950 1951 1952 1953 1954 1955 1956 1957 1958 JANUARY 0.0 0.8 82.5 0.0 26.9 37.3 71.4 46.2 10.2 28.7 FEBRUARY
A. RAINFALL TABLE -I RAINFALL RECORDED AT PORT BLAIR (MM) FROM 1949 TO 2009 MONTH/YEAR 1949 1950 1951 1952 1953 1954 1955 1956 1957 1958 JANUARY 0.0 0.8 82.5 0.0 26.9 37.3 71.4 46.2 10.2 28.7 FEBRUARY
Appendix B - Alabama-Coosa-Tallapoosa (ACT) Basin
 Basin") Appendix B - Alabama-Coosa-Tallapoosa (ACT) Basin 1 ACT BASIN 1.1 DESCRIPTION OF BASIN The headwater streams of the Alabama-Coosa-Tallapoosa (ACT) System rise in the Blue Ridge Mountains of Georgia and
Appendix B - Alabama-Coosa-Tallapoosa (ACT) Basin 1 ACT BASIN 1.1 DESCRIPTION OF BASIN The headwater streams of the Alabama-Coosa-Tallapoosa (ACT) System rise in the Blue Ridge Mountains of Georgia and
Disentangling Impacts of Climate & Land Use Changes on the Quantity & Quality of River Flows in Southern Ontario
 Disentangling Impacts of Climate & Land Use Changes on the Quantity & Quality of River Flows in Southern Ontario by Trevor Dickinson & Ramesh Rudra, Water Resources Engineering University of Guelph Acknowledgements
Lower Tuolumne River Accretion (La Grange to Modesto) Estimated daily flows ( ) for the Operations Model Don Pedro Project Relicensing
 Estimated daily flows ( ) for the Operations Model Don Pedro Project Relicensing") Lower Tuolumne River Accretion (La Grange to Modesto) Estimated daily flows (1970-2010) for the Operations Model Don Pedro Project Relicensing 1.0 Objective Using available data, develop a daily time series
Lower Tuolumne River Accretion (La Grange to Modesto) Estimated daily flows (1970-2010) for the Operations Model Don Pedro Project Relicensing 1.0 Objective Using available data, develop a daily time series
The 2 nd Annual Gobeshona Conference Future Changes of Flash Flood in the North East Region of Bangladesh using HEC-HMS Modeling
 The 2 nd Annual Gobeshona Conference 2016 Future Changes of Flash Flood in the North East Region of Bangladesh using HEC-HMS ing By- Shammi Haque 1*, Mutasim Billah 1, Afiya Narzis 2, A.K.M. Saiful Islam
Illinois State Water Survey Division
 Illinois State Water Survey Division SURFACE WATER SECTION SWS Miscellaneous Publication 108 SEDIMENT YIELD AND ACCUMULATION IN THE LOWER CACHE RIVER by Misganaw Demissie Champaign, Illinois June 1989
CHAPTER 4 CRITICAL GROWTH SEASONS AND THE CRITICAL INFLOW PERIOD. The numbers of trawl and by bag seine samples collected by year over the study
 CHAPTER 4 CRITICAL GROWTH SEASONS AND THE CRITICAL INFLOW PERIOD The numbers of trawl and by bag seine samples collected by year over the study period are shown in table 4. Over the 18-year study period,
Monday Tuesday Wednesday Thursday Friday
 Monday Tuesday Wednesday Thursday Friday Aug-7 Aug-8 Aug-9 Aug-10 Aug-11 Based off the World Cultures and Geography Textbook Teacher Inservice Teacher Inservice Teacher Inservice Teacher Inservice Aug
THE 2006 SUMMER WATER TEMPERATURE AND FLOW MANAGEMENT PROJECT
 THE 2006 SUMMER WATER TEMPERATURE AND FLOW MANAGEMENT PROJECT NECHAKO FISHERIES CONSERVATION PROGRAM Technical Report No. RM06-1 Prepared by: Triton Environmental Consultants Ltd. Draft: December 2006
Analysis of Options for Emergency Reduction of Lake Manitoba and Lake St. Martin Levels Report from KGS Group and AECOM July 2011
 Analysis of Options for Emergency Reduction of Manitoba and St. Martin Levels Report from KGS Group and AECOM July 2011 OPTIONS FOR EMERGENCY REDUCTION OF LAKE MANITOBA AND LAKE ST. MARTIN LEVELS REPORT
Sluggish Economy Puts Pinch on Manufacturing Technology Orders
 Updated Release: June 13, 2016 Contact: Penny Brown, AMT, 703-827-5275 pbrown@amtonline.org Sluggish Economy Puts Pinch on Manufacturing Technology Orders Manufacturing technology orders for were down
The Colorado Drought of 2002 in Perspective
 The Colorado Drought of 2002 in Perspective Colorado Climate Center Nolan Doesken and Roger Pielke, Sr. Prepared by Tara Green and Odie Bliss http://climate.atmos.colostate.edu Known Characteristics of
Revising Water-Surface Elevation Data for Gages in Rainy Lake, Namakan Reservoir, and Selected Rivers in Minnesota, United. States and Ontario, Canada
 Revising Water-Surface Elevation Data for Gages in Rainy Lake, Namakan Reservoir, and Selected Rivers in Minnesota, United States and Ontario, Canada By Jeffrey R. Ziegeweid, R. Jason Silliker, and Brenda
Technical Note: Hydrology of the Lake Chilwa wetland, Malawi
 Technical Note: Hydrology of the Lake Chilwa wetland, Malawi Matthew McCartney June 27 Description Lake Chilwa is located in the Southern region of Malawi on the country s eastern boarder with Mozambique
FLOOD REPORT FOR MANITOBA. June 28, A Gale wind warning is in effect for Lake Manitoba and Lake Winnipeg
 FLOOD REPORT FOR MANITOBA June 28, 2014 A Gale wind warning is in effect for Lake Manitoba and Lake Winnipeg Flood Warning*: Flood Watch*: High Water Advisory*: - Assiniboine River, from Shellmouth Dam
The Huong River the nature, climate, hydro-meteorological issues and the AWCI demonstration project
 The Huong River the nature, climate, hydro-meteorological issues and the AWCI demonstration project 7th GEOSS AP Symposium, the AWCI parallel session May 27, 214, Tokyo National Centre for Hydro-Meteorological
The World Bank. Key Dates. Project Development Objectives. Components. Implementation Status & Results Report. Key Project Dates
 Public Disclosure Copy AFRICA Africa Environment & Natural Resources Global Practice IBRD/IDA Adaptable Program Loan FY 2009 Seq No: 11 ARCHIVED on 18-Dec-2015 ISR21679 Implementing Agencies: Ministry
Grade 6 Standard 2 Unit Test Astronomy
 Grade 6 Standard 2 Unit Test Astronomy Multiple Choice 1. Why does the air temperature rise in the summer? A. We are closer to the sun. B. The air becomes thicker and more dense. C. The sun s rays are
A Review of the 2007 Water Year in Colorado
 A Review of the 2007 Water Year in Colorado Nolan Doesken Colorado Climate Center, CSU Mike Gillespie Snow Survey Division, USDA, NRCS Presented at the 28 th Annual AGU Hydrology Days, March 26, 2008,
EXPLORING FOR COPPER AND GOLD IN CHILE
 EXPLORING FOR COPPER AND GOLD IN CHILE November 2013 Competent Person Statement The information contained in this report that relates to Exploration Results and Exploration Targets is based on information
Average 175, , , , , , ,046 YTD Total 1,098,649 1,509,593 1,868,795 1,418, ,169 1,977,225 2,065,321
 AGRICULTURE 01-Agriculture JUL 2,944-4,465 1,783-146 102 AUG 2,753 6,497 5,321 1,233 1,678 744 1,469 SEP - 4,274 4,183 1,596 - - 238 OCT 2,694 - - 1,032 340-276 NOV 1,979-5,822 637 3,221 1,923 1,532 DEC