Biostatistics. Chapter 11 Simple Linear Correlation and Regression. Jing Li
|
|
|
- Francine Franklin
- 5 years ago
- Views:
Transcription

1 Bostatstcs Chapter 11 Smple Lnear Correlaton and Regresson Jng L jng.l@sjtu.edu.cn Dept of Bonformatcs & Bostatstcs, SJTU

2 Recall eat chocolate


3 Cell 175, , October 4, 2018
 and Han Chnese estmatons n the 1000 genomes project")
4 Cell 175, , October 4, 2018 Comparson of frequency of the nonreference allele between the NIPT estmatons (CMDB) and Han Chnese estmatons n the 1000 genomes project (CHN)
5 Covarance ( ) 1 ) )( ( ), ( cov 1 = å = n Y y X x y x n Covarance s 2 =Var(x) =E(xµ) 2 Varance ( = = å ) ) a measure of how much two random varables change together
6 Interpretng Covarance cov(x,y) > 0 cov(x,y) < 0 cov(x,y) = 0 X and Y are postvely correlated X and Y are nversely correlated X and Y are ndependent
: r = cov arance(x, y) var x var y Karl Pearson")
7 Correlaton coeffcent Pearson s Correlaton Coeffcent s standardzed covarance (untless): r = cov arance(x, y) var x var y Karl Pearson
8 Correlaton Measures the relatve strength of the lnear relatonshp between two varables Ranges between 1 and 1 The closer to 1, the stronger the negatve lnear relatonshp The closer to 1, the stronger the postve lnear relatonshp The closer to 0, the weaker any postve lnear relatonshp
9 Scatter Plots of Data wth Varous Correlaton Coeffcents Y Y Y Y X X r = 1 r =.6 r = 0 Y Y X r = +1 X r = +.3 X r = 0 X nslde from: Statstcs for Managers Usng Mcrosoft Excel 4th Edton, 2004 PrentceHall
10 Lnear Correlaton Lnear relatonshps Curvlnear relatonshps Y Y X X Y Y X X nslde from: Statstcs for Managers Usng Mcrosoft Excel 4th Edton, 2004 PrentceHall
11 Lnear Correlaton Strong relatonshps Weak relatonshps Y Y X X Y Y X X
12 Lnear Correlaton No relatonshp Y X Y nslde from: Statstcs for Managers Usng Mcrosoft Excel 4th Edton, 2004 PrentceHall X
13 Calculatng by hand 1 ) ( 1 ) ( 1 ) )( ( var var ), ( cov ˆ = = å å å = = = n y y n x x n y y x x y x y x arance r n n n
14 Smpler calculaton formula y x xy n n n n n n SS SS SS y y x x y y x x n y y n x x n y y x x r = = = å å å å å å = = = = = = ) ( ) ( ) )( ( 1 ) ( 1 ) ( 1 ) )( ( ˆ y x xy SS SS SS r = ˆ Numerator of covarance Numerators of varance
15 Correlaton Analyss 1 < r < 1 If the correlaton coeffcent s close to +1 that means you have a strong postve relatonshp. If the correlaton coeffcent s close to 1 that means you have a strong negatve relatonshp. If the correlaton coeffcent s close to 0 that means you have no correlaton. WE HAVE THE ABILITY TO TEST THE HYPOTHESIS H 0 : r = 0
16 Dstrbuton of the correlaton coeffcent SE( ˆr) = 1 r2 n 2 The sample correlaton coeffcent follows a T dstrbuton wth n2 degrees of freedom (snce you have to estmate the standard error). t = r / 1 r 2 n 2
17 Hstory Galton's Sweet Pea Data In Natural Inhertance, Galton (1894) provded a table, whch contaned a lst of frequences of daughter seeds of varous szes organzed n rows accordng to the sze of ther parent seeds In 1896, Pearson publshed hs frst rgorous treatment of correlaton and regresson A smpler proof than Pearson's for the productmoment method proposed by Ghsell (1981)

18 Lnear Regresson Can we predct Novel Laureates per 10 mllon populaton usng chocolate consumpton? Chocolate ~ Nobel laureates Smple Lnear Regresson
19 Lnear Regresson Regresson analyss s used to predct the value of one varable (the dependent varable, ) on the bass of other varables (the ndependent varables, ). Dependent varable: denoted Y Independent varables: denoted X 1, X 2,, X k If we only have ONE ndependent varable, the model s whch s referred to as smple lnear regresson. We would be nterested n estmatng β 0 and β 1 from the data we collect.
20 Lnear Regresson Varables: X = Independent Varable (we provde ths) Y = Dependent Varable (we observe ths) Parameters: β 0 = YIntercept β 1 = Slope ε ~ Normal Random Varable (μ ε = 0, σ ε =???) [Nose]
21 The Intercept, β0
22 The Slope, β1
23 The Slope, β1
24 Buldng the Model Collect Data Test 2 Grade = β 0 +β1*(test 1 Grade) From Data: Estmate β 0 Estmate β 1 Estmate σ ε Student Test 1 Test
25 Test 2 Test B2 Test B2 Lnear Regresson Analyss Plot of Ftted Model Plot of Ftted Model Test Plot of Ftted Model Test B Test B1
26 Whch lne has the best ft to the data????
27 Estmatng the Coeffcents In much the same way we base estmates of on, we estmate wth b 0 and wth b 1, the yntercept and slope (respectvely) of the least squares or regresson lne gven by: (Ths s an applcaton of the least squares method and t produces a straght lne that mnmzes the sum of the squared dfferences between the ponts and the lne)
28 Least Squares Lne these dfferences are called resduals or errors Ths lne mnmzes the sum of the squared dfferences between the ponts and the lne but where dd the lne equaton come from? How dd we get.934 for a yntercept and for slope??
29 Least Squares Lne [sure glad we have computers now!] The coeffcents b 1 and b 0 for the least squares lne are calculated as: SSE = (Y Y ˆ 2 ) = (Y b0 b 1 X) 2
30 Statstcs Least Squares Lne See f you can estmate Yntercept and slope from ths data Recall Data Informaton Data Ponts: x y y = x
31 Least Squares Lne See f you can estmate Yntercept and slope from ths data X Y X Xbar Y Ybar (XXbar)*(YYbar) (X Xbar) Sum = Xbar = Ybar = s xy = /(61) s 2 x = /(61) b 1 = /3.5 b 0 = *3.50
32 Example: Arm Crcumference and Heght
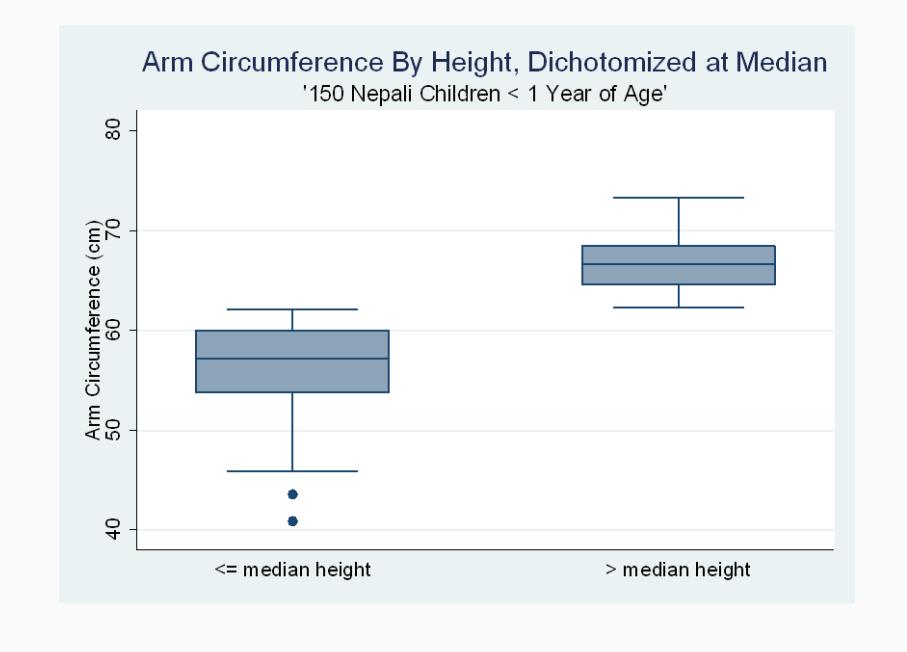
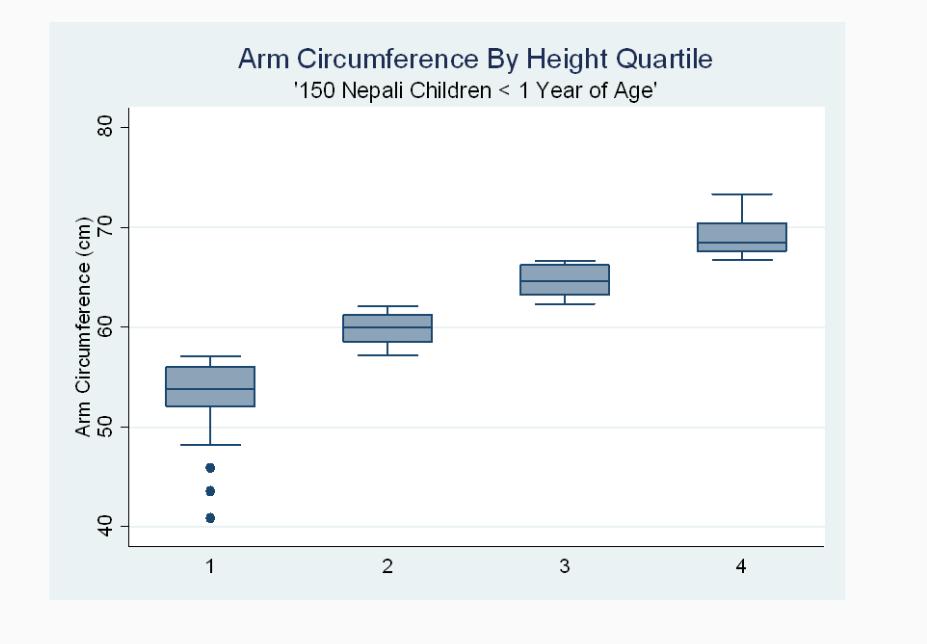
33 Arm Crcumference and Heght Ttest ANOVA

34 Vsualzng Arm Crcumference and Heght Relatonshp

35 Scatterplot wth regresson lne

36 Example: Arm Crcumference and Heght Estmated mean arm crcumference for chldren 60 cm n heght

37 Example: Arm Crcumference and Heght Estmated mean arm crcumference for chldren 60 cm n heght Notce, most ponts don t fall drectly on the lne: we are estmatng the mean arm crcumference of chldren 60 cm tall: observed ponts vary about the estmated mean
38 Lnear regresson assumes that The relatonshp between X and Y s lnear Y s dstrbuted normally at each value of X The varance of Y at every value of X s the same (homogenety of varances) The observatons are ndependent
Statistics for Economics & Business
 Statstcs for Economcs & Busness Smple Lnear Regresson Learnng Objectves In ths chapter, you learn: How to use regresson analyss to predct the value of a dependent varable based on an ndependent varable
Statistics MINITAB - Lab 2
 Statstcs 20080 MINITAB - Lab 2 1. Smple Lnear Regresson In smple lnear regresson we attempt to model a lnear relatonshp between two varables wth a straght lne and make statstcal nferences concernng that
Linear regression. Regression Models. Chapter 11 Student Lecture Notes Regression Analysis is the
 Chapter 11 Student Lecture Notes 11-1 Lnear regresson Wenl lu Dept. Health statstcs School of publc health Tanjn medcal unversty 1 Regresson Models 1. Answer What Is the Relatonshp Between the Varables?.
Statistics for Managers Using Microsoft Excel/SPSS Chapter 13 The Simple Linear Regression Model and Correlation
 Statstcs for Managers Usng Mcrosoft Excel/SPSS Chapter 13 The Smple Lnear Regresson Model and Correlaton 1999 Prentce-Hall, Inc. Chap. 13-1 Chapter Topcs Types of Regresson Models Determnng the Smple Lnear
STATISTICS QUESTIONS. Step by Step Solutions.
 STATISTICS QUESTIONS Step by Step Solutons www.mathcracker.com 9//016 Problem 1: A researcher s nterested n the effects of famly sze on delnquency for a group of offenders and examnes famles wth one to
Basic Business Statistics, 10/e
 Chapter 13 13-1 Basc Busness Statstcs 11 th Edton Chapter 13 Smple Lnear Regresson Basc Busness Statstcs, 11e 009 Prentce-Hall, Inc. Chap 13-1 Learnng Objectves In ths chapter, you learn: How to use regresson
Statistics for Business and Economics
 Statstcs for Busness and Economcs Chapter 11 Smple Regresson Copyrght 010 Pearson Educaton, Inc. Publshng as Prentce Hall Ch. 11-1 11.1 Overvew of Lnear Models n An equaton can be ft to show the best lnear
Chapter 9: Statistical Inference and the Relationship between Two Variables
 Chapter 9: Statstcal Inference and the Relatonshp between Two Varables Key Words The Regresson Model The Sample Regresson Equaton The Pearson Correlaton Coeffcent Learnng Outcomes After studyng ths chapter,
Department of Quantitative Methods & Information Systems. Time Series and Their Components QMIS 320. Chapter 6
 Department of Quanttatve Methods & Informaton Systems Tme Seres and Ther Components QMIS 30 Chapter 6 Fall 00 Dr. Mohammad Zanal These sldes were modfed from ther orgnal source for educatonal purpose only.
2016 Wiley. Study Session 2: Ethical and Professional Standards Application
 6 Wley Study Sesson : Ethcal and Professonal Standards Applcaton LESSON : CORRECTION ANALYSIS Readng 9: Correlaton and Regresson LOS 9a: Calculate and nterpret a sample covarance and a sample correlaton
Lecture 3 Stat102, Spring 2007
 Lecture 3 Stat0, Sprng 007 Chapter 3. 3.: Introducton to regresson analyss Lnear regresson as a descrptve technque The least-squares equatons Chapter 3.3 Samplng dstrbuton of b 0, b. Contnued n net lecture
Chapter 14 Simple Linear Regression
 Chapter 4 Smple Lnear Regresson Chapter 4 - Smple Lnear Regresson Manageral decsons often are based on the relatonshp between two or more varables. Regresson analss can be used to develop an equaton showng
Lecture 6: Introduction to Linear Regression
 Lecture 6: Introducton to Lnear Regresson An Manchakul amancha@jhsph.edu 24 Aprl 27 Lnear regresson: man dea Lnear regresson can be used to study an outcome as a lnear functon of a predctor Example: 6
Y = β 0 + β 1 X 1 + β 2 X β k X k + ε
 Chapter 3 Secton 3.1 Model Assumptons: Multple Regresson Model Predcton Equaton Std. Devaton of Error Correlaton Matrx Smple Lnear Regresson: 1.) Lnearty.) Constant Varance 3.) Independent Errors 4.) Normalty
Introduction to Regression
 Introducton to Regresson Dr Tom Ilvento Department of Food and Resource Economcs Overvew The last part of the course wll focus on Regresson Analyss Ths s one of the more powerful statstcal technques Provdes
The Ordinary Least Squares (OLS) Estimator
 Estimator") The Ordnary Least Squares (OLS) Estmator 1 Regresson Analyss Regresson Analyss: a statstcal technque for nvestgatng and modelng the relatonshp between varables. Applcatons: Engneerng, the physcal and chemcal
The Ordnary Least Squares (OLS) Estmator 1 Regresson Analyss Regresson Analyss: a statstcal technque for nvestgatng and modelng the relatonshp between varables. Applcatons: Engneerng, the physcal and chemcal
Chapter 2 - The Simple Linear Regression Model S =0. e i is a random error. S β2 β. This is a minimization problem. Solution is a calculus exercise.
 Chapter - The Smple Lnear Regresson Model The lnear regresson equaton s: where y + = β + β e for =,..., y and are observable varables e s a random error How can an estmaton rule be constructed for the
e i is a random error
 Chapter - The Smple Lnear Regresson Model The lnear regresson equaton s: where + β + β e for,..., and are observable varables e s a random error How can an estmaton rule be constructed for the unknown
Chapter 11: Simple Linear Regression and Correlation
 Chapter 11: Smple Lnear Regresson and Correlaton 11-1 Emprcal Models 11-2 Smple Lnear Regresson 11-3 Propertes of the Least Squares Estmators 11-4 Hypothess Test n Smple Lnear Regresson 11-4.1 Use of t-tests
/ n ) are compared. The logic is: if the two
 are compared. The logic is: if the two") STAT C141, Sprng 2005 Lecture 13 Two sample tests One sample tests: examples of goodness of ft tests, where we are testng whether our data supports predctons. Two sample tests: called as tests of ndependence
STAT C141, Sprng 2005 Lecture 13 Two sample tests One sample tests: examples of goodness of ft tests, where we are testng whether our data supports predctons. Two sample tests: called as tests of ndependence
[The following data appear in Wooldridge Q2.3.] The table below contains the ACT score and college GPA for eight college students.
![[The following data appear in Wooldridge Q2.3.] The table below contains the ACT score and college GPA for eight college students.](/thumbs/87/96001374.jpg "[The following data appear in Wooldridge Q2.3.] The table below contains the ACT score and college GPA for eight college students.") PPOL 59-3 Problem Set Exercses n Smple Regresson Due n class /8/7 In ths problem set, you are asked to compute varous statstcs by hand to gve you a better sense of the mechancs of the Pearson correlaton
PPOL 59-3 Problem Set Exercses n Smple Regresson Due n class /8/7 In ths problem set, you are asked to compute varous statstcs by hand to gve you a better sense of the mechancs of the Pearson correlaton
Scatter Plot x
 Construct a scatter plot usng excel for the gven data. Determne whether there s a postve lnear correlaton, negatve lnear correlaton, or no lnear correlaton. Complete the table and fnd the correlaton coeffcent
17 - LINEAR REGRESSION II
 Topc 7 Lnear Regresson II 7- Topc 7 - LINEAR REGRESSION II Testng and Estmaton Inferences about β Recall that we estmate Yˆ ˆ β + ˆ βx. 0 μ Y X x β0 + βx usng To estmate σ σ squared error Y X x ε s ε we
β0 + β1xi. You are interested in estimating the unknown parameters β
 Ordnary Least Squares (OLS): Smple Lnear Regresson (SLR) Analytcs The SLR Setup Sample Statstcs Ordnary Least Squares (OLS): FOCs and SOCs Back to OLS and Sample Statstcs Predctons (and Resduals) wth OLS
Chapter 13: Multiple Regression
 Chapter 13: Multple Regresson 13.1 Developng the multple-regresson Model The general model can be descrbed as: It smplfes for two ndependent varables: The sample ft parameter b 0, b 1, and b are used to
Correlation and Regression. Correlation 9.1. Correlation. Chapter 9
 Chapter 9 Correlaton and Regresson 9. Correlaton Correlaton A correlaton s a relatonshp between two varables. The data can be represented b the ordered pars (, ) where s the ndependent (or eplanator) varable,
STAT 3008 Applied Regression Analysis
 STAT 3008 Appled Regresson Analyss Tutoral : Smple Lnear Regresson LAI Chun He Department of Statstcs, The Chnese Unversty of Hong Kong 1 Model Assumpton To quantfy the relatonshp between two factors,
Comparison of Regression Lines
 STATGRAPHICS Rev. 9/13/2013 Comparson of Regresson Lnes Summary... 1 Data Input... 3 Analyss Summary... 4 Plot of Ftted Model... 6 Condtonal Sums of Squares... 6 Analyss Optons... 7 Forecasts... 8 Confdence
β0 + β1xi. You are interested in estimating the unknown parameters β
 Revsed: v3 Ordnar Least Squares (OLS): Smple Lnear Regresson (SLR) Analtcs The SLR Setup Sample Statstcs Ordnar Least Squares (OLS): FOCs and SOCs Back to OLS and Sample Statstcs Predctons (and Resduals)
Economics 130. Lecture 4 Simple Linear Regression Continued
 Economcs 130 Lecture 4 Contnued Readngs for Week 4 Text, Chapter and 3. We contnue wth addressng our second ssue + add n how we evaluate these relatonshps: Where do we get data to do ths analyss? How do
18. SIMPLE LINEAR REGRESSION III
 8. SIMPLE LINEAR REGRESSION III US Domestc Beers: Calores vs. % Alcohol Ftted Values and Resduals To each observed x, there corresponds a y-value on the ftted lne, y ˆ ˆ = α + x. The are called ftted values.
Learning Objectives for Chapter 11
 Chapter : Lnear Regresson and Correlaton Methods Hldebrand, Ott and Gray Basc Statstcal Ideas for Managers Second Edton Learnng Objectves for Chapter Usng the scatterplot n regresson analyss Usng the method
Linear correlation and linear regression
 Lnear correlaton and lnear regresson Contnuous outcome (means) Outcome Varable Contnuous (e.g. pan scale, cogntve functon) Are the observatons ndependent or correlated? ndependent Ttest: compares means
Properties of Least Squares
 Week 3 3.1 Smple Lnear Regresson Model 3. Propertes of Least Squares Estmators Y Y β 1 + β X + u weekly famly expendtures X weekly famly ncome For a gven level of x, the expected level of food expendtures
Lecture Notes for STATISTICAL METHODS FOR BUSINESS II BMGT 212. Chapters 14, 15 & 16. Professor Ahmadi, Ph.D. Department of Management
 Lecture Notes for STATISTICAL METHODS FOR BUSINESS II BMGT 1 Chapters 14, 15 & 16 Professor Ahmad, Ph.D. Department of Management Revsed August 005 Chapter 14 Formulas Smple Lnear Regresson Model: y =
28. SIMPLE LINEAR REGRESSION III
 8. SIMPLE LINEAR REGRESSION III Ftted Values and Resduals US Domestc Beers: Calores vs. % Alcohol To each observed x, there corresponds a y-value on the ftted lne, y ˆ = βˆ + βˆ x. The are called ftted
Resource Allocation and Decision Analysis (ECON 8010) Spring 2014 Foundations of Regression Analysis
 Spring 2014 Foundations of Regression Analysis") Resource Allocaton and Decson Analss (ECON 800) Sprng 04 Foundatons of Regresson Analss Readng: Regresson Analss (ECON 800 Coursepak, Page 3) Defntons and Concepts: Regresson Analss statstcal technques
Resource Allocaton and Decson Analss (ECON 800) Sprng 04 Foundatons of Regresson Analss Readng: Regresson Analss (ECON 800 Coursepak, Page 3) Defntons and Concepts: Regresson Analss statstcal technques
Chapter 3. Two-Variable Regression Model: The Problem of Estimation
 Chapter 3. Two-Varable Regresson Model: The Problem of Estmaton Ordnary Least Squares Method (OLS) Recall that, PRF: Y = β 1 + β X + u Thus, snce PRF s not drectly observable, t s estmated by SRF; that
Linear Regression Analysis: Terminology and Notation
 ECON 35* -- Secton : Basc Concepts of Regresson Analyss (Page ) Lnear Regresson Analyss: Termnology and Notaton Consder the generc verson of the smple (two-varable) lnear regresson model. It s represented
Biostatistics 360 F&t Tests and Intervals in Regression 1
 Bostatstcs 360 F&t Tests and Intervals n Regresson ORIGIN Model: Y = X + Corrected Sums of Squares: X X bar where: s the y ntercept of the regresson lne (translaton) s the slope of the regresson lne (scalng
SIMPLE LINEAR REGRESSION
 Smple Lnear Regresson and Correlaton Introducton Prevousl, our attenton has been focused on one varable whch we desgnated b x. Frequentl, t s desrable to learn somethng about the relatonshp between two
β0 + β1xi and want to estimate the unknown
 SLR Models Estmaton Those OLS Estmates Estmators (e ante) v. estmates (e post) The Smple Lnear Regresson (SLR) Condtons -4 An Asde: The Populaton Regresson Functon B and B are Lnear Estmators (condtonal
where I = (n x n) diagonal identity matrix with diagonal elements = 1 and off-diagonal elements = 0; and σ 2 e = variance of (Y X).
 diagonal identity matrix with diagonal elements = 1 and off-diagonal elements = 0; and σ 2 e = variance of (Y X).") 11.4.1 Estmaton of Multple Regresson Coeffcents In multple lnear regresson, we essentally solve n equatons for the p unnown parameters. hus n must e equal to or greater than p and n practce n should e
11.4.1 Estmaton of Multple Regresson Coeffcents In multple lnear regresson, we essentally solve n equatons for the p unnown parameters. hus n must e equal to or greater than p and n practce n should e
8/25/17. Data Modeling. Data Modeling. Data Modeling. Patrice Koehl Department of Biological Sciences National University of Singapore
 8/5/17 Data Modelng Patrce Koehl Department of Bologcal Scences atonal Unversty of Sngapore http://www.cs.ucdavs.edu/~koehl/teachng/bl59 koehl@cs.ucdavs.edu Data Modelng Ø Data Modelng: least squares Ø
Chapter 15 Student Lecture Notes 15-1
 Chapter 15 Student Lecture Notes 15-1 Basc Busness Statstcs (9 th Edton) Chapter 15 Multple Regresson Model Buldng 004 Prentce-Hall, Inc. Chap 15-1 Chapter Topcs The Quadratc Regresson Model Usng Transformatons
Dr. Shalabh Department of Mathematics and Statistics Indian Institute of Technology Kanpur
 Analyss of Varance and Desgn of Experment-I MODULE VII LECTURE - 3 ANALYSIS OF COVARIANCE Dr Shalabh Department of Mathematcs and Statstcs Indan Insttute of Technology Kanpur Any scentfc experment s performed
Regression Analysis. Regression Analysis
 Regresson Analyss Smple Regresson Multvarate Regresson Stepwse Regresson Replcaton and Predcton Error 1 Regresson Analyss In general, we "ft" a model by mnmzng a metrc that represents the error. n mn (y
Midterm Examination. Regression and Forecasting Models
 IOMS Department Regresson and Forecastng Models Professor Wllam Greene Phone: 22.998.0876 Offce: KMC 7-90 Home page: people.stern.nyu.edu/wgreene Emal: wgreene@stern.nyu.edu Course web page: people.stern.nyu.edu/wgreene/regresson/outlne.htm
ISQS 6348 Final Open notes, no books. Points out of 100 in parentheses. Y 1 ε 2
 ISQS 6348 Fnal Open notes, no books. Ponts out of 100 n parentheses. 1. The followng path dagram s gven: ε 1 Y 1 ε F Y 1.A. (10) Wrte down the usual model and assumptons that are mpled by ths dagram. Soluton:
Topic 7: Analysis of Variance
 Topc 7: Analyss of Varance Outlne Parttonng sums of squares Breakdown the degrees of freedom Expected mean squares (EMS) F test ANOVA table General lnear test Pearson Correlaton / R 2 Analyss of Varance
Econ107 Applied Econometrics Topic 3: Classical Model (Studenmund, Chapter 4)
") I. Classcal Assumptons Econ7 Appled Econometrcs Topc 3: Classcal Model (Studenmund, Chapter 4) We have defned OLS and studed some algebrac propertes of OLS. In ths topc we wll study statstcal propertes
I. Classcal Assumptons Econ7 Appled Econometrcs Topc 3: Classcal Model (Studenmund, Chapter 4) We have defned OLS and studed some algebrac propertes of OLS. In ths topc we wll study statstcal propertes
ECONOMICS 351*-A Mid-Term Exam -- Fall Term 2000 Page 1 of 13 pages. QUEEN'S UNIVERSITY AT KINGSTON Department of Economics
 ECOOMICS 35*-A Md-Term Exam -- Fall Term 000 Page of 3 pages QUEE'S UIVERSITY AT KIGSTO Department of Economcs ECOOMICS 35* - Secton A Introductory Econometrcs Fall Term 000 MID-TERM EAM ASWERS MG Abbott
The Multiple Classical Linear Regression Model (CLRM): Specification and Assumptions. 1. Introduction
: Specification and Assumptions. 1. Introduction") ECONOMICS 5* -- NOTE (Summary) ECON 5* -- NOTE The Multple Classcal Lnear Regresson Model (CLRM): Specfcaton and Assumptons. Introducton CLRM stands for the Classcal Lnear Regresson Model. The CLRM s also
ECONOMICS 5* -- NOTE (Summary) ECON 5* -- NOTE The Multple Classcal Lnear Regresson Model (CLRM): Specfcaton and Assumptons. Introducton CLRM stands for the Classcal Lnear Regresson Model. The CLRM s also
Negative Binomial Regression
 STATGRAPHICS Rev. 9/16/2013 Negatve Bnomal Regresson Summary... 1 Data Input... 3 Statstcal Model... 3 Analyss Summary... 4 Analyss Optons... 7 Plot of Ftted Model... 8 Observed Versus Predcted... 10 Predctons...
Lecture 9: Linear regression: centering, hypothesis testing, multiple covariates, and confounding
 Recall: man dea of lnear regresson Lecture 9: Lnear regresson: centerng, hypothess testng, multple covarates, and confoundng Sandy Eckel seckel@jhsph.edu 6 May 8 Lnear regresson can be used to study an
STAT 3340 Assignment 1 solutions. 1. Find the equation of the line which passes through the points (1,1) and (4,5).
 and (4,5).") (out of 15 ponts) STAT 3340 Assgnment 1 solutons (10) (10) 1. Fnd the equaton of the lne whch passes through the ponts (1,1) and (4,5). β 1 = (5 1)/(4 1) = 4/3 equaton for the lne s y y 0 = β 1 (x x 0
(out of 15 ponts) STAT 3340 Assgnment 1 solutons (10) (10) 1. Fnd the equaton of the lne whch passes through the ponts (1,1) and (4,5). β 1 = (5 1)/(4 1) = 4/3 equaton for the lne s y y 0 = β 1 (x x 0
1. Inference on Regression Parameters a. Finding Mean, s.d and covariance amongst estimates. 2. Confidence Intervals and Working Hotelling Bands
 Content. Inference on Regresson Parameters a. Fndng Mean, s.d and covarance amongst estmates.. Confdence Intervals and Workng Hotellng Bands 3. Cochran s Theorem 4. General Lnear Testng 5. Measures of
Lecture 9: Linear regression: centering, hypothesis testing, multiple covariates, and confounding
 Lecture 9: Lnear regresson: centerng, hypothess testng, multple covarates, and confoundng Sandy Eckel seckel@jhsph.edu 6 May 008 Recall: man dea of lnear regresson Lnear regresson can be used to study
Here is the rationale: If X and y have a strong positive relationship to one another, then ( x x) will tend to be positive when ( y y)
 will tend to be positive when ( y y)") Secton 1.5 Correlaton In the prevous sectons, we looked at regresson and the value r was a measurement of how much of the varaton n y can be attrbuted to the lnear relatonshp between y and x. In ths secton,
Secton 1.5 Correlaton In the prevous sectons, we looked at regresson and the value r was a measurement of how much of the varaton n y can be attrbuted to the lnear relatonshp between y and x. In ths secton,
Chapter 15 - Multiple Regression
 Chapter - Multple Regresson Chapter - Multple Regresson Multple Regresson Model The equaton that descrbes how the dependent varable y s related to the ndependent varables x, x,... x p and an error term
Reminder: Nested models. Lecture 9: Interactions, Quadratic terms and Splines. Effect Modification. Model 1
 Lecture 9: Interactons, Quadratc terms and Splnes An Manchakul amancha@jhsph.edu 3 Aprl 7 Remnder: Nested models Parent model contans one set of varables Extended model adds one or more new varables to
UNIVERSITY OF TORONTO Faculty of Arts and Science. December 2005 Examinations STA437H1F/STA1005HF. Duration - 3 hours
 UNIVERSITY OF TORONTO Faculty of Arts and Scence December 005 Examnatons STA47HF/STA005HF Duraton - hours AIDS ALLOWED: (to be suppled by the student) Non-programmable calculator One handwrtten 8.5'' x
Chapter 12 Analysis of Covariance
 Chapter Analyss of Covarance Any scentfc experment s performed to know somethng that s unknown about a group of treatments and to test certan hypothess about the correspondng treatment effect When varablty
Sociology 301. Bivariate Regression. Clarification. Regression. Liying Luo Last exam (Exam #4) is on May 17, in class.
 is on May 17, in class.") Socology 30 Bvarate Regresson Lyng Luo 04.28 Clarfcaton Last exam (Exam #4) s on May 7, n class. No exam n the fnal exam week (May 24). Regresson Regresson Analyss: the procedure for esjmajng and tesjng
Socology 30 Bvarate Regresson Lyng Luo 04.28 Clarfcaton Last exam (Exam #4) s on May 7, n class. No exam n the fnal exam week (May 24). Regresson Regresson Analyss: the procedure for esjmajng and tesjng
x i1 =1 for all i (the constant ).
.") Chapter 5 The Multple Regresson Model Consder an economc model where the dependent varable s a functon of K explanatory varables. The economc model has the form: y = f ( x,x,..., ) xk Approxmate ths by
Chapter 5 The Multple Regresson Model Consder an economc model where the dependent varable s a functon of K explanatory varables. The economc model has the form: y = f ( x,x,..., ) xk Approxmate ths by
Modeling and Simulation NETW 707
 Modelng and Smulaton NETW 707 Lecture 5 Tests for Random Numbers Course Instructor: Dr.-Ing. Magge Mashaly magge.ezzat@guc.edu.eg C3.220 1 Propertes of Random Numbers Random Number Generators (RNGs) must
Measuring the Strength of Association
 Stat 3000 Statstcs for Scentsts and Engneers Measurng the Strength of Assocaton Note that the slope s one measure of the lnear assocaton between two contnuous varables t tells ou how much the average of
Interval Estimation in the Classical Normal Linear Regression Model. 1. Introduction
 ECONOMICS 35* -- NOTE 7 ECON 35* -- NOTE 7 Interval Estmaton n the Classcal Normal Lnear Regresson Model Ths note outlnes the basc elements of nterval estmaton n the Classcal Normal Lnear Regresson Model
Linear Correlation. Many research issues are pursued with nonexperimental studies that seek to establish relationships among 2 or more variables
 Lnear Correlaton Many research ssues are pursued wth nonexpermental studes that seek to establsh relatonshps among or more varables E.g., correlates of ntellgence; relaton between SAT and GPA; relaton
x yi In chapter 14, we want to perform inference (i.e. calculate confidence intervals and perform tests of significance) in this setting.
 in this setting.") The Practce of Statstcs, nd ed. Chapter 14 Inference for Regresson Introducton In chapter 3 we used a least-squares regresson lne (LSRL) to represent a lnear relatonshp etween two quanttatve explanator
The Practce of Statstcs, nd ed. Chapter 14 Inference for Regresson Introducton In chapter 3 we used a least-squares regresson lne (LSRL) to represent a lnear relatonshp etween two quanttatve explanator
T E C O L O T E R E S E A R C H, I N C.
 T E C O L O T E R E S E A R C H, I N C. B rdg n g En g neern g a nd Econo mcs S nce 1973 THE MINIMUM-UNBIASED-PERCENTAGE ERROR (MUPE) METHOD IN CER DEVELOPMENT Thrd Jont Annual ISPA/SCEA Internatonal Conference
Chapter 14 Simple Linear Regression Page 1. Introduction to regression analysis 14-2
 Chapter 4 Smple Lnear Regresson Page. Introducton to regresson analyss 4- The Regresson Equaton. Lnear Functons 4-4 3. Estmaton and nterpretaton of model parameters 4-6 4. Inference on the model parameters
Lecture 16 Statistical Analysis in Biomaterials Research (Part II)
") 3.051J/0.340J 1 Lecture 16 Statstcal Analyss n Bomaterals Research (Part II) C. F Dstrbuton Allows comparson of varablty of behavor between populatons usng test of hypothess: σ x = σ x amed for Brtsh statstcan
3.051J/0.340J 1 Lecture 16 Statstcal Analyss n Bomaterals Research (Part II) C. F Dstrbuton Allows comparson of varablty of behavor between populatons usng test of hypothess: σ x = σ x amed for Brtsh statstcan
PubH 7405: REGRESSION ANALYSIS. SLR: INFERENCES, Part II
 PubH 7405: REGRESSION ANALSIS SLR: INFERENCES, Part II We cover te topc of nference n two sessons; te frst sesson focused on nferences concernng te slope and te ntercept; ts s a contnuaton on estmatng
Correlation and Regression
 Correlaton and Regresson otes prepared by Pamela Peterson Drake Index Basc terms and concepts... Smple regresson...5 Multple Regresson...3 Regresson termnology...0 Regresson formulas... Basc terms and
Activity #13: Simple Linear Regression. actgpa.sav; beer.sav;
 ctvty #3: Smple Lnear Regresson Resources: actgpa.sav; beer.sav; http://mathworld.wolfram.com/leastfttng.html In the last actvty, we learned how to quantfy the strength of the lnear relatonshp between
is the calculated value of the dependent variable at point i. The best parameters have values that minimize the squares of the errors
 Multple Lnear and Polynomal Regresson wth Statstcal Analyss Gven a set of data of measured (or observed) values of a dependent varable: y versus n ndependent varables x 1, x, x n, multple lnear regresson
Statistics for Managers Using Microsoft Excel/SPSS Chapter 14 Multiple Regression Models
 Statstcs for Managers Usng Mcrosoft Excel/SPSS Chapter 14 Multple Regresson Models 1999 Prentce-Hall, Inc. Chap. 14-1 Chapter Topcs The Multple Regresson Model Contrbuton of Indvdual Independent Varables
NANYANG TECHNOLOGICAL UNIVERSITY SEMESTER I EXAMINATION MTH352/MH3510 Regression Analysis
 NANYANG TECHNOLOGICAL UNIVERSITY SEMESTER I EXAMINATION 014-015 MTH35/MH3510 Regresson Analyss December 014 TIME ALLOWED: HOURS INSTRUCTIONS TO CANDIDATES 1. Ths examnaton paper contans FOUR (4) questons
Sociology 470. Bivariate Regression. Extra Points. Regression. Liying Luo Job talk on Thursday 11/3 at Pond 302
 Socology 470 Bvarate Regresson Lyng Luo.0 Extra Ponts Job talk on Thursday /3 at noon @ Pond 302 Another job talk on Tuesday /8 at noon @ Pond 302 A thrd job talk on Thursday /0 at 3pm @ Pond 302 Regresson
See Book Chapter 11 2 nd Edition (Chapter 10 1 st Edition)
") Count Data Models See Book Chapter 11 2 nd Edton (Chapter 10 1 st Edton) Count data consst of non-negatve nteger values Examples: number of drver route changes per week, the number of trp departure changes
Count Data Models See Book Chapter 11 2 nd Edton (Chapter 10 1 st Edton) Count data consst of non-negatve nteger values Examples: number of drver route changes per week, the number of trp departure changes
JAB Chain. Long-tail claims development. ASTIN - September 2005 B.Verdier A. Klinger
 JAB Chan Long-tal clams development ASTIN - September 2005 B.Verder A. Klnger Outlne Chan Ladder : comments A frst soluton: Munch Chan Ladder JAB Chan Chan Ladder: Comments Black lne: average pad to ncurred
Regression. The Simple Linear Regression Model
 Regresson Smple Lnear Regresson Model Least Squares Method Coeffcent of Determnaton Model Assumptons Testng for Sgnfcance Usng the Estmated Regresson Equaton for Estmaton and Predcton Resdual Analss: Valdatng
III. Econometric Methodology Regression Analysis
 Page Econ07 Appled Econometrcs Topc : An Overvew of Regresson Analyss (Studenmund, Chapter ) I. The Nature and Scope of Econometrcs. Lot s of defntons of econometrcs. Nobel Prze Commttee Paul Samuelson,
Dr. Shalabh Department of Mathematics and Statistics Indian Institute of Technology Kanpur
 Analyss of Varance and Desgn of Experment-I MODULE VIII LECTURE - 34 ANALYSIS OF VARIANCE IN RANDOM-EFFECTS MODEL AND MIXED-EFFECTS EFFECTS MODEL Dr Shalabh Department of Mathematcs and Statstcs Indan
However, since P is a symmetric idempotent matrix, of P are either 0 or 1 [Eigen-values
 Fall 007 Soluton to Mdterm Examnaton STAT 7 Dr. Goel. [0 ponts] For the general lnear model = X + ε, wth uncorrelated errors havng mean zero and varance σ, suppose that the desgn matrx X s not necessarly
Chapter 7 Generalized and Weighted Least Squares Estimation. In this method, the deviation between the observed and expected values of
 Chapter 7 Generalzed and Weghted Least Squares Estmaton The usual lnear regresson model assumes that all the random error components are dentcally and ndependently dstrbuted wth constant varance. When
Topic- 11 The Analysis of Variance
 Topc- 11 The Analyss of Varance Expermental Desgn The samplng plan or expermental desgn determnes the way that a sample s selected. In an observatonal study, the expermenter observes data that already
Diagnostics in Poisson Regression. Models - Residual Analysis
 Dagnostcs n Posson Regresson Models - Resdual Analyss 1 Outlne Dagnostcs n Posson Regresson Models - Resdual Analyss Example 3: Recall of Stressful Events contnued 2 Resdual Analyss Resduals represent
UNIVERSITY OF TORONTO. Faculty of Arts and Science JUNE EXAMINATIONS STA 302 H1F / STA 1001 H1F Duration - 3 hours Aids Allowed: Calculator
 UNIVERSITY OF TORONTO Faculty of Arts and Scence JUNE EXAMINATIONS 008 STA 30 HF / STA 00 HF Duraton - 3 hours Ads Allowed: Calculator LAST NAME: FIRST NAME: STUDENT NUMBER: Enrolled n (Crcle one): STA30
Chapter 4: Regression With One Regressor
 Chapter 4: Regresson Wth One Regressor Copyrght 2011 Pearson Addson-Wesley. All rghts reserved. 1-1 Outlne 1. Fttng a lne to data 2. The ordnary least squares (OLS) lne/regresson 3. Measures of ft 4. Populaton
The SAS program I used to obtain the analyses for my answers is given below.
 Homework 1 Answer sheet Page 1 The SAS program I used to obtan the analyses for my answers s gven below. dm'log;clear;output;clear'; *************************************************************; *** EXST7034
Chapter 10. What is Regression Analysis? Simple Linear Regression Analysis. Examples
 Chapter 10 Smple Lnear Regresson Analyss What s Regresson Analyss? A statstcal technque that descrbes the relatonshp between a dependent varable and one or more ndependent varables. Examples Consder the
This column is a continuation of our previous column
 Comparson of Goodness of Ft Statstcs for Lnear Regresson, Part II The authors contnue ther dscusson of the correlaton coeffcent n developng a calbraton for quanttatve analyss. Jerome Workman Jr. and Howard
Andreas C. Drichoutis Agriculural University of Athens. Abstract
 Heteroskedastcty, the sngle crossng property and ordered response models Andreas C. Drchouts Agrculural Unversty of Athens Panagots Lazards Agrculural Unversty of Athens Rodolfo M. Nayga, Jr. Texas AMUnversty
Chapter 3 Describing Data Using Numerical Measures
 Chapter 3 Student Lecture Notes 3-1 Chapter 3 Descrbng Data Usng Numercal Measures Fall 2006 Fundamentals of Busness Statstcs 1 Chapter Goals To establsh the usefulness of summary measures of data. The
Psychology 282 Lecture #24 Outline Regression Diagnostics: Outliers
 Psychology 282 Lecture #24 Outlne Regresson Dagnostcs: Outlers In an earler lecture we studed the statstcal assumptons underlyng the regresson model, ncludng the followng ponts: Formal statement of assumptons.
CORRELATION AND REGRESSION
 CHAPTER 18 CORRELATION AND REGRESSION After readng ths chapter, students wll be able to understand: LEARNING OBJECTIVES The meanng of bvarate data and technques of preparaton of bvarate dstrbuton; The
4.3 Poisson Regression
 of teratvely reweghted least squares regressons (the IRLS algorthm). We do wthout gvng further detals, but nstead focus on the practcal applcaton. > glm(survval~log(weght)+age, famly="bnomal", data=baby)
Rockefeller College University at Albany
 Rockefeller College Unverst at Alban PAD 705 Handout: Maxmum Lkelhood Estmaton Orgnal b Davd A. Wse John F. Kenned School of Government, Harvard Unverst Modfcatons b R. Karl Rethemeer Up to ths pont n