Lec 1: An Introduction to ANOVA
|
|
|
- Eustace Cooper
- 5 years ago
- Views:
Transcription
1 Ying Li Stockholm University October 31, 2011

2 Three end-aisle displays Which is the best?
3 Design of the Experiment Identify the stores of the similar size and type. The displays are randomly assigned to use.
4 Design of the Experiment Identify the stores of the similar size and type. The displays are randomly assigned to use. First Principle Randomization
5 Observations 3 levels 5 replicates
6
7 The Analysis of Variance a level of the factors (a treatments) n replicates N = a n runs Completely randomized design
8 Statistical Model y ij = µ + τ i + ε ij i = 1, a j = 1, n µ : overall mean τ i : the effect of ith treatment ε ij N(0, σ 2 ),i.i.d. a i τ i = 0
9 The Analysis of Variance We are interested in testing the equality of treatment means E(ȳ i. ) = µ + τ i = µ i i = 1, a The appropriate hypothesis are H 0 : µ 1 = µ 2 = = µ a H 1 : µ i µ j for at least one pair (i, j)
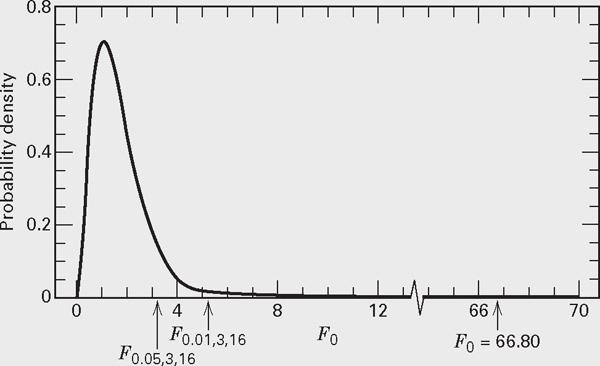
10 If H 0 is true, the distribution of F 0 is F a 1,a(n 1) Reject H 0 if F 0 > F α,a 1,a(n 1)
11
12 Equation for manual calculation Balanced Data: a n SS T = i=1 j=1 ij y.. 2 N y 2 Unbalanced Data SS T = a n i i=1 j=1 ij y.. 2 N y 2 SS Treatment = 1 n a i=1 i. y.. 2 N y 2 SS Treatment = a yi. 2 y.. 2 n i N i=1 SS E = SS T SS Treatment SS E = SS T SS Treatment
13 Example ȳ 1. = 5.73,ȳ 2. = 6.24, ȳ 3. = 8.32,ȳ.. = 6.76 SS T = SS Treatment = SS E = SS T SS Treatment = 3.15
14 DF SS MS F P Treatment <0.001 Error Total
15 DF SS MS F P Treatment <0.001 Error Total Which ones cause the differ?
16 Multiple Comparison Methods We know the end-aisle display different than others. We might suspect the first and the second are different. Thus one reasonable test hypothesis would be H 0 : µ 1 = µ 2 H 1 : µ 1 µ 2 or, H 0 : µ 1 µ 2 = 0 H 1 : µ 1 µ 2 0
17 Contrasts In general, a contrast is a linear combination of the parameters of the form a Γ = c i µ i i=1 where c i are the contrast constants, and a i=1 c i = 0. For unbalance design a i=1 c in i = 0.
18 The hypothesis can be expressed in the terms of contrasts H 0 : a c i µ i = 0 i=1 a H 1 : c i µ i 0 i=1 In our example, c 1 = 1,c 2 = 1, c 3 = 0.
19 Contrast Tests Testing hypothesis involving contrast can be done in two basic ways 1 t-test: 2 F-test: where a i=1 t 0 = c iȳ i. MS E a n i=1 c2 i F 0 = MS c MS E = SS c/1 MS E SS c = ( a i=1 c iȳ i. ) 2 1 n a i=1 c2 i
20 Orthogonal Contrasts Two contrasts a i=1 = c iµ i = 0 and a i=1 = d iµ i = 0 are orthogonal if a c i d i = 0 or in unbalanced case if i=1 a n i c i d i = 0 i=1 We can specify a 1 orthogonal contrasts. Tests performed on orthogonal contrasts are independent.
21 Example
22 Pairwise Comparison The null hypothesis are H 0 : µ i = µ j, i j
23 Pairwise Comparison The null hypothesis are H 0 : µ i = µ j, i j Tukey s test Make use of the distribution of studentized range statistics q = ȳmax ȳ min MSE 2 ( 1 n i + 1 n j ) Appendix Table 7 contains upper percentiles for q. The difference d between two averages is significant if d > q α(a, f ) 2 MS E ( 1 n i + 1 n j )
24 The fisher least significant difference method (LSD) The fisher least significant difference method procedure use T test for testing H 0 : µ i = µ j, i j The test statistics is: ȳ i. ȳ j. t 0 = MS E ( 1 n i + 1 n j ) The quantity: least significant difference (LSD) If LSD = t α/2,n a MS E ( 1 n i + 1 n j ) ȳ i. ȳ j. > LSD we conclude that the population means µ i and µ j differ.
25 Questions:1 Why in some situation overall F test of ANOVA is significant, but the pairwise comparison fails to reveal the differences?
26 Questions:2 Many tests available: Duncan, Student-Newman-Keuls, REGWQ, Bonferroni, Sidak, Scheff, Which pairwise comparison method do I use?
27 Questions:2 Many tests available: Duncan, Student-Newman-Keuls, REGWQ, Bonferroni, Sidak, Scheff, Which pairwise comparison method do I use? unfortunately, no-clear cut answer. Fisher s LSD procedure, only apply if F test is significant Tukey s method control overall error rate, many statisticians prefer.
28 Dunnett s Test Often one of the treatments is a control treatment, and we want to compare the other treatments with the control treatment. We want to test a 1 hypotheses: H 0 : µ j = µ 1 where i = 2,, a
29 Dunnett s Test For the ith treatment, H 0 is rejected if ȳ i ȳ 1 > d α (a 1, f ) MS E ( ) n i n j Appendix 8 gives upper percentiles for d α (a 1, f )
30 One Example

31 One Example

32 One Example
Introduction. Chapter 8
 Chapter 8 Introduction In general, a researcher wants to compare one treatment against another. The analysis of variance (ANOVA) is a general test for comparing treatment means. When the null hypothesis
Lecture 5: Comparing Treatment Means Montgomery: Section 3-5
 Lecture 5: Comparing Treatment Means Montgomery: Section 3-5 Page 1 Linear Combination of Means ANOVA: y ij = µ + τ i + ɛ ij = µ i + ɛ ij Linear combination: L = c 1 µ 1 + c 1 µ 2 +...+ c a µ a = a i=1
STAT 5200 Handout #7a Contrasts & Post hoc Means Comparisons (Ch. 4-5)
") STAT 5200 Handout #7a Contrasts & Post hoc Means Comparisons Ch. 4-5) Recall CRD means and effects models: Y ij = µ i + ϵ ij = µ + α i + ϵ ij i = 1,..., g ; j = 1,..., n ; ϵ ij s iid N0, σ 2 ) If we reject
STAT 5200 Handout #7a Contrasts & Post hoc Means Comparisons Ch. 4-5) Recall CRD means and effects models: Y ij = µ i + ϵ ij = µ + α i + ϵ ij i = 1,..., g ; j = 1,..., n ; ϵ ij s iid N0, σ 2 ) If we reject
More about Single Factor Experiments
 More about Single Factor Experiments 1 2 3 0 / 23 1 2 3 1 / 23 Parameter estimation Effect Model (1): Y ij = µ + A i + ɛ ij, Ji A i = 0 Estimation: µ + A i = y i. ˆµ = y..  i = y i. y.. Effect Modell
ANALYSIS OF VARIANCE OF BALANCED DAIRY SCIENCE DATA USING SAS
 ANALYSIS OF VARIANCE OF BALANCED DAIRY SCIENCE DATA USING SAS Ravinder Malhotra and Vipul Sharma National Dairy Research Institute, Karnal-132001 The most common use of statistics in dairy science is testing
Laboratory Topics 4 & 5
 PLS205 Lab 3 January 23, 2014 Orthogonal contrasts Class comparisons in SAS Trend analysis in SAS Multiple mean comparisons Laboratory Topics 4 & 5 Orthogonal contrasts Planned, single degree-of-freedom
DESAIN EKSPERIMEN Analysis of Variances (ANOVA) Semester Genap 2017/2018 Jurusan Teknik Industri Universitas Brawijaya
 Semester Genap 2017/2018 Jurusan Teknik Industri Universitas Brawijaya") DESAIN EKSPERIMEN Analysis of Variances (ANOVA) Semester Jurusan Teknik Industri Universitas Brawijaya Outline Introduction The Analysis of Variance Models for the Data Post-ANOVA Comparison of Means Sample
DESAIN EKSPERIMEN Analysis of Variances (ANOVA) Semester Jurusan Teknik Industri Universitas Brawijaya Outline Introduction The Analysis of Variance Models for the Data Post-ANOVA Comparison of Means Sample
These are all actually contrasts (the coef sum to zero). What are these contrasts representing? What would make them large?
. What are these contrasts representing? What would make them large?") Lecture 12 Comparing treatment effects Orthogonal Contrasts What use are contrasts? Recall the Cotton data In this case, the treatment levels have an ordering to them this is not always the case) Consider
Lecture 12 Comparing treatment effects Orthogonal Contrasts What use are contrasts? Recall the Cotton data In this case, the treatment levels have an ordering to them this is not always the case) Consider
Summary of Chapter 7 (Sections ) and Chapter 8 (Section 8.1)
 and Chapter 8 (Section 8.1)") Summary of Chapter 7 (Sections 7.2-7.5) and Chapter 8 (Section 8.1) Chapter 7. Tests of Statistical Hypotheses 7.2. Tests about One Mean (1) Test about One Mean Case 1: σ is known. Assume that X N(µ, σ
Summary of Chapter 7 (Sections 7.2-7.5) and Chapter 8 (Section 8.1) Chapter 7. Tests of Statistical Hypotheses 7.2. Tests about One Mean (1) Test about One Mean Case 1: σ is known. Assume that X N(µ, σ
Linear Combinations. Comparison of treatment means. Bruce A Craig. Department of Statistics Purdue University. STAT 514 Topic 6 1
 Linear Combinations Comparison of treatment means Bruce A Craig Department of Statistics Purdue University STAT 514 Topic 6 1 Linear Combinations of Means y ij = µ + τ i + ǫ ij = µ i + ǫ ij Often study
Unit 12: Analysis of Single Factor Experiments
 Unit 12: Analysis of Single Factor Experiments Statistics 571: Statistical Methods Ramón V. León 7/16/2004 Unit 12 - Stat 571 - Ramón V. León 1 Introduction Chapter 8: How to compare two treatments. Chapter
STAT22200 Spring 2014 Chapter 5
 STAT22200 Spring 2014 Chapter 5 Yibi Huang April 29, 2014 Chapter 5 Multiple Comparisons Chapter 5-1 Chapter 5 Multiple Comparisons Note the t-tests and C.I. s are constructed assuming we only do one test,
Multiple Comparison Methods for Means
 SIAM REVIEW Vol. 44, No. 2, pp. 259 278 c 2002 Society for Industrial and Applied Mathematics Multiple Comparison Methods for Means John A. Rafter Martha L. Abell James P. Braselton Abstract. Multiple
Lec 5: Factorial Experiment
 November 21, 2011 Example Study of the battery life vs the factors temperatures and types of material. A: Types of material, 3 levels. B: Temperatures, 3 levels. Example Study of the battery life vs the
Multiple comparisons - subsequent inferences for two-way ANOVA
 1 Multiple comparisons - subsequent inferences for two-way ANOVA the kinds of inferences to be made after the F tests of a two-way ANOVA depend on the results if none of the F tests lead to rejection of
Multiple Comparison Procedures Cohen Chapter 13. For EDUC/PSY 6600
 Multiple Comparison Procedures Cohen Chapter 13 For EDUC/PSY 6600 1 We have to go to the deductions and the inferences, said Lestrade, winking at me. I find it hard enough to tackle facts, Holmes, without
A posteriori multiple comparison tests
 A posteriori multiple comparison tests 11/15/16 1 Recall the Lakes experiment Source of variation SS DF MS F P Lakes 58.000 2 29.400 8.243 0.006 Error 42.800 12 3.567 Total 101.600 14 The ANOVA tells us
 http://www.statsoft.it/out.php?loc=http://www.statsoft.com/textbook/ Group comparison test for independent samples The purpose of the Analysis of Variance (ANOVA) is to test for significant differences
The legacy of Sir Ronald A. Fisher. Fisher s three fundamental principles: local control, replication, and randomization.
 1 Chapter 1: Research Design Principles The legacy of Sir Ronald A. Fisher. Fisher s three fundamental principles: local control, replication, and randomization. 2 Chapter 2: Completely Randomized Design
Ch 2: Simple Linear Regression
 Ch 2: Simple Linear Regression 1. Simple Linear Regression Model A simple regression model with a single regressor x is y = β 0 + β 1 x + ɛ, where we assume that the error ɛ is independent random component
Factorial designs. Experiments
 Chapter 5: Factorial designs Petter Mostad mostad@chalmers.se Experiments Actively making changes and observing the result, to find causal relationships. Many types of experimental plans Measuring response
4.8 Alternate Analysis as a Oneway ANOVA
 4.8 Alternate Analysis as a Oneway ANOVA Suppose we have data from a two-factor factorial design. The following method can be used to perform a multiple comparison test to compare treatment means as well
Multiple t Tests. Introduction to Analysis of Variance. Experiments with More than 2 Conditions
 Introduction to Analysis of Variance 1 Experiments with More than 2 Conditions Often the research that psychologists perform has more conditions than just the control and experimental conditions You might
Analysis of Variance
 Analysis of Variance Blood coagulation time T avg A 62 60 63 59 61 B 63 67 71 64 65 66 66 C 68 66 71 67 68 68 68 D 56 62 60 61 63 64 63 59 61 64 Blood coagulation time A B C D Combined 56 57 58 59 60 61
Assignment 6 Answer Keys
 ssignment 6 nswer Keys Problem 1 (a) The treatment sum of squares can be calculated by SS Treatment = b a ȳi 2 Nȳ 2 i=1 = 5 (5.40 2 + 5.80 2 + 10 2 + 9.80 2 ) 20 7.75 2 = 92.95 Then the F statistic for
Analysis of Variance
 Statistical Techniques II EXST7015 Analysis of Variance 15a_ANOVA_Introduction 1 Design The simplest model for Analysis of Variance (ANOVA) is the CRD, the Completely Randomized Design This model is also
Chapter 10. Design of Experiments and Analysis of Variance
 Chapter 10 Design of Experiments and Analysis of Variance Elements of a Designed Experiment Response variable Also called the dependent variable Factors (quantitative and qualitative) Also called the independent
Tukey Complete Pairwise Post-Hoc Comparison
 Tukey Complete Pairwise Post-Hoc Comparison Engineering Statistics II Section 10.2 Josh Engwer TTU 2018 Josh Engwer (TTU) Tukey Complete Pairwise Post-Hoc Comparison 2018 1 / 23 PART I PART I: Gosset s
ANOVA Multiple Comparisons
 ANOVA Multiple Comparisons Multiple comparisons When we carry out an ANOVA on k treatments, we test H 0 : µ 1 = =µ k versus H a : H 0 is false Assume we reject the null hypothesis, i.e. we have some evidence
Introduction to Analysis of Variance (ANOVA) Part 2
 Part 2") Introduction to Analysis of Variance (ANOVA) Part 2 Single factor Serpulid recruitment and biofilms Effect of biofilm type on number of recruiting serpulid worms in Port Phillip Bay Response variable:
Introduction to Analysis of Variance (ANOVA) Part 2 Single factor Serpulid recruitment and biofilms Effect of biofilm type on number of recruiting serpulid worms in Port Phillip Bay Response variable:
PLSC PRACTICE TEST ONE
 PLSC 724 - PRACTICE TEST ONE 1. Discuss briefly the relationship between the shape of the normal curve and the variance. 2. What is the relationship between a statistic and a parameter? 3. How is the α
H0: Tested by k-grp ANOVA
 Pairwise Comparisons ANOVA for multiple condition designs Pairwise comparisons and RH Testing Alpha inflation & Correction LSD & HSD procedures Alpha estimation reconsidered H0: Tested by k-grp ANOVA Regardless
Outline. Topic 19 - Inference. The Cell Means Model. Estimates. Inference for Means Differences in cell means Contrasts. STAT Fall 2013
 Topic 19 - Inference - Fall 2013 Outline Inference for Means Differences in cell means Contrasts Multiplicity Topic 19 2 The Cell Means Model Expressed numerically Y ij = µ i + ε ij where µ i is the theoretical
Review: General Approach to Hypothesis Testing. 1. Define the research question and formulate the appropriate null and alternative hypotheses.
 1 Review: Let X 1, X,..., X n denote n independent random variables sampled from some distribution might not be normal!) with mean µ) and standard deviation σ). Then X µ σ n In other words, X is approximately
Analysis of Variance II Bios 662
 Analysis of Variance II Bios 662 Michael G. Hudgens, Ph.D. mhudgens@bios.unc.edu http://www.bios.unc.edu/ mhudgens 2008-10-24 17:21 BIOS 662 1 ANOVA II Outline Multiple Comparisons Scheffe Tukey Bonferroni
Multiple Testing. Gary W. Oehlert. January 28, School of Statistics University of Minnesota
 Multiple Testing Gary W. Oehlert School of Statistics University of Minnesota January 28, 2016 Background Suppose that you had a 20-sided die. Nineteen of the sides are labeled 0 and one of the sides is
The One-Way Repeated-Measures ANOVA. (For Within-Subjects Designs)
") The One-Way Repeated-Measures ANOVA (For Within-Subjects Designs) Logic of the Repeated-Measures ANOVA The repeated-measures ANOVA extends the analysis of variance to research situations using repeated-measures
The One-Way Repeated-Measures ANOVA (For Within-Subjects Designs) Logic of the Repeated-Measures ANOVA The repeated-measures ANOVA extends the analysis of variance to research situations using repeated-measures
Group comparison test for independent samples
 Group comparison test for independent samples Samples come from normal populations with possibly different means but a common variance Two independent samples: z or t test on difference between means Three,
The One-Way Independent-Samples ANOVA. (For Between-Subjects Designs)
") The One-Way Independent-Samples ANOVA (For Between-Subjects Designs) Computations for the ANOVA In computing the terms required for the F-statistic, we won t explicitly compute any sample variances or
The One-Way Independent-Samples ANOVA (For Between-Subjects Designs) Computations for the ANOVA In computing the terms required for the F-statistic, we won t explicitly compute any sample variances or
2 Hand-out 2. Dr. M. P. M. M. M c Loughlin Revised 2018
 Math 403 - P. & S. III - Dr. McLoughlin - 1 2018 2 Hand-out 2 Dr. M. P. M. M. M c Loughlin Revised 2018 3. Fundamentals 3.1. Preliminaries. Suppose we can produce a random sample of weights of 10 year-olds
STAT 525 Fall Final exam. Tuesday December 14, 2010
 STAT 525 Fall 2010 Final exam Tuesday December 14, 2010 Time: 2 hours Name (please print): Show all your work and calculations. Partial credit will be given for work that is partially correct. Points will
Chapter 15: Analysis of Variance
 Chapter 5: Analysis of Variance 5. Introduction In this chapter, we introduced the analysis of variance technique, which deals with problems whose objective is to compare two or more populations of quantitative
Analysis of variance
 Analysis of variance 1 Method If the null hypothesis is true, then the populations are the same: they are normal, and they have the same mean and the same variance. We will estimate the numerical value
Chap The McGraw-Hill Companies, Inc. All rights reserved.
 11 pter11 Chap Analysis of Variance Overview of ANOVA Multiple Comparisons Tests for Homogeneity of Variances Two-Factor ANOVA Without Replication General Linear Model Experimental Design: An Overview
H0: Tested by k-grp ANOVA
 Analyses of K-Group Designs : Omnibus F, Pairwise Comparisons & Trend Analyses ANOVA for multiple condition designs Pairwise comparisons and RH Testing Alpha inflation & Correction LSD & HSD procedures
22s:152 Applied Linear Regression. Take random samples from each of m populations.
 22s:152 Applied Linear Regression Chapter 8: ANOVA NOTE: We will meet in the lab on Monday October 10. One-way ANOVA Focuses on testing for differences among group means. Take random samples from each
1 One-way Analysis of Variance
 1 One-way Analysis of Variance Suppose that a random sample of q individuals receives treatment T i, i = 1,,... p. Let Y ij be the response from the jth individual to be treated with the ith treatment
Group comparison test for independent samples
 Group comparison test for independent samples The purpose of the Analysis of Variance (ANOVA) is to test for significant differences between means. Supposing that: samples come from normal populations
22s:152 Applied Linear Regression. There are a couple commonly used models for a one-way ANOVA with m groups. Chapter 8: ANOVA
 22s:152 Applied Linear Regression Chapter 8: ANOVA NOTE: We will meet in the lab on Monday October 10. One-way ANOVA Focuses on testing for differences among group means. Take random samples from each
STAT 263/363: Experimental Design Winter 2016/17. Lecture 1 January 9. Why perform Design of Experiments (DOE)? There are at least two reasons:
? There are at least two reasons:") STAT 263/363: Experimental Design Winter 206/7 Lecture January 9 Lecturer: Minyong Lee Scribe: Zachary del Rosario. Design of Experiments Why perform Design of Experiments (DOE)? There are at least two
STAT 263/363: Experimental Design Winter 206/7 Lecture January 9 Lecturer: Minyong Lee Scribe: Zachary del Rosario. Design of Experiments Why perform Design of Experiments (DOE)? There are at least two
Multiple comparisons The problem with the one-pair-at-a-time approach is its error rate.
 Multiple comparisons The problem with the one-pair-at-a-time approach is its error rate. Each confidence interval has a 95% probability of making a correct statement, and hence a 5% probability of making
The entire data set consists of n = 32 widgets, 8 of which were made from each of q = 4 different materials.
 One-Way ANOVA Summary The One-Way ANOVA procedure is designed to construct a statistical model describing the impact of a single categorical factor X on a dependent variable Y. Tests are run to determine
B. Weaver (18-Oct-2006) MC Procedures Chapter 1: Multiple Comparison Procedures ) C (1.1)
 MC Procedures Chapter 1: Multiple Comparison Procedures ) C (1.1)") B. Weaver (18-Oct-2006) MC Procedures... 1 Chapter 1: Multiple Comparison Procedures 1.1 Introduction The omnibus F-test in a one-way ANOVA is a test of the null hypothesis that the population means of
B. Weaver (18-Oct-2006) MC Procedures... 1 Chapter 1: Multiple Comparison Procedures 1.1 Introduction The omnibus F-test in a one-way ANOVA is a test of the null hypothesis that the population means of
QUEEN MARY, UNIVERSITY OF LONDON
 QUEEN MARY, UNIVERSITY OF LONDON MTH634 Statistical Modelling II Solutions to Exercise Sheet 4 Octobe07. We can write (y i. y.. ) (yi. y i.y.. +y.. ) yi. y.. S T. ( Ti T i G n Ti G n y i. +y.. ) G n T
W&M CSCI 688: Design of Experiments Homework 2. Megan Rose Bryant
 W&M CSCI 688: Design of Experiments Homework 2 Megan Rose Bryant September 25, 201 3.5 The tensile strength of Portland cement is being studied. Four different mixing techniques can be used economically.
Design & Analysis of Experiments 7E 2009 Montgomery
 1 What If There Are More Than Two Factor Levels? The t-test does not directly apply ppy There are lots of practical situations where there are either more than two levels of interest, or there are several
One-Way Analysis of Variance. With regression, we related two quantitative, typically continuous variables.
 One-Way Analysis of Variance With regression, we related two quantitative, typically continuous variables. Often we wish to relate a quantitative response variable with a qualitative (or simply discrete)
Linear Combinations of Group Means
 Linear Combinations of Group Means Look at the handicap example on p. 150 of the text. proc means data=mth567.disability; class handicap; var score; proc sort data=mth567.disability; by handicap; proc
The Distribution of F
 The Distribution of F It can be shown that F = SS Treat/(t 1) SS E /(N t) F t 1,N t,λ a noncentral F-distribution with t 1 and N t degrees of freedom and noncentrality parameter λ = t i=1 n i(µ i µ) 2
ANOVA Analysis of Variance
 ANOVA Analysis of Variance ANOVA Analysis of Variance Extends independent samples t test ANOVA Analysis of Variance Extends independent samples t test Compares the means of groups of independent observations
G. Nested Designs. 1 Introduction. 2 Two-Way Nested Designs (Balanced Cases) 1.1 Definition (Nested Factors) 1.2 Notation. 1.3 Example. 2.
 1.1 Definition (Nested Factors) 1.2 Notation. 1.3 Example. 2.") G. Nested Designs 1 Introduction. 1.1 Definition (Nested Factors) When each level of one factor B is associated with one and only one level of another factor A, we say that B is nested within factor A.
G. Nested Designs 1 Introduction. 1.1 Definition (Nested Factors) When each level of one factor B is associated with one and only one level of another factor A, we say that B is nested within factor A.
n i n T Note: You can use the fact that t(.975; 10) = 2.228, t(.95; 10) = 1.813, t(.975; 12) = 2.179, t(.95; 12) =
 = 2.228, t(.95; 10) = 1.813, t(.975; 12) = 2.179, t(.95; 12) =") MAT 3378 3X Midterm Examination (Solutions) 1. An experiment with a completely randomized design was run to determine whether four specific firing temperatures affect the density of a certain type of brick.
MAT 3378 3X Midterm Examination (Solutions) 1. An experiment with a completely randomized design was run to determine whether four specific firing temperatures affect the density of a certain type of brick.
Pairwise multiple comparisons are easy to compute using SAS Proc GLM. The basic statement is:
 Pairwise Multiple Comparisons in SAS Pairwise multiple comparisons are easy to compute using SAS Proc GLM. The basic statement is: means effects / options Here, means is the statement initiat, effects
Orthogonal contrasts and multiple comparisons
 BIOL 933 Lab 4 Fall 2017 Orthogonal contrasts Class comparisons in R Trend analysis in R Multiple mean comparisons Orthogonal contrasts and multiple comparisons Orthogonal contrasts Planned, single degree-of-freedom
Comparing Several Means: ANOVA
 Comparing Several Means: ANOVA Understand the basic principles of ANOVA Why it is done? What it tells us? Theory of one way independent ANOVA Following up an ANOVA: Planned contrasts/comparisons Choosing
MATH 644: Regression Analysis Methods
 MATH 644: Regression Analysis Methods FINAL EXAM Fall, 2012 INSTRUCTIONS TO STUDENTS: 1. This test contains SIX questions. It comprises ELEVEN printed pages. 2. Answer ALL questions for a total of 100
Introduction to Design and Analysis of Experiments with the SAS System (Stat 7010 Lecture Notes)
") Introduction to Design and Analysis of Experiments with the SAS System (Stat 7010 Lecture Notes) Asheber Abebe Discrete and Statistical Sciences Auburn University Contents 1 Completely Randomized Design
Introduction to Design and Analysis of Experiments with the SAS System (Stat 7010 Lecture Notes) Asheber Abebe Discrete and Statistical Sciences Auburn University Contents 1 Completely Randomized Design
Chapter 6 Planned Contrasts and Post-hoc Tests for one-way ANOVA
 Chapter 6 Planned Contrasts and Post-hoc Tests for one-way NOV Page. The Problem of Multiple Comparisons 6-. Types of Type Error Rates 6-. Planned contrasts vs. Post hoc Contrasts 6-7 4. Planned Contrasts
One-way ANOVA. Experimental Design. One-way ANOVA
 Method to compare more than two samples simultaneously without inflating Type I Error rate (α) Simplicity Few assumptions Adequate for highly complex hypothesis testing 09/30/12 1 Outline of this class
Homework 2: Simple Linear Regression
 STAT 4385 Applied Regression Analysis Homework : Simple Linear Regression (Simple Linear Regression) Thirty (n = 30) College graduates who have recently entered the job market. For each student, the CGPA
DESAIN EKSPERIMEN BLOCKING FACTORS. Semester Genap 2017/2018 Jurusan Teknik Industri Universitas Brawijaya
 DESAIN EKSPERIMEN BLOCKING FACTORS Semester Genap Jurusan Teknik Industri Universitas Brawijaya Outline The Randomized Complete Block Design The Latin Square Design The Graeco-Latin Square Design Balanced
Multiple Pairwise Comparison Procedures in One-Way ANOVA with Fixed Effects Model
 Biostatistics 250 ANOVA Multiple Comparisons 1 ORIGIN 1 Multiple Pairwise Comparison Procedures in One-Way ANOVA with Fixed Effects Model When the omnibus F-Test for ANOVA rejects the null hypothesis that
Multiple Testing. Tim Hanson. January, Modified from originals by Gary W. Oehlert. Department of Statistics University of South Carolina
 Multiple Testing Tim Hanson Department of Statistics University of South Carolina January, 2017 Modified from originals by Gary W. Oehlert Type I error A Type I error is to wrongly reject the null hypothesis
Analysis of Variance. Read Chapter 14 and Sections to review one-way ANOVA.
 Analysis of Variance Read Chapter 14 and Sections 15.1-15.2 to review one-way ANOVA. Design of an experiment the process of planning an experiment to insure that an appropriate analysis is possible. Some
CHAPTER 4 Analysis of Variance. One-way ANOVA Two-way ANOVA i) Two way ANOVA without replication ii) Two way ANOVA with replication
 Two way ANOVA without replication ii) Two way ANOVA with replication") CHAPTER 4 Analysis of Variance One-way ANOVA Two-way ANOVA i) Two way ANOVA without replication ii) Two way ANOVA with replication 1 Introduction In this chapter, expand the idea of hypothesis tests. We
CHAPTER 4 Analysis of Variance One-way ANOVA Two-way ANOVA i) Two way ANOVA without replication ii) Two way ANOVA with replication 1 Introduction In this chapter, expand the idea of hypothesis tests. We
Chapter Seven: Multi-Sample Methods 1/52
 Chapter Seven: Multi-Sample Methods 1/52 7.1 Introduction 2/52 Introduction The independent samples t test and the independent samples Z test for a difference between proportions are designed to analyze
STAT 115:Experimental Designs
 STAT 115:Experimental Designs Josefina V. Almeda 2013 Multisample inference: Analysis of Variance 1 Learning Objectives 1. Describe Analysis of Variance (ANOVA) 2. Explain the Rationale of ANOVA 3. Compare
Multiple Comparisons
 Multiple Comparisons Error Rates, A Priori Tests, and Post-Hoc Tests Multiple Comparisons: A Rationale Multiple comparison tests function to tease apart differences between the groups within our IV when
I i=1 1 I(J 1) j=1 (Y ij Ȳi ) 2. j=1 (Y j Ȳ )2 ] = 2n( is the two-sample t-test statistic.
![I i=1 1 I(J 1) j=1 (Y ij Ȳi ) 2. j=1 (Y j Ȳ )2 ] = 2n( is the two-sample t-test statistic.](/thumbs/85/92729432.jpg "I i=1 1 I(J 1) j=1 (Y ij Ȳi ) 2. j=1 (Y j Ȳ )2 ] = 2n( is the two-sample t-test statistic.") Serik Sagitov, Chalmers and GU, February, 08 Solutions chapter Matlab commands: x = data matrix boxplot(x) anova(x) anova(x) Problem.3 Consider one-way ANOVA test statistic For I = and = n, put F = MS
Serik Sagitov, Chalmers and GU, February, 08 Solutions chapter Matlab commands: x = data matrix boxplot(x) anova(x) anova(x) Problem.3 Consider one-way ANOVA test statistic For I = and = n, put F = MS
One-way ANOVA (Single-Factor CRD)
") One-way ANOVA (Single-Factor CRD) STAT:5201 Week 3: Lecture 3 1 / 23 One-way ANOVA We have already described a completed randomized design (CRD) where treatments are randomly assigned to EUs. There is
One-way ANOVA (Single-Factor CRD) STAT:5201 Week 3: Lecture 3 1 / 23 One-way ANOVA We have already described a completed randomized design (CRD) where treatments are randomly assigned to EUs. There is
9 One-Way Analysis of Variance
 9 One-Way Analysis of Variance SW Chapter 11 - all sections except 6. The one-way analysis of variance (ANOVA) is a generalization of the two sample t test to k 2 groups. Assume that the populations of
Inferences for Regression
 Inferences for Regression An Example: Body Fat and Waist Size Looking at the relationship between % body fat and waist size (in inches). Here is a scatterplot of our data set: Remembering Regression In
DESIGNING EXPERIMENTS AND ANALYZING DATA A Model Comparison Perspective
 DESIGNING EXPERIMENTS AND ANALYZING DATA A Model Comparison Perspective Second Edition Scott E. Maxwell Uniuersity of Notre Dame Harold D. Delaney Uniuersity of New Mexico J,t{,.?; LAWRENCE ERLBAUM ASSOCIATES,
Biological Applications of ANOVA - Examples and Readings
 BIO 575 Biological Applications of ANOVA - Winter Quarter 2010 Page 1 ANOVA Pac Biological Applications of ANOVA - Examples and Readings One-factor Model I (Fixed Effects) This is the same example for
Simple Linear Regression
 Simple Linear Regression In simple linear regression we are concerned about the relationship between two variables, X and Y. There are two components to such a relationship. 1. The strength of the relationship.
Stat 217 Final Exam. Name: May 1, 2002
 Stat 217 Final Exam Name: May 1, 2002 Problem 1. Three brands of batteries are under study. It is suspected that the lives (in weeks) of the three brands are different. Five batteries of each brand are
Research Methods II MICHAEL BERNSTEIN CS 376
 Research Methods II MICHAEL BERNSTEIN CS 376 Goal Understand and use statistical techniques common to HCI research 2 Last time How to plan an evaluation What is a statistical test? Chi-square t-test Paired
4.1 Example: Exercise and Glucose
 4 Linear Regression Post-menopausal women who exercise less tend to have lower bone mineral density (BMD), putting them at increased risk for fractures. But they also tend to be older, frailer, and heavier,
1 Tomato yield example.
 ST706 - Linear Models II. Spring 2013 Two-way Analysis of Variance examples. Here we illustrate what happens analyzing two way data in proc glm in SAS. Similar issues come up with other software where
A Note on UMPI F Tests
 A Note on UMPI F Tests Ronald Christensen Professor of Statistics Department of Mathematics and Statistics University of New Mexico May 22, 2015 Abstract We examine the transformations necessary for establishing
ANOVA: Comparing More Than Two Means
 ANOVA: Comparing More Than Two Means Chapter 11 Cathy Poliak, Ph.D. cathy@math.uh.edu Office Fleming 11c Department of Mathematics University of Houston Lecture 25-3339 Cathy Poliak, Ph.D. cathy@math.uh.edu
Ch 3: Multiple Linear Regression
 Ch 3: Multiple Linear Regression 1. Multiple Linear Regression Model Multiple regression model has more than one regressor. For example, we have one response variable and two regressor variables: 1. delivery
11 Hypothesis Testing
 28 11 Hypothesis Testing 111 Introduction Suppose we want to test the hypothesis: H : A q p β p 1 q 1 In terms of the rows of A this can be written as a 1 a q β, ie a i β for each row of A (here a i denotes
Ch. 5 Two-way ANOVA: Fixed effect model Equal sample sizes
 Ch. 5 Two-way ANOVA: Fixed effect model Equal sample sizes 1 Assumptions and models There are two factors, factors A and B, that are of interest. Factor A is studied at a levels, and factor B at b levels;
What If There Are More Than. Two Factor Levels?
 What If There Are More Than Chapter 3 Two Factor Levels? Comparing more that two factor levels the analysis of variance ANOVA decomposition of total variability Statistical testing & analysis Checking
Math 3330: Solution to midterm Exam
 Math 3330: Solution to midterm Exam Question 1: (14 marks) Suppose the regression model is y i = β 0 + β 1 x i + ε i, i = 1,, n, where ε i are iid Normal distribution N(0, σ 2 ). a. (2 marks) Compute the
Formal Statement of Simple Linear Regression Model
 Formal Statement of Simple Linear Regression Model Y i = β 0 + β 1 X i + ɛ i Y i value of the response variable in the i th trial β 0 and β 1 are parameters X i is a known constant, the value of the predictor
Analysis of Variance (ANOVA) Cancer Research UK 10 th of May 2018 D.-L. Couturier / R. Nicholls / M. Fernandes
 Cancer Research UK 10 th of May 2018 D.-L. Couturier / R. Nicholls / M. Fernandes") Analysis of Variance (ANOVA) Cancer Research UK 10 th of May 2018 D.-L. Couturier / R. Nicholls / M. Fernandes 2 Quick review: Normal distribution Y N(µ, σ 2 ), f Y (y) = 1 2πσ 2 (y µ)2 e 2σ 2 E[Y ] =
Analysis of Variance (ANOVA) Cancer Research UK 10 th of May 2018 D.-L. Couturier / R. Nicholls / M. Fernandes 2 Quick review: Normal distribution Y N(µ, σ 2 ), f Y (y) = 1 2πσ 2 (y µ)2 e 2σ 2 E[Y ] =
Two-Way Analysis of Variance - no interaction
 1 Two-Way Analysis of Variance - no interaction Example: Tests were conducted to assess the effects of two factors, engine type, and propellant type, on propellant burn rate in fired missiles. Three engine
Master s Written Examination
 Master s Written Examination Option: Statistics and Probability Spring 016 Full points may be obtained for correct answers to eight questions. Each numbered question which may have several parts is worth