Experimental study of ultra-thin films mechanical integrity by combined nano-indentation and nanoacoustic
|
|
|
- Brianna Paul
- 5 years ago
- Views:
Transcription

1 Graduate Theses and Dissertations Iowa State University Capstones, Theses and Dissertations 2013 Experimental study of ultra-thin films mechanical integrity by combined nano-indentation and nanoacoustic emission Zihou Zhang Iowa State University Follow this and additional works at: Part of the Mechanics of Materials Commons Recommended Citation Zhang, Zihou, "Experimental study of ultra-thin films mechanical integrity by combined nano-indentation and nano-acoustic emission" (2013). Graduate Theses and Dissertations This Thesis is brought to you for free and open access by the Iowa State University Capstones, Theses and Dissertations at Iowa State University Digital Repository. It has been accepted for inclusion in Graduate Theses and Dissertations by an authorized administrator of Iowa State University Digital Repository. For more information, please contact
2 Experimental study of ultra-thin films mechanical integrity by combined nanoindentation and nano-acoustic emission by Zihou Zhang A thesis submitted to the graduate faculty in partial fulfillment of the requirements for the degree of MASTER OF SCIENCE Major: Materials Science and Engineering Program of Study Committee: Ashraf F. Bastawros, Co-Major Professor Wei Hong, Co-Major Professor Thomas J. Rudolphi Iowa State University Ames, Iowa 2013 Copyright Zihou Zhang, All rights reserved.
3 ii TABLE OF CONTENTS ABSTRACT iv CHAPTER 1. INTRODUCTION Motivation and Proposed Work Introduction of Nanoindentation Technique Nanoindentation Fracture Mechanics of Indentation on Film-Substrate Structure Equivalent Tip and Plastic Zone Role of Excursions Acoustic Emission Technique on Film Fracture Analysis 20 CHAPTER 2. METHODOLOGY Experimental Setup Measurement of Hardness AE Signal Pattern Recognition Time-Domain Signal Analysis Frequency-Domain Analysis Energy of a Signal Role of Trigger Level 69 CHAPTER 3. RESULT AND DISCUSSION BY GROUPS Hard Substrate: σyf/σys < 1 for All Ef/Es Ratios Intel Sample # Intel Sample # Intel Sample # Intel Sample #772 79
4 iii 3.2 Soft or Comparable Substrate: σyf/σys 1 for All Ef/Es Ratios Intel Sample # Intel Sample # Intel Sample # Intel Sample # Intel Sample # Intel Sample # Intel Sample # IBM Sample ULK IBM Wafer 96SJG4 103 CHAPTER 4. SUMMARY AND CONCLUSIONS 106 BIBLIOGRAPHY 112
5 iv ABSTRACT Advancement of interconnect technology has imposed significant challenge on interface characterization and reliability for blurred interfaces between layers. There is a need for material properties and these miniaturized length scales and assessment of reliability; including the intrinsic film fracture toughness and the interfacial fracture toughness. The nano-meter range of film thicknesses currently employed, impose significant challenges on evaluating these physical quantities and thereby impose significant challenge on the design cycle. In this study we attempted to use a combined nano-indentation and nano-acoustic emission to qualitatively and quantitatively characterize the failure modes in ultra-thin blanket films on Si substrates or stakes of different characteristics. We have performed and analyzed an exhaustive group of testes that cove many diverge combination of filmsubstrate combination, provided by both Intel and IBM. When the force-indentation depth curve shows excursion, a direct measure of the total energy release rate is estimated. The collected acoustic emission signal is then used to partition the total energy into two segments, one associated with the cohesive fracture toughness of the film and the other is for the adhesive fracture toughness of the interface. The acoustic emission signal is analyzed in both the time and frequency domain to achieve such energy division. In particular, the signal time domain analysis for signal skewness, time of arrival and total energy content are employed with the proper signal to noise ratio. In the frequency domain, an expansive group of acoustic emission signals are utilized to
6 v construct the details of the power spectral density. A bank of band-pass filters are designed to sort the individual signals to those associated with adhesive interlayer cracking, cohesive channel cracking, or other system induced noise. The attenuation time and the energy content within each spectral frequency were the key elements for this sorting. In the case wherein no excursion were present on the load-displacement curve, atypical case for adhesive failure only, the final indentation load along with the size of the blister were used to characterize the cohesive fracture energy. In the few cases wherein the film toughness was much higher than the substrate toughness, the unloading segment of the force-indentation depth curve showed a clear demarcation with a much lower slope. Such demarcation arises from the film buckling induced delamination. The delaminated buckled film unloads faster than the indentation process zone within the substrate and thereby become affected by the stored elastic strain energy within the film only. A simple model, utilizing the area under the force-indentation depth curve is derived to calculate the interfacial energy release rate of the film-substrate system. The model assessment is in good agreement with estimates done by four-point-bend testing on the same material system. The developed experimental protocol may become useful in identifying the prominent failure mechanisms for quick screening of film-substrate, as well as in providing some quantitative measures of the adhesive and cohesive fracture toughness.
7 1 CHAPTER 1. INTRODUCTION 1.1. Motivation and Proposed Work The interconnected layered structure is one of the basic forms of modern microelectronic devices. The inspiration, that to make interconnected multiple devices on one single chip, of this application was raised even as early as the beginning of modern semiconductor industry, however did not finally come into reality until 1990 s, when fully integrated microelectronicmechanical system (MEMS) was brought by a technological revolution [1]. This technology is based on improved understanding of thin-film deposition and mechanical properties, and the core part is surface micromachining, which is grounded in the use of photolithography meanwhile provides repetitive processing steps, ultimately yields multi-layered interconnected structure [2]. Different layers of the structure can serve as different devices. Mechanical properties and reliabilities of this structure have been concerned ever since tis appearance [3-7]. There are five major failure modes, including ratcheting, voiding, electromigration, cohesive cracking, delamination (adhesive cracking) [4]. In this paper, only the latter two, which are defined as fracture of the structure, are featured. Cohesive cracking is that cracks initiate and propagate in the film only, and it only fractures the film, while does not influence interface and substrate or under layer. Delamination, or adhesive cracking, initiates and fractures interface of two layers. To study such behaviors can help industry to design more reliable devices.
8 2 There are a bunch of conventional experimental methods to measure and evaluate fracture of the structures based on fracture mechanics approaches, including superlayer test [9], double cantilever beam test [10], three or four point bending and scratching test [11-12]. However, these conventional techniques are limited by complicated sample preparation, difficulties in grips to match boundary conditions of corresponding models, instrumental resolution and stochastic variation at small length scale. Besides, few of above can simultaneously evaluate both of the fracture modes. Nanoindentation test has the advantages of no prior sample preparation, high localization and high resolution of appliances. However, conventional nanoindentation test still has limitations, such as limited applicable materials system, and inability of study interactions of both modes [13]. Acoustic emission (AE) monitoring is a process-kinetics sensitive technique. It has been successfully utilized in various testing fields [14-16]. By recognizing patterns of real-time AE signals, a possibility is provided that is to monitor occurrence and discrimination of different mechanical process [17]. It has no doubt that AE signals denoting cohesive cracks should have distinguished pattern from those representing adhesive cracks, due to different kinetics of these two process[18-19]. Hence, application of real-time AE monitoring technique in nanoindentation test has the potential of assisting us to evaluate fracture behaviors. In this paper, we attempt to invent a novel fracture testing technique, featuring nanoindentation combined with acoustic emission (AE) monitoring technique, in order
9 3 to synchronously measuring both the fracture modes and their interactions. By testing on samples manufactured by Intel and IBM, relationships between material properties, such as elastic modulus and flow stress, and fracture modes are studied. Real-time acoustic emission signals captured during tests will be recognized and related to corresponding fracture modes. Hence, this technique can not only quantitively evaluate fracture behaviors, but also qualitively detect them underneath. This thesis is set up by two parts. The first part is the overview of nanoindentation and necessary theories of fracture mechanics for this study, and application of both above to current tests. The second part is a review of acoustic emission monitoring technique, construction of AE signal pattern recognition method, and how it can be employed to current research. Conclusion and bibliography are provided at the end of the paper Introduction of Nanoindentation Technique Nanoindentation The idea of indentation was raised from hardness testing, by a simple thought that poking an unknown material with a material of given properties and comparing. After several decades of refinement, concept of hardness finally became the least pressure needed to produce a permanent impression at the center of contact area. By such definition, the most important parameters of indentation test should be the
10 4 indentation peak load P and the contact area A, and therefore hardness as its definition is given by: H = P A (1.1) As is indicated by its name, different from common indentation, nanoindentation has a smaller length scale in nanometers, comparing to common indentation tests of mili or micrometers. This miniaturized length scale provides on one hand higher resolution for measuring, on the other hand difficulties in measuring squared micron-sized contact area by conventional optical methods. Hence, indentation contact area is replaced by a more easily manageable parameter, indentation depth, for this case. That is why nanoindentation is also called depth-sensing indentation [18]. Along with the development of this technique, nanoindentation test is not only limited in hardness testing, but also applied to testing other materials behaviors such as elasticity, plasticity [17, 19], viscoelasticity [20], stress-induced phase transformation [21] and fracture [22]. For such purposes, links between parameters derived directly from indentation like indentation load and depth, and contact area as well as further corresponding parameters should be established, as will be discussed below.
11 5 Figure 1.1 A typical load-displacement curve derived from indentation test. P is the peak indentation load of the test, h is the indentation depth at the peak indentation load. h is the final displacement. S is the stiffness of the tested material. Adapted from [23]. A typical load-displacement curve is shown in Figure 1.1. It is obvious that there is only elastic response happening during unloading. Hence, stiffness of the tested materials can be found by: S = dp dh = 2E r (1.2) Where, S is the stiffness, P is the indentation load and h the indentation depth, r is the radius of contact area, and reduced modulus E is defined: 1 = 1 ν + 1 ν (1.3) E E E Where, E and E are elastic moduli of tested material and indenter tip, ν and ν are Poisson s ratios of tested material and indenter tip, respectively. In our test, diamond is
12 6 used as the indenter tip, thus E is as high as ~1TPa. For most of measured materials with modulus ranging 100 Mpa ~ 100 GPa, reduced modulus value is very close to material s young s modulus value. Due to huge errors from conventional elastic models, in 1992, Oliver and Pharr [23] established a method to estimate contact area based on elastic-plastic response during unloading: P = B(h h ) (1.4) Where, B and m can be found by power-law fitting unloading curve. At the peak load, combining functions (1.2) and (1.4) yields: S = dp dh (P = P ) = mb(h h ) (1.5) The contact depth h, rather than either h or h, is then given by: h = ε P S (1.6) Where, ε is a geometry constant depending on the shape of indenter tip. For conical tip, ε = (π 2) = Since radius of cross sectional area of tip is only dependent on geometry of tip and indentation depth, from the result of (1.6) r and A can be derived. Apply the value to (1.1) and (1.2), and one can finally find harness and elastic modulus of the tested material. In general cases, it is impossible that only elastic response exists. More commonly, plasticity comes along with process of indentation. In the definition of
13 7 hardness, the term permanent usually relates to plasticity. This definition indicates a simple relationship between material s hardness and yield strength, and under an indentation test, this hardness can be expressed by mean pressure P. Following experimental research approaches have provided useful and reliable results: H Cσ (1.7) Where, C is a constant varying according to E σ ratios. When E σ is high, C 3; and if E σ is low, C 1.5. Relationships of P, H and σ are listed in Table 1.1. Region P < 1.1σ 1.1σ < P < H P H Response Elastic response Plastic deformation exists but is constrained by surrounding elastic materials. Ratio C = H σ is constant with respect to impressed material and tip geometry Material yields. Plastic region grows, and is independent of increase of P Table Fracture Mechanics of Indentation on Film-Substrate Structure It has been proven that simply applying conventional designing principle, which is critical stress-based, is unreliable. Thus we need a substitutive and more convincing principle. The failure of previous theory is due to imperfection of materials. Since this imperfection can be never avoided, the new theory must start with considering defects. If we model the defected materials as following: the body is a linear elastic continuum and there is a crack with matching surfaces and a front tip inside the body, it is obvious that
14 8 only if this crack elongates, or propagates, the materials fails, or it is safe and stable. Considering the physical process of crack propagation, it can be simply descried as generation of new surfaces and simultaneous reduce of energy stored inside the body. If we focus on the relationship between changes of energy stored and crack surface area, a parameter should be developed: G = U A (1.8) Where U is the elastic energy stored inside the body and A is the crack surface area. G is called energy release rate, as is easily understood by its definition. If G is greater than certain critical value, G, or Γ, which is called fracture energy, the crack propagates, or the crack will stay stable. It is easily seen that fracture toughness is a materials constant directly related to strength of atomic bonding while independent of boundary conditions, thus what we care is how to calculate energy release rate. r c (a)
15 9 r c (b) Figure 1.2 Schematic cross-section of indent-induced channel cracking in a film. (a) Mechanical thick film, where half-penny shape crack happens and (b) Mechanical thin film, where channel crack happens. r is contact radius, b is the radius of plastic zone, c is the crack length, t is the thickness of film. Adapted from [22]. 1) Cohesive Cracking Model When applying this fracture mechanics theory to indentation on films, according to result given by Jungk et.al [22], the developed model should be considered as two types: mechanical thick and mechanical thin (Figure 1.2). If indentation depth is less than 10% of film thickness, we consider it mechanical thick, otherwise it should be mechanical thin. Energy release rate of cohesive cracks under indentation can be presented as: G = 2ξ η P c 1 ch mechanical thick (V ) λ η 1 E H 1 P mechanical thin t c (1.9)
16 10 Where, λ is a constant related to Poisson s ratio and indentation tip geometry, and is approximately for Vicker s indenter and for cube-corner indenter. ξ is a geometric parameter derived from experiments, and is equal to for cube-corner tip [24]. Tip shape constant η is defined by: P H = A = ηr (1.10) And for both Vicker s and cube-corner geometry, η is approximately E, H are the modulus and hardness of the film, respectively, which can be directly derived by (1.1) and (1.2). t is film thickness, and c is the total crack length. V is a parameter that characterizes plastic affect, which is given by 1 h t V = 1 h t (1.11) h h > t t f σ R Figure 1.3 Scheme of a film-substrate structure with one cohesive crack only in the structure. t is the film thickness, σ is the residual stress throughout the film. Adapted from [25].
17 11 For deposition of film, residual stress cannot be avoided as a byproduct. Apart from indentation-induced stress, residual stress can as well be a resource of driving force for crack propagation. Considering a single layer film bonded by a substrate, a channel crack runs across the thickness of the film, and no additional damage to either substrate or interface. Since crack tip is constrained by substrate that bonds so that the problem is simple plain-strain, change of elastic energy is scaled by film thickness and crack area, namely: U~ σ ct E (1.12) Hence, the energy release rate is given by: G = U A ~ σ t E (1.13) And this expression indicates that energy release rate is only related to film thickness geometrically, thus the thinner film is, the more difficult it cracks. Generally, energy release rate under this condition is [26]: G = Z(α, β) σ t E (1.14) Where Z is a dimensionless number and depends on Dundur s parameters: α = E E E + E β = E 1 ν (1 2ν ) (1 E ν )(1 2ν ) 2(1 ν )(1 ν )(E + E ) (1.15)
18 12 And they represent materials mismatch between film and substrate. When mismatch does not exist, e.g., Dundur s parameters α = β = 0, Z = 2 or more exactly, Z value decreases a little bit if the structure is a soft film on hard substrate, meaning α < 0. When substrate is compliant than film, Z value increases rapidly with respect to increase of α. For example, when α > 0.99, Z > 30. Effect of another parameter β is secondary and is often ignored [25]. At last, energy release rate of cohesive cracking yields: G = G + G (1.16) 2) Adhesive Cracking Models t f t f t f Figure 1.4 Scheme of film-substrate system under indentation when (a) indentation without buckling, (b) indentation with buckling and (c) film buckling after removal of indenter. V is the indentation volume, t the film thickness and a the length of adhesive cracking. Adapted from [13]
19 13 For adhesive cracks, the most commonly used model (Figure 1.4) is developed by Marshall and Evans [27]: G E 1 υ = 1 2 t σ 1 + υ + (1 α )hσ (1 α )t (σ σ ) (1.17) Where, υ is the Poisson s ratio of the film, parameter α represents buckling effect, which is given by 0 σ + σ σ α = υ σ + σ > σ (1.18) The indentation stress σ is calculated by σ = V E 2πt a (1 υ ) (1.19) a is the square of adhesive crack radius, V is half of the indentation volume, which is given by integrating tip area function from the machine. The Euler buckling stress σ is defined as σ = μt E 12a (1 υ ) (1.20) Where, μ is a constant equal to Using these equations, we can determine energy release rate. The problem of this model is, it neglects the influences from substrate. One can tell from the expression from the model, that there is no consideration of materials mismatch in system. It also assumes that what indentation brings in is of elastic
20 14 responses. Buckling is an issue but still under the regime of elasticity. Also, lack of consideration of indentation process is unreliability from another point of view. Hence, this model can be only used for brittle film materials with relatively lower interfacial fracture toughness. Figure 1.5 A schematic load-displacement curve got from indentation on highly buckled film. There is a sudden change of slope when unloading. U is the work done by film to indenter tip, P and h are defined as previous. Adapted from Wei Hong, personal communication in Another approach considers plasticity and indentation load-displacement response. Figure 1.5 plots an indentation test on film with large buckling. There is a clear linear section with discontinuous slope on the unloading. The area under, however, is the work done by the film to the indenter during unloading. Because the unloading is a reversible process, this work should be equal to elastic energy released in the film due to indentation. Neglecting effect of residual stress which is considered small comparing to that caused by indentation, let us consider this work.
21 15 At the maximum load and displacement, delamination stops at certain area. The energy release rate of this point should be equal to fracture toughness, or debonding will continue. Assume that the debonding area, with the radius of a, has a circular insertion of eigenstrain of ϵ in the middle. The insertion is related to plastic zone of axisymmetric indentation, and its radius is b. Analytical solution of this problem is, in term of displacement: a u = 1 + ε r 1 a r (1.21) b By this expression, the corresponding strains can be represented as: ε = 1 + ε a b ε = 1 + ε 1 a b 1 a r a r (1.22) Where, ϵ is the radial strain and ϵ is the tangential strain. Then the strain energy density will be derived: W = 1 E 2 1 ν ε + ε + 2νε ε = E + ε 1 ν 1 (1 + ν) + (1 ν) a 1 a r b (1.23)
22 16 Integrating this density over the annular region, the elastic strain energy is: U = πeh + ε 1 ν 1 1 a b (1 + ν)(a b ) + a (1 ν) a b 1 = πeh (1 + ε ) 1 ν a [(1 + ν)b + (1 ν)a ] b 1 (1.24) = πehb 1 ν (1 + ε ) 2b a + 1 ν b Note that debonding area A = πa and indentation plastic zone A = πb, such expression can be rewritten as: And the energy release rate is: U = EhA 1 ν (1 + ε ) 2A A A + 1 ν (1.25) G = U A = EhA 1 ν (1 + ε ) 2A A A 2A = U A A (1 ν)a + (1 + ν)a (1.26)

23 Equivalent Tip and Plastic Zone Figure 1.6 Schematic equivalence of pyramidal indenter tip (left) and conical tip (right). Results [28] show that the tips are equivalent when conical one inscribes the pyramidal tip. θ and Ψ are indenter angles, respectively. Adapted from [28]. Both the adhesive fracture models share the assumption that the indenter tip is asymmetric. However in our test, a cube-corner tip is used. Hence there is a need to find an equivalent asymmetric, or conical tip, for our test to apply models and find plastic zone. According to Qin et al [28], base area of a pyramidal indenter (Berkovich and cube-corner etc.) should be equivalent to that of an axisymmetric indenter whose indenter angle equals to angle of this pyramidal indenter (Figure 1.6). Namely, cubecorner tip is equivalent to a 35.3 angled axisymmetric tip. That means, indentation area using cube-corner indenter should be approximately times that using equivalent axisymmetric tip. According to Kramer et al [29], radius of plastic zone area and radius of axisymmetric indenter area have a relationship as following:
24 18 3 ζ = b = r 1 + C r t for r t 1 3 for r t > 1 3 (1.27) Where, r is the radius of the indentation area; C and n are constants which equal to 1.27 and -0.5 respectively. Thus, if we have the indenter tip s depth-area relationship function A(h), the plastic zone area will be: A = ζ A(h) (1.28) Role of Excursions During indentation, when there is a sudden large increase of compliance of the system, a pop-in will occur on the load-displacement curve, which is also referred as an excursion (Figure 1.9(a)). There are a lot of resources that can result in the increase of compliance, including plasticity [17, 30] fracture [22, 31] and other sources. As the compliance increases, as a response under the same load, deformation is larger, and the indenter tip sinks in the system deeper. Therefore, the area under an excursion should be the work done by indenter tip to the system. In our experiments, we hardly observe evidence of phase transformation. This work done is finally transformed to elastic as well as plastic deformation energy, cohesive cracking energy and adhesive cracking energy, namely: δu = W = δu + δu δu δu (1.29)
25 19 Where, δu is the change in energy of the system, W is area under excursion, which equals to work done by indenter tip, δu is the energy change by cohesive cracking and δu is the energy change by adhesive cracking. If we do a little transformation for (1.29): W 1 δu + δu W = γw = (δu + δu ) (1.30) Where, γ, which denotes non-fracture portion of work done, is approximately 0.15 for some cases. However, this ratio is not a universal constant. It varies according to mechanical propertied of the system. For example, for ductile samples, this ratio should be lower than that for brittle and high-stiffness samples. According to the definition of energy release rate and fracture energy, energy release rate and fracture energy are equal when crack propagation stops under load. Note that in our case, fracture is relatively small which is in micro-scale, which yields: Γ = G = U A δu A (1.31) Combining (1.30) and (1.31), the relationship between fracture and excursions is expressed: γw = (δu + δu ) = Γ A + Γ A (1.32) Where, Γ and Γ are cohesive and adhesive fracture energy, respectively, A and A are areas of cohesive and adhesive crack, respectively, which can be measured directly from tests.
26 Acoustic Emission Technique on Film Fracture Analysis When a physical process involving sudden release of elastic energy appears in a system, elastic waves generated and emitting can be detected and measured by acoustic emission (AE) monitoring. The resource of the process can be fracture, stress-induced phase transformations as well as plastic instabilities such as acceleration of existing dislocation and initiation of new slip system. Both theoretical and experimental approaches prove that energy of AE signals has a linear relationship with energy generated by corresponding physical process. Namely, AE = α E (1.33) Where, AE is the sum of measured relative acoustic energy, E the energy of corresponding process and α a scaling coefficient that varies with respect to systems and physical processes [32]. AE monitoring is also sensitive to process kinetics, which allows discriminating different types of processes. Hence this technique can be used for in-situ evaluation of specific mechanical processes. The signals captured by AE monitoring can provide following information about the process: 1) time when the process occurs; 2) energy level of the process and 3) type of the process. Conventional AE monitoring involves surface detection provided by large sensor attached to the surface, which was used for to evaluate certain processes during indentation and scratching tests on a variety of materials. However, this technique has
27 21 some defects that limit its applications. First of all, the energy level capable to detect is relatively high. Previous studies have proved that the technique is applicable to evaluate transition from elastic to elastic-plastic deformation by a measured linear relationship between AE energy and work of plasticity induced excursions [16]. Except for signals at the beginning of such excursions, no other signal is detected, which indicates process involved with lower energy changing, namely dislocation nucleation, are incapable to capture. Other processes with similar energy level, such as oxide film fracture, is neither capable to detect. In fact, the technique is impotent for process occurring under 1mN. Additionally, effect of AE detection is highly influenced by multiple wave reflections, and it leads to the dependence on size. Finally, types of signals will be affected by shape of indenter tip [16, 33]. Due to these defects, this approach is not applicable to microand nano-scaled testing, especially tests on small-scale systems such as thin films and interface. Therefore in this paper, novel nano-ae monitoring is involved. Nano-AE monitoring relies on the sensor attached directly to local indentation contact by coupling with indenter tip, which yields higher sensitivity to localization and synchronicity. Due to such, it is possible to utilize the technique in measuring physical processes that happens under 1mN. An AE event is detected and recorded as a signal when amplitude of its waveform generated by the sensor is above noise floor (NF) and triggers the recorder (Figure 1.7). The system noise floor is usually measured when there is no desired test being operated with the appliance, and it denotes the components of surroundings only
28 22 without response of sensor. NF is scaled by the unit of sound intensity, db. In our system, NF is calculated by: NF = 60dB + 20 log xμv (1.34) 1.0μV Where, the term 60dB corresponds input that is inevitable. Gain voltage x is detected by the sensor, and varies under different surroundings. AE Associated with Record # Time Index Figure 1.7 A typical AE event detected at trigger level of 69 db. Both the axis is in arbitrary unit (AU). Each AE signal is recorded in the time length of 1μs, at sampling rate of 10MHz. Frequency response is from 100kHz to 2000kHz. Delay time, meaning sum of data points before the trigger one is 50 as default. The noise floor is 69dB. We assumed that during the experiment happens only fracture process, including both cohesive and adhesive fracture. Energy integrated from AE signals relating to delamination should have linear relationship with work of adhesion, and similar calculation is valid in cohesive cracking case. Due to the same system that all signals are detected in one test, coefficient α is a constant for each test. Namely, a relationship is achieved:
29 23 AE AE = δu δu (1.35) Where, δu and δu are of the same definitions in (1.18). Therefore, if all corresponding signals are detected and recognized, fracture energy is possible to be evaluated by combining (1.23) and (1.19): Γ = γw AE A AE + AE Γ = γw (1.36) AE A AE + AE Signals resulting from delamination might has the sound intensity up to 3 or 4 orders lower than that resulting from cohesive cracking, depending on structure components. In our experiment, cohesive cracking signals can be detected up to 2-3 orders higher than the noise floor (Figure 1.8). If we lowered the trigger and keep it above noise floor, no additional signal appears. This leads to a situation that adhesive cracking signals might be detected around the noise floor, and could be submerged by systematic background noises, which result from air flow, transient electronic jump or friction between tip and specimen [34]. Hence it is difficult if one wants to tell the difference of a debonding signal from background noise signals simply by sound intensity characterization. Unlike cohesive signals (Figure 1.7), adhesive signals cannot either differentiate themselves from background noises by the shape of waveforms. Such that pattern recognition work need to be done.

30 24 (a)

31 25 (b)
 in square appear in similar positions of load-displacement curves (red) from same experiment set.")
32 26 (c) Figure 1.8 AE signals characterization at trigger levels of (a) 69dB (b) 70dB and (c) 71dB. Equivalent cohesive signals (green dots) in square appear in similar positions of load-displacement curves (red) from same experiment set. Unlike these cohesive AE signals, other signals including adhesive AE signals and noise do not survive when increasing the trigger level
33 27 CHAPTER 2. METHODOLOGY 2.1 Experimental Setup a. Equipment The nanoindenter used for the experiments is Hysitron TriboIndenter T950 and the controlling interface is TriboScan v9.8. The nanoindenter provides several functions as follow: 1) Indentation and load-displacement curve plotting; 2) In-situ surface scan; 3) Acoustic Emission (AE) montoring; 4) Automatic calculation of modulus and hardness. These functions are all utilized throughout whole experimental procedure. Surface scanning images are read and analyzed with TriboView. b. Setup and Testing Procedure Cube-corner shaped indentation tip combining an AE monitoring transducer is chosen to perform the whole experiment (Figure 2.1). Samples, manufactured respectively by IBM and Intel, are mounted firmly in the machine, and indented 5-16 times under different final loads on the surface. We used open-loop indentation under load-control mode. Loading and unloading rate were fixed (~ 500 µn/s), between which there is a 20-second holding of load, to allow delayed response such as creep and plasticity. Each sample is indented up to a depth equals to specific times of (top) film thickness. According to our previous research (Figure 2.2 [36]), usually the maximum indentation depth for a sample is 1 or 3 times thickness, to avoid excessive yielding zone area from covering delamination area. However for the sample that is thinner than 30 nm,
).")
34 28 the depth can be 3-4 times, due to precision of the machine. Along with the indentation, AE signals were synchronously captured at the noise floor (trigger level) of 69dB. After each indentation, a load-displacement curve along with AE signals is automatically generated (Figure 2.3 (a)). In the meantime, a specific local area (according to size of an indentation) of the sample surface would be scanned both in topology and in gradient, in order to determine cracking behavior under indentation (Figure 2.3 (b)). (a)

 compared to")

35 29 Figure 2.1 (a) SEM Micro-graph of a cube-corner indentation tip. Ideally tip bluntness is less than 100nm. Adapted from [35]. (b)setup of experiments (b) Figure 2.2 FEM result of area of large yielding (grey area) compared to delamination crack (white bar) with respect to indentation depth. It is cleared that if indentation reaches over 3 times of film thickness, one cannot observe delamination from surface. Adapted from [36]
 Nanoindentation")


 Surface scanning")
36 30 (a) (b) Figure 2.3 (a) Nanoindentation load-displacement curve. Each figure features AE signals (green dots) and its real-time position, as well as excursions, as shown inside squares (b) Surface scanning images: topology (left) and gradient (right)

37 31 4 µm c 1 c 3 c 2 4 µm Figure 2.4 Schematic determinations of crack lengths. Cohesive crack length is the mean value of each length of the crack, rooting from corner of impression to the crack tip, namely c =. Adhesive crack length is given by the average value of the measured 3 crack lengths along three directions perpendicular to impression edge. Along each direction, the measured horizontal value a should be from horizontal position of the lowest point, to that of the first point whose altitude is below 1 nm due to resolution of scanning and surface roughness.
38 Measurement of Hardness Only when elastic modulus measured is close to the standard value, hardness that is simultaneously measured is trustable. However, using Oliver-Pharr model, mechanical properties measured of film are influenced greatly by those of its substrate, because main assumption of this model is that indentation depth is ignorable comparing to the whole thickness of sample. Previous researches [19] show that only when h /t 0.1 precise results can be acquired. For most of our samples whose thickness is equal or less than 100nm, direct applying Oliver-Pharr model for modulus and hardness measurement is impossible due to noise floor of the machine (~30nm-50nm). Therefore there are only two ways to get precise measurement. The first one is to find the portion of unloading curve that represents unloading in film (some of fittings). The second, due to default fitting criterion of the machine that is based on percentage of final loads, measurement should be based on a limit of h /t 2, especially if E is much smaller than E (Figure 2.5).

39 33 Figure 2.5 Example of measurement of elastic modulus and hardness by fitting part of the curve. The fitted part should have the depth smaller than film thickness, and the final indentation depth should be smaller than two times the film thickness. The fitted sample is #007, whose Young s modulus is 15.6 GPa, equivalent to reduced modulus of GPa. The measured reduced modulus is GPa.
40 AE Signal Pattern Recognition Cohesive AE signals are always of high sound intensity, and adhesive AE signals have sound intensity as high as that of background noises. Therefore in the real test, it cannot be avoided that to capture AE signals denoting interfacial delamination, a lot of background noises must be as well recorded. AE signals related to cohesive cracks are so easy to find. Either through previous research [16, 33], simultaneous appearance with excursions or huge acoustic energy involved can identify this type of signals at the first stage. This situation leads us a challenge that to separate gold from sand, a characterization method must be developed. Through this method, all signals will be divided into three types: cohesive AE signals, adhesive AE signals and background noises Time-Domain Signal Analysis The AE signal is analyzed first in the time domain to identify the signals related to adhesive, cohesive and background noise. We utilized the skewness of each AE signal to sort the cracks and non-crack signals. According to Scala et al [35], an AE event corresponding to a fracture events is reflected with a skewness; α <0. The signal skewness is defined as: α = m m (2.1) Where,
41 35 = = = () ( ( ) ) (2.2) ( ( ) ) reflects skewness of a signal voltage (v) according to time (t). A typical data set is shown in Figure 2.6 (a) for ULK 2.4 of 500 nm film. All the data below the Zero datum are possible candidate to correlate to fracture events. The second step in the analysis is the time of travel of different types of waves, wherein the shear waver emanating from a delamination is the slowest and the longitudinal wave emanating from a cohesive channel crack is the fastest (Figure 2.6 (b)). We utilized the characteristic time, t, wherein most of the signal energy is received by the AE transducer. t is defined as the first moment of the energy within 3-30 s window, covering the initial signal rise time with respect to time, t = () () () (2.3) Distribution of t for a surviving set of the AE events is shown in Figure 2.6 (c). It is clear that there is a cluster of lower values that should correspond to cohesive crack event, as well as another cluster of higher values that correspond to adhesive crack event. The remaining intermediate time of travel may correspond to the background noise. To identify the cut off level as marked on Figure 2.6 (c) bottom, we utilized the probability
42 36 density distribution (PDD) to identify these cut-off, as shown in Figure 2.6 (c) top. The cutoff is defined as 65% of the characteristic time level that correspond to the peak of the PDD as the left boundary, and 5% above the peak of the PDD as the right. With this second step of the filter we can identify the adhesive, cohesive and the background signals. The third step of the analysis will further identify those signals with high energy level above the mean, and thereby clearing the ambiguity of the low signal to noise ratio. The filter comprised of the total level of energy, E received by the transducer within the rise-time, s window. It is defined by E (t) = (t(i) t(i 1)) v (i) (2.4) The distribution of the energy levels of the surviving events from the second filter step is shown in Figure 2.6 (d) bottom. Constructing the PDD will separate the background noise from the adhesive and cohesive signals, as shown in Figure 2.6 (d) top. We identified the first cut-off level at 10% above the energy level that correspond to the peak of the PDD. The second cutoff energy level commence with the first PDD(0) after the peak and identify the demarcation between adhesive and cohesive signals. The two demarcation lines in Figure 2.6 (d) correspond to these two limits.
")
43 37 (a) (b)

44 38 (c)
 Time-domain signal analysis by characteristic time PDD (top) and result (bottom).")
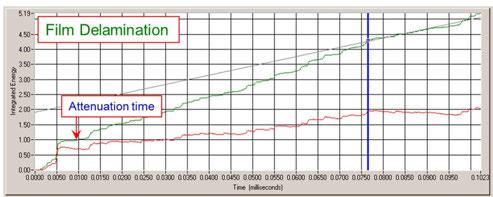
45 39 (d) Figure 2.6 (a) Schematic cutoff by skewness. (b) Attenuation characterization differences of cohesive (top) and adhesive (bottom) AE signals. Adhesive AE signals have significant longer attenuation time. (b) Time-domain signal analysis by characteristic time PDD (top) and result (bottom). Threshold of adhesive signals from cluster is confirmed by 1.1 times the time value of peak probability density. (c) Further classification by signal energy. Similar to (b), PDD (top) and result (bottom) are schemed.
46 40 As the figure indicates, noises and adhesive signals cluster around certain level of energy as well as characteristic time (all signals in (c) are the results from (b)). This situation calls for a further understanding to differentiate one type to another Frequency-Domain Analysis In this section, power spectral density (PSD) will be used for find the nature of frequency structures of the AE signals. Based on PSDs, band pass filters (BPFs) will be constructed to describe signal patterns by making the signals go to and forth each filter. (1) Nature of Noises To understand the main noise resource, intrinsic vibration of the machine, indentation tests on air are done and 272 AE signals generated are collected for frequency-domain analysis. PSD is plotted by calculating averaged squared magnitudes of FFT results of signals (Peter Sherman, personal communication, 2012). PSD = 10 log A (1: 512) (2.5) Where, Aemat = FFT(v ) 1024 A = Aemat cn (2.6) i refers to signal count number, and is scaled by 10-7 s, and cn the total number of the signals. Number 1024 is used because of the sampling rate (10MHz) and time length
47 41 ( ms) of a signal. The PSD is in db, and is symmetric through the whole normalized frequency range. Hence only half of the PSD is picked, and frequency is normalized by original frequency over 10MHz, as plotted in Figure 2.7 (b) Sample Plots of AE Noise Time Index (a) Amplitude Normalized Frequency (b)
48 42 PDF of Relative Ctr. Fs:.015/.03/.05/.07/.09/.11/.13/.15/.17/ Relative amount of power in the given bw (c)
49 43 (d) Figure 2.7 (a) examples of AE noise signals captured during air indentation. (b) PSD (vertical, in db) of AE noise signals with respect to normalized frequency (original frequency over 10 MHz). Calculation based on 272 air indentation AE noise signals. (c) Power distributions with respect to frequency ranges. (d) Signal simulations by frequency range [0, 1.1 MHz] (red) and origin signals (blue). For each signal waveform, horizontal axis is scaled in 10-7 s and vertical in mv. Several peaks are observed throughout the whole frequency range (Figure 2.7 (b)). Frequency ranges higher than ~ 1.1 MHz filter only ignorable portions of wave energies (Figure 2.7 (c)). Simulation of waveforms by band pass filter [0, 1.1 MHz]
50 44 covers most of details of a signal (Figure 3.4 (d)). Therefore, peaks in 0-1.1MHz should be under scrutiny, especially 6 peaks at the frequencies of 390 khz, 520 khz, 650 khz, 780 khz, 910 khz and 1040 khz. It is noticed that both absolute amplitude (~ 65dB) and local amplitude (~ 13dB) of the peak at 390 khz are the highest. In the meantime, frequency band [300 khz, 500kHz] filters highest energy portion of the whole wave (Figure 2.7 (c)). Considering that other resources, such as air flow, contribute limited to noise nature comparing to mechanical intrinsic vibration, it is clear that frequency of 390 khz is the intrinsic frequency of the machine. Therefore, the rest 5 peaks might characterize useful signals, e.g., cohesive and adhesive fracture AE signals. (2) Wave Structure of Cohesive Fracture Signals a. Construction of Band Pass Filter Using time-domain analysis, cohesive signals can be easily identified. Note that the natures of waves caused by cohesive fracture and adhesive fracture are different. Waves generated by cohesive fracture and dispersing are longitudinal waves which have higher characteristic frequency and wave speed, and waves generated by adhesive fracture are shear waves with lower characteristic frequency and wave speed. Theoretically speaking, for a homogeneous, isotropic and condensed material, characteristic frequency ratio between shear wave over longitudinal wave is the square root of the ratio between shear modulus over elastic modulus of the material (G/E). Considering the relationship between the two moduli, the value is actually1/ 2(1 + ν), where ν is the Poisson s ratio. For a silicon compound, this value is around Namely,
51 45 if the characteristic frequency of longitudinal wave is 1 MHz, that of shear wave should around 650 khz. Therefore, to find characteristic frequency of cohesive fracture signals will be a major clue for finding that of adhesive fracture signals. 70 Air Indentation Noise-old ULK2.4 Cohesives 60 Amplitude Normalized Frequency (a)
52 46 PDF of Relative Ctr. Fs:.015/.03/.05/.07/.09/.11/.13/.15/.17/ Relative amount of power in the given bw (b) Figure 2.8 (a) PSD of cohesive fracture signals from tests on sample ULK2.4 (black) and that of noises (red, same as Figure 3.4 (b)). (b) Power distribution with respect to frequency ranges of these cohesive fracture signals.
53 47 The PSD of cohesive fracture signals captured from tests on the sample ULK2.4 is plotted (Figure 2.8 (a)). Though the PSD amplitude of cohesive fracture signals is relatively high comparing to that of noise throughout the whole frequency range, it is still obvious that in the frequency range [900 khz, 1.2 MHz], both PSD amplitude as well as wave structure are extremely unique. Power distribution (Figure 2.8 (b)) also shows apart from machine s intrinsic frequency (390 khz), energy filtered also has a large portion in the ranges [900 khz, 1.1 MHz] and [1.1MHz, 1.3MHz]. These evidences indicate the characteristic frequency should lie in the range [900 khz, 1200 MHz]. (a)
54 48 (b)
55 49
56 50 (c) Figure 2.9 Red lines are filtered waveforms and blue lines are original waveforms. Horizontal axis is time, scaled with 10-7 s and vertical axis is voltage in mv. (a) simulation of waveform of a cohesive fracture signal by frequency range [0, 1.1MHz]. (b) A noise (top) and a cohesive fracture signal (bottom) passing through the band pass filter [800 khz, 1 MHz]. (c) A cohesive fracture signal passing through band filters (from top to bottom): [0, 200 khz], [200 khz, 400 khz], [400 khz, 600 khz], [600 khz, 800 khz] and [800 khz, 1 MHz]. For each signal waveform, horizontal axis is scaled in 10-7 s and vertical in mv. Simulation of cohesive fracture signals given by frequency range [0, 1.1 MHz] covers as well most of the details of cohesive fracture signals (Figure 2.9 (a)). This range is divided evenly into 5 different band pass filters, and cohesive signals are made to pass though these filters (Figure 2.9 (c)). It is observed that when passing through [800 khz, 1 MHz], filtered waveform has a huge envelope at the beginning of the signal, comparing to the result by other filters. On the other hand, this huge envelope is unique to this type of signal no other signal has it (Figure 2.9 (b)). Meanwhile, the filtered waveform shows a quick and hugh attenuation (ratio of integrated energy over first 22.5 µs and over µs). Hence, this filter alone can characterize cohesive signals.
57 51 b. Pattern Recognition Based on Band Pass Filter As plotted in Figure 2.9 (b) and (c), when passing through the filter [800 khz, 1 MHz], a cohesive fracture signal has a big waveform envelop within the window (0, 30 µs), therefore the first filter is constructed based on total level of the energy of filtered wave, E within the window: n 2 E (t) = v i,filtered (t) [t(i) t(i 1)] i=1 (2.7) Where, v (t) is the filtered waveform function with respect to time. We define the threshold as the average energy value plus 3 times the standard deviation of the signals in each single test (Figure 2.10). The second filter is constructed based on the fact that the filtered energy attenuation from the window µs to the following window µs of the cohesive fracture signals is as well far from the average level. We scale this attenuation by a ratio,rco, between energies integrated in such two windows: E (22.5 μs) RCO = E (45 μs) E (22.5 μs) (2.8) The cut-off boundary is defined as average value plus 1.5 times the standard deviation of RCO values of all signals in one single test. Schematic process of these two filters is plotted in Figure 2.10.
58 Cohesive Fracture Signal Domain 1.5 RCO 10 0 Average Average E 30 s (a)
59 Cohesive Fracture Signal Domain 1.5 Average RCO 10 0 Average E 30 s (b) Figure 2.10 Schematic sorting cohesive fracture signals process for (a) ULK2.4 which has both cohesive and adhesive fracture modes and (b) #005 which has only adhesive fracture.
60 54 (3) Wave Structure of Adhesive Fracture Signals. a. Construction of Band Pass Filter Similar to what claimed above in the time-domain analysis part, differences between noise and adhesive fracture AE signals are small. Yet as is addressed above, if characteristic frequency of cohesive fracture signals (which represent longitudinal waves) lies in the range [900 khz, 1.2 MHz], and the characteristic frequency ratio between longitudinal over shear waves is ~0.65, characteristic frequency of adhesive fracture signals (which represent shear waves) should be approximately in the range [600 khz, 700 khz]. There is a frequency peak at ~650 khz in PSD figure, but it is believed that amplitude of this peak does not reflect much information. For some of the samples, for example, Intel sample #317, which only contains noise and adhesive fracture signals, amplitude of this peak is lower than that of air indentation noise, however for other samples, for example, IBM sample 96SJG4 (cohesive fracture signals removed), amplitude of this peak is higher (Figure 2.11 (a)). It is also noticed that at certain range (approximately [600 khz, 640 khz] as shown in squared part of Figure 2.11 (a) bottom), PSD amplitude of signals captured from tests is higher than that of air indentation noise. Though difference is still slight, considering expected adhesive fracture signals only take ~5% of overall signals in quantity, this difference between pure adhesive fracture signals and noises could be huge. The other evidence is from power distribution (Figure 2.101(b)). Energy portion in the range [500 khz, 700 khz] for #317 is slightly higher than that of noise.
61 Air Indentation Noise-old 049-All 96SJG4-All 60 Amplitude Normalized Frequency Air Indentation Noise-old 317-all 96SJG4-All 60 Amplitude Normalized Frequency (a)
62 56 PDF of Relative Ctr. Fs:.015/.03/.05/.07/.09/.11/.13/.15/.17/ Relative amount of power in the given bw (b)

")


63 57 1/3 1/3 ~6 µs ~6 µs ~6 µs (c)

64 58 (d)
65 59 (e) Figure 2.11 (a) PSDs (top) and amplified at squared range of PSDs (bottom) of air indentation noises, Intel sample #317 and IBM sample 96SJG4. (b) Power distributions of Intel sample #317, which only contains noise and adhesive fracture signals. Comparing to Figure 2.8 (c), circled value is slightly higher. (c) A cohesive fracture signal (from sample ULK2.4, 1099th) passing though the filter [800 khz, 1 MHz] (top) and partial amplified waveform (bottom). Wave length and attenuation rate is measured. (d) A proposed adhesive fracture signal (from sample #005, 1190th) filtered by [600 khz, 700 khz], containing large pristine envelope, one significant reflection and another reflection submerged by noise (squared). (e) A filtered noise fitting description of pattern. For each signal waveform, horizontal axis is scaled in 10-7 s and vertical in mv. As is confirmed above, characteristic frequency of adhesive fracture signals lies in the frequency range [600 khz, 700 khz]. For cohesive fracture signals, wave length is ~12 µs. Therefore, characteristic wave length of adhesive fracture signals should be longer. It can also be observed that in filtered cohesive fracture signals, there is a large pristine envelope at the beginning of signal, followed by two envelopes that are smaller in amplitude but same in wave length. Between each two envelopes, amplitude drop is ~ 1/3 (Figure 3.7 (c)). The nature of this pattern is that, pristine envelope represents the appearance of the mechanical process, and the following two are nothing but the
66 60 reflections (echo, resonance) of the wave generated by the process, and for each time it reflects, attenuation rate is = 2.25 (could be higher). Therefore, filtered adhesive fracture signals should also have similar wave pattern, where, large pristine envelope has a longer wave length (~20-24 µs) and 1 or 2 reflection envelope(s) follows (Figure 2.11 (d)). The reason for uncertain amount of reflections is that energy of pristine envelope is relatively small, and after 2 times of attenuation, the last reflection is easily to be submerged by noises. It is assumed that the noise patterns are totally random; hence it is not avoidable to have a filtered noise pattern fitting this description (Figure 2.11 (e)). After scrutiny, only 5 out of 274 signals fit the description of this pattern, thus the error floor is ~1.8%. b. Pattern Recognition Based on Band Pass Filter To recognize designated pattern shown in Figure 2.11 (d), similarly to recognition of cohesive fracture signals, when passing through band pass filter [600 khz, 700 khz], integrated energy defined in (2.7) within the window 0-20 µs should be significantly larger than the level of air indentation noise. The average energy in this window for noises is (AU). Hence the first threshold for this energy is set to be 0.14 (AU). To avoid recognizing a waveform pattern shown in Figure 2.12 (a), the second cut-off is set as 0.07 (AU) for integrated energy within the window 0-10 µs. In the meantime, to avoid a flat envelope pattern, shown in Figure 2.12 (b), the maximum
67 61 filtered waveform function value with in the window 0-12 µs should be sufficiently large, and 150 (mv) is selected to be the cut off. As shown in Figure 2.11 (d), within the windows where contain envelopes, 0-20 µs, µs and µs, the waveform should be wavy and no flat envelope as plotted in Figure 2.12 (c). Dispersion coefficients of absolute value of waveform function within these three windows, S, S and S are defined in (2.9). To ensure enough waviness, cutoff boundary of each coefficient is set to be 52%. S = Stdev. v (0: 20μs) Avg. v (0: 20μs) S = Stdev. ( v (20: 40μs) ) Avg. ( v (20: 40μs) ) S = Stdev. v (40: 60μs) Avg. v (60: 80μs) (2.9) The following filter is constructed based on energy attenuation ratios between integrated energies within neighboring windows, R, and R,, which are defined in (2.10): E (20 μs) R, = E (40 μs) E (20 μs) R, = E (40 μs) E (20 μs) E (60 μs) E (40 μs) (2.10) Prospective waveform should have the attenuation ratio values in the range [2, 4.5] as discussed above. However, considering two conditions:
68 62 (i) If attenuation from the first window to the second window is large, e.g., 4.5 R, 2, the third energy envelope in the window µs could not be identified from white noise floor if the second-time attenuation ratio, R,, is large. Therefore we choose [1.5, 4.5] as the confidence limit of R,. (ii) If attenuation from the first window to the second window is small, e.g., 2 > R, 1.5,, for a prospective waveform, the second-time attenuation ratio should be greater than the value of R,. Hence confidence limit of R, in this case is set to be [R,, 4.5].


69 63 (a)


70 64 (b)
 Energy in first window is large overall but small within")
 A flat envelope that contains large energy in the first")
 Flat envelopes throughout the windows but attenuate from")
71 65 (c) Figure 2.12 Some eliminated signal examples. (a) Energy in first window is large overall but small within the first 10 µs. (b) A flat envelope that contains large energy in the first window. (c) Flat envelopes throughout the windows but attenuate from one window to another. For each signal waveform, horizontal axis is scaled in 10-7 s and vertical in mv.
72 66 After passing these filters, examples of resulting signals are shown in Figure 2.13 (a). All the limits and thresholds are estimated by statistical analysis on both tests on samples and air indentation tests. (a)
73 67 60 Amplitude 50 Air Indentation Adhesives Normailized Frequency (b) Figure 2.13 (a) Example of sorted adhesive fracture signals from (from top to bottom) #005, ULK2.4. (b) Frequency structures of adhesive fracture signals and air indentation. Comparing to Figure 2.11 (a), squared zone shows more significant difference. For each signal waveform, horizontal axis is scaled in 10-7 s and vertical in mv.
74 Energy of a Signal When successfully getting cohesive and adhesive AE signals, delamination acoustic energy AE and cohesive cracking acoustic energy AE are then expressed in (2.11): E, = E (7.5 μs) E (2.5 μs) for cohesive signals E, = E (10 μs) E (2.5 μs) for adhesive signals AE = E, AE = E, (2.1) Effective integrated acoustic energy of a signal Figure 2.14 Scheme of calculating acoustic energy of a signal. Vertical axis is in arbitrary unit and horizontal axis is in 0.1µs. The reason for different ranges chosen for cohesive (2.5µs ~ 7.5µs) and for adhesive (2.5µs ~ 10µs) fracture signals is due to different attenuation behaviors of the two types. Figure 2.14 shows a typical cohesive fracture signal that attenuates at ~ 7.5µs. Time segment window length is around 5µs. Considering ratio of 0.65, the window
75 69 length for adhesive fracture signal should be ~7.5µs, and the total attenuation time should be ~1µs Role of Trigger Level The analysis is constructed based on one simple fact, that the adhesive signals are not definitely discriminated from background noises at the time range that triggers the acoustic emission sensor. Hence it must be applied when a lower trigger level is set (for our case, use 69 db as trigger level instead of 70 db that is automatically chosen by the machine) to enclose more signals, most of which are noises but the useful signals are also included. To demonstrate this fact, we have done sets of experiments. In each set, the only difference from one experiment to another is the trigger level selected. On the IBM sample ULK 2.4, we tested using final load of 4 mn, and the trigger levels were set 69 db, 70 db and 71 db respectively (Figure 1.8). The analysis result shows that only in test at 69 db we can find useful adhesive signals. No signal of this type is found when trigger level increases (Table 2.1). On IBM sample 96SJG4, we did 3 tests under the final load of 3 mn, two of which were at 70 db trigger level and the rest was at 69 db (Figure 2.15). The analysis result is consistent to what we have on ULK 2.4 sample, that only from the test at lower trigger level we can find useful signals (Table 2.2). Test Number of all events Number of adhesive signals Number of cohesive signals ULK db db db Table 2.1 Result of AE analysis of tests on ULK 2.4 at different trigger lavels


76 70

77 71 Figure 2.15 Tests on IBM sample 96SJG4 with final load of 3 mn. From top to bottom, trigger levels are set: 71dB, 70dB and 69 db. There are 3, 8 and 150 events detected in tests. Number of all events Number of adhesive signals Number of cohesive signals Test db db db Table 2.2 Results of AE analysis of tests on 96SJG4 at trigger levels of 70dB and 69 db.
78 72 CHAPTER 3. RESULT AND DISCUSSION BY GROUPS The samples are sorted by elastic mismatch between top layer and under layer (E /E ). For each sample, mechanical properties, fracture energies (based on analytical models, if possible) are found. Acoustic Emission signals detected are captured and sorted. Based on signal sorting results, fracture modes are identified, fracture energies are also estimated. 3.1 Hard Substrate: σ Y f /σ Y s < 1 for All E f /E s Ratios There are 4 samples (Intel samples #005, #302, #317 and #772 tested in this group. Overall information is listed in Table Intel Sample #005 Intel sample #005 has a single SiC:H (50%C 50%Si) layer of 100 nm thickness on the substrate of silicon. Young s modulus of the film is 11.5 GPa with residual stress of 60 MPa. There are 9 tests on Intel sample #005. All tests show evidence that only adhesive fracture appears. There is no excursion observed on the load-displacement curves AE events are captured in these 9 tests.
79 Sample # Film / Substrate t (nm) σ (GPa) σ (GPa) E (GPa) E (GPa) σ σ E Γ ( J m ) Γ ( J m ) E Exp model DCB Exp model DCB #005 SiC:H/ Si ± ±0.81* #302 SiC:H /Si ± #317 Porous SiOC:H / Si ± #772 Porous SiCx:H / Si ± ±0.12* 0.37±0.13** 0.11±0.03* 0.15±0.06** Table 3.1 Profiles and test results of samples in group 1. The Exp columns in fracture energies category are based on acoustic emission measurements of tests. The model columns in fracture energies category are based on analytical models. The DCB results are provided by Intel Corporation. Error bars are one time standard deviation from the average. *: Fracture energy value is estimated by (1.17) Marshall-Evan s model. **: Fracture energy value is estimated by (1.26) insertion model. 73
 A typical load-displacement curve")


80 74 (a) 1 µm 1 µm (b) Figure 3.1 (a) A typical load-displacement curve of test on Intel sample #005 and (b) corresponding AFM scanning topological (left) and gradient (right) images. AFM images show only delamination happens during indentation.
81 75 Tes Number of all Number of Number of t events adhesive signals cohesive signals AE a AE c Table 3.2 Results of signal sorting based on tests on #005. No cohesive fracture signal detected. Only adhesive fracture signals detected Intel Sample #302 Intel sample #302 has a single Porous SiOC:H (29% Si, 18% C, 53% O) layer of 30 nm thickness on the substrate of silicon. Young s modulus of the film is 5 GPa with residual stress of 60 MPa. There are 6 tests on Intel sample #302. From in-situ AFM scanning images, neither of the fracture modes is observed. Black round hole whose shape is different from that of tip indicates plasticity happens during indentation. However, by AE analysis, interfacial fracture is detected. There is no excursion observed on the load-displacement curves. Overall 330 AE events are detected during tests.
 A typical load-displacement curve of")


82 76 (a) 1 µm 1 µm (b) Figure 3.2 (a) A typical load-displacement curve of test on Intel sample #302 and (b) corresponding in-situ AFM scanning topological (right) and gradient (left) images. The images show evidence of plasticity, and inability to measure any kind of fracture.
83 77 Test Number of Number of Number of all events adhesive signals cohesive signals AE a AE c Table 3.3 Results of signal sorting based on tests on #302. Even though adhesive fracture cannot be observed directly from the figure, portions that adhesive signals take are higher than noise error (1.8%, test #3 and #6). This can be considered the evidence of delamination Intel Sample #317 Intel sample #317 has a single Porous SiOC:H (29% Si, 18% C, 53% O) layer of 100 nm thickness on the substrate of silicon. Young s modulus of the film is 5 GPa with residual stress of 60 MPa. There are 13 tests on Intel sample #317. All tests show evidence that only adhesive fracture appears. There is no excursion observed on the load-displacement curves. In fact, materials of #317 and #302 are identical, the difference is in thickness. Similar to #017, significant slope change makes this sample available for application of (1.26). Overall 1727 AE events are capture during tests.
 A typical load-displacement curve")


84 78 (a) 1 µm 1 µm (b) Figure 3.3 (a) A typical load-displacement curve of test on Intel sample #317 and (b) corresponding AFM scanning topological (left) and gradient (right) images. AFM images show only delamination happens during indentation.
85 79 Test Number of all Number of Number of events adhesive signals cohesive signals AE a AE c Table 3.4 Results of signal sorting based on tests on #317. No cohesive fracture signal detected. Only adhesive fracture signal detected Intel Sample #772 Intel sample #772 has a single Porous SiCx:H (80%C 20%Si, cured) layer of 50 nm thickness on the substrate of silicon. Young s modulus of the film is 5 GPa with residual stress of 50 MPa. There are 18 tests on Intel sample #772. All tests show evidence that only adhesive fracture appears. There is no excursion observed on the load-displacement curves. Similar to #017, significant slope change makes this sample available for application of (2.26). The in-situ AFM images also indicate evidence of plasticity Events are captured during tests.
 A typical load-displacement curve")


86 80 (a) 1 µm 1 µm (b) Figure 3.4 (a) A typical load-displacement curve of test on Intel sample #772 and (b) corresponding AFM scanning topological (left) and gradient (right) images. AFM images show only delamination happens during indentation.
87 81 Test Number of all events Number of adhesive signals Number of cohesive signals Table 3.5 Results of signal sorting based on tests on #772. No cohesive fracture signal detected. Only adhesive fracture signal detected. AE a AE c
88 Sample # Film /Substrate t (nm) σ (GPa) σ (GPa) E (GPa) E (GPa) σ σ E J Γ ( m ) Γ ( J m ) E Exp model DCB Exp model DCB #008 SiCN /SiCO:H ± ±0.26* 3.89± #017 SiC:H /Si ± ±0.42* 6.42±1.07** #049 SiC:H /Si ± ±2.54* #096 SiC:H /SiC:H ± ± #227 #811 #829 SiCN:H ES / Low-K SiCx:H SiCN:H ES / Low-K SiCx:H SiCN:H ES / Low-K SiCx:H ± ± ± ± ± SJG4 SiCxNy/Si ± ± ±0.56* ±38.2 ULK2.4 4-Layer of Low- K ± ± ±0.29* ± ± Table 3.6 Profiles and test results of samples in group 2. The Exp columns in fracture energies category are based on acoustic emission measurements of tests. The model columns in fracture energies category are based on analytical models.the DCB results are provided by Intel Corporation. Error bars are one time standard deviation from the average. *: Fracture energy value is estimated by (1.17) Marshall-Evan s model. **: Fracture energy value is estimated by (1.26) insertion model.
89 Soft or Comparable Substrate: σ Y f /σ Y s 1 for All E f /E s Ratios There are 9 samples (Intel samples #008, #049, #096, #227, #811, #829 and IBM samples ULK2.4, 96SJG4) tested in this group. Overall information is listed in Table Intel Sample #008 Intel sample #008 has a SiCN layer of 25 nm thickness on SiCO:H under layer of 500 nm thickness. Young s moduli of the film is 120 GPa and of the under layer is 9 GPa with high residual stress (unknown number) in the film. There are 9 tests on Intel sample #008. From in-situ AFM scanning images, neither of the fracture modes is observed. Black round hole whose shape is different from that of tip indicates plasticity happens during indentation. However, by AE analysis, interfacial fracture is detected. Excursions sometimes can be observed on the curves, however further evidence (AE analysis) indicates they are related to plasticity rather than fracture. Overall 1106 events are captured during tests.
 A typical load-displacement curve of")


90 84 (a) 1 µm 1 µm (b) Figure 3.5 (a) A typical load-displacement curve of test on Intel sample #008 and (b) corresponding in-situ AFM scanning topological (right) and gradient (left) images. The images show evidence of plasticity, and inability to measure any kind of fracture.
 Another typical load-displacement curve of test on Intel")
 and gradient (left) images.")

91 85 (a) 2.5 µm 2.5 µm (b) Figure 3.6 (a) Another typical load-displacement curve of test on Intel sample #008 and (b) corresponding in-situ AFM scanning topological (right) and gradient (left) images. The images potential possibility of delamination and it is believed to appear on the interface between under layer and substrate. Excursion related to plasticity can be observed.
92 86 Test Number of all events Number of adhesive signals Number of cohesive signals Table 3.7 Results of signal sorting based on tests on #008. Even though adhesive fracture cannot be observed directly from the figures, portions that adhesive signals take are higher than noise error (1.8%, all except the last two tests). This can be considered the evidence of delamination. No cohesive fracture signal is observed. AE a AE c Intel Sample #017 Intel sample #017 has a SiC:H (50%C 50%Si) layer of 100 nm thickness substrate of silicon. Young s modulus of the film is 99 GPa with residual stress of 64MPa (compressive) in the film. There are 9 tests on Intel sample #017. All tests show evidence that adhesive fracture appears. When indenting on the sample it breaks. However, delamination is still able to be estimated by measuring bared substrate. Significant slope change makes this sample available for application of (1.26). Note that if 1/3 of local part of film breaks responsive force from the film is 2/3 of the force applied on it by the tip during loading, while indentation depth hardly changes. Therefore the work in Figure 1.5 for #017 is 2/3 of the expected value. Overall 1008 AE events are captured during tests.


93 87 (a) 1.3 µm 1.3 µm (b)
 A typical load-displacement curve of test on Intel sample #017 and (b) corresponding in-situ AFM scanning")
94 88 (c) Figure 3.7 (a) A typical load-displacement curve of test on Intel sample #017 and (b) corresponding in-situ AFM scanning topological (left) and gradient (right) images. (c) Schematic determination of delamination area.
95 89 Test Number of all Number of Number of events adhesive signals cohesive signals AE a AE c Table 3.8 Results of signal sorting based on tests on #017. The cohesive signals represents breaking of the sample, and due to inability of measure surface cracking, these results cannot be used to estimate fracture energies Intel Sample #049 Intel sample #049 has a SiC:H (50%C 50%Si) layer of 100 nm thickness on substrate of silicon. Young s modulus of the film is 175 GPa with residual stress (unknown number) of 1031 MPa (compressive) in the film. There are 9 tests on Intel sample #049. All tests show evidence that only adhesive fracture appears. There is no excursion observed on the load-displacement curves. Overall 1082 events are captured during the tests.
 A typical load-displacement curve of")


96 90 (a) 1 µm 1 µm (b) Figure 3.8 (a) A typical load-displacement curve of test on Intel sample #008 and (b) corresponding in-situ AFM scanning topological (left) and gradient (right) images. Only adhesive fracture is observed. There is no excursion on the load-displacement curve.
97 91 Test Number of all events Number of adhesive signals Number of cohesive signals Table 3.9 Results of signal sorting based on tests on #049. No cohesive fracture signal detected. Only adhesive fracture signal detected. AE a AE c Intel Sample #096 Intel sample #096 has a SiC:H (90% C, 10% Si) layer of 100 nm thickness on SiC:H (50% C, 50% Si) under layer of 1000 nm thickness. Young s moduli of the film is 200 GPa and of the under layer is 350 GPa with residual stress of 1000 MPa (compress) in the film. There are 3 tests on Intel sample #096. From in-situ AFM scanning images, neither of the fracture modes is observed. Black round hole whose shape is different from that of tip indicates plasticity happens during indentation. However, by AE analysis, interfacial fracture is detected. Excursions related to plasticity can be observed sometimes. Overall 450 events are captured during tests.
 A typical load-displacement curve of test on Intel sample #096")
 images.")
98 92 (a) 1 µm 1 µm Figure 3.9 (a) A typical load-displacement curve of test on Intel sample #096 and (b) corresponding in-situ AFM scanning topological (right) and gradient (left) images. The images show evidence of plasticity, and inability to measure any kind of fracture. (b)
99 93 Test Number of all events Number of adhesive signals Number of cohesive signals Table 3.10 Results of signal sorting based on tests on #008. Even though adhesive fracture cannot be observed directly from the figures, portions that adhesive signals take are higher than noise error (1.8%). This can be considered the evidence of delamination. No cohesive fracture signal is observed. AE a AE c Intel Sample #227 Intel sample #227 has a SiCN:H ES layer of 100 nm thickness on low-k SiCx:H under layer of 2000 nm thickness. Young s moduli of the film is 130 GPa and of the under layer is 6.4 GPa with residual stress of 350 MPa (compress) in the film. There are 10 tests on Intel sample #227. From in-situ AFM scanning images, neither of the fracture modes is observed. Black round hole whose shape is different from that of tip indicates plasticity happens during indentation. However, by AE analysis, interfacial fracture is detected. Excursions related to plasticity can be observed on load-displacement curves. Overall 1500 AE events are captured during tests.
 A typical load-displacement curve of test on Intel")
 and gradient (right) images.")

100 94 (a) 1 µm 1 µm (b) Figure 3.10 (a) A typical load-displacement curve of test on Intel sample #227 and (b) corresponding in-situ AFM scanning topological (left) and gradient (right) images. The images show evidence of plasticity, and inability to measure any kind of fracture. Excursions related to plastic deformation of under layer can be observed on curves.
101 95 Test Number of all events Number of adhesive signals Number of cohesive signals Table 3.11 Results of signal sorting based on tests on #227. Even though adhesive fracture cannot be observed directly from the figures, portions that adhesive signals take are higher than noise error (1.8%, all except tests #3, #4 and #6). This can be considered the evidence of delamination. No cohesive fracture signal is observed. AE a AE c Intel Sample #811 Intel sample #811 has a SiCN:H ES layer of 25 nm thickness on low-k SiCx:H under layer of 2000 nm thickness. Young s moduli of the film is 130 GPa and of the under layer is 6.4 GPa with residual stress of 350 MPa (compressive) in the film. There are 16 tests on Intel sample #811. From in-situ AFM scanning images, neither of the fracture modes is observed. Black round hole whose shape is different from that of tip indicates plasticity happens during indentation. However, by AE analysis, interfacial fracture is detected. Excursions related to plasticity can be observed on loaddisplacement curves. Overall 1941 AE events are captured during tests.
 A typical load-displacement curve of")


102 96 (a) 0.5 µm 0.5 µm (b) Figure 3.11 (a) A typical load-displacement curve of test on Intel sample #811 and (b) corresponding in-situ AFM scanning topological (left) and gradient (right) images. The images show evidence of plasticity, and inability to measure any kind of fracture.
103 97 Test Number of all events Number of adhesive signals Number of cohesive signals Table 3.12 Results of signal sorting based on tests on #811. Even though adhesive fracture cannot be observed directly from the figures, portions that adhesive signals take are higher than noise error (1.8%, all except the first test). This can be considered the evidence of delamination. No cohesive fracture signal is observed. AE a AE c Intel Sample #829 Intel sample #829 has a SiCN:H ES layer of 10 nm thickness on low-k SiCx:H under layer of 2000 nm thickness. Young s moduli of the film is 130 GPa and of the under layer is 6.4 GPa with residual stress of 350 MPa (compressive) in the film. There are 6 tests on Intel sample #829. From in-situ AFM scanning images, neither of the fracture modes is observed. Black round hole whose shape is different from that of tip indicates plasticity happens during indentation. However, by AE analysis, interfacial

 Figure 3.")
 corresponding in-situ AFM scanning topological (left) and")
104 98 fracture is detected. Excursions related to plasticity can be observed on loaddisplacement curves. Overall 401 AE events are captured during tests. (a) 0.5 µm 0.5 µm (b) Figure 3.12 (a) A typical load-displacement curve of test on Intel sample #829 and (b) corresponding in-situ AFM scanning topological (left) and gradient (right) images. The images show evidence of plasticity, and inability to measure any kind of fracture.
105 99 Test Number of all events Number of adhesive signals Number of cohesive signals Table 3.13 Results of signal sorting based on tests on #829. Even though adhesive fracture cannot be observed directly from the figures, portions that adhesive signals take are higher than noise error (1.8%). This can be considered the evidence of delamination. No cohesive fracture signal is observed. AE a AE c IBM Sample ULK 2.4 IBM sample ULK 2.4 has four 500 nm thick layers of Low-K materials (unknown) on the substrate of silicon. Young s modulus of the film is 6 GPa with unknown residual stress. There are 9 tests on IBM sample ULK 2.4. In the initial two tests only adhesive fracture observed, while the 7 tests show evidence that both cohesive and adhesive fracture happening when indenting on this sample. Excursions are observed on the curve, coincident with appearance of cohesive fracture. First excursion comes at around indentation depth of 500 nm. Overall 1227 signals are captured during tests.
 A typical load-displacement curve of test on IBM")
 corresponding AFM scanning topological (left) and")

106 100 (a) 3 µm 3 µm (b) Figure 3.13 (a) A typical load-displacement curve of test on IBM sample ULK 2.4 and (b) corresponding AFM scanning topological (left) and gradient (right) images. There are several excursions appearing on the curve, beginning at about indentation depth of 500 nm. Coincidently, cohesive fracture appears as well as adhesive fracture.
107 101 Γ a : Measured vs. Analytical model y = x 1 Measured Γ a ()J/m For γ = Measured Γ a (J/m 2 ) Figure 3.14 Measured Γ = γ vs. analytical model values.
108 Test Number of all events Number of adhesive signals Number of cohesive signals AE a AE c W ex Γ a measured model measured model #DIV/0! average Γ c 102 Table 3.14 Results of signal sorting based on tests on ULK2.4. Both cohesive and adhesive signals are captured for all tests but the 8 th test.

109 IBM Wafer 96SJG4 IBM sample 96SJG4 has a SiCxNy layer of 45 nm thickness on the substrate of silicon. Young s modulus of the film is 85.3 GPa with residual stress 0f 430 MPa. There are ## tests on IBM sample 96SJG4. All tests show evidence that both cohesive and adhesive fracture happening when indenting on this sample. Excursions are observed on the curves, coincident with appearance of cohesive fracture. First excursion comes at around indentation depth of nm. Overall 531 AE events are captured during tests. (a)
 A typical load-displacement curve of test on IBM sample 96SJG4 and (b) corresponding AFM scanning topological (left) and gradient")
J/m 2 5 4.5 4 3.5 3 2.")
110 104 1 µm 1 µm (b) Figure 3.15 (a) A typical load-displacement curve of test on IBM sample 96SJG4 and (b) corresponding AFM scanning topological (left) and gradient (right) images. There are several excursions appearing on the curve, beginning at about indentation depth of 160 nm. Coincidently, cohesive fracture appears as well as adhesive fracture. Γ a : Measured vs. Analytical model Measured Γ a ()J/m y = x For γ = Measured Γ a (J/m 2 ) Figure 3.16 Measured Γ = γ vs. analytical model values.
Measurement of ultra-thin film fracture by nanoindentation:
 Graduate Theses and Dissertations Iowa State University Capstones, Theses and Dissertations 2011 Measurement of ultra-thin film fracture by nanoindentation: a numerical study Benjamin A. Burke Iowa State
Determining the Elastic Modulus and Hardness of an Ultrathin Film on a Substrate Using Nanoindentation
 Determining the Elastic Modulus and Hardness of an Ultrathin Film on a Substrate Using Nanoindentation The Harvard community has made this article openly available. Please share how this access benefits
Nonlinear Finite Element Modeling of Nano- Indentation Group Members: Shuaifang Zhang, Kangning Su. ME 563: Nonlinear Finite Element Analysis.
 ME 563: Nonlinear Finite Element Analysis Spring 2016 Nonlinear Finite Element Modeling of Nano- Indentation Group Members: Shuaifang Zhang, Kangning Su Department of Mechanical and Nuclear Engineering,
Effects of TGO Roughness on Indentation Response of Thermal Barrier Coatings
 Copyright 2010 Tech Science Press CMC, vol.17, no.1, pp.41-57, 2010 Effects of Roughness on Indentation Response of Thermal Barrier Coatings Taotao Hu 1 and Shengping Shen 1,2 Abstract: In this paper,
Fig. 1. Different locus of failure and crack trajectories observed in mode I testing of adhesively bonded double cantilever beam (DCB) specimens.
 specimens.") a). Cohesive Failure b). Interfacial Failure c). Oscillatory Failure d). Alternating Failure Fig. 1. Different locus of failure and crack trajectories observed in mode I testing of adhesively bonded double
a). Cohesive Failure b). Interfacial Failure c). Oscillatory Failure d). Alternating Failure Fig. 1. Different locus of failure and crack trajectories observed in mode I testing of adhesively bonded double
Supplementary Figures
 Fracture Strength (GPa) Supplementary Figures a b 10 R=0.88 mm 1 0.1 Gordon et al Zhu et al Tang et al im et al 5 7 6 4 This work 5 50 500 Si Nanowire Diameter (nm) Supplementary Figure 1: (a) TEM image
The Effects of Transverse Shear on the Delamination of Edge-Notch Flexure and 3-Point Bend Geometries
 The Effects of Transverse Shear on the Delamination of Edge-Notch Flexure and 3-Point Bend Geometries M. D. Thouless Department of Mechanical Engineering Department of Materials Science & Engineering University
Determining thermal noise limiting properties of thin films
 Determining thermal noise limiting properties of thin films Courtney Linn Institute for Gravitational Research University of Glasgow Summer 2011 Abstract In order to make thermally stable mirrors to be
Nanoindentation of Fibrous Composite Microstructures: Experimentation and Finite Element Investigation. Mark Hardiman
 Nanoindentation of Fibrous Composite Microstructures: Experimentation and Finite Element Investigation Mark Hardiman Materials and Surface Science Institute (MSSI), Department of Mechanical and Aeronautical
Application of nanoindentation technique to extract properties of thin films through experimental and numerical analysis
 Materials Science-Poland, Vol. 28, No. 3, 2010 Application of nanoindentation technique to extract properties of thin films through experimental and numerical analysis A. WYMYSŁOWSKI 1*, Ł. DOWHAŃ 1, O.
CONSIDERATIONS ON NANOHARDNESS MEASUREMENT
 CONSIDERATIONS ON NANOHARDNESS MEASUREMENT Z. Rymuza 1, M. Misiak 1 and J.T. Wyrobek 2 1 Institute of Micromechanics and Photonics, Department of Mechatronics Warsaw University of Technology, Chodkiewicza
Mechanical Properties of Materials
 Mechanical Properties of Materials Strains Material Model Stresses Learning objectives Understand the qualitative and quantitative description of mechanical properties of materials. Learn the logic of
INTERNATIONAL JOURNAL OF CIVIL AND STRUCTURAL ENGINEERING Volume 4, No 1, 2013
 INTERNATIONAL JOURNAL OF CIVIL AND STRUCTURAL ENGINEERING Volume 4, No 1, 2013 Copyright by the authors - Licensee IPA- Under Creative Commons license 3.0 Research article ISSN 0976 4399 Nanoindentation
ME 243. Mechanics of Solids
 ME 243 Mechanics of Solids Lecture 2: Stress and Strain Ahmad Shahedi Shakil Lecturer, Dept. of Mechanical Engg, BUET E-mail: sshakil@me.buet.ac.bd, shakil6791@gmail.com Website: teacher.buet.ac.bd/sshakil
Outline. Tensile-Test Specimen and Machine. Stress-Strain Curve. Review of Mechanical Properties. Mechanical Behaviour
 Tensile-Test Specimen and Machine Review of Mechanical Properties Outline Tensile test True stress - true strain (flow curve) mechanical properties: - Resilience - Ductility - Toughness - Hardness A standard
3.032 Problem Set 2 Solutions Fall 2007 Due: Start of Lecture,
 3.032 Problem Set 2 Solutions Fall 2007 Due: Start of Lecture, 09.21.07 1. In the beam considered in PS1, steel beams carried the distributed weight of the rooms above. To reduce stress on the beam, it
IMPROVED METHOD TO DETERMINE THE HARDNESS AND ELASTIC MODULI USING NANO-INDENTATION
 KMITL Sci. J. Vol. 5 No. Jan-Jun 005 IMPROVED METHOD TO DETERMINE THE HARDNESS AND ELASTIC MODULI USING NANO-INDENTATION Nurot Panich*, Sun Yong School of Materials Engineering, Nanyang Technological University,
FATIGUE DAMAGE PROGRESSION IN PLASTICS DURING CYCLIC BALL INDENTATION
 FATIGUE DAMAGE PROGRESSION IN PLASTICS DURING CYCLIC BALL INDENTATION AKIO YONEZU, TAKAYASU HIRAKAWA, TAKESHI OGAWA and MIKIO TAKEMOTO Department of Mechanical Engineering, College of Science and Engineering,
Chapter 7. Highlights:
 Chapter 7 Highlights: 1. Understand the basic concepts of engineering stress and strain, yield strength, tensile strength, Young's(elastic) modulus, ductility, toughness, resilience, true stress and true
Advanced Strength of Materials Prof S. K. Maiti Mechanical Engineering Indian Institute of Technology, Bombay. Lecture 27
 Advanced Strength of Materials Prof S. K. Maiti Mechanical Engineering Indian Institute of Technology, Bombay Lecture 27 Last time we considered Griffith theory of brittle fracture, where in it was considered
1 INTRODUCTION 2 SAMPLE PREPARATIONS
 Chikage NORITAKE This study seeks to analyze the reliability of three-dimensional (3D) chip stacked packages under cyclic thermal loading. The critical areas of 3D chip stacked packages are defined using
INFLUENCE OF TEMPERATURE ON BEHAVIOR OF THE INTERFACIAL CRACK BETWEEN THE TWO LAYERS
 Djoković, J. M., et.al.: Influence of Temperature on Behavior of the Interfacial THERMAL SCIENCE: Year 010, Vol. 14, Suppl., pp. S59-S68 S59 INFLUENCE OF TEMPERATURE ON BEHAVIOR OF THE INTERFACIAL CRACK
Computational Analysis for Composites
 Computational Analysis for Composites Professor Johann Sienz and Dr. Tony Murmu Swansea University July, 011 The topics covered include: OUTLINE Overview of composites and their applications Micromechanics
Frontiers of Fracture Mechanics. Adhesion and Interfacial Fracture Contact Damage
 Frontiers of Fracture Mechanics Adhesion and Interfacial Fracture Contact Damage Biology, Medicine & Dentistry The Next Frontiers For Mechanics One of the current challenges in materials & mechanics is
Instrumented Indentation Testing
 Instrumented Indentation Testing J.L. Hay, MTS Systems Corporation G.M. Pharr, The University of Tennessee and Oak Ridge National Laboratory INSTRUMENTED INDENTATION TESTING (IIT), also known as depth-sensing
AE Source Orientation by Plate Wave Analysis * Michael R. Gorman Aeronautics and Astronautics Naval Postgraduate School Monterey, CA 93943
 AE Source Orientation by Plate Wave Analysis * Michael R. Gorman Aeronautics and Astronautics Naval Postgraduate School Monterey, CA 93943 William H. Prosser NASA Langley Research Center Hampton, VA 23665
ME 2570 MECHANICS OF MATERIALS
 ME 2570 MECHANICS OF MATERIALS Chapter III. Mechanical Properties of Materials 1 Tension and Compression Test The strength of a material depends on its ability to sustain a load without undue deformation
Performance and Control of the Agilent Nano Indenter DCM
 Performance and Control of the Agilent Nano Indenter DCM Application Note Introduction With new materials and material applications come new test challenges. As these new challenges emerge in materials
MECHANICAL PROPERTIES OF HYDROGEL USING NANOINDENTATION
 MECHANICAL PROPERTIES OF HYDROGEL USING NANOINDENTATION Prepared by Duanjie Li, PhD & Jorge Ramirez 6 Morgan, Ste156, Irvine CA 9618 P: 949.461.99 F: 949.461.93 nanovea.com Today's standard for tomorrow's
Characterisation Programme Polymer Multi-scale Properties Industrial Advisory Group 22 nd April 2008
 Characterisation Programme 6-9 Polymer Multi-scale Properties Industrial Advisory Group nd April 8 SE: Improved Design and Manufacture of Polymeric Coatings Through the Provision of Dynamic Nano-indentation
Basic Laboratory. Materials Science and Engineering. Atomic Force Microscopy (AFM)
") Basic Laboratory Materials Science and Engineering Atomic Force Microscopy (AFM) M108 Stand: 20.10.2015 Aim: Presentation of an application of the AFM for studying surface morphology. Inhalt 1.Introduction...
Basic Laboratory Materials Science and Engineering Atomic Force Microscopy (AFM) M108 Stand: 20.10.2015 Aim: Presentation of an application of the AFM for studying surface morphology. Inhalt 1.Introduction...
Prediction of the bilinear stress-strain curve of engineering material by nanoindentation test
 Prediction of the bilinear stress-strain curve of engineering material by nanoindentation test T.S. Yang, T.H. Fang, C.T. Kawn, G.L. Ke, S.Y. Chang Institute of Mechanical & Electro-Mechanical Engineering,
D : SOLID MECHANICS. Q. 1 Q. 9 carry one mark each. Q.1 Find the force (in kn) in the member BH of the truss shown.
 in the member BH of the truss shown.") D : SOLID MECHANICS Q. 1 Q. 9 carry one mark each. Q.1 Find the force (in kn) in the member BH of the truss shown. Q.2 Consider the forces of magnitude F acting on the sides of the regular hexagon having
D : SOLID MECHANICS Q. 1 Q. 9 carry one mark each. Q.1 Find the force (in kn) in the member BH of the truss shown. Q.2 Consider the forces of magnitude F acting on the sides of the regular hexagon having
Nano-indentation of silica and silicate glasses. Russell J. Hand & Damir Tadjiev Department of Engineering Materials University of Sheffield
 Nano-indentation of silica and silicate glasses Russell J. Hand & Damir Tadjiev Department of Engineering Materials University of Sheffield Acknowledgements Pierre Samson Dr Simon Hayes Dawn Bussey EPSRC
EE C245 ME C218 Introduction to MEMS Design Fall 2007
 EE C245 ME C218 Introduction to MEMS Design Fall 2007 Prof. Clark T.-C. Nguyen Dept. of Electrical Engineering & Computer Sciences University of California at Berkeley Berkeley, CA 94720 Lecture 13: Material
Maximising the interfacial toughness of thin coatings and substrate through optimisation of defined parameters
 Maximising the interfacial toughness of thin coatings and substrate through optimisation of defined parameters Mian Hammad Nazir & Zulfiqar Khan Faculty of Science and Technology Sustainable Design Research
Influence of residual stresses in the structural behavior of. tubular columns and arches. Nuno Rocha Cima Gomes
 October 2014 Influence of residual stresses in the structural behavior of Abstract tubular columns and arches Nuno Rocha Cima Gomes Instituto Superior Técnico, Universidade de Lisboa, Portugal Contact:
Chapter 6: Mechanical Properties of Metals. Dr. Feras Fraige
 Chapter 6: Mechanical Properties of Metals Dr. Feras Fraige Stress and Strain Tension Compression Shear Torsion Elastic deformation Plastic Deformation Yield Strength Tensile Strength Ductility Toughness
Experimentally Calibrating Cohesive Zone Models for Structural Automotive Adhesives
 Experimentally Calibrating Cohesive Zone Models for Structural Automotive Adhesives Mark Oliver October 19, 2016 Adhesives and Sealants Council Fall Convention contact@veryst.com www.veryst.com Outline
Analysis of contact deformation between a coated flat plate and a sphere and its practical application
 Computer Methods and Experimental Measurements for Surface Effects and Contact Mechanics VII 307 Analysis of contact deformation between a coated flat plate and a sphere and its practical application T.
Supplementary Information: Nanoscale heterogeneity promotes energy dissipation in bone
 Supplementary Information: Nanoscale heterogeneity promotes energy dissipation in bone KUANGSHIN TAI, * MING DAO, * SUBRA SURESH,, AHMET PALAZOGLU, & AND CHRISTINE ORTIZ Department of Materials Science
Powerful Modelling Techniques in Abaqus to Simulate
 Powerful Modelling Techniques in Abaqus to Simulate Necking and Delamination of Laminated Composites D. F. Zhang, K.M. Mao, Md. S. Islam, E. Andreasson, Nasir Mehmood, S. Kao-Walter Email: sharon.kao-walter@bth.se
Keysight Technologies Instrumented Indentation Testing with the Keysight Nano Indenter G200. Application Note
 Keysight Technologies Instrumented Indentation Testing with the Keysight Nano Indenter G200 Application Note Introduction The scale of materials and machined components continues to decrease with advances
LECTURE NO. 4-5 INTRODUCTION ULTRASONIC * PULSE VELOCITY METHODS
 LECTURE NO. 4-5 ULTRASONIC * PULSE VELOCITY METHODS Objectives: To introduce the UPV methods To briefly explain the theory of pulse propagation through concrete To explain equipments, procedures, calibrations,
An Energy Dissipative Constitutive Model for Multi-Surface Interfaces at Weld Defect Sites in Ultrasonic Consolidation
 An Energy Dissipative Constitutive Model for Multi-Surface Interfaces at Weld Defect Sites in Ultrasonic Consolidation Nachiket Patil, Deepankar Pal and Brent E. Stucker Industrial Engineering, University
5. STRESS CONCENTRATIONS. and strains in shafts apply only to solid and hollow circular shafts while they are in the
 5. STRESS CONCENTRATIONS So far in this thesis, most of the formulas we have seen to calculate the stresses and strains in shafts apply only to solid and hollow circular shafts while they are in the elastic
Chapter 2 Surface Acoustic Wave Motor Modeling and Motion Control
 Chapter 2 Surface Acoustic Wave Motor Modeling and Motion Control 1 Abstract For miniaturization of ultrasonic transducers, a surface acoustic wave device has an advantage in rigid mounting and high-power-density
Peridynamic model for dynamic fracture in unidirectional fiber-reinforced composites
 University of Nebraska - Lincoln DigitalCommons@University of Nebraska - Lincoln Mechanical & Materials Engineering Faculty Publications Mechanical & Materials Engineering, Department of 4-2012 Peridynamic
EFFECT OF PILE-UP ON THE MECHANICAL CHARACTERISTICS OF STEEL WITH DIFFERENT STRAIN HISTORY BY DEPTH SENSING INDENTATION
 EFFECT OF PILE-UP ON THE MECHANICAL CHARACTERISTICS OF STEEL WITH DIFFERENT STRAIN HISTORY BY DEPTH SENSING INDENTATION Peter BURIK 1,a, Ladislav PEŠEK 2,b, Lukáš VOLESKÝ 1,c 1 Technical University of
Delamination Modeling for Power Packages and Modules. Rainer Dudek, R. Döring, S. Rzepka Fraunhofer ENAS, Micro Materials Center Chemnitz
 Delamination Modeling for Power Packages and Modules Rainer Dudek, R. Döring, S. Rzepka Fraunhofer ENAS, Micro Materials Center Chemnitz The Micro Materials Center @ Virtual Prototyping Finite Element
Using the Timoshenko Beam Bond Model: Example Problem
 Using the Timoshenko Beam Bond Model: Example Problem Authors: Nick J. BROWN John P. MORRISSEY Jin Y. OOI School of Engineering, University of Edinburgh Jian-Fei CHEN School of Planning, Architecture and
QUANTITATIVE DAMAGE ESTIMATION OF CONCRETE CORE BASED ON AE RATE PROCESS ANALYSIS
 QUANTITATIVE DAMAGE ESTIMATION OF CONCRETE CORE BASED ON AE RATE PROCESS ANALYSIS MASAYASU OHTSU and TETSUYA SUZUKI 1 Kumamoto University, Kumamoto 860-8555, Japan 2 Nippon Suiko Consultants Co., Kumamoto
NANOINDENTATION STUDIES OF PAPER
 Progress in Paper Physics Seminar 2008 - June 2-5, Otaniemi Finland NANOINDENTATION STUDIES OF PAPER B. F. West 1, B. T. Hotle 2, J. E. Jakes 3,4, J. M. Considine 3, R. E. Rowlands 1 and K. T. Turner 1,4
Keysight Technologies Measuring Substrate-Independent Young s Modulus of Low-k Films by Instrumented Indentation. Application Note
 Keysight Technologies Measuring Substrate-Independent Young s Modulus of Low-k Films by Instrumented Indentation Application Note Introduction In digital circuits, insulating dielectrics separate the conducting
Session 15: Measuring Substrate-Independent Young s Modulus of Thin Films
 Session 15: Measuring Substrate-Independent Young s Modulus of Thin Films Jennifer Hay Factory Application Engineer Nano-Scale Sciences Division Agilent Technologies jenny.hay@agilent.com To view previous
UNIT I SIMPLE STRESSES AND STRAINS
 Subject with Code : SM-1(15A01303) Year & Sem: II-B.Tech & I-Sem SIDDHARTH GROUP OF INSTITUTIONS :: PUTTUR Siddharth Nagar, Narayanavanam Road 517583 QUESTION BANK (DESCRIPTIVE) UNIT I SIMPLE STRESSES
In Situ Ultrasonic NDT of Fracture and Fatigue in Composites
 ECNDT 26 - Mo.2.6.5 In Situ Ultrasonic NDT of Fracture and Fatigue in Composites I. SOLODOV, K. PFLEIDERER, and G. BUSSE Institute for Polymer Testing and Polymer Science (IKP), Non-destructive Testing
Bending Load & Calibration Module
 Bending Load & Calibration Module Objectives After completing this module, students shall be able to: 1) Conduct laboratory work to validate beam bending stress equations. 2) Develop an understanding of
Outline. 4 Mechanical Sensors Introduction General Mechanical properties Piezoresistivity Piezoresistive Sensors Capacitive sensors Applications
 Sensor devices Outline 4 Mechanical Sensors Introduction General Mechanical properties Piezoresistivity Piezoresistive Sensors Capacitive sensors Applications Introduction Two Major classes of mechanical
ENSC387: Introduction to Electromechanical Sensors and Actuators LAB 3: USING STRAIN GAUGES TO FIND POISSON S RATIO AND YOUNG S MODULUS
 ENSC387: Introduction to Electromechanical Sensors and Actuators LAB 3: USING STRAIN GAUGES TO FIND POISSON S RATIO AND YOUNG S MODULUS 1 Introduction... 3 2 Objective... 3 3 Supplies... 3 4 Theory...
Introduction to Engineering Materials ENGR2000. Dr. Coates
 Introduction to Engineering Materials ENGR2 Chapter 6: Mechanical Properties of Metals Dr. Coates 6.2 Concepts of Stress and Strain tension compression shear torsion Tension Tests The specimen is deformed
Characterization of MEMS Devices
 MEMS: Characterization Characterization of MEMS Devices Prasanna S. Gandhi Assistant Professor, Department of Mechanical Engineering, Indian Institute of Technology, Bombay, Recap Characterization of MEMS
Intensity (a.u.) Intensity (a.u.) Raman Shift (cm -1 ) Oxygen plasma. 6 cm. 9 cm. 1mm. Single-layer graphene sheet. 10mm. 14 cm
 Intensity (a.u.) Raman Shift (cm -1 ) Oxygen plasma. 6 cm. 9 cm. 1mm. Single-layer graphene sheet. 10mm. 14 cm") Intensity (a.u.) Intensity (a.u.) a Oxygen plasma b 6 cm 1mm 10mm Single-layer graphene sheet 14 cm 9 cm Flipped Si/SiO 2 Patterned chip Plasma-cleaned glass slides c d After 1 sec normal Oxygen plasma
Intensity (a.u.) Intensity (a.u.) a Oxygen plasma b 6 cm 1mm 10mm Single-layer graphene sheet 14 cm 9 cm Flipped Si/SiO 2 Patterned chip Plasma-cleaned glass slides c d After 1 sec normal Oxygen plasma
Metrology challenges in High volume ULK production Ulrich Mayer, Michael Hecker, Holm Geisler
 Metrology challenges in High volume ULK production 20.10.10 Ulrich Mayer, Michael Hecker, Holm Geisler outline ILD material choice in GLBALFUNDRIES New ULK processes and parameters Mechanical frontiers
Theory at a Glance (for IES, GATE, PSU)
") 1. Stress and Strain Theory at a Glance (for IES, GATE, PSU) 1.1 Stress () When a material is subjected to an external force, a resisting force is set up within the component. The internal resistance force
1. Stress and Strain Theory at a Glance (for IES, GATE, PSU) 1.1 Stress () When a material is subjected to an external force, a resisting force is set up within the component. The internal resistance force
Examination in Damage Mechanics and Life Analysis (TMHL61) LiTH Part 1
 LiTH Part 1") Part 1 1. (1p) Define the Kronecker delta and explain its use. The Kronecker delta δ ij is defined as δ ij = 0 if i j 1 if i = j and it is used in tensor equations to include (δ ij = 1) or "sort out" (δ
Part 1 1. (1p) Define the Kronecker delta and explain its use. The Kronecker delta δ ij is defined as δ ij = 0 if i j 1 if i = j and it is used in tensor equations to include (δ ij = 1) or "sort out" (δ
DEVELOPMENT OF AUTOMATIC CONTROL OF MULTI-STAGE TRIAXIAL TESTS AT THE UNIVERSITY OF MISKOLC
 Geosciences and Engineering, Vol. 2, No. 3 (2013), pp. 37 43. DEVELOPMENT OF AUTOMATIC CONTROL OF MULTI-STAGE TRIAXIAL TESTS AT THE UNIVERSITY OF MISKOLC BALÁZS CSUHANICS ÁKOS DEBRECZENI Institute of Mining
Lecture #2: Split Hopkinson Bar Systems
 Lecture #2: Split Hopkinson Bar Systems by Dirk Mohr ETH Zurich, Department of Mechanical and Process Engineering, Chair of Computational Modeling of Materials in Manufacturing 2015 1 1 1 Uniaxial Compression
Mechanical Engineering Ph.D. Preliminary Qualifying Examination Solid Mechanics February 25, 2002
 student personal identification (ID) number on each sheet. Do not write your name on any sheet. #1. A homogeneous, isotropic, linear elastic bar has rectangular cross sectional area A, modulus of elasticity
Laboratory 4 Bending Test of Materials
 Department of Materials and Metallurgical Engineering Bangladesh University of Engineering Technology, Dhaka MME 222 Materials Testing Sessional.50 Credits Laboratory 4 Bending Test of Materials. Objective
PES Institute of Technology
 PES Institute of Technology Bangalore south campus, Bangalore-5460100 Department of Mechanical Engineering Faculty name : Madhu M Date: 29/06/2012 SEM : 3 rd A SEC Subject : MECHANICS OF MATERIALS Subject
Mechanics of Materials Primer
 Mechanics of Materials rimer Notation: A = area (net = with holes, bearing = in contact, etc...) b = total width of material at a horizontal section d = diameter of a hole D = symbol for diameter E = modulus
Physical and Biological Properties of Agricultural Products Acoustic, Electrical and Optical Properties and Biochemical Property
 Physical and Biological Properties of Agricultural Products Acoustic, Electrical and Optical Properties and Biochemical Property 1. Acoustic and Vibrational Properties 1.1 Acoustics and Vibration Engineering
FCP Short Course. Ductile and Brittle Fracture. Stephen D. Downing. Mechanical Science and Engineering
 FCP Short Course Ductile and Brittle Fracture Stephen D. Downing Mechanical Science and Engineering 001-015 University of Illinois Board of Trustees, All Rights Reserved Agenda Limit theorems Plane Stress
AVOIDING FRACTURE INSTABILITY IN WEDGE SPLITTING TESTS BY MEANS OF NUMERICAL SIMULATIONS
 Damage, Avoiding fracture Fracture instability and Fatigue in wedge splitting tests by means of numerical simulations XIV International Conference on Computational Plasticity. Fundamentals and Applications
Vibration analysis of free isotropic cracked plates
 Computational Methods and Experimental Measurements XII 475 Vibration analysis of free isotropic cracked plates M. Alfano & L. Pagnotta Department of Mechanical Engineering, University of Calabria, Italy
Engineering Solid Mechanics
 }} Engineering Solid Mechanics 1 (2013) 1-8 Contents lists available at GrowingScience Engineering Solid Mechanics homepage: www.growingscience.com/esm Impact damage simulation in elastic and viscoelastic
A Laboratory Experiment Using Nanoindentation to Demonstrate the Indentation Size Effect
 Bucknell University Bucknell Digital Commons Faculty Journal Articles Faculty Scholarship 2013 A Laboratory Experiment Using Nanoindentation to Demonstrate the Indentation Size Effect Wendelin Wright Bucknell
TABLE OF CONTENTS CHAPTER TITLE PAGE DECLARATION DEDICATION ACKNOWLEDGEMENT ABSTRACT ABSTRAK
 vii TABLE OF CONTENTS CHAPTER TITLE PAGE DECLARATION DEDICATION ACKNOWLEDGEMENT ABSTRACT ABSTRAK TABLE OF CONTENTS LIST OF TABLES LIST OF FIGURES LIST OF ABBREVIATIONS LIST OF SYMBOLS ii iii iv v vi vii
CHAPTER 4 DESIGN AND ANALYSIS OF CANTILEVER BEAM ELECTROSTATIC ACTUATORS
 61 CHAPTER 4 DESIGN AND ANALYSIS OF CANTILEVER BEAM ELECTROSTATIC ACTUATORS 4.1 INTRODUCTION The analysis of cantilever beams of small dimensions taking into the effect of fringing fields is studied and
AE3610 Experiments in Fluid and Solid Mechanics TRANSIENT MEASUREMENTS OF HOOP STRESSES FOR A THIN-WALL PRESSURE VESSEL
 Objective AE3610 Experiments in Fluid and Solid Mechanics TRANSIENT MEASUREMENTS OF OOP STRESSES FOR A TIN-WA PRESSURE VESSE This experiment will allow you to investigate hoop and axial stress/strain relations
MECHANICS OF 2D MATERIALS
 MECHANICS OF 2D MATERIALS Nicola Pugno Cambridge February 23 rd, 2015 2 Outline Stretching Stress Strain Stress-Strain curve Mechanical Properties Young s modulus Strength Ultimate strain Toughness modulus
AERO 214. Lab II. Measurement of elastic moduli using bending of beams and torsion of bars
 AERO 214 Lab II. Measurement of elastic moduli using bending of beams and torsion of bars BENDING EXPERIMENT Introduction Flexural properties of materials are of interest to engineers in many different
Mechanics of wafer bonding: Effect of clamping
 JOURNAL OF APPLIED PHYSICS VOLUME 95, NUMBER 1 1 JANUARY 2004 Mechanics of wafer bonding: Effect of clamping K. T. Turner a) Massachusetts Institute of Technology, Cambridge, Massachusetts 0219 M. D. Thouless
6298 Stress induced azimuthally anisotropic reservoir - AVO modeling
 6298 Stress induced azimuthally anisotropic reservoir - AVO modeling M. Brajanovski* (Curtin University of Technology), B. Gurevich (Curtin University of Technology), D. Nadri (CSIRO) & M. Urosevic (Curtin
Supporting Online Material for
 www.sciencemag.org/cgi/content/full/313/5794/1765/dc1 Supporting Online Material for Self-Healing Pulse-Like Shear Ruptures in the Laboratory George Lykotrafitis, Ares J. Rosakis,* Guruswami Ravichandran
NORMAL STRESS. The simplest form of stress is normal stress/direct stress, which is the stress perpendicular to the surface on which it acts.
 NORMAL STRESS The simplest form of stress is normal stress/direct stress, which is the stress perpendicular to the surface on which it acts. σ = force/area = P/A where σ = the normal stress P = the centric
Influence of friction in material characterization in microindentation measurement
 Influence of friction in material characterization in microindentation measurement W.C. Guo a,b,, G. Rauchs c, W.H. Zhang b, J.P. Ponthot a a LTAS. Department of Aerospace & Mechanical Engineering, University
Finite Element and Plate Theory Modeling of Acoustic Emission Waveforms. NASA Langley Research Center. Hampton, VA *University of Denver
 Finite Element and Plate Theory Modeling of Acoustic Emission Waveforms W. H. Prosser, M. A. Hamstad + *, J. Gary +, and A. O Gallagher + NASA Langley Research Center Hampton, VA 23681-1 *University of
Mat. Res. Soc. Symp. Proc. Vol Materials Research Society
 Mat. Res. Soc. Symp. Proc. Vol. 738 2003 Materials Research Society G7.26.1 Determination of the Plastic Behavior of Low Thermal Expansion Glass at the Nanometer Scale Richard Tejeda, 1 Roxann Engelstad,
6th NDT in Progress Lamb waves in an anisotropic plate of a single crystal silicon wafer
 6th NDT in Progress 2011 International Workshop of NDT Experts, Prague, 10-12 Oct 2011 Lamb waves in an anisotropic plate of a single crystal silicon wafer Young-Kyu PARK 1, Young H. KIM 1 1 Applied Acoustics
Stress in Flip-Chip Solder Bumps due to Package Warpage -- Matt Pharr
 Stress in Flip-Chip Bumps due to Package Warpage -- Matt Pharr Introduction As the size of microelectronic devices continues to decrease, interconnects in the devices are scaling down correspondingly.
Mechanics of Earthquakes and Faulting
 Mechanics of Earthquakes and Faulting www.geosc.psu.edu/courses/geosc508 Surface and body forces Tensors, Mohr circles. Theoretical strength of materials Defects Stress concentrations Griffith failure
Discrete Element Modelling of a Reinforced Concrete Structure
 Discrete Element Modelling of a Reinforced Concrete Structure S. Hentz, L. Daudeville, F.-V. Donzé Laboratoire Sols, Solides, Structures, Domaine Universitaire, BP 38041 Grenoble Cedex 9 France sebastian.hentz@inpg.fr
Chapter 3. Experimentation and Data Acquisition
 48 Chapter 3 Experimentation and Data Acquisition In order to achieve the objectives set by the present investigation as mentioned in the Section 2.5, an experimental set-up has been fabricated by mounting
Towards Affordable, Closed-Loop Recyclable Future Low Carbon Vehicles. Supervisors : Dr. L.T. Harper, Dr. M. Johnson, Prof. N.A.
 Towards Affordable, Closed-Loop Recyclable Future Low Carbon Vehicles Supervisors : Dr. L.T. Harper, Dr. M. Johnson, Prof. N.A. Warrior Moulding issues with CF/PP Now looking to use CF/PA6 consolidation
For an imposed stress history consisting of a rapidly applied step-function jump in
 Problem 2 (20 points) MASSACHUSETTS INSTITUTE OF TECHNOLOGY DEPARTMENT OF MECHANICAL ENGINEERING CAMBRIDGE, MASSACHUSETTS 0239 2.002 MECHANICS AND MATERIALS II SOLUTION for QUIZ NO. October 5, 2003 For
(Refer Slide Time: 1: 19)
") Mechanical Measurements and Metrology Prof. S. P. Venkateshan Department of Mechanical Engineering Indian Institute of Technology, Madras Module - 4 Lecture - 46 Force Measurement So this will be lecture
Mechanical Measurements and Metrology Prof. S. P. Venkateshan Department of Mechanical Engineering Indian Institute of Technology, Madras Module - 4 Lecture - 46 Force Measurement So this will be lecture
An Acoustic Emission Approach to Assess Remaining Useful Life of Aging Structures under Fatigue Loading PI: Mohammad Modarres
 An Acoustic Emission Approach to Assess Remaining Useful Life of Aging Structures under Fatigue Loading PI: Mohammad Modarres Outline Objective Motivation, acoustic emission (AE) background, approaches
High Tech High Top Hat Technicians. An Introduction to Solid Mechanics. Is that supposed to bend there?
 High Tech High Top Hat Technicians An Introduction to Solid Mechanics Or Is that supposed to bend there? Why don't we fall through the floor? The power of any Spring is in the same proportion with the