Unit 14: Nonparametric Statistical Methods
|
|
|
- Pierce Curtis
- 5 years ago
- Views:
Transcription
1 Unit 14: Nonparametric Statistical Methods Statistics 571: Statistical Methods Ramón V. León 8/8/2003 Unit 14 - Stat Ramón V. León 1
2 Introductory Remarks Most methods studied so far have been based on the assumption of normally distributed data Frequently this assumption is not valid Sample size may be too small to verify it Sometimes the data is measured in an ordinal scale Nonparametric or distribution-free statistical methods Make very few assumptions about the form of the population distribution from which the data are sampled Based on ranks so they can be used on ordinal data Will concentrate on hypothesis tests but will also mention confidence interval procedures. 8/8/2003 Unit 14 - Stat Ramón V. León 2
3 Inference for a Single Sample Consider a random sample x1, x2,..., x n from a population with unknown median µ. (Recall that for nonnormal (especially skewed) distributions the median is a better measure of the center than the mean.) H : µ = µ vs. H : µ > µ Example: Test whether the median household income of a population exceeds $50,000 based on a random sample of household incomes from that population For simplicity we sometimes present methods for one-sided tests. Modifications for two-sided tests are straightforward and are given in the textbook However, some example in these notes are two-sided tests. 8/8/2003 Unit 14 - Stat Ramón V. León 3
4 Sign test: Sign Test for a Single Sample H 1. Count the number of x i 's that exceed µ 0. Denote this number by s+, called the number of plus signs. Let s = n s+, which is the number of minus signs. 2. Reject H if s is large or equivalently if s is small. 0 : µ = µ vs. H : µ > µ Test idea: Under the null hypothesis s + has a binomial distribution, Bin (n, ½). So this test is simply the test for binomial proportions 8/8/2003 Unit 14 - Stat Ramón V. León 4
5 Sign Test Example A thermostat used in an electric device is to be checked for the accuracy of its design setting of 200ºF. Ten thermostats were tested to determine their actual settings, resulting in the following data: 202.2, 203.4, 200.5, 202.5, 206.3, 198.0, 203.7, 200.8, 201.3, s + H : µ = 200 vs H : µ = 8 = number of data values > 200, so P-value = i= 8 i = = 2 i= 0 i 2 (The t test based on the mean has P-value = However recall that the t test assumes a normal population) 8/8/2003 Unit 14 - Stat Ramón V. León 5
6 Normal Approximation to Test Statistic If the sample size is large ( 20) the common of S and S is approximated by a normal distribution with 1 n ES ( + ) = ES ( ) = np= n =, n Var( S+ ) = Var( S ) = np(1 p) = n = Therefore can perform a one-sided z- test with s+ n z = n 4 + 8/8/2003 Unit 14 - Stat Ramón V. León 6


7 P-values for Sign Test Using JMP Based on normal approximation to the binomial ( = z 2 ) 8/8/2003 Unit 14 - Stat Ramón V. León 7
8 Treatment of Ties Theory of the test assumes that the distribution of the data is continuous so in theory ties are impossible In practice they do occur because of rounding A simple solution is to ignore the ties and work only with the untied observation. This does reduce the effective sample size of the test and hence its power, but the loss is not significant if there are only a few ties 8/8/2003 Unit 14 - Stat Ramón V. León 8
9 Let x x x be the ordered data values. (1) (2) ( n) Then a (1- α )-level CI for µ is given by x µ Comfidence Interval for µ x ( b+ 1) ( n b) where b= b α is the lower α 2 critical point n,1 2 of the Bin n,1 2 distribution. ( ) Note: Not all confidence levels are possible because of the discreteness of the Binomial distribution 8/8/2003 Unit 14 - Stat Ramón V. León 9
10 Thermostat Setting: Sign Confidence Interval for the Median From Table A.1 we see that for n = 10 and p=0.5, the lower critical point of the binomial distribution is 1 and by symmetry the upper critical point is 9. Setting α 2 = which gives 1-α = = 0.978, we find that = x µ x = (2) (9) is a 97.8% CI for µ. 8/8/2003 Unit 14 - Stat Ramón V. León 10
11 Sign Test for Matched Pairs Drop 3 tied pairs. Then s + = 20; s - = 3 8/8/2003 Unit 14 - Stat Ramón V. León 11

12 Sign Test for Matched Pairs 8/8/2003 Unit 14 - Stat Ramón V. León 12
 rather than z = 3.544745 used by JMP. Note that (3.544745) 2 = 12.5652 book 8/8/2003 Unit 14 - Stat 571 - Ramón V.")
13 Sign Test for Matched Pairs in JMP Pearson s p-value is not the same as the book s two-sided P-value because the book uses the continuity correction in the normal approximation to the binomial distribution, i.e, book uses z = (Page 567) rather than z = used by JMP. Note that ( ) 2 = book 8/8/2003 Unit 14 - Stat Ramón V. León 13
14 Wilcoxon Signed Rank Test H : µ = µ vs. H : µ µ More powerful than the sign test, however, it requires the assumption that the population distribution is symmetric 1. Rank and order the differences in terms of their absolute value 2. Calculate w + = sum of the ranks of the positive differences w + = Reject H 0 if w + is large or small 8/8/2003 Unit 14 - Stat Ramón V. León 14


15 Wilcoxon Signed Rank Test in JMP This test finds a significant difference at α=0.05 while the sign test did not at even α=0.1 8/8/2003 Unit 14 - Stat Ramón V. León 15
16 Normal Approximation in the Wilcoxon Signed Rank Test For large n, the null distribution of W = W = W + - can be well-approximated by a normal distribution with mean and variance given by nn ( + 1) nn ( + 1)(2n+ 1) EW ( ) = andvarw ( ) = For large samples a one-sided z-test uses the statistic w+ n( n 1)/4 1/2 z = + nn ( + 1)(2n+ 1) 24 8/8/2003 Unit 14 - Stat Ramón V. León 16

17 Importance of Symmetric Population Assumption Here even though H 0 is true the long right hand tail makes the positive differences tend to be larger in magnitude than the negative differences, resulting in higher ranks. This inflates w + and hence the test s type I error probability. 8/8/2003 Unit 14 - Stat Ramón V. León 17
18 Null Distribution of the Wilcoxon Signed Rank Statistics 8/8/2003 Unit 14 - Stat Ramón V. León 18
19 Null Distribution of the Wilcoxon Signed Rank Statistics 8/8/2003 Unit 14 - Stat Ramón V. León 19
20 Wilcoxon Signed Rank Statistic: Treatment of Ties There are two types of ties Some of the data is equal to the median Drop these observations Some of the differences from the median may be tied Use midrank, that is, the average rank For example, suppose d1 = 1, d2 =+ 3, d3 = 3, d4 =+ 5 Then (2 + 3) r1 = 1, r2 = r3 = = 2.5, r4 = 4 2 With ties Table A.10 is only approximate 8/8/2003 Unit 14 - Stat Ramón V. León 20
21 Wilcoxon Sign Rank Test: Matched Pair Design Notice that we drop the three zero differences Notice that we average the tied ranks Two-Side P-values Signed test: Signed Rank test: t-test: (Page 284) (Notice that these tests require progressively more stringent assumptions about the population of differences) 8/8/2003 Unit 14 - Stat Ramón V. León 21


22 JMP Calculation 8/8/2003 Unit 14 - Stat Ramón V. León 22
23 Signed Rank Confidence Interval for the Median 8/8/2003 Unit 14 - Stat Ramón V. León 23
24 Thermostat Setting: Wilcoxon Signed Rank Confidence Interval for Median From Table A.10 we see that for n = 10, the upper 2.4% critical point is 47 and by symmetry the lower 2.4% 10(10 + 1) critical point is - 47 = = 8. 2 Setting α 2 = and hence 1-α= =0.952 we find that = x = x µ x = is a 95.2% CI for µ 8/8/2003 Unit 14 - Stat Ramón V. León 24
25 Inferences for Two Independent Samples One wants to show that the observations from one population tend to be larger than those from another population based on independent random samples x, x,..., x and y, y,..., y 1 2 n n Examples: Treated patients tend to live longer than untreated patients An equity fund tends to have a higher yield than a bond fund 8/8/2003 Unit 14 - Stat Ramón V. León 25
26 Wilcoxon-Mann-Whitney Test Example: Time to Failure of Two Capacitor Groups Reject for extreme values of w 1. 8/8/2003 Unit 14 - Stat Ramón V. León 26
27 Stochastic Ordering of Populations X is stochastically larger than Y ( X Y) if for all real numbers u, PX ( > u) PY ( > u) equivalently, P( X u) = F( u) F ( u) = P( Y u) 1 2 with strict inequality for at least some u. Denoted by X Y or equivalently by F < F ) 1 2 8/8/2003 Unit 14 - Stat Ramón V. León 27
28 Stochastic Ordering Especial Case: Location Difference θ is called a location parameter Notice that X X iff θ < θ /8/2003 Unit 14 - Stat Ramón V. León 28
29 0 1 2 Wilcoxon-Mann-Whitney Test H : F = F ( X Y) Alternatives : One sided: H : F < F ( X Y) Two sided: H : F < F or F < F ( X Y or Y X) Notice that the alternative is not H : F F (Kolmogorov-Smirnov Test can handle this alternative) 8/8/2003 Unit 14 - Stat Ramón V. León 29
30 Wilcoxon Version of the Test H : F = F ( X Y)vs. H : F < F ( X Y) Rank all N = n + n observations, 1 2 x, x,..., x and y, y,..., y 1 2 n in ascending order 2. Sum the ranks of the x's and y's separately. Denote these sums by w and Reject H if w is large or equivalently w is small n w 2 8/8/2003 Unit 14 - Stat Ramón V. León 30
31 Mann-Whitney Test Version The advantage of using the Mann-Whitney form of the test is that the same distribution applies whether we use u 1 or u 2 P value = P( U u ) = P( U u ) 1 2 8/8/2003 Unit 14 - Stat Ramón V. León 31
32 Null Distribution of the Wilcoxon- Mann-Whitney Test Statistic Under the null hypothesis each of these 10 ordering has an equal chance of occurring, namely, 1/10 8/8/2003 Unit 14 - Stat Ramón V. León 32
33 Null Distribution of the Wilcoxon- Mann-Whitney Test Statistic Pw ( 8) = = 0.2 (one-sided p-value for w= 8) 1 1 ( H : X Y) 1 8/8/2003 Unit 14 - Stat Ramón V. León 33
34 Normal Approximation of Mann- Whitney Statistic For large n and n, the null distribution of U can be 1 2 well approximated by a normal distribution with mean and variance given by nn 1 2 nn 1 2( N+ 1) EU ( ) = and VarU ( ) = 2 12 A large sample one-sided z- test can be based on the statistic z = u nn nn ( N 1) 12 ( H : X Y) 8/8/2003 Unit 14 - Stat Ramón V. León 34
35 Treatment of Ties A tie occurs when some x equal a y. A contribution of ½ is counted towards both u 1 and u 2 for each tied pair Equivalent to using the midrank method in computing the Wilcoxon rank sum statistic 8/8/2003 Unit 14 - Stat Ramón V. León 35
36 Wilcoxon-Mann-Whitney Confidence Interval Example14.8 shows that [d (18), d (63) ] = [-1.1, 14.7] is a 95.6% CI for the difference of the two medians of the failure times of capacitors. This example is in the book errata since Table A.11 is not detailed enough. 8/8/2003 Unit 14 - Stat Ramón V. León 36


37 Wilcoxon-Mann-Whitney Test in JMP z 2 = With continuity correction Without continuity correction 8/8/2003 Unit 14 - Stat Ramón V. León 37
38 Inference for Several Independent Samples: Kruskal-Wallis Test Note that this is a completely randomized design 8/8/2003 Unit 14 - Stat Ramón V. León 38
39 Kruskal-Wallis Test H : F = F = = F vs. H : F < F for some i j a 1 i j Reject if a 2 H0 kw> χ 1, α Distance from the average rank 8/8/2003 Unit 14 - Stat Ramón V. León 39
40 Chi-Square Approximation For large n i s, the exact null hypothesis of KW can be approximated by the chi-square distribution with a-1 degrees of freedom So reject H 0 if kw > χa 1, α 8/8/2003 Unit 14 - Stat Ramón V. León 40
41 Kruskal-Wallis Test Example Reject if kw is large. 2 χ 3,.005 = /8/2003 Unit 14 - Stat Ramón V. León 41
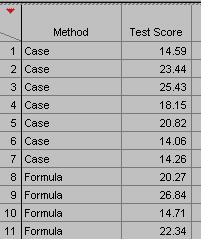
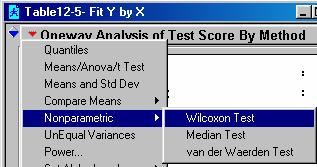
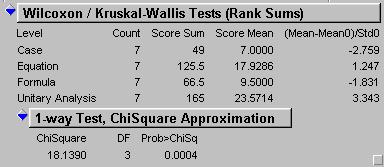
42 Kruskal-Wallis Test in JMP 8/8/2003 Unit 14 - Stat Ramón V. León 42

43 8/8/2003 Unit 14 - Stat Ramón V. León 43
44 Case method is different from Unitary method Formula method is different from Unitary method 8/8/2003 Unit 14 - Stat Ramón V. León 44
45 Pairwise Comparisons: Is Any Pair of Treatments Different? One can use the Tukey Method on the average ranks to make approximate pairwise comparisons. This is one of many approximate techniques where ranks are substituted for the observations in the normal theory methods. 8/8/2003 Unit 14 - Stat Ramón V. León 45

46 8/8/2003 Unit 14 - Stat Ramón V. León 46

47 8/8/2003 Unit 14 - Stat Ramón V. León 47

48 Tukey s Test Applied to the Ranks Averaged Lack of agreement with the more precise method of Example Here Equation method also seems to be different from Formula and Case method 8/8/2003 Unit 14 - Stat Ramón V. León 48
49 Example of Friedman s Test Ranking is done within blocks 2 χ 7,.025 = so P-value =.0040 vs for ANOVA table 8/8/2003 Unit 14 - Stat Ramón V. León 49
50 i i i Inference for Several Matched Samples Randomized Block Design: a b y ij = observation on the i-th treatment in the j-th block if = c.d.f of r.v. Y corresponding to the observed value y ij ij ij For simplicity assume F ( y) = F( y θ β ) iθ i iβ j 2 treatment groups 2 blocks is the "treatment effect" is the "block effect" i.e., we assume that there is no treatment by block interaction ij i j 8/8/2003 Unit 14 - Stat Ramón V. León 50
51 Friedman Test H : θ = θ = = θ vs. H : θ > θ for some i j a 1 i j Reject if fr 2 > χa 1, α Distance from the total of the rank from expected value when there is no agreement between the blocks 8/8/2003 Unit 14 - Stat Ramón V. León 51
52 Pairwise Comparisons 8/8/2003 Unit 14 - Stat Ramón V. León 52
53 Rank Correlation Methods The Pearson correlation coefficient measures only the degree of linear association between two variables Inferences use the assumption of bivariate normality of the two variables We present two correlation coefficients that Take into account only the ranks of the observations Measure the degree of monotonic (increasing or decreasing) association between two variables 8/8/2003 Unit 14 - Stat Ramón V. León 53
54 Motivating Example ( xy, ) = (1, e), (2, e), (3, e), (4, e), (5, e) Note that there is a perfect positive association between between x and y with y = e x. The Pearson correlation correlation coefficient is only because the relationship is not linear The rank correlation coefficients we present yield a value of 1 for these data 8/8/2003 Unit 14 - Stat Ramón V. León 54
55 Spearman s Rank Correlation Coefficient Ranges between 1 and +1 with r s = -1 when there is a perfect negative association and r s = +1 when there is a perfect positive association 8/8/2003 Unit 14 - Stat Ramón V. León 55
56 Example (Wine Consumption and Heart Disease Deaths per 100,000 8/8/2003 Unit 14 - Stat Ramón V. León 56
57 8/8/2003 Unit 14 - Stat Ramón V. León 57
58 Calculation of Spearman s Rho 8/8/2003 Unit 14 - Stat Ramón V. León 58
59 Test for Association Based on Spearman s Rank Correlation Coefficient 8/8/2003 Unit 14 - Stat Ramón V. León 59
60 H 0 1 Hypothesis Testing Example : X= Wine Consumption and Y = Heart Disease Deaths are independent. vs. H : X and Y are (negatively or positively) associated z = r n 1 = = S Two-Sided P value = Evidence of negative association 8/8/2003 Unit 14 - Stat Ramón V. León 60


61 JMP Calculations: Pearson Correlation Heart Disease Deaths Alcohol from Wine Plot is fairly linear Pearson correlation 8/8/2003 Unit 14 - Stat Ramón V. León 61

62 JMP Calculations: Spearman Rank Correlation 8/8/2003 Unit 14 - Stat Ramón V. León 62
63 Kendall s Rank Correlation Coefficient: Key Concept Examples Concordant pairs: (1,2), (4,9) (1-4)(2-9)>0 (4,2), (3,1) (4-3)(2-1)>0 Discordant pairs: (1,2), (9,1) (1-9)(2-1)<0 (2,4), (3,1) (2-3)(4-1)<0 Tied pairs: (1,3), (1,5) (1,4), (2,4) (1,2), (1,2) Kendall s idea is to compare the number of concordant pairs to the number of discordant pairs in bivariate data 8/8/2003 Unit 14 - Stat Ramón V. León 63
64 (X, Y) (1, 2) (3, 4) (2, 1) Concordant pairs: (1,2) (3,4) (3,4) (2,1) N c = 2 Kendall s Tau Discordant pairs: (1,2) (2,1) N d = 1 Example 3 Number of pairwise comparisons = = 3 2 ˆ τ = N /8/2003 Unit 14 - Stat Ramón V. León 64 = = N c N d
65 Kendall s Rank Correlation Coefficient: Population Version 8/8/2003 Unit 14 - Stat Ramón V. León 65
66 Kendall s Rank Correlation Coefficient: Sample Estimate Let Nc = Number of concordant pairs in the data Let Nd = Number of disconcordant pairs in the data n Let N = be the number of pairwise comparisons among 2 the observations ( xi, yi), i = 1, 2,..., n. Then Nc Nd ˆ τ = and Nc + Nd N = N if no ties ˆ τ = Nc Nd if ties ( N T )( N T ) x y where T and T are corrections for the number of tied pairs. x y 8/8/2003 Unit 14 - Stat Ramón V. León 66


67 Hypothesis of Independence Versus Positive Association Wine data: /8/2003 Unit 14 - Stat Ramón V. León 67

68 JMP Calculations: Kendall s Rank Correlation Coefficient 8/8/2003 Unit 14 - Stat Ramón V. León 68
69 Kendall s Coefficient of Concordance Measure of association between several matched samples Closely related to Friedman s test statistic Consider a candidates (treatments) and b judges (blocks) with each judge ranking the a candidates If there is perfect agreement between the judges, then each candidate gets the same rank. Assuming the candidates are labeled in the order of their ranking, the rank sum for the ith candidate would be r i = ib If the judges rank the candidates completely at random ( perfect disagreement ) then the expected rank of each candidate would be [1+2+ +a]/a =[a(a+1)/2]/a=(a+1)/2, and the expected value of all the rank sums would equal to b(a+1)/2 8/8/2003 Unit 14 - Stat Ramón V. León 69
70 Kendall s Coefficient of Concordance 8/8/2003 Unit 14 - Stat Ramón V. León 70
71 Kendall s Coefficient of Concordance and Friedman s Test 8/8/2003 Unit 14 - Stat Ramón V. León 71
72 w = = (8 1) 8/8/2003 Unit 14 - Stat Ramón V. León 72
73 Do You Need to Know More Nonparametric Statistical Methods, Second Edition by Myles Hollander and Douglas A. Wolfe. (1999) Wiley-Interscience 8/8/2003 Unit 14 - Stat Ramón V. León 73
74 Resampling Methods Conventional methods are based on the sampling distribution of a statistic computed for the observed sample. The sampling distribution is derived by considering all possible samples of size n from the underlying population. Resampling methods generate the sampling distribution of the statistic by drawing repeated samples from the observed sample itself. This eliminates the need to assume a specific functional form for the population distribution (e.g. normal). 8/8/2003 Unit 14 - Stat Ramón V. León 74
75 Challenger Shuttle O-Ring Data Do we have statistical evidence that cold temperature leads to more O-ring incidents? Notice that assumptions of two sample t test do not hold. Original analysis omitted the zeros? Was this justified? What do we do? 8/8/2003 Unit 14 - Stat Ramón V. León 75


76 Wrong t-test Analysis Difference of Low mean to High mean One-sided p-value = /2= Notice that the assumptions of the independent sample t-test do not hold, i.e., data is not normal for each group. 8/8/2003 Unit 14 - Stat Ramón V. León 76
77 Permutation Distribution of t Statistic Also equal to the two-sided p-value Equivalent to selecting all simple random samples without replacement of size 20 from the 24 data points, labeling these High and the rest Low 8/8/2003 Unit 14 - Stat Ramón V. León 77
78 Comments A randomization test is a permutation test applied to data from a randomized experiment. Randomization tests are the gold standard for establishing causality. A permutation test considers all possible simple random samples without replacement from the set of observed data values The bootstrap method considers a large number of simple random samples with replacement from the set of observed data values. 8/8/2003 Unit 14 - Stat Ramón V. León 78
79 Calculation of t Statistics from 10, Bootstrap Samples Think that we are placing the 24 Challenger data values in a hat. And that we are randomly selecting 24 values with replacement from the hat, labeling the first 20 values High and the remaining 4 values Low. We repeat these process 10,000 times. For each of these 10,000 bootstrap samples we calculate the t-statistic. 35 t- statistics values were greater than or equal to out of (if s p = 0, t is defined to be 0). This gives a bootstrap P-value of 35/10000 = /8/2003 Unit 14 - Stat Ramón V. León 79
80 Bootstrap Distribution of Difference Between the Means 67 of the 10,000 differences of the Low mean and the High mean were greater than or equal to 1.3. This gives a bootstrap P-value of 67/10000 = Conclusion: Cold weather increases the chance of O-ring problems 8/8/2003 Unit 14 - Stat Ramón V. León 80
81 Bootstrap Final Remarks The JMP files - that we used to generate the bootstrap samples and to calculate the statistics - are available at the course web site. There are bootstrap procedures for most types of statistical problems. All are based on resampling from the data. These methods do not assume specific functional forms for the distribution of the data, e.g. normal The accuracy of bootstrap procedures depend on the sample size and the number of bootstrap samples generated 8/8/2003 Unit 14 - Stat Ramón V. León 81
 8/8/2003 Unit 14 - Stat 571 - Ramón")
82 How Were the Bootstrap Samples Generated? (see next page) 8/8/2003 Unit 14 - Stat Ramón V. León 82

83 8/8/2003 Unit 14 - Stat Ramón V. León 83

84 8/8/2003 Unit 14 - Stat Ramón V. León 84


85 8/8/2003 Unit 14 - Stat Ramón V. León 85

86 8/8/2003 Unit 14 - Stat Ramón V. León 86

87 Calculated Columns in JMP Samples File 8/8/2003 Unit 14 - Stat Ramón V. León 87

88 8/8/2003 Unit 14 - Stat Ramón V. León 88

89 8/8/2003 Unit 14 - Stat Ramón V. León 89

90 8/8/2003 Unit 14 - Stat Ramón V. León 90

91 8/8/2003 Unit 14 - Stat Ramón V. León 91

92 8/8/2003 Unit 14 - Stat Ramón V. León 92

93 8/8/2003 Unit 14 - Stat Ramón V. León 93

94 8/8/2003 Unit 14 - Stat Ramón V. León 94
95 Bootstrap Estimate of the Standard Error of the Mean Summary: We calculate the standard deviation of the N bootstrap estimates of the mean 8/8/2003 Unit 14 - Stat Ramón V. León 95
96 BSE for Arbitrary Statistic Example: The bootstrap standard error of the median is calculated by drawing a large number N, e.g , of bootstrap samples from the data. For each bootstrap sample we calculated the sample median. Then we calculate the standard deviation of the N bootstrap medians. 8/8/2003 Unit 14 - Stat Ramón V. León 96

97 Estimated Bootstrap Standard Error for t- statistics Using JMP Note N =10,000 8/8/2003 Unit 14 - Stat Ramón V. León 97
98 Bootstrap Standard Error Interpretation Many bootstrap statistics have an approximate normal distribution Confidence interval interpretation 68% of the time the bootstrap estimate (the average of the bootstrap estimates) will be within one standard error of true parameter value 95% of the time the bootstrap estimate (the average of the bootstrap estimates) will be within two standard error of true parameter value 8/8/2003 Unit 14 - Stat Ramón V. León 98
99 Bootstrap Confidence Intervals Percentile Method: Median Example 1. Draw N (= 10000) bootstrap samples from the data and for each calculate the (bootstrap) sample median. 2. The 2.5 percentile of the N bootstrap sample medians will be the LCL for a 95% confidence interval 3. The 97.5 percentile of the N bootstrap sample medians will be the UCL for a 95% confidence interval LCL UCL 8/8/2003 Unit 14 - Stat Ramón V. León 99
100 Do You Need to Know More? A Introduction to the Bootstrap by Bradley Efrom and Robert J. Tibshirani. (1993) Chapman & Hall/CRC 8/8/2003 Unit 14 - Stat Ramón V. León 100
Introduction and Descriptive Statistics p. 1 Introduction to Statistics p. 3 Statistics, Science, and Observations p. 5 Populations and Samples p.
 Preface p. xi Introduction and Descriptive Statistics p. 1 Introduction to Statistics p. 3 Statistics, Science, and Observations p. 5 Populations and Samples p. 6 The Scientific Method and the Design of
Textbook Examples of. SPSS Procedure
 Textbook s of IBM SPSS Procedures Each SPSS procedure listed below has its own section in the textbook. These sections include a purpose statement that describes the statistical test, identification of
Chapter 15: Nonparametric Statistics Section 15.1: An Overview of Nonparametric Statistics
 Section 15.1: An Overview of Nonparametric Statistics Understand Difference between Parametric and Nonparametric Statistical Procedures Parametric statistical procedures inferential procedures that rely
Non-Parametric Statistics: When Normal Isn t Good Enough"
 Non-Parametric Statistics: When Normal Isn t Good Enough" Professor Ron Fricker" Naval Postgraduate School" Monterey, California" 1/28/13 1 A Bit About Me" Academic credentials" Ph.D. and M.A. in Statistics,
CHAPTER 17 CHI-SQUARE AND OTHER NONPARAMETRIC TESTS FROM: PAGANO, R. R. (2007)
") FROM: PAGANO, R. R. (007) I. INTRODUCTION: DISTINCTION BETWEEN PARAMETRIC AND NON-PARAMETRIC TESTS Statistical inference tests are often classified as to whether they are parametric or nonparametric Parameter
FROM: PAGANO, R. R. (007) I. INTRODUCTION: DISTINCTION BETWEEN PARAMETRIC AND NON-PARAMETRIC TESTS Statistical inference tests are often classified as to whether they are parametric or nonparametric Parameter
Module 9: Nonparametric Statistics Statistics (OA3102)
") Module 9: Nonparametric Statistics Statistics (OA3102) Professor Ron Fricker Naval Postgraduate School Monterey, California Reading assignment: WM&S chapter 15.1-15.6 Revision: 3-12 1 Goals for this Lecture
Module 9: Nonparametric Statistics Statistics (OA3102) Professor Ron Fricker Naval Postgraduate School Monterey, California Reading assignment: WM&S chapter 15.1-15.6 Revision: 3-12 1 Goals for this Lecture
PSY 307 Statistics for the Behavioral Sciences. Chapter 20 Tests for Ranked Data, Choosing Statistical Tests
 PSY 307 Statistics for the Behavioral Sciences Chapter 20 Tests for Ranked Data, Choosing Statistical Tests What To Do with Non-normal Distributions Tranformations (pg 382): The shape of the distribution
Distribution-Free Procedures (Devore Chapter Fifteen)
") Distribution-Free Procedures (Devore Chapter Fifteen) MATH-5-01: Probability and Statistics II Spring 018 Contents 1 Nonparametric Hypothesis Tests 1 1.1 The Wilcoxon Rank Sum Test........... 1 1. Normal
Distribution-Free Procedures (Devore Chapter Fifteen) MATH-5-01: Probability and Statistics II Spring 018 Contents 1 Nonparametric Hypothesis Tests 1 1.1 The Wilcoxon Rank Sum Test........... 1 1. Normal
3. Nonparametric methods
 3. Nonparametric methods If the probability distributions of the statistical variables are unknown or are not as required (e.g. normality assumption violated), then we may still apply nonparametric tests
Non-parametric (Distribution-free) approaches p188 CN
 approaches p188 CN") Week 1: Introduction to some nonparametric and computer intensive (re-sampling) approaches: the sign test, Wilcoxon tests and multi-sample extensions, Spearman s rank correlation; the Bootstrap. (ch14
Week 1: Introduction to some nonparametric and computer intensive (re-sampling) approaches: the sign test, Wilcoxon tests and multi-sample extensions, Spearman s rank correlation; the Bootstrap. (ch14
DETAILED CONTENTS PART I INTRODUCTION AND DESCRIPTIVE STATISTICS. 1. Introduction to Statistics
 DETAILED CONTENTS About the Author Preface to the Instructor To the Student How to Use SPSS With This Book PART I INTRODUCTION AND DESCRIPTIVE STATISTICS 1. Introduction to Statistics 1.1 Descriptive and
THE ROYAL STATISTICAL SOCIETY HIGHER CERTIFICATE
 THE ROYAL STATISTICAL SOCIETY 004 EXAMINATIONS SOLUTIONS HIGHER CERTIFICATE PAPER II STATISTICAL METHODS The Society provides these solutions to assist candidates preparing for the examinations in future
Nonparametric Statistics. Leah Wright, Tyler Ross, Taylor Brown
 Nonparametric Statistics Leah Wright, Tyler Ross, Taylor Brown Before we get to nonparametric statistics, what are parametric statistics? These statistics estimate and test population means, while holding
Dr. Maddah ENMG 617 EM Statistics 10/12/12. Nonparametric Statistics (Chapter 16, Hines)
") Dr. Maddah ENMG 617 EM Statistics 10/12/12 Nonparametric Statistics (Chapter 16, Hines) Introduction Most of the hypothesis testing presented so far assumes normally distributed data. These approaches
Dr. Maddah ENMG 617 EM Statistics 10/12/12 Nonparametric Statistics (Chapter 16, Hines) Introduction Most of the hypothesis testing presented so far assumes normally distributed data. These approaches
Contents Kruskal-Wallis Test Friedman s Two-way Analysis of Variance by Ranks... 47
 Contents 1 Non-parametric Tests 3 1.1 Introduction....................................... 3 1.2 Advantages of Non-parametric Tests......................... 4 1.3 Disadvantages of Non-parametric Tests........................
Non-parametric tests, part A:
 Two types of statistical test: Non-parametric tests, part A: Parametric tests: Based on assumption that the data have certain characteristics or "parameters": Results are only valid if (a) the data are
Nonparametric Methods
 Nonparametric Methods Marc H. Mehlman marcmehlman@yahoo.com University of New Haven Nonparametric Methods, or Distribution Free Methods is for testing from a population without knowing anything about the
Analyzing Small Sample Experimental Data
 Analyzing Small Sample Experimental Data Session 2: Non-parametric tests and estimators I Dominik Duell (University of Essex) July 15, 2017 Pick an appropriate (non-parametric) statistic 1. Intro to non-parametric
Introduction to Statistical Analysis
 Introduction to Statistical Analysis Changyu Shen Richard A. and Susan F. Smith Center for Outcomes Research in Cardiology Beth Israel Deaconess Medical Center Harvard Medical School Objectives Descriptive
NON-PARAMETRIC STATISTICS * (http://www.statsoft.com)
") NON-PARAMETRIC STATISTICS * (http://www.statsoft.com) 1. GENERAL PURPOSE 1.1 Brief review of the idea of significance testing To understand the idea of non-parametric statistics (the term non-parametric
NON-PARAMETRIC STATISTICS * (http://www.statsoft.com) 1. GENERAL PURPOSE 1.1 Brief review of the idea of significance testing To understand the idea of non-parametric statistics (the term non-parametric
Nonparametric statistic methods. Waraphon Phimpraphai DVM, PhD Department of Veterinary Public Health
 Nonparametric statistic methods Waraphon Phimpraphai DVM, PhD Department of Veterinary Public Health Measurement What are the 4 levels of measurement discussed? 1. Nominal or Classificatory Scale Gender,
Parametric versus Nonparametric Statistics-when to use them and which is more powerful? Dr Mahmoud Alhussami
 Parametric versus Nonparametric Statistics-when to use them and which is more powerful? Dr Mahmoud Alhussami Parametric Assumptions The observations must be independent. Dependent variable should be continuous
Data are sometimes not compatible with the assumptions of parametric statistical tests (i.e. t-test, regression, ANOVA)
") BSTT523 Pagano & Gauvreau Chapter 13 1 Nonparametric Statistics Data are sometimes not compatible with the assumptions of parametric statistical tests (i.e. t-test, regression, ANOVA) In particular, data
BSTT523 Pagano & Gauvreau Chapter 13 1 Nonparametric Statistics Data are sometimes not compatible with the assumptions of parametric statistical tests (i.e. t-test, regression, ANOVA) In particular, data
Nonparametric Location Tests: k-sample
 Nonparametric Location Tests: k-sample Nathaniel E. Helwig Assistant Professor of Psychology and Statistics University of Minnesota (Twin Cities) Updated 04-Jan-2017 Nathaniel E. Helwig (U of Minnesota)
CDA Chapter 3 part II
 CDA Chapter 3 part II Two-way tables with ordered classfications Let u 1 u 2... u I denote scores for the row variable X, and let ν 1 ν 2... ν J denote column Y scores. Consider the hypothesis H 0 : X
Contents. Acknowledgments. xix
 Table of Preface Acknowledgments page xv xix 1 Introduction 1 The Role of the Computer in Data Analysis 1 Statistics: Descriptive and Inferential 2 Variables and Constants 3 The Measurement of Variables
Rank-Based Methods. Lukas Meier
 Rank-Based Methods Lukas Meier 20.01.2014 Introduction Up to now we basically always used a parametric family, like the normal distribution N (µ, σ 2 ) for modeling random data. Based on observed data
Comparison of Two Population Means
 Comparison of Two Population Means Esra Akdeniz March 15, 2015 Independent versus Dependent (paired) Samples We have independent samples if we perform an experiment in two unrelated populations. We have
Non-parametric methods
 Eastern Mediterranean University Faculty of Medicine Biostatistics course Non-parametric methods March 4&7, 2016 Instructor: Dr. Nimet İlke Akçay (ilke.cetin@emu.edu.tr) Learning Objectives 1. Distinguish
Nonparametric Statistics
 Nonparametric Statistics Nonparametric or Distribution-free statistics: used when data are ordinal (i.e., rankings) used when ratio/interval data are not normally distributed (data are converted to ranks)
ST4241 Design and Analysis of Clinical Trials Lecture 7: N. Lecture 7: Non-parametric tests for PDG data
 ST4241 Design and Analysis of Clinical Trials Lecture 7: Non-parametric tests for PDG data Department of Statistics & Applied Probability 8:00-10:00 am, Friday, September 2, 2016 Outline Non-parametric
Contents 1. Contents
 Contents 1 Contents 4 Paired Comparisons & Block Designs 3 4.1 Paired Comparisons.................... 3 4.1.1 Paired Data.................... 3 4.1.2 Existing Approaches................ 6 4.1.3 Paired-comparison
Inferential Statistics
 Inferential Statistics Eva Riccomagno, Maria Piera Rogantin DIMA Università di Genova riccomagno@dima.unige.it rogantin@dima.unige.it Part G Distribution free hypothesis tests 1. Classical and distribution-free
Unit 12: Analysis of Single Factor Experiments
 Unit 12: Analysis of Single Factor Experiments Statistics 571: Statistical Methods Ramón V. León 7/16/2004 Unit 12 - Stat 571 - Ramón V. León 1 Introduction Chapter 8: How to compare two treatments. Chapter
Nonparametric tests. Timothy Hanson. Department of Statistics, University of South Carolina. Stat 704: Data Analysis I
 1 / 16 Nonparametric tests Timothy Hanson Department of Statistics, University of South Carolina Stat 704: Data Analysis I Nonparametric one and two-sample tests 2 / 16 If data do not come from a normal
1 ONE SAMPLE TEST FOR MEDIAN: THE SIGN TEST
 NON-PARAMETRIC STATISTICS ONE AND TWO SAMPLE TESTS Non-parametric tests are normally based on ranks of the data samples, and test hypotheses relating to quantiles of the probability distribution representing
Glossary. The ISI glossary of statistical terms provides definitions in a number of different languages:
 Glossary The ISI glossary of statistical terms provides definitions in a number of different languages: http://isi.cbs.nl/glossary/index.htm Adjusted r 2 Adjusted R squared measures the proportion of the
Unit 10: Simple Linear Regression and Correlation
 Unit 10: Simple Linear Regression and Correlation Statistics 571: Statistical Methods Ramón V. León 6/28/2004 Unit 10 - Stat 571 - Ramón V. León 1 Introductory Remarks Regression analysis is a method for
UNIT 4 RANK CORRELATION (Rho AND KENDALL RANK CORRELATION
 UNIT 4 RANK CORRELATION (Rho AND KENDALL RANK CORRELATION Structure 4.0 Introduction 4.1 Objectives 4. Rank-Order s 4..1 Rank-order data 4.. Assumptions Underlying Pearson s r are Not Satisfied 4.3 Spearman
Y i = η + ɛ i, i = 1,...,n.
 Nonparametric tests If data do not come from a normal population (and if the sample is not large), we cannot use a t-test. One useful approach to creating test statistics is through the use of rank statistics.
Lecture 7: Hypothesis Testing and ANOVA
 Lecture 7: Hypothesis Testing and ANOVA Goals Overview of key elements of hypothesis testing Review of common one and two sample tests Introduction to ANOVA Hypothesis Testing The intent of hypothesis
Non-parametric Hypothesis Testing
 Non-parametric Hypothesis Testing Procedures Hypothesis Testing General Procedure for Hypothesis Tests 1. Identify the parameter of interest.. Formulate the null hypothesis, H 0. 3. Specify an appropriate
Nonparametric hypothesis tests and permutation tests
 Nonparametric hypothesis tests and permutation tests 1.7 & 2.3. Probability Generating Functions 3.8.3. Wilcoxon Signed Rank Test 3.8.2. Mann-Whitney Test Prof. Tesler Math 283 Fall 2018 Prof. Tesler Wilcoxon
Agonistic Display in Betta splendens: Data Analysis I. Betta splendens Research: Parametric or Non-parametric Data?
 Agonistic Display in Betta splendens: Data Analysis By Joanna Weremjiwicz, Simeon Yurek, and Dana Krempels Once you have collected data with your ethogram, you are ready to analyze that data to see whether
SAS/STAT 14.1 User s Guide. Introduction to Nonparametric Analysis
 SAS/STAT 14.1 User s Guide Introduction to Nonparametric Analysis This document is an individual chapter from SAS/STAT 14.1 User s Guide. The correct bibliographic citation for this manual is as follows:
Unit 9: Inferences for Proportions and Count Data
 Unit 9: Inferences for Proportions and Count Data Statistics 571: Statistical Methods Ramón V. León 12/15/2008 Unit 9 - Stat 571 - Ramón V. León 1 Large Sample Confidence Interval for Proportion ( pˆ p)
Chapter 18 Resampling and Nonparametric Approaches To Data
 Chapter 18 Resampling and Nonparametric Approaches To Data 18.1 Inferences in children s story summaries (McConaughy, 1980): a. Analysis using Wilcoxon s rank-sum test: Younger Children Older Children
Statistical Significance of Ranking Paradoxes
 Statistical Significance of Ranking Paradoxes Anna E. Bargagliotti and Raymond N. Greenwell 1 February 28, 2009 1 Anna E. Bargagliotti is an Assistant Professor in the Department of Mathematical Sciences
Contents 1. Contents
 Contents 1 Contents 1 One-Sample Methods 3 1.1 Parametric Methods.................... 4 1.1.1 One-sample Z-test (see Chapter 0.3.1)...... 4 1.1.2 One-sample t-test................. 6 1.1.3 Large sample
HYPOTHESIS TESTING II TESTS ON MEANS. Sorana D. Bolboacă
 HYPOTHESIS TESTING II TESTS ON MEANS Sorana D. Bolboacă OBJECTIVES Significance value vs p value Parametric vs non parametric tests Tests on means: 1 Dec 14 2 SIGNIFICANCE LEVEL VS. p VALUE Materials and
Advanced Statistics II: Non Parametric Tests
 Advanced Statistics II: Non Parametric Tests Aurélien Garivier ParisTech February 27, 2011 Outline Fitting a distribution Rank Tests for the comparison of two samples Two unrelated samples: Mann-Whitney
Formulas and Tables by Mario F. Triola
 Copyright 010 Pearson Education, Inc. Ch. 3: Descriptive Statistics x f # x x f Mean 1x - x s - 1 n 1 x - 1 x s 1n - 1 s B variance s Ch. 4: Probability Mean (frequency table) Standard deviation P1A or
Unit 9: Inferences for Proportions and Count Data
 Unit 9: Inferences for Proportions and Count Data Statistics 571: Statistical Methods Ramón V. León 1/15/008 Unit 9 - Stat 571 - Ramón V. León 1 Large Sample Confidence Interval for Proportion ( pˆ p)
SEVERAL μs AND MEDIANS: MORE ISSUES. Business Statistics
 SEVERAL μs AND MEDIANS: MORE ISSUES Business Statistics CONTENTS Post-hoc analysis ANOVA for 2 groups The equal variances assumption The Kruskal-Wallis test Old exam question Further study POST-HOC ANALYSIS
MATH Notebook 3 Spring 2018
 MATH448001 Notebook 3 Spring 2018 prepared by Professor Jenny Baglivo c Copyright 2010 2018 by Jenny A. Baglivo. All Rights Reserved. 3 MATH448001 Notebook 3 3 3.1 One Way Layout........................................
Empirical Power of Four Statistical Tests in One Way Layout
 International Mathematical Forum, Vol. 9, 2014, no. 28, 1347-1356 HIKARI Ltd, www.m-hikari.com http://dx.doi.org/10.12988/imf.2014.47128 Empirical Power of Four Statistical Tests in One Way Layout Lorenzo
BIOL 4605/7220 CH 20.1 Correlation
 BIOL 4605/70 CH 0. Correlation GPT Lectures Cailin Xu November 9, 0 GLM: correlation Regression ANOVA Only one dependent variable GLM ANCOVA Multivariate analysis Multiple dependent variables (Correlation)
What is a Hypothesis?
 What is a Hypothesis? A hypothesis is a claim (assumption) about a population parameter: population mean Example: The mean monthly cell phone bill in this city is μ = $42 population proportion Example:
Transition Passage to Descriptive Statistics 28
 viii Preface xiv chapter 1 Introduction 1 Disciplines That Use Quantitative Data 5 What Do You Mean, Statistics? 6 Statistics: A Dynamic Discipline 8 Some Terminology 9 Problems and Answers 12 Scales of
Introduction to Nonparametric Statistics
 Introduction to Nonparametric Statistics by James Bernhard Spring 2012 Parameters Parametric method Nonparametric method µ[x 2 X 1 ] paired t-test Wilcoxon signed rank test µ[x 1 ], µ[x 2 ] 2-sample t-test
SPSS Guide For MMI 409
 SPSS Guide For MMI 409 by John Wong March 2012 Preface Hopefully, this document can provide some guidance to MMI 409 students on how to use SPSS to solve many of the problems covered in the D Agostino
Selection should be based on the desired biological interpretation!
 Statistical tools to compare levels of parasitism Jen_ Reiczigel,, Lajos Rózsa Hungary What to compare? The prevalence? The mean intensity? The median intensity? Or something else? And which statistical
Everything is not normal
 Everything is not normal According to the dictionary, one thing is considered normal when it s in its natural state or conforms to standards set in advance. And this is its normal meaning. But, like many
STAT Section 5.8: Block Designs
 STAT 518 --- Section 5.8: Block Designs Recall that in paired-data studies, we match up pairs of subjects so that the two subjects in a pair are alike in some sense. Then we randomly assign, say, treatment
STATISTIKA INDUSTRI 2 TIN 4004
 STATISTIKA INDUSTRI 2 TIN 4004 Pertemuan 11 & 12 Outline: Nonparametric Statistics Referensi: Walpole, R.E., Myers, R.H., Myers, S.L., Ye, K., Probability & Statistics for Engineers & Scientists, 9 th
Nonparametric Independence Tests
 Nonparametric Independence Tests Nathaniel E. Helwig Assistant Professor of Psychology and Statistics University of Minnesota (Twin Cities) Updated 04-Jan-2017 Nathaniel E. Helwig (U of Minnesota) Nonparametric
6 Single Sample Methods for a Location Parameter
 6 Single Sample Methods for a Location Parameter If there are serious departures from parametric test assumptions (e.g., normality or symmetry), nonparametric tests on a measure of central tendency (usually
What to do today (Nov 22, 2018)?
?") What to do today (Nov 22, 2018)? Part 1. Introduction and Review (Chp 1-5) Part 2. Basic Statistical Inference (Chp 6-9) Part 3. Important Topics in Statistics (Chp 10-13) Part 4. Further Topics (Selected
What to do today (Nov 22, 2018)? Part 1. Introduction and Review (Chp 1-5) Part 2. Basic Statistical Inference (Chp 6-9) Part 3. Important Topics in Statistics (Chp 10-13) Part 4. Further Topics (Selected
Institute of Actuaries of India
 Institute of Actuaries of India Subject CT3 Probability & Mathematical Statistics May 2011 Examinations INDICATIVE SOLUTION Introduction The indicative solution has been written by the Examiners with the
Statistical Inference Theory Lesson 46 Non-parametric Statistics
 46.1-The Sign Test Statistical Inference Theory Lesson 46 Non-parametric Statistics 46.1 - Problem 1: (a). Let p equal the proportion of supermarkets that charge less than $2.15 a pound. H o : p 0.50 H
4/6/16. Non-parametric Test. Overview. Stephen Opiyo. Distinguish Parametric and Nonparametric Test Procedures
 Non-parametric Test Stephen Opiyo Overview Distinguish Parametric and Nonparametric Test Procedures Explain commonly used Nonparametric Test Procedures Perform Hypothesis Tests Using Nonparametric Procedures
Formulas and Tables. for Elementary Statistics, Tenth Edition, by Mario F. Triola Copyright 2006 Pearson Education, Inc. ˆp E p ˆp E Proportion
 Formulas and Tables for Elementary Statistics, Tenth Edition, by Mario F. Triola Copyright 2006 Pearson Education, Inc. Ch. 3: Descriptive Statistics x Sf. x x Sf Mean S(x 2 x) 2 s Å n 2 1 n(sx 2 ) 2 (Sx)
Basic Statistical Analysis
 indexerrt.qxd 8/21/2002 9:47 AM Page 1 Corrected index pages for Sprinthall Basic Statistical Analysis Seventh Edition indexerrt.qxd 8/21/2002 9:47 AM Page 656 Index Abscissa, 24 AB-STAT, vii ADD-OR rule,
Confidence Intervals, Testing and ANOVA Summary
 Confidence Intervals, Testing and ANOVA Summary 1 One Sample Tests 1.1 One Sample z test: Mean (σ known) Let X 1,, X n a r.s. from N(µ, σ) or n > 30. Let The test statistic is H 0 : µ = µ 0. z = x µ 0
Analysis of variance (ANOVA) Comparing the means of more than two groups
 Comparing the means of more than two groups") Analysis of variance (ANOVA) Comparing the means of more than two groups Example: Cost of mating in male fruit flies Drosophila Treatments: place males with and without unmated (virgin) females Five treatments
Analysis of variance (ANOVA) Comparing the means of more than two groups Example: Cost of mating in male fruit flies Drosophila Treatments: place males with and without unmated (virgin) females Five treatments
Statistical Procedures for Testing Homogeneity of Water Quality Parameters
 Statistical Procedures for ing Homogeneity of Water Quality Parameters Xu-Feng Niu Professor of Statistics Department of Statistics Florida State University Tallahassee, FL 3306 May-September 004 1. Nonparametric
Session 3 The proportional odds model and the Mann-Whitney test
 Session 3 The proportional odds model and the Mann-Whitney test 3.1 A unified approach to inference 3.2 Analysis via dichotomisation 3.3 Proportional odds 3.4 Relationship with the Mann-Whitney test Session
Non-parametric Tests
 Statistics Column Shengping Yang PhD,Gilbert Berdine MD I was working on a small study recently to compare drug metabolite concentrations in the blood between two administration regimes. However, the metabolite
One-Sample Numerical Data
 One-Sample Numerical Data quantiles, boxplot, histogram, bootstrap confidence intervals, goodness-of-fit tests University of California, San Diego Instructor: Ery Arias-Castro http://math.ucsd.edu/~eariasca/teaching.html
Introduction to Nonparametric Analysis (Chapter)
") SAS/STAT 9.3 User s Guide Introduction to Nonparametric Analysis (Chapter) SAS Documentation This document is an individual chapter from SAS/STAT 9.3 User s Guide. The correct bibliographic citation for
SAS/STAT 9.3 User s Guide Introduction to Nonparametric Analysis (Chapter) SAS Documentation This document is an individual chapter from SAS/STAT 9.3 User s Guide. The correct bibliographic citation for
Comparison of Two Samples
 2 Comparison of Two Samples 2.1 Introduction Problems of comparing two samples arise frequently in medicine, sociology, agriculture, engineering, and marketing. The data may have been generated by observation
Frequency table: Var2 (Spreadsheet1) Count Cumulative Percent Cumulative From To. Percent <x<=
 Count Cumulative Percent Cumulative From To. Percent <x<=") A frequency distribution is a kind of probability distribution. It gives the frequency or relative frequency at which given values have been observed among the data collected. For example, for age, Frequency
A frequency distribution is a kind of probability distribution. It gives the frequency or relative frequency at which given values have been observed among the data collected. For example, for age, Frequency
Data Analysis: Agonistic Display in Betta splendens I. Betta splendens Research: Parametric or Non-parametric Data?
 Data Analysis: Agonistic Display in Betta splendens By Joanna Weremjiwicz, Simeon Yurek, and Dana Krempels Once you have collected data with your ethogram, you are ready to analyze that data to see whether
Kruskal-Wallis and Friedman type tests for. nested effects in hierarchical designs 1
 Kruskal-Wallis and Friedman type tests for nested effects in hierarchical designs 1 Assaf P. Oron and Peter D. Hoff Department of Statistics, University of Washington, Seattle assaf@u.washington.edu, hoff@stat.washington.edu
Statistical. Psychology
 SEVENTH у *i km m it* & П SB Й EDITION Statistical M e t h o d s for Psychology D a v i d C. Howell University of Vermont ; \ WADSWORTH f% CENGAGE Learning* Australia Biaall apan Korea Меяко Singapore
Wilcoxon Test and Calculating Sample Sizes
 Wilcoxon Test and Calculating Sample Sizes Dan Spencer UC Santa Cruz Dan Spencer (UC Santa Cruz) Wilcoxon Test and Calculating Sample Sizes 1 / 33 Differences in the Means of Two Independent Groups When
AMS7: WEEK 7. CLASS 1. More on Hypothesis Testing Monday May 11th, 2015
 AMS7: WEEK 7. CLASS 1 More on Hypothesis Testing Monday May 11th, 2015 Testing a Claim about a Standard Deviation or a Variance We want to test claims about or 2 Example: Newborn babies from mothers taking
Statistics Handbook. All statistical tables were computed by the author.
 Statistics Handbook Contents Page Wilcoxon rank-sum test (Mann-Whitney equivalent) Wilcoxon matched-pairs test 3 Normal Distribution 4 Z-test Related samples t-test 5 Unrelated samples t-test 6 Variance
Nonparametric Statistics Notes
 Nonparametric Statistics Notes Chapter 5: Some Methods Based on Ranks Jesse Crawford Department of Mathematics Tarleton State University (Tarleton State University) Ch 5: Some Methods Based on Ranks 1
S D / n t n 1 The paediatrician observes 3 =
 Non-parametric tests Paired t-test A paediatrician measured the blood cholesterol of her patients and was worried to note that some had levels over 00mg/100ml To investigate whether dietary regulation
Lecture 2: Descriptive statistics, normalizations & testing
 Lecture 2: Descriptive statistics, normalizations & testing From sequences to OTU table Sequencing Sample 1 Sample 2... Sample N Abundances of each microbial taxon in each of the N samples 2 1 Normalizing
E509A: Principle of Biostatistics. (Week 11(2): Introduction to non-parametric. methods ) GY Zou.
: Introduction to non-parametric. methods ) GY Zou.") E509A: Principle of Biostatistics (Week 11(2): Introduction to non-parametric methods ) GY Zou gzou@robarts.ca Sign test for two dependent samples Ex 12.1 subj 1 2 3 4 5 6 7 8 9 10 baseline 166 135 189
E509A: Principle of Biostatistics (Week 11(2): Introduction to non-parametric methods ) GY Zou gzou@robarts.ca Sign test for two dependent samples Ex 12.1 subj 1 2 3 4 5 6 7 8 9 10 baseline 166 135 189
ANOVA - analysis of variance - used to compare the means of several populations.
 12.1 One-Way Analysis of Variance ANOVA - analysis of variance - used to compare the means of several populations. Assumptions for One-Way ANOVA: 1. Independent samples are taken using a randomized design.
N Utilization of Nursing Research in Advanced Practice, Summer 2008
 University of Michigan Deep Blue deepblue.lib.umich.edu 2008-07 536 - Utilization of ursing Research in Advanced Practice, Summer 2008 Tzeng, Huey-Ming Tzeng, H. (2008, ctober 1). Utilization of ursing
This does not cover everything on the final. Look at the posted practice problems for other topics.
 Class 7: Review Problems for Final Exam 8.5 Spring 7 This does not cover everything on the final. Look at the posted practice problems for other topics. To save time in class: set up, but do not carry
Bivariate Paired Numerical Data
 Bivariate Paired Numerical Data Pearson s correlation, Spearman s ρ and Kendall s τ, tests of independence University of California, San Diego Instructor: Ery Arias-Castro http://math.ucsd.edu/~eariasca/teaching.html
QUANTITATIVE TECHNIQUES
 UNIVERSITY OF CALICUT SCHOOL OF DISTANCE EDUCATION (For B Com. IV Semester & BBA III Semester) COMPLEMENTARY COURSE QUANTITATIVE TECHNIQUES QUESTION BANK 1. The techniques which provide the decision maker
We know from STAT.1030 that the relevant test statistic for equality of proportions is:
 2. Chi 2 -tests for equality of proportions Introduction: Two Samples Consider comparing the sample proportions p 1 and p 2 in independent random samples of size n 1 and n 2 out of two populations which
TA: Sheng Zhgang (Th 1:20) / 342 (W 1:20) / 343 (W 2:25) / 344 (W 12:05) Haoyang Fan (W 1:20) / 346 (Th 12:05) FINAL EXAM
 / 342 (W 1:20) / 343 (W 2:25) / 344 (W 12:05) Haoyang Fan (W 1:20) / 346 (Th 12:05) FINAL EXAM") STAT 301, Fall 2011 Name Lec 4: Ismor Fischer Discussion Section: Please circle one! TA: Sheng Zhgang... 341 (Th 1:20) / 342 (W 1:20) / 343 (W 2:25) / 344 (W 12:05) Haoyang Fan... 345 (W 1:20) / 346 (Th
STAT 301, Fall 2011 Name Lec 4: Ismor Fischer Discussion Section: Please circle one! TA: Sheng Zhgang... 341 (Th 1:20) / 342 (W 1:20) / 343 (W 2:25) / 344 (W 12:05) Haoyang Fan... 345 (W 1:20) / 346 (Th