Raster Data Enhancement and Tectonic Element Interpretation in ArcMap
|
|
|
- Cordelia Nicholson
- 5 years ago
- Views:
Transcription

1 Raster Data Enhancement and Tectonic Element Interpretation in ArcMap Vsevolod Egorov ESRI Petroleum User Group Conference Houston, TX 2005
2 Abstract ArcMap Spatial Analyst provides quick, but powerful tools for the geoscientist. Digital elevation models and a variety of geophysical data are utilized in raster grid format. ArcMap Spatial Analyst allows us to enhance these data and map lineament features (e.g., faults, dykes, and drainage patterns), which are necessary components of tectonic interpretation. The interpreted tectonic elements are output in vector format (e.g., shape files) and may be incorporated in many GIS products. This methodology may be applied to both topographic and geophysical (gravity, magnetic, and seismic) data. These data complement each other and enable a more complete interpretation. This presentation covers an easy-to-implement approach to enhance raster grid data in ArcMap environment, and the subsequent mapping of geomorphologic and geologic features. The examples are presented from the oil and gas exploration areas of North America and Africa.
3 Outline Objectives Data Raster Data Enhancement Basics Paradox Basin: Salt-Cored Anticlines and Igneous Intrusions Drainage Pattern as a Geological Indicator Conclusions
4 Objectives Introduce basic theory of raster data enhancement in ArcMap Spatial Analyst Demonstrate enhancements of data used in oil and gas exploration Demonstrate use of enhanced data for geomorphologic and geologic features mapping (Note: This work is not intended to be a complete interpretation project, but rather illustrates some techniques that may be utilized by the interpreter in the ArcMap environment.)
5 Data Terrain Data SRTM30 data available from U.S. Geological Survey, EROS Data Center, Sioux Falls, SD: Aeromagnetic Data Courtesy of Fugro Airborne Surveys Corp. Gravity Data UTEP-USGS-NGA-NOAA Gravity Database GeoNet - US Gravity Data Repository System:
6 Outline Objectives Data Raster Data Enhancement Basics Paradox Basin: Salt-Cored Anticlines and Igneous Intrusions Drainage Pattern as a Geological Indicator Conclusions
7 Interpretation Workflow INPUT Raster (Terrain, Gravity, Magnetic, Seismic Horizon Grids) Enhancements Raster (Computational and Visual) Interpretation Raster to Vector (Terrain and Geologic Features Mapping) OUTPUT Vector (Tectonic Element Map) Integration Raster to Vector (Cross-Reference between Different Enhancements)
8 Enhancements Computational Visual -Low Pass Filter -High Pass Filter -Horizontal Gradient/ Maximum Slope -Vertical Gradient -2 nd Vertical Gradient -etc. -Aspect/Dip Direction -Color Schemes -Hillshade
9 Gravity/Magnetic Field Observed over the Body Terrain Maximum Slope of the Field (Amplitude of Horizontal Gradient) Maximum Slope of Terrain Slope enhances edges of the subsurface body or terrain feature.
 shows dip direction of the model surfaces")

10 Slope anomalies (top) over the model (bottom). Aspect (top) shows dip direction of the model surfaces (bottom) in colors (yellow flat, red east, blue west). ArcMap Spatial Analyst slope and aspect calculated over the model.
11 Outline Objectives Data Raster Data Enhancement Basics Paradox Basin: Salt-Cored Anticlines and Igneous Intrusions Drainage Pattern as a Surface and Deep Geology Indicator Conclusions

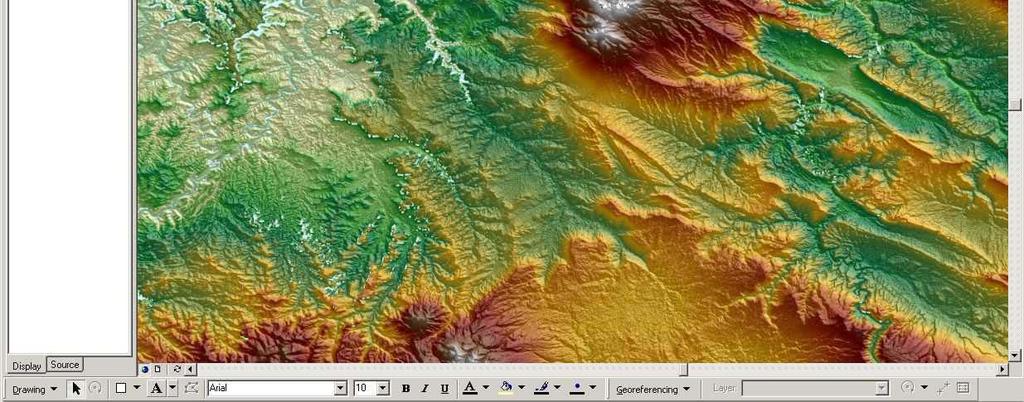
12 Paradox Basin: Terrain.


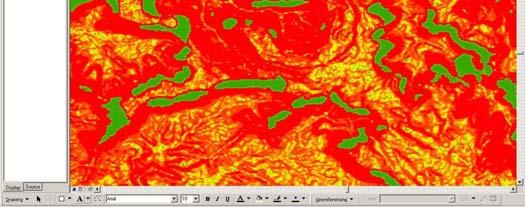
13 Paradox Basin: Slope of terrain calculated in Spatial Analyst.


14 Paradox Basin: The slope of terrain map is used to map saltcored anticlines. Mapped features are saved in vector data format - a polygon shape file.

15 Paradox Basin: The slope of total magnetic field calculated in Spatial Analyst. (Data are courtesy of FAS Corp.)


16 Paradox Basin: The slope of total magnetic field is used to map high-gradient zones indicators of possible igneous intrusions. Note that salt-cored anticlines are not high-gradient magnetic zones. (Data are courtesy of FAS Corp.)


17 Paradox Basin: The slope of Bouguer gravity anomaly calculated in Spatial Analyst overlain on the shaded terrain.


18 Paradox Basin: The slope of Bouguer gravity anomaly confirms positions of the salt-cored anticlines and shows their subsurface extent. Note that gravity data primarily reflect sedimentary structures.


19 Paradox Basin: Hillshade of terrain is another visual enhancement of Spatial Analyst. The mapped features previously saved as shape files are overlain on the raster image.


20 Shaded Terrain Hillshade Slope Aspect of Slope Paradox Basin: Spatial Analyst terrain enhancements of the Upheaval Dome a fascinating geologic feature of Utah.


21 Hillshade Slope Paradox Basin: Spatial Analyst terrain enhancements of the Disappointment Syncline.
22 Outline Objectives Data Raster Data Enhancement Basics Paradox Basin: Salt-Cored Anticlines and Igneous Intrusions Drainage Pattern as a Geological Indicator Conclusions


23 Drainage Pattern Analysis: Hillshade function applied to terrain data in Spatial Analyst.


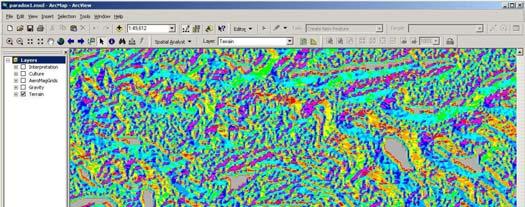
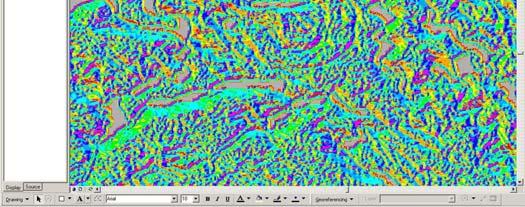
24 Drainage Pattern Analysis: Aspect of Slope function applied to terrain data to enhance surface fabric.


25 Drainage Pattern Analysis: Drainage pattern and possible faults/contacts are mapped based on Aspect of Slope map.
26 Conclusions Tools available in ArcMap Spatial Analyst provide useful computational and visual enhancements of raster data. Terrain, gravity, magnetic and any other raster data (e.g., seismic horizons) important for geological interpretation can be imported into ArcMap and enhanced using these tools. Different data (and their enhancements) complement each other in identifying geomorphologic and geologic features. ArcMap editing tools allow mapping of these features in vector format, and storing the results as shape files that may be incorporated in the tectonic element map and other interpretive map products in GIS applications.
27 Acknowledgments: Fugro Robertson Inc. for the opportunity to present this work, and personally Robert Pawlowski and Rao Yalamanchili for their help and encouragement. Fugro Airborne Surveys Corp. for the opportunity to use and present its aeromagnetic data. My special thanks to Jeffrey Rowe, Leanne Isaac, and Ron Lyall. Dr. Randy Keller, University of Texas at El Paso, for his cooperation and introducing me to the great gravity dataset compiled by his group.
28 Selected References Keller, G. R., T. G. Hildenbrand, R. Kucks, M. Webring, Allen Briesacher, Kristine Rujawitz, A. M. Hittelman, D. Roman, D. Winester, R. Aldouri, R. Torres, W. J. Hinze, A. Gates, and J. Seeley, 2005, A community effort to construct a gravity database for the United States and an associated web portal: Contribution to Geological Society of America Special Paper on Geoinformatics, accepted pending minor revision.
29 Author Information Vsevolod Egorov Geophysicist Fugro Robertson Inc Hillcroft, 5 th Floor Houston, TX Direct : Main : Fax : vegorov@fugro.com
Horizontal gradient and band-pass filter of aeromagnetic data image the subsurface structure; Example from Esh El Mellaha Area, Gulf of Suez, Egypt.
 Horizontal gradient and band-pass filter of aeromagnetic data image the subsurface structure; Example from Esh El Mellaha Area, Gulf of Suez, Egypt. Essam Aboud 1, Serguei Goussev 2, Hassan Hassan 2, Suparno
Predictive Modelling of Ag, Au, U, and Hg Ore Deposits in West Texas Carl R. Stockmeyer. December 5, GEO 327G
 Predictive Modelling of Ag, Au, U, and Hg Ore Deposits in West Texas Carl R. Stockmeyer December 5, 2013 - GEO 327G Objectives and Motivations The goal of this project is to use ArcGIS to create models
Lauren Jacob May 6, Tectonics of the Northern Menderes Massif: The Simav Detachment and its relationship to three granite plutons
 Lauren Jacob May 6, 2010 Tectonics of the Northern Menderes Massif: The Simav Detachment and its relationship to three granite plutons I. Introduction: Purpose: While reading through the literature regarding
Airborne gravity gradiometer surveying of petroleum systems under Lake Tanganyika, Tanzania
 Airborne gravity gradiometer surveying of petroleum systems under Lake Tanganyika, Tanzania D. Roberts Beach Energy P. Roy Chowdhury CGG S. J. Lowe CGG A. N. Christensen CGG Outline Introduction Geology
Gravity and Magnetic Anomalies Compared to Moho Depth throughout the State of Texas
 Gravity and Magnetic Anomalies Compared to Moho Depth throughout the State of Texas Taylor Borgfeldt Introduction My Master s thesis is to improve and create additional crustal seismic velocity models
3D Geometry of the Xade Complex inferred from Gravity and Magnetic Data
 Geophysical Case Histories 3D Geometry of the Xade Complex inferred from Gravity and Magnetic Data 1. British Geological Survey, Edinburgh, United Kingdom Paper 92 Pouliquen, G. [1], Key, R. [1] ABSTRACT
ERDAS ER Mapper Software
 ERDAS ER Mapper Software ER Mapper professional software is widely used in exploration industry and geologist worldwide for satellite image exploitation. It is known for its:- Powerful image processing
GIS helps to understand prospectivity of shale plays
 GIS helps to understand prospectivity of shale plays Roman Boros, Ph.D. 2015 ESRI International User Conference San Diego, July 21, 2015 This document is the property of Rystad Energy. The document must
Watershed Delineation
 Watershed Delineation Jessica L. Watkins, University of Georgia 2 April 2009 Updated by KC Love February 25, 2011 PURPOSE For this project, I delineated watersheds for the Coweeta synoptic sampling area
Imaging VTEM Data: Mapping Contamination Plumes In Tarlton, South Africa
 Imaging VTEM Data: Mapping Contamination Plumes In Tarlton, South Africa M. Combrinck Geotech Airborne Limited Summary VTEM data were acquired during a test survey flown over the Tarlton region in South
2013 Esri Europe, Middle East and Africa User Conference October 23-25, 2013 Munich, Germany
 2013 Esri Europe, Middle East and Africa User Conference October 23-25, 2013 Munich, Germany Environmental and Disaster Management System in the Valles Altos Region in Carabobo / NW-Venezuela Prof.Dr.habil.Barbara
Aeromagnetic map of the Death Valley ground-water model area, Nevada and California
 Aeromagnetic map of the Death Valley ground-water model area, Nevada and California By D.A. Ponce and R.J. Blakely Prepared in cooperation with the Nevada Operations Office National Nuclear Security Administration
GIS Project: Study on Gulf of Mexico basin provenance in Lower Miocene
 GIS Project: Study on Gulf of Mexico basin provenance in Lower Miocene Introduction Background: The Lower Miocene of the Gulf of Mexico (GOM) Basin is a transitional unit from many respects. It is a time
MPM Online Tool ArcSDM 5 Final Seminar May 4 th 2018, Rovaniemi
 http://gtkdata.gtk.fi/mpm/ ArcSDM 5 Final Seminar May 4 th 2018, Rovaniemi Funding 2 Vesa Nykänen/ArcSDM5 Seminar 4.5. 2018 http://gtkdata.gtk.fi/mpm/ 3 Vesa Nykänen/ArcSDM5 Seminar 4.5. 2018 http://gtkdata.gtk.fi/mpm/
GeoWEPP Tutorial Appendix
 GeoWEPP Tutorial Appendix Chris S. Renschler University at Buffalo - The State University of New York Department of Geography, 116 Wilkeson Quad Buffalo, New York 14261, USA Prepared for use at the WEPP/GeoWEPP
Determining the Location of the Simav Fault
 Lindsey German May 3, 2012 Determining the Location of the Simav Fault 1. Introduction and Problem Formulation: The issue I will be focusing on involves interpreting the location of the Simav fault in
Software for Earth Science Mapping and Processing.
 Software for Earth Science Mapping and Processing www.geosoft.com We remain focused on usability and productivity advances within the Geosoft environment, allowing us to put more power, flexibility and
Hydrology and Watershed Analysis
 Hydrology and Watershed Analysis Manual By: Elyse Maurer Reference Map Figure 1. This map provides context to the area of Washington State that is being focused on. The red outline indicates the boundary
C5 Magnetic exploration methods data analysis techniques
 C5 Magnetic exploration methods data analysis techniques C5.1 Data processing and corrections After magnetic field data have been collected a number of corrections are applied to simplify the interpretation.
Welcome to NR502 GIS Applications in Natural Resources. You can take this course for 1 or 2 credits. There is also an option for 3 credits.
 Welcome to NR502 GIS Applications in Natural Resources. You can take this course for 1 or 2 credits. There is also an option for 3 credits. The 1st credit consists of a series of readings, demonstration,
GeoSUR SRTM 30-m / TPS
 GeoSUR SRTM 30-m / TPS Wm Matthew Cushing (USGS) 16 May 2013 U.S. Department of the Interior U.S. Geological Survey SRTM Mission Shuttle Radar Topography Mission (SRTM) Space Shuttle Endeavour during the
ENGRG Introduction to GIS
 ENGRG 59910 Introduction to GIS Michael Piasecki March 17, 2014 Lecture 08: Terrain Analysis Outline: Terrain Analysis Earth Surface Representation Contour TIN Mass Points Digital Elevation Models Slope
GEON: ArcIMS online mapping to facilitate integration of geoscience data
 GEON: ArcIMS online mapping to facilitate integration of geoscience data J Ramón Arrowsmith 1,G.R.Keller 2, J. Conner 1, J. Yoburn 1,L.Prashad 1, C. Eisinger 1, W.L. Stefanov 1,M.J. Fouch 1 1 Department
OZ SEEBASE TM. Datasets. Digital Elevation Model
 Digital Elevation Model 10 Digital Elevation Models (DEM s) often show the youngest structures, and any active geological structures. They are widely used for neotectonic analysis. The composition of eroding
Final Project: Geodatabase of Mule Mountains Area, southeastern Arizona
 R. Aisner 11/24/09 GEO 386G Final Project: Geodatabase of Mule Mountains Area, southeastern Arizona Project goal: Develop a geodatabase with vector and raster data for future data organization and analysis.
Using Earthscope and B4 LiDAR data to analyze Southern California s active faults
 Using Earthscope and B4 LiDAR data to analyze Southern California s active faults Exercise 8: Simple landscape morphometry and stream network delineation Introduction This exercise covers sample activities
Mineral Exploration Using GIS
 King Fahad University of Petroleum and Minerals City and Regional Planning Department CRP 514: Introduction to GIS Term 112 Mineral Exploration Using GIS Term paper presentation By Mutasim Osman ID # g201105050
Delineation of Watersheds
 Delineation of Watersheds Adirondack Park, New York by Introduction Problem Watershed boundaries are increasingly being used in land and water management, separating the direction of water flow such that
Geological Mapping Using EO Data for Onshore O&G Exploration
 Geological Mapping Using EO Data for Onshore O&G Exploration Michael Hall ESA Oil and Gas Workshop, Frascati, Italy michael.hall@infoterra-global.com Why use EO data for Geological Mapping? Availability
Data Structures & Database Queries in GIS
 Data Structures & Database Queries in GIS Objective In this lab we will show you how to use ArcGIS for analysis of digital elevation models (DEM s), in relationship to Rocky Mountain bighorn sheep (Ovis
Petroleum Exploration
 Petroleum Exploration Upstream Petroleum Exploration The role of exploration is to provide the information required to exploit the best opportunities presented in the choice of areas, and to manage research
Darnley Bay Resources Preliminary Airborne Survey Results
 4 King Street West, Suite 1103 Toronto, Ontario M5H 1B6, Canada Tel:(416) 862-7885 Fax:(416) 862-7889 dbr@darnleybay.com UPDATE Trading Symbol: DBL. TSX Venture Exchange April 19, 2010 Darnley Bay Resources
EnvSci 360 Computer and Analytical Cartography
 EnvSci 360 Computer and Analytical Cartography Lecture 7 Mapping Images, Surfaces, and 3-D Data Brief Overview of Imagery What is Imagery? A spatial data model that defines space as an array of equally
4. GIS Implementation of the TxDOT Hydrology Extensions
 4. GIS Implementation of the TxDOT Hydrology Extensions A Geographic Information System (GIS) is a computer-assisted system for the capture, storage, retrieval, analysis and display of spatial data. It
ENGRG Introduction to GIS
 ENGRG 59910 Introduction to GIS Michael Piasecki November 17, 2017 Lecture 11: Terrain Analysis Outline: Terrain Analysis Earth Surface Representation Contour TIN Mass Points Digital Elevation Models Slope
Reducing Complex Spatial Data Management Needs in and Upstream Oil and Gas Operations Team. Jason Wilson GIS Business Analyst SM Energy
 Reducing Complex Spatial Data Management Needs in and Upstream Oil and Gas Operations Team Jason Wilson GIS Business Analyst SM Energy Agenda About Myself and SM Energy The Challenge The Goal Solution
Gravity reduction spreadsheet to calculate the Bouguer anomaly using standardized methods and constants
 Gravity reduction spreadsheet to calculate the Bouguer anomaly using standardized methods and constants Derek I. Holom John S. Oldow Department of Geological Sciences, University of Idaho, Moscow, Idaho
FALCON AGG inversion to constrain 3D geological models in the Glyde Sub-Basin, Northern Territory
 FALCON AGG inversion to constrain 3D geological models in the Glyde Sub-Basin, Northern Territory Peter Kovac 1, Luke Titus 2, Carlos Cevallos 3, Josh Bluett 2, Fabio Vergara 3 1 CGG GravMag Solutions,
Integrating potential field data with seismic, geochemistry and structural geology. Prepared for: Finding Petroleum
 Integrating potential field data with seismic, geochemistry and structural geology Prepared for: Finding Petroleum Contents Historical issues Non-integration Present day, integration Seismic planning Mapping
Popular Mechanics, 1954
 Introduction to GIS Popular Mechanics, 1954 1986 $2,599 1 MB of RAM 2017, $750, 128 GB memory, 2 GB of RAM Computing power has increased exponentially over the past 30 years, Allowing the existence of
Dr. Raed Aldouri Regional Geospatial Center Department of Civil Engineering
 Dr. Raed Aldouri Regional Geospatial Center Department of Civil Engineering Education Doctor of Philosophy in Geophysics (PhD), University of Texas at El Paso, 2006. M.S. in Geophysics, University of Colorado
Enhancing exploration opportunities at Broken Hill with airborne gravity gradiometry
 Enhancing exploration opportunities at Broken Hill with airborne gravity gradiometry Richard Lane Paper presented at the NSW Department of Mineral Resources Exploration NSW Geoscience information Release
Assessing our untapped energy resources. Derek Reay Geological Survey of Northern Ireland
 Assessing our untapped energy resources Derek Reay Geological Survey of Northern Ireland Talk Outline Northern Ireland energy market Oil and Gas Exploration Description Exploration risks Application of
Evidence Linking Surface Lineaments, Deep-Seated Faults and Fracture-Controlled Fluid Movement in the Williston Basin
 Evidence Linking Surface Lineaments, Deep-Seated Faults and Fracture-Controlled Fluid Movement in the Williston Basin Lynden Penner J.D. Mollard and Associates Limited Regina, SK Canada 14 th Williston
PROANA A USEFUL SOFTWARE FOR TERRAIN ANALYSIS AND GEOENVIRONMENTAL APPLICATIONS STUDY CASE ON THE GEODYNAMIC EVOLUTION OF ARGOLIS PENINSULA, GREECE.
 PROANA A USEFUL SOFTWARE FOR TERRAIN ANALYSIS AND GEOENVIRONMENTAL APPLICATIONS STUDY CASE ON THE GEODYNAMIC EVOLUTION OF ARGOLIS PENINSULA, GREECE. Spyridoula Vassilopoulou * Institute of Cartography
P2061 Relinquishment Report
 Document last updated 23-07-2015 12:28 CEST 1 Licence Information 1 2 Licence Synopsis 2 3 Work Program 4 4 Database 8 4.1 Seismic 8 4.2 Gravity and Magnetics 10 5 Prospectivity Update 12 6 Resource and
Key Processes
 Data Manipulation and Extraction Key Processes Key Processes Re-Projecting Data Selecting by Attributes Exporting Data Hillshade Reclassification Conversion of Raster to Vector Re-Projecting Data Purpose
International Journal of Remote Sensing & Geoscience (IJRSG) ASTER DEM BASED GEOLOGICAL AND GEOMOR-
 ASTER DEM BASED GEOLOGICAL AND GEOMOR-") ASTER DEM BASED GEOLOGICAL AND GEOMOR- PHOLOGICAL INVESTIGATION USING GIS TECHNOLOGY IN KOLLI HILL, SOUTH INDIA Gurugnanam.B, Centre for Applied Geology, Gandhigram Rural Institute-Deemed University, Tamilnadu,
ASTER DEM BASED GEOLOGICAL AND GEOMOR- PHOLOGICAL INVESTIGATION USING GIS TECHNOLOGY IN KOLLI HILL, SOUTH INDIA Gurugnanam.B, Centre for Applied Geology, Gandhigram Rural Institute-Deemed University, Tamilnadu,
Structure contours on Abo Formation (Lower Permian) Northwest Shelf of Permian Basin
 Northwest Shelf of Permian Basin") Structure contours on Abo Formation (Lower Permian) Northwest Shelf of Permian Basin By Ronald F. Broadhead 1, Lewis Gillard 1, and Nilay Engin 2 1 New Mexico Bureau of Geology and Mineral Resources, a
Structure contours on Abo Formation (Lower Permian) Northwest Shelf of Permian Basin By Ronald F. Broadhead 1, Lewis Gillard 1, and Nilay Engin 2 1 New Mexico Bureau of Geology and Mineral Resources, a
MOKWA (Sheet 41) 1:250,000 GEOPHYSICAL MAP SERIES AND INTERPRETATION
 1:250,000 GEOPHYSICAL MAP SERIES AND INTERPRETATION") TECHNICAL ASSISTANCE FOR THE INTERPRETATION OF AIRBORNE GEOPHYSICAL SURVEY Contract No. SMMRP/C.2.1/CON/07/02 MOKWA (Sheet 41) 1:250,000 GEOPHYSICAL MAP SERIES AND INTERPRETATION Prepared for Federal Republic
TECHNICAL ASSISTANCE FOR THE INTERPRETATION OF AIRBORNE GEOPHYSICAL SURVEY Contract No. SMMRP/C.2.1/CON/07/02 MOKWA (Sheet 41) 1:250,000 GEOPHYSICAL MAP SERIES AND INTERPRETATION Prepared for Federal Republic
INTEGRATED GEOPHYSICAL INTERPRETATION METHODS FOR HYDROCARBON EXPLORATION
 INTEGRATED GEOPHYSICAL INTERPRETATION METHODS FOR HYDROCARBON EXPLORATION Instructor : Kumar Ramachandran 31 July 4 August 2017 Jakarta COURSE OUTLINE The course is aimed at imparting working knowledge
Integrated interpretation of multimodal geophysical data for exploration of geothermal resources Case study: Yamagawa geothermal field in Japan
 Integrated interpretation of multimodal geophysical data for exploration of geothermal resources Case study: Yamagawa geothermal field in Japan Masashi Endo*(TechnoImaging), Alex Gribenko (TechnoImaging
Potential Field investigation of Williston Basin Basement
 Potential Field investigation of Williston Basin Basement Jiakang Li* and Igor Morozov, University of Saskatchewan, Canada Summary Major faults and domains are identified in the Precambrian basement of
Tectonic Interpretation Using Potential Field Data for the Sweetgrass Arch Area, Montana-Alberta, Saskatchewan
 Tectonic Interpretation Using Potential Field Data for the Sweetgrass Arch Area, Montana-Alberta, Saskatchewan Clark Jorgensen Big Sky Geophysics, Bozeman, Montana ABSTRACT I performed a basement tectonic
Measuring earthquake-generated surface offsets from high-resolution digital topography
 Measuring earthquake-generated surface offsets from high-resolution digital topography July 19, 2011 David E. Haddad david.e.haddad@asu.edu Active Tectonics, Quantitative Structural Geology, and Geomorphology
The Gulf of Mexico - From Various Vantage Points John E. Bain, Kenton J. Hamilton
 The Gulf of Mexico - From Various Vantage Points John E. Bain, Kenton J. Hamilton Oftentimes in exploration geophysics we tend to focus on specific near-term exploration prospects, as dictated by the current
GRAVITY AND MAGNETIC SURVEY NECHAKO BASIN STUDY ACQUISITION AND PROCESSING PHASE
 GRAVITY AND MAGNETIC SURVEY NECHAKO BASIN STUDY ACQUISITION AND PROCESSING PHASE Report prepared for the B.C. Ministry of Energy and Mines Resource Development Division New Ventures Branch by Bemex Consulting
GIS feature extraction tools in diverse landscapes
 CE 394K.3 GIS in Water Resources GIS feature extraction tools in diverse landscapes Final Project Anna G. Kladzyk M.S. Candidate, Expected 2015 Department of Environmental and Water Resources Engineering
NR402 GIS Applications in Natural Resources
 NR402 GIS Applications in Natural Resources Lesson 1 Introduction to GIS Eva Strand, University of Idaho Map of the Pacific Northwest from http://www.or.blm.gov/gis/ Welcome to NR402 GIS Applications in
Meandering Miocene Deep Sea Channel Systems Offshore Congo, West Africa
 Meandering Miocene Deep Sea Channel Systems Offshore Congo, West Africa S. Baer* (PGS), J. E. Comstock (PGS), K. Vrålstad (PGS), R. Borsato (PGS), M. Martin (PGS), J.P. Saba (SNPC), B. Débi-Obambé (SNPC)
MUHAMMAD S TAMANNAI, DOUGLAS WINSTONE, IAN DEIGHTON & PETER CONN, TGS Nopec Geological Products and Services, London, United Kingdom
 Geological and Geophysical Evaluation of Offshore Morondava Frontier Basin based on Satellite Gravity, Well and regional 2D Seismic Data Interpretation MUHAMMAD S TAMANNAI, DOUGLAS WINSTONE, IAN DEIGHTON
CHAPTER FOUR GEOPHYSICAL INTERPRETATION AND DISCUSSION
 CHAPTER FOUR GEOPHYSICAL INTERPRETATION AND DISCUSSION 4.1. DATA PROCESSING AND INTERPRETATION 4.1.1. Introduction Processing of potential field data entails the application of various filters to the data
GEON: Geosciences Network
 GEON: Geosciences Network A Research Project to Create Cyberinfrastructure for the Geosciences Dogan Seber San Diego Supercomputer Center, University of California, San Diego Objectives An in-depth look
DENR s Oil and Gas Initiative. Legislative briefing March 7, 2011 by DENR s Geological Survey Program
 DENR s Oil and Gas Initiative Legislative briefing March 7, 2011 by DENR s Geological Survey Program South Dakota DOES have exploration for and production of oil and gas Taken from http://denr.sd.gov/des/og/producti.aspx
Managing and Modeling Time-series Geoscience Data in GIS
 Managing and Modeling Time-series Geoscience Data in GIS LARRY ZHANG emap Division, Saudi Aramco West Park 1, Dhahran 31311, Saudi Arabia Email: zhang.huaisu@aramco.com Abstract Many oil and mining companies
Seismic Attributes and Their Applications in Seismic Geomorphology
 Academic article Seismic Attributes and Their Applications in Seismic Geomorphology Sanhasuk Koson, Piyaphong Chenrai* and Montri Choowong Department of Geology, Faculty of Science, Chulalongkorn University,
Geo 327G Semester Project. Landslide Suitability Assessment of Olympic National Park, WA. Fall Shane Lewis
 Geo 327G Semester Project Landslide Suitability Assessment of Olympic National Park, WA Fall 2011 Shane Lewis 1 I. Problem Landslides cause millions of dollars of damage nationally every year, and are
EMERGENCY PLANNING IN NORTHERN ALGERIA BASED ON REMOTE SENSING DATA IN RESPECT TO TSUNAMI HAZARD PREPAREDNESS
 EMERGENCY PLANNING IN NORTHERN ALGERIA BASED ON REMOTE SENSING DATA IN RESPECT TO TSUNAMI HAZARD PREPAREDNESS Barbara Theilen-Willige Technical University of Berlin, Institute of Applied Geosciences Department
Determination of Subsurface Bulk Density Distribution for Geotechnical Investigation using Gravity Technique
 Journal of Earth Sciences and Geotechnical Engineering, vol. 7, no.2, 2017, 63-69 ISSN: 1792-9040 (print), 1792-9660 (online) Scienpress Ltd, 2017 Determination of Subsurface Bulk Density Distribution
PART A: Short-answer questions (50%; each worth 2%)
") PART A: Short-answer questions (50%; each worth 2%) Your answers should be brief (just a few words) and may be written on these pages if you wish. Remember to hand these pages in with your other exam pages!
PART A: Short-answer questions (50%; each worth 2%) Your answers should be brief (just a few words) and may be written on these pages if you wish. Remember to hand these pages in with your other exam pages!
Delineating Karst features using Advanced Interpretation
 P-152 Asheesh Singh, Sibam Chakraborty*, Shafique Ahmad Summary We use Amplitude, Instantaneous Phase, Trace Envelope and Dip of Maximum Similarity Attributes as a tool to delineate Karst induced features
Getting Started: Using and Understanding Gravity Data
 The University of Texas at El Paso Pan-American Center for Earth and Environmental Studies Thu 13-Sep-2007 ABOUT PACES Mission Newsletter Sponsors RESEARCH Geoinformatics Remote Sensing Geoscience GIS
A new burst of seafloor mapping and discovery driven by advances in satellite altimetry
 A new burst of seafloor mapping and discovery driven by advances in satellite altimetry! R. Dietmar Müller*, Kara J. Matthews* and David T. Sandwell^! *EarthByte Group, School of Geosciences, The University
QUALITATIVE INTERPRETATION OF POTENTIAL FIELD PROFILES: SOUTHERN NECHAKO BASIN
 QUALITATIVE INTERPRETATION OF POTENTIAL FIELD PROFILES: SOUTHERN NECHAKO BASIN By Melvyn E. Best Bemex Consulting International 5288 Cordova Bay Road Victoria, B.C. V8Y 2L4 KEYWORDS: potential fields,
ESRI GIS For Mining Seminar, 10 th August, 2016, Nairobi, Kenya. Spatial DATA Solutions for Mining
 ESRI GIS For Mining Seminar, 10 th August, 2016, Nairobi, Kenya Spatial DATA Solutions for Mining Spatial Data Solutions for Mining Spatial - Data that identifies the geographic location of features &
Using Curvature to Map Faults, Fractures
 Using Curvature to Map Faults, Fractures by SATINDER CHOPRA and KURT J. MARFURT Editor s note: Chopra is with Arcis Corp., Calgary, Canada; Marfurt is with the University of Oklahoma. Both are AAPG members.
Project Information system (Geodatabase) Norway Grants
 Norway Grants") Project Information system (Geodatabase) Norway Grants Lucie Kondrová Lenka Kociánová Zuzana Krejčí Martin Paleček Czech Geological Survey, Department of Information Systems 8.11. 2016 CZECH GEOLOGICAL
Project Information system (Geodatabase) Norway Grants Lucie Kondrová Lenka Kociánová Zuzana Krejčí Martin Paleček Czech Geological Survey, Department of Information Systems 8.11. 2016 CZECH GEOLOGICAL
GIS Topographic Wetness Index (TWI) Exercise Steps
 Exercise Steps") GIS Topographic Wetness Index (TWI) Exercise Steps October 2016 Jeffrey L. Zimmerman, Jr. GIS Analyst James P. Shallenberger Manager, Monitoring & Protection Susquehanna River Basin Commission Table of
GIS Topographic Wetness Index (TWI) Exercise Steps October 2016 Jeffrey L. Zimmerman, Jr. GIS Analyst James P. Shallenberger Manager, Monitoring & Protection Susquehanna River Basin Commission Table of
caused displacement of ocean water resulting in a massive tsunami. II. Purpose
 I. Introduction The Great Sumatra Earthquake event took place on December 26, 2004, and was one of the most notable and devastating natural disasters of the decade. The event consisted of a major initial
Automatic Watershed Delineation using ArcSWAT/Arc GIS
 Automatic Watershed Delineation using ArcSWAT/Arc GIS By: - Endager G. and Yalelet.F 1. Watershed Delineation This tool allows the user to delineate sub watersheds based on an automatic procedure using
Problems and Challenges
 2018 Esri Petroleum GIS Conference Problems and Challenges May 9 10, 2018 Houston, Texas George R. Brown Convention Center Disunity of drawing standards and format Large amount of work in Cartography,
Ramping-up Exploration Value from Aeromagnetic Surveys - More Geological Input Needed!
 Ramping-up Exploration Value from Aeromagnetic Surveys - More Geological Input Needed! Dave Isles Southern Geoscience Consultants AIG Geoscientists Symposia Bali May 2013 EAST ASIA: Geology, Exploration
The Retreat of the Grinnell Glacier: 1990-Present
 Falk, Hepler, Lopez 1 Megan Falk, Alex Hepler, Michelle Lopez GSP 270/ Graham Group Project/ Final Draft December 8, 2014 Word count: 1,148 Introduction The Retreat of the Grinnell Glacier: 1990-Present
PETROLEUM GEOSCIENCES GEOLOGY OR GEOPHYSICS MAJOR
 PETROLEUM GEOSCIENCES GEOLOGY OR GEOPHYSICS MAJOR APPLIED GRADUATE STUDIES Geology Geophysics GEO1 Introduction to the petroleum geosciences GEO2 Seismic methods GEO3 Multi-scale geological analysis GEO4
KEYSTONE PROPERTY GRAVITY GIS DATABASE. Residual Gravity Looking Down to Northwest
 KEYSTONE PROPERTY GRAVITY - 2018 GIS DATABASE Residual Gravity Looking Down to Northwest James L. Wright M.Sc. May 11, 2018 TABLE OF CONTENTS INTRODUCTION......................... 2 SURVEY PROCEDURE......................
Faults in. Houston. University. of Houston Geosciences
 DEM Programs for Active Surface Faults in Houston Richard Engelkemeir Schlumberger Information Sol lutions University of Houston Geosciences Geologic Overview Salt deposited during extension prior to sea
IMPERIAL COUNTY PLANNING AND DEVELOPMENT
 IMPERIAL COUNTY PLANNING AND DEVELOPMENT GEODATABASE USER MANUAL FOR COUNTY BUSINESS DEVELOPMENT GIS June 2010 Prepared for: Prepared by: County of Imperial Planning and Development 801 Main Street El
G002 An Integrated Regional Framework for Seismic Depth Imaging in the Deepwater Gulf of Mexico
 G002 An Integrated Regional Framework for Seismic Depth Imaging in the Deepwater Gulf of Mexico M. Davidson (Fugro Multi Client Services), M. Leander (Fugro Multi Client Services), K. Mohn (Fugro Multi
The following figures (Figs. DR-2 DR-6) show plots by location and formation in the Gar Basin. See Figure DR-7 for clast counts sites.
 show plots by location and formation in the Gar Basin. See Figure DR-7 for clast counts sites.") DR91 Tertiary stratiaphy composition plots The following figures (Figs. DR- DR-) ow plots by location and formation in the Gar Basin. See Figure DR-7 for clast counts sites. Abbreviations used in clast
DR91 Tertiary stratiaphy composition plots The following figures (Figs. DR- DR-) ow plots by location and formation in the Gar Basin. See Figure DR-7 for clast counts sites. Abbreviations used in clast
GIS APPLICATIONS IN SOIL SURVEY UPDATES
 GIS APPLICATIONS IN SOIL SURVEY UPDATES ABSTRACT Recent computer hardware and GIS software developments provide new methods that can be used to update existing digital soil surveys. Multi-perspective visualization
 estrandh@uoregon.edu Introduction The general topic of this paper describes a unique cartographic project depicting a mountain landscape for the Friends of Opal Creek (F.O.C.), a non-profit organization.
ISSUES AND APPROACHES TO COUPLING GIS TO AN IRRIGATION DISTRIBUTION NETWORK AND SEEPAGE LOSS MODELS ABSTRACT
 ISSUES AND APPROACHES TO COUPLING GIS TO AN IRRIGATION DISTRIBUTION NETWORK AND SEEPAGE LOSS MODELS Yanbo Huang 1, Milton Henry 2, David Flahive 3, Guy Fipps 4 ABSTRACT Geographic Information Systems (GIS)
Scout Name: Unit #: Date: GEOLOGY
 1) Explain what geology means. GEOLOGY Merit Badge Requirements Earth Materials 2) Make a collection of at least 10 different earth materials or geological specimens from your locality or an area of special
Euler Deconvolution Technique for Gravity Survey
 Journal of Applied Sciences Research, 6(11): 1891-1897, 2010 2010, INSInet Publication Euler Deconvolution Technique for Gravity Survey 12,3 Piyaphong Chenrai, 2 Jayson Meyers, 1,4 Punya Charusiri 1 Earthquake
Constrained Fault Construction
 Constrained Fault Construction Providing realistic interpretations of faults is critical in hydrocarbon and mineral exploration. Faults can act as conduits or barriers to subsurface fluid migration and
Towards Secure Cyberinfrastructure for Sharing Border Information
 University of Texas at El Paso DigitalCommons@UTEP Departmental Technical Reports (CS) Department of Computer Science 3-1-2006 Towards Secure Cyberinfrastructure for Sharing Border Information Ann Q. Gates
Designing GIS Databases to Support Mapping and Map Production Charlie Frye, ESRI Redlands Aileen Buckley, ESRI Redlands
 Designing GIS Databases to Support Mapping and Map Production Charlie Frye, ESRI Redlands Aileen Buckley, ESRI Redlands 1 Designing GIS Databases to Support Mapping and Map Production Charlie Frye, ESRI
GEOTHERMAL WELL SITING USING GIS: A CASE STUDY OF MENENGAI GEOTHERMAL PROSPECT
 GEOTHERMAL WELL SITING USING GIS: A CASE STUDY OF MENENGAI GEOTHERMAL PROSPECT Levi Shako Geothermal Development Company P. O Box 17700-20100, Nakuru, Kenya. lshako@gdc.co.ke ABSTRACT Geothermal well site
The Looming Threat of Rising Sea Levels to the Florida Keys
 The Looming Threat of Rising Sea Levels to the Florida Keys 1. Introduction Sea levels are rising, and possibly faster than we thought before. In a recent report in 2017 by the National Oceanic and Atmospheric
The Geodatabase Working with Spatial Analyst. Calculating Elevation and Slope Values for Forested Roads, Streams, and Stands.
 GIS LAB 7 The Geodatabase Working with Spatial Analyst. Calculating Elevation and Slope Values for Forested Roads, Streams, and Stands. This lab will ask you to work with the Spatial Analyst extension.