Multiple stage deglacial retreat of the southern Greenland Ice Sheet linked with Irminger Current warm water transport
|
|
|
- Sharlene Gilmore
- 5 years ago
- Views:
Transcription
1 PALEOCEANOGRAPHY, VOL. 26,, doi: /2010pa002053, 2011 Multiple stage deglacial retreat of the southern Greenland Ice Sheet linked with Irminger Current warm water transport Paul C. Knutz, 1 Marie Alexandrine Sicre, 2 Hanne Ebbesen, 1 Sarah Christiansen, 3 and Antoon Kuijpers 1 Received 10 September 2010; revised 4 March 2011; accepted 3 May 2011; published 30 July [1] There is limited knowledge pertaining to the history of the Greenland Ice Sheet (GIS) during the last glacial interglacial transition as it retreated from the continental margins to an inland position. Here we use multiproxy data, including ice rafted debris (IRD); planktonic isotopes; alkenone temperatures; and tephra geochemistry from the northern Labrador Sea, off southwest Greenland, to investigate the deglacial response of the GIS and evaluate its implications for the North Atlantic deglacial development. The results imply that the southern GIS retreated in three successive stages: (1) early deglaciation of the East Greenland margins, by tephra rich IRD that embrace Heinrich Event 1; (2) progressive retreat during Allerød culminating in major meltwater releases (d 18 Odepletion of 1.2 ) at the Allerød Younger Dryas transition ( kyr B.P.); and (3) a final stage of glacial recession during the early Holocene ( 9 11 kyr B.P.). Rather than indicating local temperatures of ambient surface water, the alkenones likely were transported to the core site by the Irminger Current. We attribute the timing of GIS retreat to the incursion of warm intermediate waters along the base of grounded glaciers and below floating ice shelves on the continental margin. The results lend support to the view that GIS meltwater presented a forcing factor for the Younger Dryas cooling. Citation: Knutz, P. C., M. A. Sicre, H. Ebbesen, S. Christiansen, and A. Kuijpers (2011), Multiple stage deglacial retreat of the southern Greenland Ice Sheet linked with Irminger Current warm water transport, Paleoceanography, 26,, doi: /2010pa Introduction [2] The northwest Atlantic is an important junction in the global ocean climate system due to major water mass conversion taking place in proximity to the southern Greenland Ice Sheet (GIS). Presently, cooling of surface waters within the subpolar gyre generates Labrador Sea Water that forms a major intermediate contribution to Atlantic Meridional Ocean Circulation (AMOC) [Talley and McCartney, 1982; Cheng and Rhines, 2004]. [3] The last deglaciation ( 1 19 kyr B.P.) was commensurate with a northward migration of the polar front and advection of temperate water masses via the Irminger Current into the Labrador Sea and along the west coast of Greenland [Hillaire Marcel et al., 1994; Rahman and de Vernal, 1994]. This long term climate amelioration was interrupted by periods of coolings (stadials), widely recognized in marine and ice core records [Bond et al., 1993; Dansgaard et al., 1993] as Heinrich Event 1 (HE 1: kyr) and the Younger Dryas 1 Geological Survey of Denmark and Greenland, Copenhagen, Denmark. 2 Laboratoire des Sciences du Climat et de l Environnement, IPSL, CNRS/CEA/UVSQ, Gif sur Yvette, France. 3 Institute for Geography and Geology, University of Copenhagen, Copenhagen, Denmark. Copyright 2011 by the American Geophysical Union /11/2010PA cold reversal ( kyr). The stadials are commonly associated with meltwater and iceberg discharges capable of AMOC perturbations resulting in globally significant ocean reorganizations [Broecker et al., 1990; Zahn et al., 1997; Hughen et al., 1998]. Heinrich events, identified by pronounced increases in carbonate rich IRD that reoccur at 7 kyr intervals, are attributed to iceberg armadas from the Laurentide Ice Sheet (LIS) through the Hudson Strait [Andrews and Tedesco, 1992; Hemming, 2004]. Cores collected from the east Greenland margin and the adjacent basins display IRD cycles that, in terms of frequency, resemble the atmospheric Dansgaard Oeschger (D O) oscillations [Nam et al., 1995; Stein et al., 1996;Hagen and Hald, 2002].Highresolution studies, advocating a more implicit role of the GIS in past climate change, suggests that Greenland meltwater emissions may have been crucial for limiting deep water formation during stadials [van Kreveld et al., 2000] and could be responsible for the Younger Dryas cooling [Jennings et al., 2006]. [4] During the last glacial to interglacial transition the GIS retreated from its glacial maximum limit, probably at or near the shelf edge, to its present land based configuration [Dowdeswell et al., 1998; Bennike and Björck, 2002; Funder et al., 2004; Simpson et al., 2009]. Cosmogenic isotope and radiocarbon dating of till, lake and glacial marine deposits suggest that ice withdrew from the continental margins south of 72 N in several discrete phases between 8 and 1of18


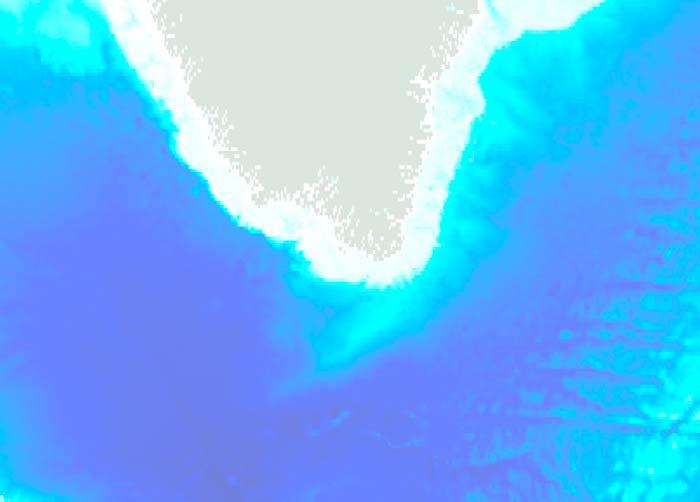


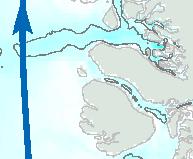


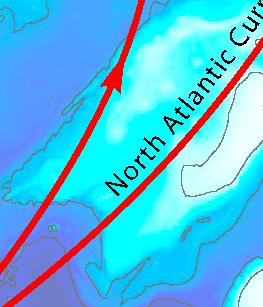


2 Figure 1. Map of northwest Atlantic displaying cold and warm surface currents, the position of core DA04 31P, and other sites referred to in the text. K.T. is the Kangerlussuaq Trough. 15 kyr [Funder and Hansen, 1996; Bennike et al., 2002; Long et al., 2008; Rinterknecht et al., 2009; Roberts et al., 2009]. A key question relates to the response time of the GIS to interhemispheric climate forcing, which for the last glacial interglacial transition has prompted diverse opinions [Bennike and Björck, 2002; Carlson et al., 2008a]. In this paper we apply multiproxy paleoceanographic data from the continental margin off southwest Greenland to elucidate the late glacial to early Holocene history of the GIS in the context of regional oceanographic changes. [5] The mechanisms responsible for the disintegration of the Pleistocene ice sheets has yet to be fully understood but several hypotheses have been proposed: (1) Internal ice sheet oscillations or binge/purge model [MacAyeal, 1993], (2) collapse of fringing ice shelves [Hulbe et al., 2004] (3) jökulhlaups representing catastrophic bursts of ice dammed lakes [Johnson and Lauritzen, 1995] and (4) sea level rises resulting from halted ocean circulation [Flückiger et al., 2006]. Except for (1), some form of climate related forcing is required to destabilize glacial margins and induce massive iceberg fluxes as seen during Heinrich Events. This has stimulated detailed studies focusing on relationships between climate, ocean circulation changes and glacial collapses in the North Atlantic region e.g., [Lagerklint and Wright, 1999; Knutz et al., 2002; Moros et al., 2002]. In terms of the GIS, Alley et al. [2010] emphasize its sensitivity to temperature forcing (induced by atmospheric or oceanic propagation), resulting in growth phases during cold periods and shrinkage during periods of climate warming. Here we combine analyses of ice rafted components and marine environmental indicators at centennial scale resolution to address mechanisms of ice sheet/ocean interactions during last deglaciation. In the discussion, we focus on the role of ocean heat transport as a factor for GIS variability and, by implication, the Younger Dryas cooling. 2. Oceanographic Setting [6] The surface hydrography of the Labrador Sea is influenced by the transport of cold and low saline water masses ( 1.8 C, S 34.5 ) southward from the Arctic Ocean, along the Greenland shelf margins (Figure 1) [McCartney and Talley, 1982; Cuny et al., 2002]. The East Greenland Current forms a hydrographic and thermal barrier that isolates the Greenland coastal glaciers from warm Irminger Sea Water (ISW: 4.5 C, S 35 ) transported by the Irminger 2 of 18
3 Table 1. Information on AMS 14 C Dates Obtained From Core DA04 31P Core/Depth (cm) Laboratory Number Material 14 C Ages ± 1s (years B.P.) MR Age a (years B.P.) Calibrated 2s Age Ranges (years B.P.) Calibrated Age (years B.P.) 3 6 AAR Nps 1365 ± AAR 9982 Nps 8420 ± AAR Nps 8440 ± AAR Nps 8270 ± 47* n/a AAR Nps ± , AAR Nps ± ,583 14,646 13, AAR Nps 13,020 ± ,112 14,984 14, AAR 9984 Nps 21,880 ± 170* n/a 206 AAR 9985 Nps 14,660 ± ,548 17, AAR Nps 16,670 ± ,914 19,430 19, AAR 9986 Nps 22,320 ± ,821 26,894 26, AAR Nps 26,550 ± ,417 31,179 30,930 a Correction estimates for marine reservoir age beyond the modern value of 400 years [Bard et al., 1998] are based on Waelbroeck et al. [2001], Bondevik et al. [2006], and Franke et al. [2008]. Asterisks denote ages representing stratigraphic inversions. Calibrated ages used for the age model (Figure 2) either represent the modal peak or, in the case of double peaks, the mean value of the 1s range. Current. The core of this water mass is distinguishable by its properties, vertically down to 700 m and horizontally landward of the 3000 m isobath. As the East Greenland Current reaches the southern tip of Greenland it mixes with subsurface ISW, and as a result becomes more saline ( ) and warmer with seasonal surface temperatures between 3 8 C. This water mass propagates northward in form of the West Greenland Current that semicirculates the northern Baffin Bay while incorporating arctic surface waters from the Nares Strait and the Canadian Arctic Archipelago. The resulting Baffinland Current continues southward and upon crossing the Davis Strait, it merges with a crossover branch of the West Greenland Current to form the Labrador Current. Because of this exchange between Irminger Sea Water and Arctic surface waters, surface salinities and temperatures on the Labrador Shelf are several degrees lower than along the southwest Greenland margin. [7] Labrador Sea Water (LSW) is formed by open ocean convection in the subpolar gyre during winter months [Talley and McCartney, 1982; Dickson and Brown, 1994] and occupies intermediate depths of the Labrador basin, between m. LSW imparts a middepth stratification in the Labrador Sea basin beyond which it spreads laterally into the North Atlantic water mass structure under the influence of anticyclonic lateral mixing [Lavender et al., 2000]. A portion of LSW is entrained into the Deep Western Boundary Undercurrent (DWBU) that transports North Atlantic Deep Water south along the North American continent. In the Labrador Sea basin, the DWBU displays a strong, barotropic current with a main core flowing above the lower continental slope close to the 3000 m isobath [Cuny et al., 2002]. 3. Sample Material and Methods [8] Piston core DA04 31P ( N, W; water depth 2525 m, length 8.78 m) was retrieved by R/V Dana in The coring target was an area of muddy drift sedimentation on a gentle section of the slope, above the main trajectory of the DWBU (Figure 1). [9] Multielement geochemical data were measured at 1 cm resolution on split core sections using the Avaatech XRF facility at NIOZ. Tube voltages of 10 and 30 kv and 50 kv (Ba) were applied. The same sections were color scanned and measured for gamma ray (GR) density using a GEOTEK multisensor logger. The calcium carbonate content was determined on 7 samples by HCl stoichiometric titration in order to provide a quantitative calibration for XRF Ca. [10] The upper 235 cm of core DA04 31P, corresponding to the late glacial to Holocene interval was sampled at 1 2 cm intervals. The petrology of ice rafted debris (IRD) components and volcanic tephra was determined by visual microscopic inspection of the >250 mm fraction. Apart from assisting grain identification this threshold favors an origin from melting icebergs, as opposed to other transport processes [Andrews et al., 1997]. Sieved samples were split into subfractions containing a minimum of 400 grains. The abundance of detrital components is reported as number of grains per gram dry sediment. [11] The total abundance of planktonic foraminifer and the species abundance of Neogloboquadrina pachyderma sinistral (Nps) was determined. The content of diatoms in the mm fraction was semiquantified on a 1 5 scale with following denotation: 1 = absent, 2 = rare, 3 = noticeable presence, 4 = abundant, 5 = high abundance. Oxygen isotope measurements, performed on batches of specimens of Nps picked from the >250 mm fraction, were carried out at Woods Hole Oceanographic Institution using a Finnigan MAT252 mass spectrometer with a Kiel carbonate device. Values were calibrated against internal standards and converted to the Vienna PDB scale. The recorded analytical reproducibility was routinely better than ±0.06 (±1s). [12] The quantity and depth position of samples for AMS 14 C analyses was partly determined by the generally sparse but variable presence of planktonic foraminifers (Table 1); mg of Nps shells were picked from the >250 mm fraction and analyzed at Aarhus University Radiocarbon Laboratory. Holocene and pre LGM dates were corrected for the marine reservoir (MR) effect by subtracting 400 years, equivalent to the modern age of subsurface North Atlantic waters [Bard et al., 1998; Lloyd et al., 2005]. For dating samples representing the glacial to interglacial transition (LGM to Younger Dryas) a MR age of 600 years was applied, following Bondevik et al. [2006] and Franke et al. [2008]. For the single date corresponding to the base of the HE 1 3of18
4 event, an MR age of 1000 years was assumed due to a strong meltwater effect implied by previous studies [Waelbroeck et al., 2001]. It is noted that these MR estimates involve a large degree of uncertainty, on the scale of centuries. Conversion to calendar ages before present (B.P., defined as 1950) was performed using CALIB5 (marine calibration curve 9.14c) (M. Stuiver, P. J. Reimer, and R. W. Reimer, CALIB radiocarbon calibration, execute version 5.0.2, radiocarbon.pa.qub.ac.uk/calib/, 2005). Errors, shown by 2s ranges (Table 1), are related to the marked plateaus and nonunique solutions in the calibration procedure [Stuiver and Reimer, 1993]. [13] The alkenone unsaturation index, UK 37, was used to calculate sea surface temperatures (SST) following the calibration established by Prahletal.[1988]. Details of the analytical procedure can be found in the work by Sicre et al. [1999]. Briefly, freeze dried sediments were extracted with a mixture of 3:1 dichloromethane:methanol (v/v) in an ultrasonic bath for 15 min. The lipid extracts were then fractionated into compound classes by silica gel chromatography. The fractions containing alkenones were analyzed on a Varian Star 3400CX gas chromatograph equipped with a 50 m fused CP Sil 5CB silica capillary column (0.32 mm i.d., 0.25 mm film thickness, Chrompack), a Septum Programmable Injector and flame ionization detector. The oven temperature was programmed from 100 to 300 C at 20 C min 1. Helium was used as the carrier gas (25 ml min 1 ). Quantification of individual alkenones was achieved by comparison of chromatographic peak areas with a cholestane added prior to gas chromatography injection. [14] 153 tephra grains were picked for elemental composition from four stratigraphic intervals showing elevated tephra concentrations (th1 th4). Individual grains were initially classified as black, grey, brownish translucent or colorless translucent. Elemental geochemistry was determined by wavelength dispersive microprobe analyses [Mangerud et al., 1984]. Grains were selected to ensure that the range of visual types were represented, and prepared in polished epoxy discs coated with a 20 nm carbon layer. For each grain, at least three analyses were performed. The tephra material was generally of amorphous character. Heterogenic particle types with apparent porphyric texture were avoided due to poor analytical reproducibility. The raw data was converted to oxide percentages with mean and standard deviations calculated. Reproducibility was strongly dependent on elemental weight percentages, but typically better than ±2% for >10 wt.% and better than ±10% for 1 10 wt. %. Total oxides ranged from 97 to 99 wt. %. Low values are related to absorption of electrons during analyses or loss of Na due to evaporation. 4. Results 4.1. Geochronology [15] Of the 12 AMS 14 C dates obtained from DA04 31P two shows stratigraphic inversions outside the range of analytical error (Table 1). Possible reasons for erroneous ages may relate to geological artifacts (i.e., reworking and bioturbation) or contamination during sample preparation. The sample at 156 cm depth (in the stratigraphic context some 8000 years too old ) was obtained from a more silty interval (Figure 3) possibly associated with enhanced sediment winnowing. [16] An age model based on a nonlinear fit was constructed for the upper 3 m interval of core DA04 31P (Figure 2). Two functions were applied to fit the calibrated 14 C dating points (Figure 2a). An assumption of the age model is a decrease in sedimentation rates toward the core top (e.g., between the two dated horizons in the Holocene interval). Present day low sedimentation rates are suggested by a marked Fe oxide horizon developed in the upper 5 cm of the core (Figure 3). The 14 C based geochronology is supported by a pattern based correlation between sediment bulk properties and the climate curve of the Greenland Summit ice cores (Figure 3 and Figure S1 in the auxiliary material). 1 Tephra horizons could not constrain the age model since volcanic material was associated with ice rafting (section 4.3). The 2 cm sampling interval gives a time resolution between 60 to 100 years in the glacial interval and between 100 to 1000 years in the Holocene section. Sedimentation rates are low in the uppermost late Holocene (<5 cm kyr 1 )and then subsequently increase with depth from 17 cm kyr 1 in the early Holocene to around 30 cm kyr 1 across the deglaciation Lithology and Bulk Sediment Properties [17] A detailed lithostratigraphy of the core was achieved by continuous scanning for physical and geochemical properties. (Figure 3, entire core shown in Figure S1). The low background values of Ca (<7 cps) seen in most of the core corresponds to <5 wt. % CaCO 3 while the elevated cps counts in the upper 50 cm reflect carbonate values of wt.%. Detrital carbonate horizons, related to Heinrich events HE 1 and HE 2, are very distinctive, forming sharpbased and top down bioturbated, light beige layers matching Ca peaks (Figure 3). In contrast, HE 3 is vaguely defined by a thin beige interval and a Ca peak below a horizon dated to C kyr (Figure S1). The 14 C chronology of the detrital carbonate layers observed in DA04 31P is in agreement with the HE ages obtained from central North Atlantic cores [Hemming, 2004]. [18] The water depth of DA04 31P ( 2500 m) is located at the interface between deep and intermediate boundary currents, which may explain the high glacial sedimentation rates compared to core sites located in the path of the DWBU [Rahman and de Vernal, 1994]. We observe a visual tie between measured sediment properties and the GISP2 d 18 O record that supports the 14 C based chronology (Figure 3 and Figure S1). Increases in GR density, and the minor elements Ba, Sr and Zr tend to correspond to warm intervals in GISP2. The changes in bulk parameters may reflect variations in fine clastic mineralogy or water mass conditions, but the significance of geochemical variables in terms of climate variability requires more specific analytical information Ice Rafted Detritus and Tephra [19] IRD abundance is considered as an indicator of iceberg productivity reflecting gross ablation of marine based 1 Auxiliary materials are available in the HTML. doi: / 2010PA of18
5 Figure 2. (a) Calendar age model for core DA04 31P based on a nonlinear function fit to calibrated AMS 14 C dates (open squares). The 2s intervals of calibrated ages from Table 1 are indicated. Two algorithms were used: 3450Ln x 3790 for the interval 4 36 cm and x x 2 +96x for the interval cm. Solid diamonds represent visual ties to the Bølling peak in the GISP2 ice core (Figure 3). Crosshair indicates position of the pre Boreal increase in ocean temperature (Figure 4f). Also shown are the stratigraphic positions of tephra horizons th1 and th2. (b) Sedimentation rates based on linear interpolation between dating points (grey line) and using the nonlinear fit described above (black line). ice sheets. Additional factors include variability in glacial debris concentration, iceberg melting rates and background sediment fluxes [e.g., Alley et al., 2010]. Abundance of ice rafted components determined in the deglacial section of DA04 31P is shown in Figure 4, together with other paleoenvironmental proxies. The results are compared to the Greenland oxygen isotope records (GISP2 and NGRIP, Figure 4f) on independent time scales. The total abundance of IRD > 250 mm reflects the flux of melting icebergs to the southwest Greenland margin (undifferentiated sources), while the abundance of detrital carbonate (DC) identifies icebergs derived from the LIS [Andrews and Tedesco, 1992] (Figure 4a). HE 1 is clearly seen as an interval of elevated DC abundances (10 35 grains g 1 ) expressed by a jagged peak between 16.4 and 16.8 ka B.P. that is likely influenced by bioturbation observed in the top of the detrital carbonate horizon (Figure 3). From about 16 ka and throughout the remaining deglacial interval, DC grains are present in trace amounts only. The exact timing of HE 1 is difficult to place due to age model uncertainties (notably marine reservoir effect) but a duration of about 600 years implied by our results is in agreement with previous studies based on U Th sedimentation rates [Veiga Pires and Hillaire Marcel, 1999]. [20] In addition to the HE 1/early deglacial interval, elevated IRD concentrations ( grains g 1 ) are observed 5of18
6 Figure 3. Lithology, XRF scanning, and other bulk sediment properties of the deglacial section of DA04 31P. Bioturbated intervals are noticed in the top of HE 1 and in the early Holocene interval (35 55 cm core depth). Positions of 14 C ages are indicated (age inversions in brackets). Peaks in bulk density and Ba are visually correlated to Bølling and late Allerød interstadial events in the GISP2 ice core. in the pre Bølling ( kyr), Allerød to early Younger Dryas ( kyr) and early Holocene ( kyr) intervals (Figure 4a). Composite quartz aggregates and single grain amphiboles are seen as significant subsidiary components in these intervals (Figure 4b) presumably related to glacial weathering of Achean and early Proterozoic gneisses in southern Greenland (Figure 1) [Verplanck et al., 2009]. A similar locally derived, igneous petrology characterizes IRD composition during the early Holocene. In comparison, dredge samples from a seamount located northwest of DA04 31P show large amounts of rocks and pebbles dominated by Precambrian gneisses with no, or subordinate, presence of basalt and limestone [Larsen and Dalhoff, 2006]. We also note that olivine basalt material, despite being an abundant component in core and dredge samples from the Davis Strait (TTR 462G, Figure 1) is not identified in DA04 31P. [21] Increased concentrations of glassy tephra are observed in two horizons of the deglacial interval: cm (th1) and cm (th2) corresponding to kyr and kyr (Figure 4c). High tephra abundances were also noticed at deeper intervals of the core, e.g., around 582 (th3) and 735 cm (th4). Images of the different tephra types that were identified visually are shown in Figure S2 in the auxiliary material. The majority of volcanic particles are translucent brown with broken bubble wall, threaded or blocky morphologies, forming basaltic or intermediate compositions (section 4.7). Clear translucent and winged shards, related to rhyolitic lavas, are observed primarily in the younger th1, while grey pumice and black grains with conchoidal fractures are mainly observed in th2. The high tephra concentrations of th2 embrace the detrital carbonate horizon of HE 1, presumably caused by dilution from detrital IRD sources (Figures 4a and 4c). The increase in tephra grains from 17.2 kyr B.P. leads the onset of HE 1 with some 400 years. Even though late Quaternary eruptions may have been more powerful and wind patterns different from today, the distance of DA04 31P to the Icelandic sources makes in situ aeolian deposition unlikely for tephra >250 mm [Lacasse, 2001]. Rather, its association with silliciclastic detritus favor transport by floating icebergs, which also explains an older than stratigraphic age for some of the tephra components (section 4.7) Biogenic Constituents [22] In most of the analyzed section of DA04 31P foraminifer shells are a minor component of the sand fraction, although elevated concentrations are seen at the onset of HE 1 and during the early Holocene (Figure 4d). The foraminifer assemblage in DA04 31P is dominated by Neogloboquadrina pachyderma sinistral (Nps) considered as an indicator for polar water mass conditions (<5 7 C, salinity >34 ) [Johannessen et al., 1994]. This deep dwelling planktonic species occupy the water column from the chlorophyll maximum, m below the surface, and down to the pycnocline, typically at m water depth, where the shell density increases by addition of a calcite crust [Kohfeld et al., 6of18
7 1996]. Despite its affinity to polar waters, conditions related to upwelling may also determine Nps abundances [Ufkes et al., 2000]. Parts of the deglacial interval show a rich presence of diatom flora, mainly of the cosmopolitan species Coscinodiscus asteromphalis (Figure 4d). High concentrations of diatoms (classes 4 5) are observed across the transition into Bølling and during the pre Boreal interval ( kyr B.P.) Stable Isotopes [23] The d 18 O composition of Nps is determined by regional salinity and temperature changes of thermocline Figure 4 7of18
8 waters ( 0 200m),whicharesuperimposedontheglobal seawater signal related to ice volume [Shackleton, 1987]. The d 18 O record from core DA04 31P show an increase from 3.2 at the termination of HE 1 to a maximum of 4.0 at the onset of Bølling (Figure 4e). This transition corresponds to a stepwise reduction in IRD abundance and gradually increasing alkenone temperatures (Figure 4f). From the Bølling d 18 O maximum a general decrease is observed through the late deglaciation, leveling out in the early Holocene interval to an average of This deglacial trend, also seen in previous studies, is attributed to a combination of increasing sea surface temperatures and the transfer of isotopically light meltwater from decaying ice sheets into the oceans [Rahman and de Vernal, 1994; de Vernal and Hillaire Marcel, 2000]. In addition, we observe three discrete d 18 O depletions through the Bølling Allerød interval. This is most noticeable by a 1.2 shift at 13 kyr with values returning to base level during the first half of Younger Dryas. The two most significant d 18 O depletions correlate with elevated IRD concentrations (and are therefore related to melting icebergs) and the warm intervals of the Allerød period in the Greenland ice cores (Figure 4g) Alkenone SST Data [24] C 37 alkenone concentrations were generally low, ranginginmeanvaluesfrom3.5ngg 1 during deglacial, to 12 ng g 1 during the Holocene. Such low abundances are not unexpected from polar ocean regions and have been reported earlier in seafloor sediments and surface waters [Sikes et al., 1997; Sicre et al., 2002]. In the Southern Ocean, the observation of increasing abundances with decreasing latitude (hence increasing water temperature) led to the conclusion that production likely reflected factors such as better light conditions and a longer growth season [Sikes et al., 1997]. Immeasurable alkenone levels were found at sites with summer temperatures cooler than 4 C and usually covered with winter sea ice. Similar environmental parameters likely explain the low concentration levels in the deglacial interval of core DA04 31P. [25] Alkenone temperatures recorded in DA04 31P range between 8 and 14 C with four peaks/intervals >11 C (Figure 4f), which compared to present SST sof3 8 C in the northern Labrador Sea seems excessive. In low productivity regions such as the Labrador Sea, lateral advection of detrital alkenones can represent a significant component of surface sediments. Earlier studies suggest that alkenones drifting with strong surface currents can potentially generate significant deviation from in situ SSTs [Sicre et al., 2005; Rühlemann and Butzin, 2006]. Higher than expected values in DA04 31P may therefore point to a contribution of alkenones that were produced in distant warmer waters. Since the alkenone based temperatures are derived from bulk samples it is likely that the obtained signal reflect algeal compounds carried westward into the Labrador Sea by the Irminger Current. Presently, cocolithophorid blooms south of Iceland represent a potential primary source of algeal material entrained by the Irminger Current. Previous studies in the North Atlantic have observed sedimentary SST anomalies several degrees higher than measured in seawater at the end of the growing season [Conte and Eglinton, 1993; Bendle and Rosell Mele, 2004]. Acknowledging this factor we interpret the alkenone data as a tracer of water masses derived from Irminger Current transport rather than indicating true local SST. [26] The transportation history of algeal material from their source regions (e.g., pelagic, along slope currents, nepheloid layer) is speculative but in any case, the enhanced sedimentation rates of DA04 31P facilitate fast burial of algae compounds. To gain further insight we compare the alkenone record with Mg/Ca based SST data from core sites in vicinity of the main branch of the North Atlantic Current (RAPID site shown in Figure 1) [Thornalley et al., 2009, 2010]. The remarkable agreement between the two SST proxies throughout the Holocene interval (Figure 4f; see Figure S3 for entire record) favor a coherent upper ocean circulation driven by Irminger Current activity since the pre Boreal. In contrast, digressions between the two SST records through the deglacial period suggest that Atlantic surface circulation was markedly different from the present Tephra Geochemistry [27] Our analyses include tephra material extracted from the pre LGM interval of DA04 31P (Figure 5; geochemical data included in Table S1) although here we focus on the elemental compositions of basaltic tephra from th1 and th2, forming part of the deglaciation history (Figure 6; see Table S2 for comprehensive tephra references). The elemental compositions are discussed in the context of volcanic source but bearing in mind that the tephra particles are related to ice transport rather than direct atmospheric fallout. [28] The compositions of tephra are consistent with Icelandic volcanic sources characterized by transitional alkalibasaltic and tholeiitic compositions [Kvamme et al., 1989; Wallrabe Adams and Lackschewitz, 2003] (Figure 5). Only few data points are observed that potentially could relate to other volcanic regions like Jan Mayen (trachybasalt), Figure 4. Proxy data from upper section (0 230 cm) of core DA04 31P and correlation with Greenland ice core data on a calendar time scale (positions of 14 C dates indicated by stars). (a) Total IRD and detrital carbonate abundances (orange fill). (b) Abundance of composite quartz, representing quartz plagioclase amphibole aggregates (black line), and black amphibole grains (grey shaded curve). Arrows denote stages of increasing trends in IRD. (c) Abundance of light, rhyolithic, and dark basaltic tephra. Open stars denote tephra sampling horizons. (d) Abundance of N. pachyderma sinistral (Nps) and unspecified planktonic foraminifera. Intervals with high relative abundances of diatoms (classes 4 5) are indicated by triangles. (e) Stable isotope data d 18 O measured on Nps and calibrated to the VPDB standard. (f) Marine temperature data (SST) derived from alkenone saturation index (this study) and Mg/Ca measurements (G. bulloides, 0 50 m water depth) extracted from RAPID cores (Figure 1) [Thornalley et al., 2009, 2010]. Position of MW1A and 1B are indicated [Bard et al., 1996; Stanford et al., 2006]. (g) The d 18 O from the central Greenland ice cores GISP2 and NGRIP [Meese et al., 1997; Rasmussen et al., 2006]. 8of18
9 Figure 5 9of18
10 Figure 6. Selection of elemental crossplots for tephra horizons 1 and 2 (positions shown in Figure 4). Basaltic subgroups (A E, BTA) are compared to known North Atlantic ash layer compositions (grey circles). Each circle encloses data points for particular volcanic events based on a large number of references (see Table S2 for details of reference groups). Undifferentiated represents data points that do not conform to any of the six basaltic types. Ref 5 (hatched circle) corresponds to NAAZ 2. Figure 5. Total alkali versus silica (TAS) composition of tephra particles analyzed from core DA04 31P. (a) Full range of tephra compositions with signature of data points referring to sample depths in the core (Figure 3 and Figure S1). General geochemical trends are indicated representing magmatic evolution in Iceland and Jan Mayen. (b) Detail of basaltic TAS range with data points referring to basalt type (Basalt A E and Trachy Andesite) as well as tephra horizons in the core. The distribution show a clear distinction between tephra of intermediate basaltic composition and subalkali basalt derived from tholeiitic magmas, characterizing the Icelandic Rift zone eruptions [Lackschewitz and Wallrabe Adams, 1997]. For the Bas A cluster, a delineation of trends is indicated by the thin red lines. Grey markers represent single data points that cannot be matched with any of the six subgroups ( undifferentiated in Figure 6). The tight cluster of low alkaline/low silica data points forming the Bas E type is only observed in th2. 10 of 18
11 Figure 6. (continued) Azores (trachytic) and Laacher See (phonolitic). Th1 contains Si rich tephra appearing as translucent winged shards under the microscope. This population corresponds geochemically to the Vedde rhyolitic component of the North Atlantic Ash Zone 1 (NAAZ 1) widely described in the North Atlantic region [Ruddiman and Glover,1972]andreferredtoas I RHYL 1 by Kvamme et al. [1989]. Out of the 42 grains measured from th1, 12 were of a rhyolitic composition. In comparison the ratio between light and dark tephra in the grain counts is 1:2. [29] The basaltic tephra from th1 clusters in two groups, denoted Bas A and Bas B with a dominance of the latter ( 70%) (Figure 5b). Bas B, of tholeiitic composition, corresponds to the I THOL 1 population (Figure 6, th1) identified as a product of Icelandic Rift Zone volcanism dated in lake sediments to between 10 and 11 kyr [Björck et al., 1992]. The Fe rich Bas A component correlates with the Vedde basaltic ash I TAB 1 dated in marine cores to kyr [Kvamme et al., 1989; Kristjansdottir et al., 2007]. In comparison, the GRIP ice core contains a minor population of Vedde ash grains dated to 11,980 yr B.P. [Gronvold et al., 1995]. High Ti/Ca also applies to basaltic tephra of the much older NAAZ 2 (52 53 kyr B.P.) [Kvamme et al., 1989], but the coincidence of Bas B with a rhyolitic component points to the Vedde eruption at the end of the Younger Dryas (Figure 6, th1). Both basaltic populations in th1 cor- 11 of 18
12 respond to NAAZ 1 commonly observed in North Atlantic cores [Ruddiman and Glover, 1972; Kvamme et al., 1989]. A signature of 1 THOL 2 and the early Holocene Saksunarvatn eruption that produced a prominent ash layer in Iceland several centuries after the 1 THOL 1 event [Björck et al., 1992] has not been identified. Bas B, at the onset of th1 (Figures 4 and 6), coincides roughly with the timing of Icelandic Rift eruptions associated with 1 THOL 1 ( Ckyr)[Björck et al., 1992]. However, Bas B shows a delay of about years compared to its assumed terrestrial equivalent (Vedde basalt at C kyr). This inconsistency and the extended interval of tephra deposition across the pre Boreal are inferred to reflect a combination of ice storage/ transport and vertical mixing by bioturbation [Ruddiman and Glover, 1972]. [30] Analytical results from th2 show three main basaltic populations, Bas A (25%), Bas B (30%) and Bas E (33%) and minor contributions from other populations (Figure 5b). The best match for Bas B at the stratigraphic interval of th2 (16 17 kyr) is the ash zone FMAZ I THOL reported by Wastegård et al. [2006] (Figure 6, th2). This ash zone is identified in marine cores from the northeast Faeroese shelf and is dated to C kyr. The Bas E population is marked by a high Al content (Figure 6, th2) and very homogeneous composition of low Si and transalkali elements (Figure 5b). This composition it is not clearly recognized in previously published studies of MIS 2 tephra horizons. A tephra population from Reykjanes Ridge cores [Lackschewitz and Wallrabe Adams, 1997] shows a cluster similar to Bas E based on the TAS composition although the Al content was not reported. For Bas A, the only compositional match with previous published tephra data older than HE 1 is the trans alkali basalt population of NAAZ II [Wastegård et al., 2006], suggesting a 35 kyr delay from time of eruption (Figure 6, th2). We infer that this tephra material was stored as englacial debris in marginal ice sheets and released during the early deglaciation and HE 1 together with igneous basal debris. 5. Discussion 5.1. Glacial Sources for Ice Rafted Debris [31] Heinrich events (HE) are commonly observed in North Atlantic cores as centimeter thick layers containing icerafted detrital carbonate clasts observed as far as the West European margins [Zahn et al., 1997; Knutz et al., 2007]. The detrital composition is related to glacial erosion of Paleozoic limestone in the Hudson Bay and its peripheral regions, e.g., Foxe and Emerald basins [Hemming, 2004]. On the east Canadian slope in vicinity of the NAMOC channel, HE 1 and HE 2 are represented by 1 3 m thick intervals of beige colored graded muds interpreted as turbidites and meltwater plumites [Rashid et al., 2003]. The character of these deposits, in a proximal location to the glacial source, combined with the strong ocean wide d 18 O depletions in planktonic shells, testify to the massive outbursts of meltwater from the LIS [Bond et al., 1993]. Thus, the detrital carbonate horizons in DA04 31P are a signature of these immense ice laden meltwater plumes that inundated the continental margin of southwest Greenland (Figure 3 and Figure S1). Conversely, the lack of a detrital carbonate peak, corresponding to HE 0 [Andrews et al., 1995], imply a limited influence of LIS icebergs on the West Greenland margin during Younger Dryas [see also Andrews and Tedesco, 1992]. Likewise, a carbonate horizon associated with HE 3 is only faintly visible in the core lithology. This suggests that only during major LIS collapses did icebergs produced from the Hudson Channel reach the Greenland margins, located upstream with respect to the prevailing boundary currents. We infer that the most probable source of the immature siliciclastic IRD material in DA04 31P relates to erosion of Archean early Proterozoic gneisses in southern Greenland [Verplanck et al., 2009]. The study site would monitor nearby calving fronts in southwest Greenland margin as well as icebergs drifting with the East Greenland Current into the northern Labrador Sea (Figure 1) Evidence of Deglaciation in Southern Greenland [32] Despite considerable uncertainty pertaining to the timing and extent of the LGM Greenland Ice Sheet, most data and models support a shelf edge configuration [Funder et al., 2004; Ó Cofaigh et al., 2004; Roberts et al., 2008]. The maximum volume, estimated to 4.6 m of excess iceequivalent sea level, may not have been reached before 16.5 kyr [Simpson et al., 2009]. In southwest Greenland, the LGM stage has been associated with the Hellefisk Moraine forming the present topographic highs of the middle to outer shelf [Funder et al., 2004]. Estimates of LGM ice thickness range from 700 to 1000 m in the outer fjord regions of Sisimiut [Rinterknecht et al., 2009] to >1500 m along the southern coastal fringe [Bennike et al., 2002]. [33] Dating of marine cores from the southeast Greenland shelf and slope suggests a minimum age of kyr B.P. for the onset of ice retreat [Kuijpers et al., 2003; Jennings et al., 2006]. This early deglacial phase is associated with elevated concentrations of ice rafted material in the pre Bølling interval of core DA04 31P, kyr (Figures 4a 4c). The pronounced increase in ice rafted basaltic tephra around HE 1, which includes a significant NAAZ II component (about 25% of data points in th2) (Figure 6, th2), indicates iceberg transport from southeast Greenland and the Denmark Strait region, in proximity to the Icelandic source. It is considered unlikely that NAAZ II ash was locked in semipermanent sea ice for 35 kyr, and nor does the dynamic Icelandic Ice Sheet appear as a suitable candidate for long term ash storage. The other possibility is that Icelandic tephra was stored in glaciers covering the east Greenland margin shelf terminating in floating ice shelves. The coeval supply of siliciclastic IRD in DA04 31P and the findings of dislocated ash in cores from the Kangerlussuaq Trough (Figure 1) [Jennings et al., 2002] support an origin from east Greenland. Transport of tephra rich icebergs by the Greenland coastal current is corroborated by results from core SU90 24 (Irminger Basin, Figure 1) showing a distinct double peak with high concentrations of dark volcanic ash and a marked d 18 O meltwater pulse at 17 kyr (i.e., at the onset of HE 1) [Elliot et al., 1998]. The decrease in d 18 O seen in the pre Bølling interval of DA04 31P (Figure 4e) likely corresponds to the terminating limb of this meltwater peak. We infer from these observations that breakup of buttressing ice shelves on the east Greenland margin began prior to 17 kyr and lasted for several hundreds of years. It appears that the production of GIS icebergs was intermittently reduced during HE 1 but the subsequent increase in tephra abundances points to a prolonged early deglaciation 12 of 18
13 phase. By Bølling time the eastern fringe of the GIS had experienced significant decay, which may explain the lack of ice rafted tephra in DA04 31P corresponding to the ash horizon between kyr seen in the NGRIP ice core [Mortensen et al., 2005]. [34] Several studies suggests that a major part of deglacial retreat in south Greenland occurred between 12 and 14 kyr, presumably in response to interstadial warming [Bennike and Björck, 2002]. The trend of ice margin recession was not continuous but interrupted by one or more readvances, documented by the Sisimiut Moraine on the innermost shelf [Bennike et al., 2002; Rinterknecht et al., 2009], Milne Land moraines in Scoresby Sund [Miller, 2008] and development of weathering boundaries in south Greenland (Neria stade) [Weidick et al., 2004]. Due to the problems of dating till records and submerged morainal ridges, the timing of renewed ice sheet expansion is not well constrained but linkages to the pre Boreal Oscillation and the Younger Dryas cooling have been suggested [Alley et al., 2010]. The record from DA04 31P display an increasing trend in IRD abundance from the Bølling warm peak to the onset of Younger Dryas, suggesting enhanced supply of melting icebergs to the northeast corner of the Labrador Sea. In contrast, low IRD concentrations mark the later part of Younger Dryas, which may suggest a cold ocean climate with dense sea ice (sikussak) constraining the seaward mobility of icebergs [Reeh et al., 1999]. Although our marine data cannot directly monitor increasing ice volumes, we suggest that the reduction in IRD abundance after 12.4 kyr B.P. is associated with an increase in gross mass balance and formation of new stillstand limits on the continental shelf. A similar interpretation may pertain to the low IRD concentrations during Oldest Dryas and the intra Allerød Cooling (Figure 4). [35] Seafloor observations from east Greenland margins indicate a stage of rapid ice stream retreat [Syvitski et al., 2001; Dowdeswell et al., 2010] lasting until kyr [Kuijpers et al., 2003; Ó Cofaigh et al., 2004]. This event is possibly associated with the pronounced IRD peaks and d 18 O depletion spikes seen in DA04 31P between 13.6 and 12.6 kyr. A major recessional phase during Allerød is commensurate with dated sedimentary records from the Kangerlussuaq Trough (Figure 1) [Andrews et al., 1997; Jennings et al., 2006], although in the study by Jennings et al. the meltwater signal occurs years later than in DA04 31P. However, considering the uncertainties pertaining to 14 C age calibrations it is equally possible that the two localities record a synchronous deglacial response. [36] During the early Holocene optimum the GIS shrank beyond its present daylimits,possiblybyupto60km inland in southern regions [Tarasov and Peltier, 2002]. In DA04 31P this final deglacial stage correlates with a broad IRD increase starting at the pre Boreal Oscillation (Figure 4). The gradual decrease in IRD from about 10 kyr B.P. is consistent with near field observations suggesting that glaciers in southern Greenland emancipated outer fjord systems between 8 to 11 kyr B.P. [Bennike and Björck, 2002; Rinterknecht et al., 2009] Oceanic Factors for Greenland Ice Sheet Instability [37] Ice sheet surging has been proposed as a mechanism for Heinrich events, but the seaward delivery of large amounts of debris in a wet based fast flowing glacier is problematic and in general not supported by observations [e.g., Kamb, 2001]. Moreover, glaciological models contest a full scale surging behavior of the GIS [Tarasov and Peltier, 2002]. An alternative hypothesis links the North Atlantic evidence of periodic IRD fluxes to disintegrating ice shelves [Hulbe, 1997] that extended the Quaternary ice sheets into deepwater regions, similar to present day ice shelves around Antarctica. We consider that collapses of marine based glacial margins, promoted by climate related factors, presents the most feasible explanation for elevated IRD concentrations in DA04 31P. [38] A potential trigger for glacial margin collapse is related to global sea level rises, causing detachment of glacial anchor points and a landward progression of the grounding line. Over the last deglaciation two events of rapidly rising sea levels have been identified, known as meltwater (MW) pulses 1A and 1B [Fairbanks,1989;Bard et al., 1996]. MW 1A has been associated with a 20 m increase in sea level over less than 500 years. Dating of corals and shelf sediments place the start of this event to between 14.0 and 14.6 kyr [Hanebuth et al., 2000; Stanford et al., 2006], i.e., the Bølling Older Dryas transition, which in DA04 31P is marked by relatively low SSTs and a d 18 O depletion peak of 0.5 (Figure 4). MW 1A occurs >500 years before the IRD event at 13.6 kyr, and therefore it seems unlikely that the GIS retreat leading up to Younger Dryas was induced by rapid melting of other ice sheets. The onset of MW 1B is not well-constrained from global records, but here a different case can be made since it overlaps the pre Boreal IRD increase, thus identifying rising sea levels as a possible factor for the final glacial recession in south Greenland. However, the concomitant increase in both atmospheric and oceanic temperature (Figures 4f and 4g) complicates the cause effect relationship for this part of the record. [39] We interpret the alkenone SST record from DA04 31P as an indicator of subsurface ISW transport by the Irminger Current, which today has a major influence on ocean climate conditions in southwest Greenland [Holland et al., 2008]. ISW form a remnant of Subpolar Mode Water, i.e., warm water derived from the Gulf Stream, which has traveled cyclonically around the subpolar gyre at depths above 800 m [McCartney and Talley, 1982]. The potential temperature of Subpolar Mode Water, ranging from 8 to 12 C in its source regions [McCartney and Talley, 1982, Figure 6b], is consistent with proxy based SSTs of C in the late Holocene interval (Figure 4f). [40] The alkenone SST record from DA04 31P imply a marked variability of ISW transport through the last deglaciation, with 8 data points >10.5 C similar to, or exceeding, the early Holocene temperature anomaly (Figure 4f). This could mean that subsurface warm water transport to the Greenland margin during Bølling and Allerød was analogous to the early Holocene optimum. Despite the caveat of limited data (e.g., Bølling only defined by one data point), our results are consistent with the findings of enhanced Atlantic inflow along the northwest European margin during Bølling Allerød [Haflidason et al., 1995; Rasmussen and Thomsen, 2008]. Conversely, the RAPID study south of Iceland (Figure 1) show significantly reduced SSTs during the Bølling Allerød interval [Thornalley et al., 2010] and as such it differs noticeably from the North Atlantic climate 13 of 18
 In the maximum stage scenario, the base of the ice sheet at its marine limit (e.g., grounding line) is not in contact with ISW.")


14 Figure 7. Model illustration of the relationship between subsurface warm water transport (ISW, Irminger Sea Water) and Greenland ice shelf disintegration. (a) In the maximum stage scenario, the base of the ice sheet at its marine limit (e.g., grounding line) is not in contact with ISW. (b) Fast deglacial retreat, associated with intense iceberg productivity, occurs when ISW invades the continental margin via the glacial troughs. Icebergs escaping the shallow grounds on the outer shelf are susceptible to transport by the prevailing boundary currents, thus allowing their cargo of IRD to be deposited at locations far from the source. Glacial mass loss is subsequently sustained by acceleration of ice streams as offshore anchor points buttressing the inland ice dome are being eliminated and the basal melting zone invades the deep fjord systems. trend (Figures 4f and 4g). Based on salinity reconstructions Thornalley et al. [2010] associate the anomalous pattern with LIS freshwater emissions, conceivably entrained into the subtropical gyre and then advected northward by the North Atlantic Drift. Thus, it appears that deglacial upper ocean circulation in the northwest Atlantic was radically different to that of the Holocene. It is possible that Atlantic meridional inflow to the Labrador Sea followed a more southwesterly path due to a weak and diminished subpolar gyre. Moreover, during periods of high freshwater forcing the meridional transport from tropical source regions to high latitude margins may have continued in the form of subsurface intermediate water masses, i.e., at depths not necessarily recorded by planktonic foraminifer [e.g., Rasmussen et al., 2003]. This glacial circulation mode is recognized by model simulations demonstrating that pooling of freshwater at midlatitudes can boost subhalocline heat transport during periods when intermediate ventilation is suppressed [Knutti et al., 2004; Mignot et al., 2007]. A hosing experiment by Mignot et al. [2007] applying freshwater at N produced a maximum temperature anomaly (locally >8 C) penetrating into high latitudes at depths between 300 and 700 m. Despite uncertainties and need for further research, these results bolster our supposition that high alkenone values in DA04 31P are related to subsurface water mass transports. [41] Observations from high latitude fjord settings [Holland et al., 2008; Rignot et al., 2010; Johnson et al., 2011] and the recent loss of West Antarctic ice shelves [Shepherd et al., 2004] testify to the importance of ocean warming as a mechanism for glacial destabilization. Knutz et al. [2007] point to ocean heat transport and ice shelf instability as a trigger for northwest European iceberg discharges during MIS 2. Alvarez Solas et al. [2010] invoke a similar mechanism for Heinrich events using ocean climate modeling to demonstrate a causal linkage between subsurface ocean temperature increases and retreating ice shelves. In accord with Jennings et al. [2006] we propose that the deglacial retreat of the GIS was prompted by the incursion of warm subsurface ISW on the shelf margin (Figure 7). The observations from DA04 31P suggest that an increase in ISW transport started at the beginning of Allerød ( 14 kyr), leading the first d 18 O depletion peak with years and then followed by the main meltwater IRD pulse years later (Figure 4). Thus, the effect of ISW on glacial mass loss was apparently not instantaneous but delayed with several centuries. This may reflect the time required for intermediate waters to enter the deep cross shelf troughs beneath the floating ice shelf, after which, ice margin breakup can occur swiftly. We stress, however, that the centennialscale response of the GIS to warm water advection is obscured by the lack of detail in the alkenone record. [42] The early deglacial SST peak ( C) at the base of HE 1 seems curious since it has no clear counterpart in the ice core signal (Figures 4f and 4g). Its correlation with 14 of 18
Chapter 15 Millennial Oscillations in Climate
 Chapter 15 Millennial Oscillations in Climate This chapter includes millennial oscillations during glaciations, millennial oscillations during the last 8000 years, causes of millennial-scale oscillations,
Rapid climate change in ice cores
 Rapid climate change in ice cores Liz Thomas British Antarctic Survey Overview Introduction to ice cores Evidence of rapid climate change in the Greenland ice cores DO events Younger Dryas 8.2 kyr cold
6. What has been the most effective erosive agent in the climate system? a. Water b. Ice c. Wind
 Multiple Choice. 1. Heinrich Events a. Show increased abundance of warm-water species of planktic foraminifera b. Show greater intensity since the last deglaciation c. Show increased accumulation of ice-rafted
We re living in the Ice Age!
 Chapter 18. Coping with the Weather: Causes and Consequences of Naturally Induce Climate Change 지구시스템의이해 We re living in the Ice Age! 1 Phanerozoic Climate 서늘해지고 더웠고 따뜻했고 3 Climate Rollercoaster 4 2 Time
Air sea temperature decoupling in western Europe during the last interglacial glacial transition
 María Fernanda Sánchez Goñi, Edouard Bard, Amaelle Landais, Linda Rossignol, Francesco d Errico SUPPLEMENTARY INFORMATION DOI: 10.1038/NGEO1924 Air sea temperature decoupling in western Europe during the
Atlantic Meridional Overturning Circulation (AMOC) = thermohaline circulation in N Atlantic. Wikipedia
 = thermohaline circulation in N Atlantic. Wikipedia") Last time. Atlantic Meridional Overturning Circulation (AMOC) = thermohaline circulation in N Atlantic Wikipedia Dansgaard-Oeschger events HOLOCENE ice record smeared out here Last interglacial Dansgaard-Oeschger
Last time. Atlantic Meridional Overturning Circulation (AMOC) = thermohaline circulation in N Atlantic Wikipedia Dansgaard-Oeschger events HOLOCENE ice record smeared out here Last interglacial Dansgaard-Oeschger
/ Past and Present Climate
 MIT OpenCourseWare http://ocw.mit.edu 12.842 / 12.301 Past and Present Climate Fall 2008 For information about citing these materials or our Terms of Use, visit: http://ocw.mit.edu/terms. Ice Sheet Paleoclimatology
Ocean & climate: an introduction and paleoceanographic perspective
 Ocean & climate: an introduction and paleoceanographic perspective Edouard BARD Chaire de l évolution du climat et de l'océan du Collège de France CEREGE, UMR CNRS, AMU, IRD, CdF Aix-en-Provence The ocean
A multi-proxy study of planktonic foraminifera to identify past millennialscale. climate variability in the East Asian Monsoon and the Western Pacific
 This pdf file consists of all pages containing figures within: A multi-proxy study of planktonic foraminifera to identify past millennialscale climate variability in the East Asian Monsoon and the Western
ATOC OUR CHANGING ENVIRONMENT
 ATOC 1060-002 OUR CHANGING ENVIRONMENT Class 22 (Chp 15, Chp 14 Pages 288-290) Objectives of Today s Class Chp 15 Global Warming, Part 1: Recent and Future Climate: Recent climate: The Holocene Climate
APPENDIX B PHYSICAL BASELINE STUDY: NORTHEAST BAFFIN BAY 1
 APPENDIX B PHYSICAL BASELINE STUDY: NORTHEAST BAFFIN BAY 1 1 By David B. Fissel, Mar Martínez de Saavedra Álvarez, and Randy C. Kerr, ASL Environmental Sciences Inc. (Feb. 2012) West Greenland Seismic
Ruddiman CHAPTER 13. Earth during the LGM ca. 20 ka BP
 Ruddiman CHAPTER 13 Earth during the LGM ca. 20 ka BP The Last Glacial Maximum When? How much more ice than today? How much colder was it than today (global average)? How much lower were snowlines? Did
Lake Levels and Climate Change in Maine and Eastern North America during the last 12,000 years
 Maine Geologic Facts and Localities December, 2000 Lake Levels and Climate Change in Maine and Eastern North America during the last 12,000 years Text by Robert A. Johnston, Department of Agriculture,
Supplemental Information for. Persistent intermediate water warming during cold stadials in the SE Nordic seas. during the last 65 kyr
 GSA DATA REPOSITORY2014248 Supplemental Information for Persistent intermediate water warming during cold stadials in the SE Nordic seas during the last 65 kyr By Mohamed M. Ezat, Tine L. Rasmussen, Jeroen
Deep Ocean Circulation & implications for Earth s climate
 Deep Ocean Circulation & implications for Earth s climate I. Ocean Layers and circulation types 1) Ocean Layers Ocean is strongly Stratified Consists of distinct LAYERS controlled by density takes huge
Paleoceanography Spring 2008
 MIT OpenCourseWare http://ocw.mit.edu 12.740 Paleoceanography Spring 2008 For information about citing these materials or our Terms of Use, visit: http://ocw.mit.edu/terms. PALEOCEANOGRAPHY 12.740 SPRING
Where is all the water?
 Where is all the water? The distribution of water at the Earth's surface % of total Oceans 97.25 Ice caps and glaciers 2.05 Groundwater 0.68 Lakes 0.01 Soils 0.005 Atmosphere (as vapour) 0.001 Rivers 0.0001
CORRELATION OF CLIMATIC AND SOLAR VARIATIONS OVER THE PAST 500 YEARS AND PREDICTING GLOBAL CLIMATE CHANGES FROM RECURRING CLIMATE CYCLES
 Easterbrook, D.J., 2008, Correlation of climatic and solar variations over the past 500 years and predicting global climate changes from recurring climate cycles: International Geological Congress, Oslo,
M. Wary et al. Correspondence to: M. Wary
 Supplement of Clim. Past, 11, 1507 1525, 2015 http://www.clim-past.net/11/1507/2015/ doi:10.5194/cp-11-1507-2015-supplement Author(s) 2015. CC Attribution 3.0 License. Supplement of Stratification of surface
The North Atlantic Oscillation: Climatic Significance and Environmental Impact
 1 The North Atlantic Oscillation: Climatic Significance and Environmental Impact James W. Hurrell National Center for Atmospheric Research Climate and Global Dynamics Division, Climate Analysis Section
I EOS. TRANSACfIONS. AMERICAN GEOPHYSICAL UNION Natural Variability of Arctic Sea Ice Over the Holocene
 Eos, Vol. 87, No. 28, 11 July 2006 VOLUME 87 NUMBER 28 11 JULY 2006 I EOS. TRANSACfIONS. AMERICAN GEOPHYSICAL UNION Natural Variability of Arctic Sea Ice Over the Holocene PAGES 273,275 The area and volume
Continental Hydrology, Rapid Climate Change, and the Intensity of the Atlantic MOC: Insights from Paleoclimatology
 Continental Hydrology, Rapid Climate Change, and the Intensity of the Atlantic MOC: Insights from Paleoclimatology W.R. Peltier Department of Physics University of Toronto WOCE derived N-S salinity section
Marine Sediments. Introductory Oceanography. Ray Rector: Instructor
 Marine Sediments Introductory Oceanography Ray Rector: Instructor Ocean Basins are Vast Sinks for Huge Amounts of Sediment from Numerous Different Sources Four Major Types of Seafloor Sediments 1. Lithogenous
Chapter 3 Sedimentation of clay minerals
 Chapter 3 Sedimentation of clay minerals 3.1 Clay sedimentation on land 3.2 From land to sea 3.3 Clay sedimentation in the sea 1 3.1 Clay sedimentation on land Deserts Glaciers Rivers Lacustrine 2 University
Processes affecting continental shelves
 Marine Sediments Continental Shelves Processes affecting continental shelves 1. Glaciation 2. Sea-level change (±130 m during continental glaciation) 3. Waves and currents 4. Sedimentation 5. Carbonate
Supplementary Figure 1. New downcore data from this study. Triangles represent the depth of radiocarbon dates. Error bars represent 2 standard error
 Supplementary Figure 1. New downcore data from this study. Triangles represent the depth of radiocarbon dates. Error bars represent 2 standard error of measurement (s.e.m.). 1 Supplementary Figure 2. Particle
Directed Reading. Section: Ocean Currents. a(n). FACTORS THAT AFFECT SURFACE CURRENTS
. FACTORS THAT AFFECT SURFACE CURRENTS") Skills Worksheet Directed Reading Section: Ocean Currents 1 A horizontal movement of water in a well-defined pattern is called a(n) 2 What are two ways that oceanographers identify ocean currents? 3 What
Skills Worksheet Directed Reading Section: Ocean Currents 1 A horizontal movement of water in a well-defined pattern is called a(n) 2 What are two ways that oceanographers identify ocean currents? 3 What
Rapid Climate Change: Heinrich/Bolling- Allerod Events and the Thermohaline Circulation. By: Andy Lesage April 13, 2010 Atmos.
 Rapid Climate Change: Heinrich/Bolling- Allerod Events and the Thermohaline Circulation By: Andy Lesage April 13, 2010 Atmos. 6030 Outline Background Heinrich Event I/Bolling-Allerod Transition (Liu et
Paleo-VITALS team overview
 Paleo-VITALS team overview The team : Anne de Vernal & Claude Hillaire-Marcel, Geotop UQAM Evan Edinger, MUN; Markus Kienast, Dalhousie; Roger François, UBC + Collaborators : Martin Frank, Simone Kasemann,
Ice on Earth: An overview and examples on physical properties
 Ice on Earth: An overview and examples on physical properties - Ice on Earth during the Pleistocene - Present-day polar and temperate ice masses - Transformation of snow to ice - Mass balance, ice deformation,
1. Introduction 2. Ocean circulation a) Temperature, salinity, density b) Thermohaline circulation c) Wind-driven surface currents d) Circulation and
 Temperature, salinity, density b) Thermohaline circulation c) Wind-driven surface currents d) Circulation and") 1. Introduction 2. Ocean circulation a) Temperature, salinity, density b) Thermohaline circulation c) Wind-driven surface currents d) Circulation and climate change e) Oceanic water residence times 3.
1. Introduction 2. Ocean circulation a) Temperature, salinity, density b) Thermohaline circulation c) Wind-driven surface currents d) Circulation and climate change e) Oceanic water residence times 3.
Welcome to ATMS 111 Global Warming.
 Welcome to ATMS 111 Global Warming http://www.atmos.washington.edu/2010q1/111 Isotopic Evidence 16 O isotopes "light 18 O isotopes "heavy" Evaporation favors light Rain favors heavy Cloud above ice is
THE RELATION OF GREAT BASIN LATE QUATERNARY HYDROLOGIC AND CRYOLOGIC VARIABILITY TO NORTH ATLANTIC CLIMATE OSCILLATIONS
 THE RELATION OF GREAT BASIN LATE QUATERNARY HYDROLOGIC AND CRYOLOGIC VARIABILITY TO NORTH ATLANTIC CLIMATE OSCILLATIONS L. Benson a, R. Spencer b, D. Rhode c, L. Louderback d, R. Rye e a U. S. Geological
JEAN-CLAUDE DUPLESSY, MAURICE ARNOLD, EDOUARD BARD, ANNE JUILLET-LECLERC, NEJIB KALLEL
 [RADIOCARBON, VOL 31, No. 3, 1989, P 493-521 AMS 14C STUDY OF TRANSIENT EVENTS AND OF THE VENTILATION RATE OF THE PACIFIC INTERMEDIATE WATER DURING THE LAST DEGLACIATION JEAN-CLAUDE DUPLESSY, MAURICE ARNOLD,
Earth / Environmental Science. Ch. 14 THE OCEAN FLOOR
 Earth / Environmental Science Ch. 14 THE OCEAN FLOOR The Blue Planet Nearly 70% of the Earth s surface is covered by the global ocean It was not until the 1800s that the ocean became an important focus
IODP Proposal Cover Sheet 915 -
 IODP Proposal Cover Sheet 915 - Pre North Atlantic Fjord Sediment Archives Received for: 2017-04-03 Title Proponents Fjord sediment archives: assessing the recent (post LGM) millennial to sub-decadal scale
Last Time. Submarine Canyons and Fans. Turbidites. MAS 603: Geological Oceanography. Lecture 16: Greenhouse vs. Icehouse Earths
 UNIVERSITY OF SOUTH ALABAMA Last Time MAS 603: Geological Oceanography Lecture 16: Greenhouse vs. Icehouse Earths Submarine Fans Definition and morphology Transport mechanisms (density currents) Submarine
A Broecker Brief Origin of the Atlantic s glacial age lower deep water
 A Broecker Brief Origin of the Atlantic s glacial age lower deep water Today s deep Atlantic shows no hint of nutrient stratification (see Figure 1). By contrast, during the last glacial maximum (LGM),
Glaciers form wherever snow and ice can accumulate High latitudes High mountains at low latitudes Ice temperatures vary among glaciers Warm
 The Cryosphere Glaciers form wherever snow and ice can accumulate High latitudes High mountains at low latitudes Ice temperatures vary among glaciers Warm (temperate) glaciers: at pressure melting point,
Supplementary Fig. 1. Locations of thinning transects and photos of example samples. Mt Suess/Gondola Ridge transects extended metres above
 Supplementary Fig. 1. Locations of thinning transects and photos of example samples. Mt Suess/Gondola Ridge transects extended 260 24 metres above the modern surface of Mackay Glacier, and included 16
SAMPLE PAGE. pulses. The Ice Age By: Sue Peterson
 Page 61 Objective sight words (pulses, intermittent, isotopes, chronicle, methane, tectonic plates, volcanism, configurations, land-locked, erratic); concepts (geological evidence and specific terminology
Oceanography Short Study Guide
 Class: Date: Oceanography Short Study Guide Multiple Choice Identify the letter of the choice that best completes the statement or answers the question. 1. Which of the following was the first expedition
Climate and Environment
 Climate and Environment Oxygen Isotope Fractionation and Measuring Ancient Temperatures Oxygen Isotope Ratio Cycles Oxygen isotope ratio cycles are cyclical variations in the ratio of the mass of oxygen
Lecture 10 Glaciers and glaciation
 Lecture 10 Glaciers and glaciation Outline Importance of ice to people! Basics of glaciers formation, classification, mechanisms of movement Glacial landscapes erosion and deposition by glaciers and the
Ice sheet action versus reaction: Distinguishing between Heinrich events and Dansgaard-Oeschger cycles in the North Atlantic
 Click Here for Full Article PALEOCEANOGRAPHY, VOL. 21,, doi:10.1029/2005pa001247, 2006 Ice sheet action versus reaction: Distinguishing between Heinrich events and Dansgaard-Oeschger cycles in the North
Paleoclimate indicators
 Paleoclimate indicators Rock types as indicators of climate Accumulation of significant thicknesses of limestone and reef-bearing limestone is restricted to ~20º + - equator Gowganda tillite, Ontario
Oceanography is the scientific study of oceans Oceans make up over 70% of the Earth s surface
 Oceanography Oceanography is the scientific study of oceans Oceans make up over 70% of the Earth s surface An ocean must be large and have features which set it apart from other oceans (currents, water
Effect of Ocean Warming on West Antarctic Ice Streams and Ice Shelves. Bryan Riel December 4, 2008
 Effect of Ocean Warming on West Antarctic Ice Streams and Ice Shelves Bryan Riel December 4, 2008 Ice Sheet Mass Balance/WAIS Dynamics -Mass Balance = (Ice/Snow Accumulation) (Surface melting, ice outflux,
Foundations of Earth Science, 6e Lutgens, Tarbuck, & Tasa
 Foundations of Earth Science, 6e Lutgens, Tarbuck, & Tasa Oceans: The Last Frontier Foundations, 6e - Chapter 9 Stan Hatfield Southwestern Illinois College The vast world ocean Earth is often referred
SCOPE 35 Scales and Global Change (1988)
") 1. Types and origins of marine sediments 2. Distribution of sediments: controls and patterns 3. Sedimentary diagenesis: (a) Sedimentary and organic matter burial (b) Aerobic and anaerobic decomposition
1. Types and origins of marine sediments 2. Distribution of sediments: controls and patterns 3. Sedimentary diagenesis: (a) Sedimentary and organic matter burial (b) Aerobic and anaerobic decomposition
Earth s Seafloors. Ocean Basins and Continental Margins. Introductory Oceanography Ray Rector - Instructor
 Earth s Seafloors Ocean Basins and Continental Margins Introductory Oceanography Ray Rector - Instructor OCEAN BASINS and CONTINENTAL PLATFORMS Key Concepts I. Earth s rocky surface covered by of two types
Geography of the world s oceans and major current systems. Lecture 2
 Geography of the world s oceans and major current systems Lecture 2 WHY is the GEOMORPHOLOGY OF THE OCEAN FLOOR important? (in the context of Oceanography) WHY is the GEOMORPHOLOGY OF THE OCEAN FLOOR important?
North Atlantic Deep Water and Climate Variability During the Younger Dryas Cold Period A.C. Elmore and J.D. Wright
 GSA DATA REPOSITORY 2011052 North Atlantic Deep Water and Climate Variability During the Younger Dryas Cold Period A.C. Elmore and J.D. Wright APPENDIX 1: Methods Data Methods: Jumbo piston core 11JPC
Reading Material. See class website. Sediments, from Oceanography M.G. Gross, Prentice-Hall
 Reading Material See class website Sediments, from Oceanography M.G. Gross, Prentice-Hall Materials filling ocean basins Dissolved chemicals especially from rivers and mid-ocean ridges (volcanic eruptions)
Lecture #13 notes, Geology 3950 Spring 2006: CR Stern Magnetic reversals (text pages th edition and in the 5 th edition)
") Lecture #13 notes, Geology 3950 Spring 2006: CR Stern Magnetic reversals (text pages 35-37 4 th edition and 53-55 in the 5 th edition) The earth has a magnetic field generated by circulation of charged
Lecture #13 notes, Geology 3950 Spring 2006: CR Stern Magnetic reversals (text pages 35-37 4 th edition and 53-55 in the 5 th edition) The earth has a magnetic field generated by circulation of charged
1. Deglacial climate changes
 Review 3 Major Topics Deglacial climate changes (last 21,000 years) Millennial oscillations (thousands of years) Historical Climate Change (last 1000 years) Climate Changes Since the 1800s Climate Change
On the world-wide circulation of the deep water from the North Atlantic Ocean
 Journal of Marine Research, 63, 187 201, 2005 On the world-wide circulation of the deep water from the North Atlantic Ocean by Joseph L. Reid 1 ABSTRACT Above the deeper waters of the North Atlantic that
Lecture 21: Glaciers and Paleoclimate Read: Chapter 15 Homework due Thursday Nov. 12. What we ll learn today:! Learning Objectives (LO)
") Learning Objectives (LO) Lecture 21: Glaciers and Paleoclimate Read: Chapter 15 Homework due Thursday Nov. 12 What we ll learn today:! 1. 1. Glaciers and where they occur! 2. 2. Compare depositional and
Learning Objectives (LO) Lecture 21: Glaciers and Paleoclimate Read: Chapter 15 Homework due Thursday Nov. 12 What we ll learn today:! 1. 1. Glaciers and where they occur! 2. 2. Compare depositional and
Ocean Mixing and Climate Change
 Ocean Mixing and Climate Change Factors inducing seawater mixing Different densities Wind stirring Internal waves breaking Tidal Bottom topography Biogenic Mixing (??) In general, any motion favoring turbulent
Evidence of Climate Change in Glacier Ice and Sea Ice
 Evidence of Climate Change in Glacier Ice and Sea Ice John J. Kelley Institute of Marine Science School of Fisheries and Ocean Sciences University of Alaska Fairbanks Evidence for warming of the Arctic
Chapter 4 Rocks & Igneous Rocks
 Chapter 4 Rocks & Igneous Rocks Rock Definition A naturally occurring consolidated mixture of one or more minerals e.g, marble, granite, sandstone, limestone Rock Definition Must naturally occur in nature,
The Planetary Circulation System
 12 The Planetary Circulation System Learning Goals After studying this chapter, students should be able to: 1. describe and account for the global patterns of pressure, wind patterns and ocean currents
1 Earth s Oceans. TAKE A LOOK 2. Identify What are the five main oceans?
 CHAPTER 13 1 Earth s Oceans SECTION Exploring the Oceans BEFORE YOU READ After you read this section, you should be able to answer these questions: What affects the salinity of ocean water? What affects
Natural Climate Variability: Longer Term
 Natural Climate Variability: Longer Term Natural Climate Change Today: Natural Climate Change-2: Ice Ages, and Deep Time Geologic Time Scale background: Need a system for talking about unimaginable lengths
North Pacific Climate Overview N. Bond (UW/JISAO), J. Overland (NOAA/PMEL) Contact: Last updated: August 2009
, J. Overland (NOAA/PMEL) Contact: Last updated: August 2009") North Pacific Climate Overview N. Bond (UW/JISAO), J. Overland (NOAA/PMEL) Contact: Nicholas.Bond@noaa.gov Last updated: August 2009 Summary. The North Pacific atmosphere-ocean system from fall 2008 through
North Pacific Climate Overview N. Bond (UW/JISAO), J. Overland (NOAA/PMEL) Contact: Nicholas.Bond@noaa.gov Last updated: August 2009 Summary. The North Pacific atmosphere-ocean system from fall 2008 through
The Sea Floor. Chapter 2
 The Sea Floor Chapter 2 Geography of the Ocean Basins World ocean is the predominant feature on the Earth in total area Northern Hemisphere = 61% of the total area is ocean. Southern Hemisphere = about
Muted change in Atlantic overturning circulation over some glacial-aged Heinrich events
 SUPPLEMENTARY INFORMATION DOI: 10.1038/NGEO2045 Muted change in Atlantic overturning circulation over some glacial-aged Heinrich events Jean Lynch-Stieglitz 1, Matthew W. Schmidt 2, L. Gene Henry 1,7,
3. The diagram below shows how scientists think some of Earth's continents were joined together in the geologic past.
 1. The map below shows the present-day locations of South America and Africa. Remains of Mesosaurus, an extinct freshwater reptile, have been found in similarly aged bedrock formed from lake sediments
Lecture 1. Amplitude of the seasonal cycle in temperature
 Lecture 6 Lecture 1 Ocean circulation Forcing and large-scale features Amplitude of the seasonal cycle in temperature 1 Atmosphere and ocean heat transport Trenberth and Caron (2001) False-colour satellite
Social Studies. Chapter 2 Canada s Physical Landscape
 Social Studies Chapter 2 Canada s Physical Landscape Introduction Canada s geography its landforms and climate - has a great impact on Canadians sense of identity. Planet Earth The earth is divided into
24. Ocean Basins p
 24. Ocean Basins p. 350-372 Background The majority of the planet is covered by ocean- about %. So the majority of the Earth s crust is. This crust is hidden from view beneath the water so it is not as
Ocean Sciences 101 The Marine Environment OCEA 101 THE MARINE ENVIRONMENT MID-TERM EXAM
 OCEA 101 THE MARINE ENVIRONMENT MID-TERM EXAM Part I. Multiple Choice Questions. Choose the one best answer from the list, and write the letter legibly in the blank to the left of the question. 2 points
Ocean and Climate I.
 Ocean and Climate I http://www.gerhardriessbeck.de/ Physical Characteristics of the Ocean Surface area: 3.61 10 14 m 2 Mean depth: 3.7 km Ocean volume: 3.2 10 17 m 3 Mean density: 1.035 10 3 kg/m 3 Ocean
The surface of the ocean floor is as varied as the land. The five major oceans, from largest to smallest, are
 11.1 Ocean Basins The surface of the ocean floor is as varied as the land. The five major oceans, from largest to smallest, are w the Pacific w the Atlantic w the Indian w the Southern w the Arctic The
Homework 5: Background Ocean Water Properties & Stratification
 14 August 2008 MAR 110 HW5: Ocean Properties 1 Homework 5: Background Ocean Water Properties & Stratification The ocean is a heterogeneous mixture of water types - each with its own temperature, salinity,
Physical Oceanography
 Physical Oceanography SECTION 15.1 The Oceans In your textbook, read about modern oceanography. For each item in Column A, write the letter of the matching item in Column B. e b c d a Column A 1. German
common time scale developed for Greenland and Antarctic ice core records. Central to this
 1 Supplemental Material Age scale: For the dating of the EDML and EDC ice cores (Figure S1) we used for the first time a new common time scale developed for Greenland and Antarctic ice core records. Central
8. Climate changes Short-term regional variations
 8. Climate changes 8.1. Short-term regional variations By short-term climate changes, we refer here to changes occurring over years to decades. Over this timescale, climate is influenced by interactions
Tracers. 1. Conservative tracers. 2. Non-conservative tracers. Temperature, salinity, SiO 2, Nd, 18 O. dissolved oxygen, phosphate, nitrate
 Tracers 1. Conservative tracers Temperature, salinity, SiO 2, Nd, 18 O 2. Non-conservative tracers dissolved oxygen, phosphate, nitrate Temperature itself is a tracer but other tracers (like oxygen isotopes)
The Geology of Sebago Lake State Park
 Maine Geologic Facts and Localities September, 2002 43 55 17.46 N, 70 34 13.07 W Text by Robert Johnston, Department of Agriculture, Conservation & Forestry 1 Map by Robert Johnston Introduction Sebago
Lecture 18 Paleoceanography 2
 Lecture 18 Paleoceanography 2 May 26, 2010 Trend and Events Climatic evolution in Tertiary Overall drop of sea level General cooling (Figure 9-11) High latitude (deep-water) feature Two major step Middle
Loess and dust. Jonathan A. Holmes Environmental Change Research Centre
 Loess and dust Jonathan A. Holmes Environmental Change Research Centre Why is dust important? Mineral dust is an important constituent of the solid load in Earth's atmosphere, the total atmospheric aerosol
Wednesday, November 15, 2017
 Wednesday, November 15, 2017 Northern Europe: Physical Geography Objective: Locate and describe the various traditional regions of Western Europe. Outline how the physical geography varies from region
4. What type of glacier forms in a sloping valley between rock walls? a. firn glacier b. ice sheet c. cirque d. alpine glacier
 Multiple Choice Questions 1. The term means the loss of snow and ice by evaporation and melting. a. sublimation b. ablation c. erosion d. abrasion 2. What condition must be met for a glacier to begin flowing
Sedimentary Features in Expedition 341 Cores: A Guide to Visual Core Description
 Sedimentary Features in Expedition 341 Cores: A Guide to Visual Core Description 1. Typical Deep water Sediments in the Gulf of Alaska 1A & B: Mud and 1C: Laminated mud Description: Mud is representative
Canadian Ice Service
 Canadian Ice Service Key Points and Details concerning the 2009 Arctic Minimum Summer Sea Ice Extent October 1 st, 2009 http://ice-glaces.ec.gc.ca 1 Key Points of Interest Arctic-wide The Arctic-wide minimum
The Rock Cycle The Rock Cycle illustrates the origin of igneous, sedimentary and metamorphic rocks
 The Rock Cycle The Rock Cycle illustrates the origin of igneous, sedimentary and metamorphic rocks Igneous rocks form as molten magma or lava cools and solidifies. Magma is completely or partly molten
Lecture Outline Lecture Outline Monday April 9-16, 2018 Questions? Announcements:
 Lecture Outline Lecture Outline Monday April 9-16, 2018 Questions? Announcements: Geology 101 Night Video: The Day After Tomorrow Hollywood disaster movie about the onset of a glacial period When: Monday
How do glaciers form?
 Glaciers What is a Glacier? A large mass of moving ice that exists year round is called a glacier. Glaciers are formed when snowfall exceeds snow melt year after year Snow and ice remain on the ground
Ice Sheets and Late Quaternary Environmental Change
 Ice Sheets and Late Quaternary Environmental Change Martin J. Siegert Bristol Glaciology Centre, School of Geographical Sciences University of Bristol JOHN WILEY & SONS, LTD Chichester New York Weinheim
Name Class Date. In your textbook, read about the nature of igneous rocks. Use each of the terms below just once to complete the following statements.
 CHAPTER 5 Igneous Rocks SECTION 5.1 What are igneous rocks? In your textbook, read about the nature of igneous rocks. Use each of the terms below just once to complete the following statements. basaltic
History. Late 18 th /early 19 th century Europeans observed that erratic boulders dispersed due to the retention of glaciers caused by climate chance
 Ice ages What is an ice age? Geological period of long-term reduction in the temperature of the Earth's surface and atmosphere which results in the formation and expansion of continental ice sheets, polar
UNIT 4 SEDIMENTARY ROCKS
 UNIT 4 SEDIMENTARY ROCKS WHAT ARE SEDIMENTS Sediments are loose Earth materials (unconsolidated materials) such as sand which are transported by the action of water, wind, glacial ice and gravity. These
Please be ready for today by:
 Please be ready for today by: 1. HW out for a stamp 2. Paper and pencil/pen for notes 3. Be ready to discuss what you know about El Nino after you view the video clip What is El Nino? El Nino Basics El
Oceans and Climate. Caroline Katsman. KNMI Global Climate Division
 Oceans and Climate Caroline Katsman KNMI Global Climate Division Aimée Slangen, Roderik van de Wal (IMAU, Utrecht University) Sybren Drijfhout, Wilco Hazeleger (KNMI, Global Climate) Bert Vermeersen (NIOZ/Delft
EPS 50 Lab 4: Sedimentary Rocks
 Name: EPS 50 Lab 4: Sedimentary Rocks Grotzinger and Jordan, Chapter 5 Introduction In this lab we will classify sedimentary rocks and investigate the relationship between environmental conditions and
Glaciers Earth 9th Edition Chapter 18 Glaciers: summary in haiku form Key Concepts Glaciers Glaciers Glaciers Glaciers
 1 2 3 4 5 6 7 8 9 10 11 12 13 14 Earth 9 th Edition Chapter 18 : summary in haiku form Ten thousand years thence big glaciers began to melt - called "global warming." Key Concepts and types of glaciers.
OCN 201 Mantle plumes and hot spots
 OCN 201 Mantle plumes and hot spots Question Long-term (>50 million years) changes in sea level are caused by: A. Changes in the volume of water in the ocean B. Changes in the volume of the ocean basins
SIO 210 Final Exam December 10, :30 2:30 NTV 330 No books, no notes. Calculators can be used.
 SIO 210 Final Exam December 10, 2003 11:30 2:30 NTV 330 No books, no notes. Calculators can be used. There are three sections to the exam: multiple choice, short answer, and long problems. Points are given
Physical Oceanography
 Physical Oceanography SECTION 15.1 The Oceans In your textbook, read about modern oceanography. For each item in Column A, write the letter of the matching item in Column B. Column A 1. German research