Using of GIS Spatial Analyses to Study the Selected Location for Dam Reservoir on Wadi Al-Jirnaf, West of Shirqat Area, Iraq
|
|
|
- Peter Ward
- 6 years ago
- Views:
Transcription
 Using of GIS Spatial Analyses to Study the Selected Location for Dam Reservoir on Wadi Al-Jirnaf, West of Shirqat Area, Iraq Sabbar Abdulla Salih, Abdul Salam Mehdi Al-Tarif Natural")
1 Journal of Geographic Information System, 2012, 4, Published Online April 2012 ( Using of GIS Spatial Analyses to Study the Selected Location for Dam Reservoir on Wadi Al-Jirnaf, West of Shirqat Area, Iraq Sabbar Abdulla Salih, Abdul Salam Mehdi Al-Tarif Natural Resources Research Center, University of Tikrit, Tikrit, Iraq Received October 19, 2011; revised December 18, 2011; accepted January 13, 2012 ABSTRACT The GIS data of digital elevation model, topographic maps of different scales, satellite images and GPS were used to analyze the geometrical relations, bathometric properties and shape form of selected depressions on Al-Jirnaf valley. GIS was used to analyze the hydromorphometry and geometry of the depressions, these analyses explain the role of main valley s contribution to the hydrology of the valley, then, three locations for water storage were suggested. 2D and 3D models of the sites were given, the maximum level, volume, surface area, circumference, shape factor of three supposed reservoirs calculated for different hypothetical levels of water in the reservoir, and the optimal level were determined, the maximum suggested levels are 190, 185 and 180 m, the areas are 3.25, 7.97 and km 2, the volumes are , and km 3 for the three locations respectively. This experimental procedure can be repeated in other depressions for the same purpose. Keywords: GIS; Spatial Analysis; Geometry; Dam Reservoir; Iraq 1. Introduction The studied area extends northwest of Shirqat, from Miran Village (northwest) to Horiyah Village (southeast), and spill in Tigris River in the south border of this village, the basin of the valley is covered about 579 km 2 (Figure 1). The valley flooded by the water of small tributaries of dendritic pattern from northern and eastern areas, the length of main valley is about 36.4 km, the elevation of bottom of upstream valley is about 250 m asl, but decreased to 155 m asl in the suggested locations of the dam (Figure 1). Geomorphologically, the area under study situated at the transition area between the southwest part of the foot hill zone and unfolded zone on the physiographical classifications of Iraq [1]. The annual rainfall in the area about 230 mm, thus the main percent of rainfall in the area during the wet season from December to March. The basin of the valley located in the transition area between arid-semi arid zone, it is characterized by high evaporation, especially during the hot summer, and thus the location of the suggested reservoir must be deep depression with low surface area to decrease the area of evaporation. There are no detail previous studies about the area, but there are few studies about the water harvesting from the seasonal valleys in different areas in Iraq such as the studies of Thathar Valley. The results of these studies encourage this study. Iraq has a hard water deficit, especially during the dry seasons, because of the non-homogeneous distribution of water resources. The water shortage led to decrease the agricultural and grazing areas. The subject of water management has great importance in Iraq especially in the regions that have low water resources. From this point of view, it is well known in a lot of countries to build small dams on the seasonal valleys for better management of water that to be used of agriculture and irrigation purposes. The advantages of this project in the future are to increase the population density in area and decrease the migration. Also, to increase the area of agriculture and pastures. The present study aimed to: Investigate the morphometric parameters and drainage pattern of the valley watershed, which explain the main subasins which control the gathering of water to the main valleys, these parameters must be taken in consideration in the selection of dams and reservoirs locations. Determine the own watershed for every selected location of the dam. Determine the maximum level for every reservoir.
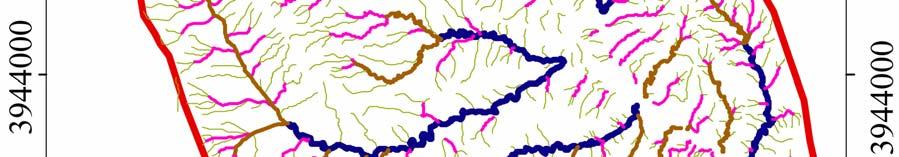
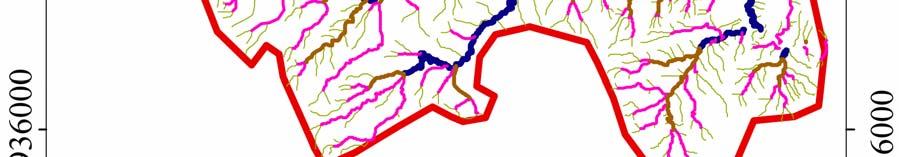
2 118 S. A. SALIH ET AL. Figure 1. The studied area. Evaluation of geometrical parameters, such as volume, surface area, depth and shape of every topographic depression which is suggested as reservoir, using the geographic information system to select the optimal location. 2. Materials and Methods Digital elevation data, topographic maps of scale 1:125000, satellite image which cover the area of study used to derive the morphometric and geometric parameters. The boundaries of the watershed derived from the digital elevation data by software Global Mapper V-10.00, the software ArcGIS V-9.2 used to derive the layers of different orders of valleys from the topographic maps. According to the results of morphometric analyses, three locations were selected as suggested water reservoir. The path profiles were done by Global Mapper in the three selected locations, also the watersheds of the selected reservoirs were derived. The digital elevation data exported from Global Mapper as a SURFER grids to draw the 3D models and to extract the data of geometric analyses for the suggested locations. The watershed and location of water body were projected on the watershed area of the valley. The levels, surface areas, volume of reservoirs, determined for every suggested location using SURFER software. 3. Results and Discussions The valleys of the orders 1-6 derived from the source maps using ArcGIS, the orders 1 st, 2 nd, 3 rd reflect an idea about the drainage pattern, but not reflect an impression about the main subasins in the area (Figures 2-4), the valleys of 4 th order give a clear idea about the subasins and integrate the illustration of drainage pattern (Figure 5). The behavior of 5 th and 6 th order support the ideas of selection of the optimum locations for water storage, and the division of the total watershed as sub-divisions as watersheds for suggested locations (Figures 6 and 7). The geomorphologic 3D model (Figure 8), reveal to the gentle gradient of the valleys on the southwestern side more than the northeastern, this phenomenon may be reflect the effect of the geological structures of the area, the behavior of valleys in the middle of western side of main channel reflect faults phenomena. The studies of basins have a hydrological indicators, such as drainage properties, hydrology of streams and sedimentation [2]. Morphometric analyses used to study the properties of the basin. The basic of this technique suggested by [3] and developed by [4]. The morphometric properties of the basins related directly with physiographic and structural factors, especially the geological structures, climate, plant cover and any another changes [5].


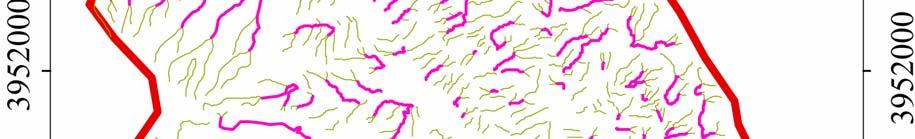
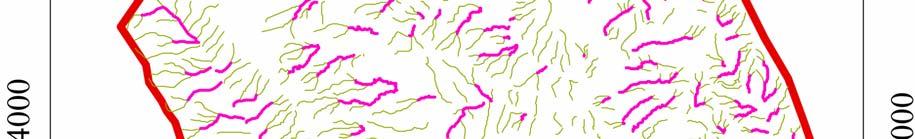
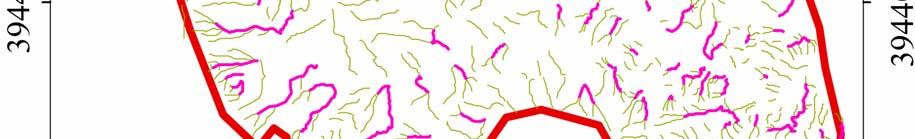
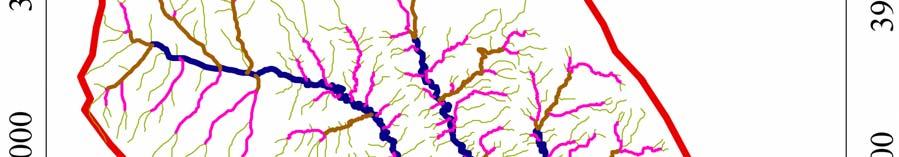
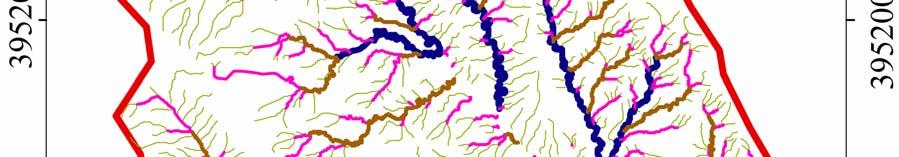
3 S. A. SALIH ET AL. 119 Figure 2. The valleys of 1 st order in the studied watershed. Figure 4. The valleys of 3 rd order in the studied watershed. Figure 3. The valleys of 2 nd order in the studied watershed. Figure 5. The valleys of 4 th order in the studied watershed.


 The topographic maps of scales (1:100000,")
.")
, the circumference, area and")
.")

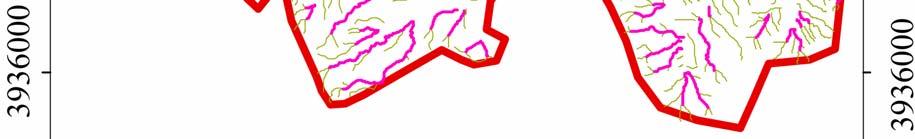
4 120 S. A. SALIH ET AL. Figure 6. The valleys of 5 th order in the studied watershed. Figure 7. The valleys of 6 th order in the studied watershed. (a) Figure 8. Three dimentional models of the studied valley basin ((a) front view and (b) side view). (b) The topographic maps of scales (1:100000, 1:50000, and 1:25000) used to draw the drainage system of the basin (Figure 7). The number and length of stream orders were determined (Table 1), the circumference, area and length of the basins were measured and used for the mophometric analyses (Table 2). The drainage basin represent the basic unit for the morphometric analyses because the area, circumference, length and width of drainage basin can be measured [6], therefore, the morphometric analyses used to predict the relation between the geomorphologic properties and the characters of the stream.
5 S. A. SALIH ET AL. 121 Table 1. Stream orders and bifurcation factors of Wadi-AlJirnaf basin. Order / 1 3 / 2 4 / 3 5 / 4 6 / 5 Number of valleys Total length of valleys Table 2. Morphometric properties of Wadi-AlJirnaf basin. Property Value Property Value Area km highest point (m) 262 Circumference km lowest point (m) 152 Actual basin Length km 36.4 Consolidation Factor Optimum basin length km 34 Relief Ratio m/km 1.01 Width of basin 20.9 Roughness Factor m/km Area consistency 0.61 Longitudinal Drainage Density 2.06 Circumference consistency 1.28 Numerical Drainage Density 2.1 Basin form factor Shape and Area Properties These properties are very important to get the quantum relations which used to determine the shape and hydrogeology of the basin. The determination of the area of the basin is very important because its effect on the volume of the discharge. The main shape properties of the basin is: Area Consistency Ratio (ACR) It means the convergence of the shape of the basin to the shape circle, this ratio calculated from the relation below [7]: ACR = Ab/a, When: ACR = Area consistency ratio; Ab = area of the basin (km 2 ); a = area of circle which have the same circumference of the basin. The value of ACR less than or equal to (1) [8]. The area of the basin determine by personal geodatabase of ArcGIS. Then the area consistency ratio of the studied valley equal to: ACR = 579.5/ = 0.61 If the value of a ACR approach to (1) that reveals to the convergence of the shape of basin to the circle which characterized by high discharge. While the decreasing of the ratio reveal an elongated shape of the basin which cause the elongation of the stream and the delay of flooding wave. The medium area consistency ratio of the studied case (0.61) indicates the ellipsoid to elongated shape of the basin, that lead to the medium to high flooding velocity with high discharge and high sediment transport, this parameter one of the controlling factors on the design of the suggested dam Circumference Consistency Ratio (CCR) This ratio calculated from the relation below [9]: CCR 1 ACR, When: CCR = circumference consistency ratio, ACR = Area consistency ratiol. CCR When highest ACR then lowest CCR, the value of this ratio always more than (1). The increasing of this value reveals to divergence of the shape of basin from the circle to ellipsoid. The value of CCR (1.28) confirms the above conclusion about the medium flooding velocity, which one of the controlling factors on the design of the suggested dam Basin Form Factors (BFF) It reflects the convergence and divergence of the shape of the basin from the triangle shape, the increasing of this value reveal to convergence to the triangle shape, it is very important to determine the velocity of flooding wave and the annual flow system [2]. In addition, it is determined the ratio between average width to longer axial length for the basin described as the distance between the basin outlet to distal point of the basin, while the width of the basin determined by the division of the basin area on the axial length. The value of this factor ranged between (0-1) the increasing of value reveal triangular shape of high discharge. BFF determined from the relation below [9]. BFF = Ab/L 2 When, BFF = Basin Form Factor, Ab = area of the basin (km 2 ), L = Actual basin length (km), BFF = 579.5/(36.4) 2 = 0.44 The basin form affect the volume of discharge and flow velocity which cause the increasing of sedimentation in the circular basin with respect to elongated basin. The low value of BFF (0.44) indicates the decreasing of sedimentation in the bottom valley which reveal to low trap efficiency, also, indicate the water losing by evaporation and infiltration Consolidation Factor (CF) The factor indicate the symmetry between the circumference and the total area of the basin, the high value of the factor reveal to the increase of meandering.
6 122 S. A. SALIH ET AL. CF = ((length of circumference) 2 /(area of the basin) 4 (3.14) = The low value of the parameter indicate to low meandering of the valley tributaries Relief Factors Relief Ratio (RR) It represents the diversity between highest (HL) and lowest (LL) point of the basin (m)/circumference (km). RR = 110/109.3 = 1.01 m/km. The ratio reflects medium value of RR which refers to medium surface gradient of the area Roughness Factor (RF) It represents the relation between the Longitudinal Drainage Density and the total length of valleys. RF = (LDD) km/km 2 (HL-LL)/Circumstance of the basin = ( )/109.3 = 2.07 m/km 2. The factor reflects medium value of RF which refers to medium roughness of the area Discharge Properties and Morphometric Analyses Morphometric studies determine the factors which affect the velocity and discharge and its ability to sediments transport. The morphometric analyses which explained in (Figure 7) used to study the effect of morphometry on the discharge properties as that follows: Stream Orders The determination of stream order of the basins is very important to study the amount of water discharge of all valley [10]. The stream order of the basins reflect the ability of erosion and sedimentation to avoid the effect of erosion on the land, as well as the effect of flooding. There are many of methods to determine the stream orders as in [3,4], but the most common and simple method is strahler one [9] (Al-Nakkash, and Al-Sahhaf, 1989). In this method the first order represented by the valley which haven t branches, when two branches connected together to form second order valley, the stream orders of the area were determined by this method, the maximum stream order is 6 th order, and the number of valleys in every order was listed in (Table 1). The ArcGIS-9 software used to measure the length of valleys in every order. These lengths listed in (Table 1) Bifurication Ratio It is the ratio between the number of the branches in any stream order to the number of branches of the next order, the ratio calculated depends on the equation below: BR = N n /N n+1, When, BR = Bifurcation ratio, N n = the number of branches in any stream order, N n+1 = the number of branches in the next stream order. The minimum theoretical value of this ratio is (2), it is always ranged between (3-5), [3] (Horton, 1945), it reflects of the climatological, geological, and morphological conditions of the area, it is one of important factors that control the discharge, [11]. The bifurcation ratio of the studied area tabled in Table 1, this ratio equal to 4, 4.5, 3.9, 3.25 and 4 for the 1 st, 2 nd, 3 rd, 4 th and 5 th orders respectively. The high ratios reflect that the valleys of these orders are located in the zone of weathering. The zone of sedimentation located out of the area of study to the direction of downstream Drainage Density The drainage density is very important factor related with the geomorphology and hydrology, it reflects the flow method of surface water which effected by geology, gradient, plant cover, quantity and intensity of precipitation [8]. This factor represents indirect indicator to the length of valleys, it is ranged between (600 m)/km 2 for the basins of low discharge to more than (3 km)/km 2 for the basins of high discharge [12]. In the case of high drainage density, the drainage peak is high, and vice versa [13]. The area of low drainage density characterized by rough texture, while the area of high drainage density have a soft texture as a result of low resistance of soil material against the erosion or the hidden of plant cover. [14], there are two types of drainage density [9]: Longtudinal Drainage Density (LDD) It is the ratio between the summation of the valleys lengths in the basin (SL) to the area of the basin (Ab), LDD = SL/Ab = /579.5 = Numerical Drainage Density (Stream Frequency) (NDD) It is the ratio between the number of the valleys in the basin (SN) to the area of the basin (Ab). LDD = SN/Ab = 1219/579.5 = 2.1. The number of valleys in every stream order and the length of these valleys are tabled in Table 1. The value of the two types of drainage density reveal to high drainage of the basin Reflecting Facctor (RF) It is an important factor to determine the meandering that has negative effect up on the flow in the stream [9]: RF = L/Ol = 36.4/34 = 1.07, where Rf = Reflecting factor, L = the actual basin length of the valley (Km), Ol = the optimum basin length of the valley (km) The reflection of the stream graded from the straitening to the reflecting where the sedimentation occurs in

7 S. A. SALIH ET AL. 123 one of the stream sides and the erosion occurs in the other side, depending on the changes in discharge and sediment transport that effected by the geology, topography, plant cover, soil properties, and land use [15]. The maximum axial straight length (optimum) and maximum axial actual length in the valley listed in (Table 1) and the reflecting factor of the area is 1.07, this high value interpreted by the high reflection of the valleys of 4 th orders in the connection points with the valley of 5 th order. The high reflection in this valley may be interpret by the effect of structural effects such as the existence of fault Drainage Patterns Drainage pattern means the shape or form of the drainage channels on the earth surface, it is a reflection of geological structures, rock hardness, earth movements, geological history and geomorphology of the basin [16]. The patterns differ from area to another depending on the gradient, the existence of joints and cracks, depending on the variety of properties of these factors, the drainage chan- nels develop the drainage system [5], the drainage pattern traced from the topographic map of scales (1/100,000, 1:50,000 and 1:25,000) (Figure 7) [17]. Two types of drainage pattern were recognized in the studied basin: Dendritic Pattern This pattern occurs in the areas of homogeneous hardness, it is characterized by non systematic branches. It also appear in flat areas because the variety of rock hardness is very low and not affect the drainage directions. The branching density of valleys vary in this type of pattern depending on precipitation, it increase with the increasing of precipitation, and vice versa [18]. This type of pattern characterized by the quickness of water flow. The pattern texture mean the number of branches and the distance between them in the basin, the texture named soft texture when the distance between the channels less than 100 m, medium texture when the distance ranged between 100 m m, and named rough texture if the distance more than 1000 m [19]. The drainage map (Figure 7) clarify that the dendritic drainage pattern clearly appear in the studied area. and the maximum levels, horizontal extensions of every section were plotted in (Figures 9-11), the longitudinal section in (Figure 12) reflect the gentle and stable gradient of the valley. The watershed of every suggested location derived from the digital elevation data by Global Mapper and exported to SURFER v-8, the derived data processed and projected on the area of total watershed of Jirnaf valley to explain the location of own watershed for every location as in (Figure 13). The digital elevation data of dam reservoir for each suggested location derived by Global Mapper DEM and exported to SURFER, the derived data processed and projected on the area of total watershed of Jirnaf valley to explain the location of own reservoir for every suggested location as in (Figure 14). The watershed of every suggested location derived from the digital elevation data by Global Mapper and exported to SURFER v-8, the derived data processed and projected on the area of total watershed of Jirnaf valley to explain the location of own watershed locations as in (Figure 13). The digital elevation data of reservoir for each suggested location derived by Global Mapper DEM and exported to SURFER, the derived data processed and projected on the area of watershed of Jirnaf valley to explain the location of own reservoir for suggested locations (Figure 14) Parallel Pattern This pattern occurs in the areas of high gradient, and when the existence of structural barriers. The distance between the parallel valleys controlled by structures and the topography of the area Geometry of Suggested Reservoir According to the results of morphometric analyses of the valley watershed, three sections were selected as locations for suggested dams on the necks of major valleys, Figure 9. The 1 st selected locations of suggested dam on the necks of major valleys, and the section of selected location.


8 124 S. A. SALIH ET AL. Figure 10. The 2 nd selected locations of dam on the necks of major valleys, and the section of selected location. Figure 11. The 3 rd selected locations of suggested dam on the necks of major valleys, and the section of selected location. Figure 12. The longitudinal section of the Al-Jirnaf valley, it reflects the gentle and stable gradient along the section.

 for the 2 nd and (blue + violet + rose) for")


9 S. A. SALIH ET AL. 125 Figure 13. The watershed of the suggested locations, blue represent the watershed of 1 st location, (blue + violet) for the 2 nd and (blue + violet + rose) for the 3 rd location, (blue + violet + rose + orange) represent the total watershed of the valley. Figure 14. The locations of suggested reservoirs within the total watershed of valley. Table 3. The geometrical parameters of suggested reservoirs. Location Maximum level Area km 2 Volume km 3 1 st nd rd
10 126 S. A. SALIH ET AL rived and projected on the watershed of the valley. 4) The hypothetical maximum water levels, surface area and volume, were derived for suggested reservoirs. 5) The acquired data can be used by the decision makers and designers to chose the optimum location. Area (km 2 ) st 2nd 3rd Figure 15. The variation of surface area of three suggested reservoirs. Volume km st 2nd 3rd Figure 16. The variation of volume of three suggested reservoirs. The hypothetical geometrical parameters of suggested reservoirs represented by maximum water levels, surface area and volume, were derived by the option of volumetric data in SURFER V-8 (Table 3 and Figures 15 and 16), the acquired data can be used by the decision makers and designers to chose the optimum location after achievement the addition studies of engineering and structural geology, economical and environmental evaluations, and the ownership of the acres in the areas. 4. Conclusions REFERENCES [1] T. Buday and S. Z. Jassim, The Regional Geology of Iraq. Vol. 2: Tectonism, Magmatism and Metamorphism, Publication of the Geological Survey of Iraq, Baghdad, [2] M. M. A. Al-Sahhaf and K. M. Al-Hassan, Hydromophometry of Al-Khawsar Basin, Study of Applied Geomorphology, Journal of Iraqi Geography Society, Al-Ani Press, Baghdad, [3] R. E. Horton, Erosional, Development of Streams and Their Drainage Basins, Hydrophysical Approach to Morphology, Geological Society of American Bulletin, Vol. 56, No. 3, 1945, pp doi: / (1945)56[275:edosat]2.0.co;2 [4] A. N. Strahler, Quantitative Analyses of Watershed Geomorphology, Transactions on American Geophysical Union, Vol. 38, No. 6, 1954, pp [5] H. R. Sallama, Geomorphological Analyses of Morphometric Properties of Water Basins in Jordan, Dirasat Journal, Vol. 7, No. 1, 1980, pp [6] P. Macula, Modern Idea in Geomorphology, 6th Edition, University of Baghdad, Baghdad, [7] M. F. Al-Moula, Morphometric Study for Specifying Location of Dam in Wadi Al-Tharthar Basin North of Hatra Using Remote Sensing Techniques, M.Sc. Thesis, University of Mosul, Mosul, [8] S. T. Jabbori, Hydrology and Water Management, Dar Al-Kutub Press, Mosul, [9] A. B. Al-Naqqash and M. A. Al-Sahhaf, Geomorphology, National Library in Baghdad University, Baghdad, [10] A. N. Strahler, Geomorphology, Dar Al-Zaman Press, Baghdad, [11] M. M. Ashor, Morphometric Analyses Methods for Water Drainage Nets, Qatar University, Doha, [12] B. A. Kashif Al-Ghitaa, Hydrology and Application, Ministry of Higher Education, Organization of Technical Institutes, Baghdad, [13] M. S. Hassan, B. Kh. Dawood and S. M. Al-Rawi, Engineering Hydrology, Dar Al-Kutub Press, Mosul, [14] S. Buhairi, Geomorphology, Dar Al-Fikir Press, Damascus, [15] F. H. Al-Neash, Tigris River Meandering between Senhareeb Dam and Greater Zab Link, Ph.D. Thesis, University of Mosul, Mosul, [16] W. D. Thornberry, Principles of Geomorphology, Dar Al-Kutub Press, Mosul, [17] Directorate of Military Survey, Base Map of Sharqat Area, 1-38-B-02, Scale: 1:50000, ) According to morphometric analyses, three suitable locations were selected for water reserve in the valley. 2) The own watershed for every location were derived and projected on the total watershed of the valley. 3) The own water reservoir for every location were de- [18] A. A. Al-Babwati, The Geomorphological Features of
11 S. A. SALIH ET AL. 127 Tharthar Valley, M.Sc. Thesis, University of Baghdad, Baghdad, [19] R. A. Zuidam and F. I. Zuidam, Terrain Analyses and Classification Using Aerial Photographs, Textbook of Photo Interpretation, Vol. 7, ITC, Enschede, 1979.
MORPHOMETRIC ANALYSIS OF WATERSHEDS IN THE KUNIGAL AREA OF TUMKUR DISTRICT, SOUTH INDIA USING REMOTE SENSING AND GIS TECHNOLOGY
 MORPHOMETRIC ANALYSIS OF WATERSHEDS IN THE KUNIGAL AREA OF TUMKUR DISTRICT, SOUTH INDIA USING REMOTE SENSING AND GIS TECHNOLOGY PROJECT REFERENCE NO. : 37S1170 COLLEGE : SIDDAGANGA INSTITUTE OF TECHNOLOGY,
Morphometric Estimation of Parameters of Uttar Mand River Basin, Satara District, Maharashtra, India.
 Morphometric Estimation of Parameters of Uttar Mand River Basin, Satara District, Maharashtra, India. Mr.S.S.Chokakkar 1, Mr.G.N.ChavanPatil, Dr.D.N.Mudgal 3, Dr..Shreenivasa 4 1M.Sc., B.Ed, NET, PhD(Pur.)
Chapter IV MORPHOMETRIC ANALYSIS AND STREAM NETWORK CHARACTERISTICS IN GADAG DISTRICT
 Chapter IV MORPHOMETRIC ANALYSIS AND STREAM NETWORK CHARACTERISTICS IN GADAG DISTRICT 4.1 INTRODUCTION: Streams and rivers are the most dynamic parts of the earth s physical environment. The behavior of
Basin characteristics
 Basin characteristics From hydrological processes at the point scale to hydrological processes throughout the space continuum: point scale à river basin The watershed characteristics (shape, length, topography,
About the Author: E mail ID: Contact: proceedings. Page 1 of 8
 Catchment Delineation and Morphometric Analysis Using Geographical Information System of Naina Gorma Basin of Rewa District, M.P., India Vimala Singh 1, L.K. Sinha 2 Research Associate 1, DTRL, DRDO Scientist
International Journal of Research (IJR) Vol-1, Issue-10 November 2014 ISSN
 Vol-1, Issue-10 November 2014 ISSN") Morphological Parameter Estimation Derived From ASTER-DEM Using GIS and Remote Sensing Techniques A Study on Hosakote Watershed of Dakshina Pinakini River Basin, Karnataka, India K. Satish 1* and H.C.
Morphological Parameter Estimation Derived From ASTER-DEM Using GIS and Remote Sensing Techniques A Study on Hosakote Watershed of Dakshina Pinakini River Basin, Karnataka, India K. Satish 1* and H.C.
INTERNATIONAL JOURNAL OF GEOMATICS AND GEOSCIENCES Volume 1, No 4, 2011
 Morphometric analysis of Nanjangud taluk, Mysore District, Karnataka, India, using GIS Techniques Mahadevaswamy.G 1, Nagaraju.D 1, Siddalingamurthy.S 1, Lakshmamma 1, Mohammad Subhan lone, Nagesh.P.C 2,
mountain rivers fixed channel boundaries (bedrock banks and bed) high transport capacity low storage input output
 high transport capacity low storage input output") mountain rivers fixed channel boundaries (bedrock banks and bed) high transport capacity low storage input output strong interaction between streams & hillslopes Sediment Budgets for Mountain Rivers Little
mountain rivers fixed channel boundaries (bedrock banks and bed) high transport capacity low storage input output strong interaction between streams & hillslopes Sediment Budgets for Mountain Rivers Little
Each basin is surrounded & defined by a drainage divide (high point from which water flows away) Channel initiation
 Channel initiation") DRAINAGE BASINS A drainage basin or watershed is defined from a downstream point, working upstream, to include all of the hillslope & channel areas which drain to that point Each basin is surrounded &
DRAINAGE BASINS A drainage basin or watershed is defined from a downstream point, working upstream, to include all of the hillslope & channel areas which drain to that point Each basin is surrounded &
Civil Engineering Journal
 Available online at www.civilejournal.org Civil Engineering Journal Vol. 1, No. 2, December, 2015 Comparative Study of Landsat and Aster Data by Morphometric Analysis Sujit Kumar a*, Tapasi Bhandary b
Morphometric Analysis of Chamundi Hills, Mysuru, India Using Geographical Information System
 Volume-7, Issue-1, January-February 2017 International Journal of Engineering and Management Research Page Number: 279-283 Morphometric Analysis of s, Mysuru, India Using Geographical Information System
Simplify Equation to Calculate Elongation River Basin Proposed by Schumm (1956)
") Simplify Equation to Calculate Elongation River Basin Proposed by Schumm (1956) Dr. Saad.A.Mubark.aldarraji.Assisent Professor. Department of Geography. Faculty of Education.Ibn Rushed. Baghdad University.
Simplify Equation to Calculate Elongation River Basin Proposed by Schumm (1956) Dr. Saad.A.Mubark.aldarraji.Assisent Professor. Department of Geography. Faculty of Education.Ibn Rushed. Baghdad University.
Flood management in Namibia: Hydrological linkage between the Kunene River and the Cuvelai Drainage System: Cuvelai-Etosha Basin
 Flood management in Namibia: Hydrological linkage between the Kunene River and the Cuvelai Drainage System: Cuvelai-Etosha Basin By: Leonard Hango Department of Water Affairs and Forestry Ministry of Agriculture
Which map shows the stream drainage pattern that most likely formed on the surface of this volcano? A) B)
 B)") 1. When snow cover on the land melts, the water will most likely become surface runoff if the land surface is A) frozen B) porous C) grass covered D) unconsolidated gravel Base your answers to questions
1. When snow cover on the land melts, the water will most likely become surface runoff if the land surface is A) frozen B) porous C) grass covered D) unconsolidated gravel Base your answers to questions
CAUSES FOR CHANGE IN STREAM-CHANNEL MORPHOLOGY
 CAUSES FOR CHANGE IN STREAM-CHANNEL MORPHOLOGY Chad A. Whaley, Department of Earth Sciences, University of South Alabama, MobileAL, 36688. E-MAIL: caw408@jaguar1.usouthal.edu The ultimate goal of this
Running Water Earth - Chapter 16 Stan Hatfield Southwestern Illinois College
 Running Water Earth - Chapter 16 Stan Hatfield Southwestern Illinois College Hydrologic Cycle The hydrologic cycle is a summary of the circulation of Earth s water supply. Processes involved in the hydrologic
FOREST RESEARCH INSTITUTE, DEHRADUN
 PROJECT REPORT DRAINAGE AND REPLENISHMENT STUDY OF MINED AREA OF GANGA SHYAMPUR RIVER HARIDWAR Submitted to UTTARAKHAND FOREST DEVELOPMENT CORPORATION (UFDC) 73, Nehru Road, Deharadun Prepared&Submitted
HYDROLOGIC AND WATER RESOURCES EVALUATIONS FOR SG. LUI WATERSHED
 HYDROLOGIC AND WATER RESOURCES EVALUATIONS FOR SG. LUI WATERSHED 1.0 Introduction The Sg. Lui watershed is the upper part of Langat River Basin, in the state of Selangor which located approximately 20
Gully erosion and associated risks in the Tutova basin Moldavian Plateau
 Landform Analysis, Vol. 17: 193 197 (2011) Gully erosion and associated risks in the Tutova basin Moldavian Plateau University Alexandru Ioan Cuza of Iasi, Department of Geography, Romania, e-mail: catiul@yahoo.com
MORPHOMETRIC ANALYSIS OF ADYAR WATERSHED
 MORPHOMETRIC ANALYSIS OF ADYAR WATERSHED A.K.Bharadwaj 1,Pradeep.C 2,D.Thirumalaivasan 3,C.P.Shankar 4, N.Madhavan 5 1,2,3,4,5 Institute of Remote Sensing, Anna University, Guindy, Chennai, India- 600025.
IMPACT OF CLIMATE CHANGE OVER THE ARABIAN PENINSULA
 IMPACT OF CLIMATE CHANGE OVER THE ARABIAN PENINSULA By: Talal Alharbi June, 29 2017 1 Motivation: In arid and semi-arid regions of the world the demand for fresh water resources is increasing due to: increasing
Erosion Surface Water. moving, transporting, and depositing sediment.
 + Erosion Surface Water moving, transporting, and depositing sediment. + Surface Water 2 Water from rainfall can hit Earth s surface and do a number of things: Slowly soak into the ground: Infiltration
Morphometric Analysis Of Bhogavati River Basin, Kolhapur District, Maharashtra, India.
 IOSR Journal of Mechanical and Civil Engineering (IOSR-JMCE) ISSN: 2278-1684, PP: 01-08 www.iosrjournals.org Morphometric Analysis Of Bhogavati River Basin, Kolhapur District, Maharashtra, India. P. A.
MORPHOMETRY OF BUGGAVANKA WATERSHED IN KADAPA, ANDHRA PRADESH, INDIA USING SPATIAL INFORMATION TECHNOLOGY
 BEST: International Journal of Humanities, Arts, Medicine and Sciences (BEST: IJHAMS) ISSN 2348-0521 Vol. 3, Issue 2, Feb 2015, 1-8 BEST Journals MORPHOMETRY OF BUGGAVANKA WATERSHED IN KADAPA, ANDHRA PRADESH,
GRAPEVINE LAKE MODELING & WATERSHED CHARACTERISTICS
 GRAPEVINE LAKE MODELING & WATERSHED CHARACTERISTICS Photo Credit: Lake Grapevine Boat Ramps Nash Mock GIS in Water Resources Fall 2016 Table of Contents Figures and Tables... 2 Introduction... 3 Objectives...
Floodplain modeling. Ovidius University of Constanta (P4) Romania & Technological Educational Institute of Serres, Greece
 Romania & Technological Educational Institute of Serres, Greece") Floodplain modeling Ovidius University of Constanta (P4) Romania & Technological Educational Institute of Serres, Greece Scientific Staff: Dr Carmen Maftei, Professor, Civil Engineering Dept. Dr Konstantinos
Floodplain modeling Ovidius University of Constanta (P4) Romania & Technological Educational Institute of Serres, Greece Scientific Staff: Dr Carmen Maftei, Professor, Civil Engineering Dept. Dr Konstantinos
GEOGRAPHY (029) CLASS XI ( ) Part A: Fundamentals of Physical Geography. Map and Diagram 5. Part B India-Physical Environment 35 Marks
 CLASS XI ( ) Part A: Fundamentals of Physical Geography. Map and Diagram 5. Part B India-Physical Environment 35 Marks") GEOGRAPHY (029) CLASS XI (207-8) One Theory Paper 70 Marks 3 Hours Part A Fundamentals of Physical Geography 35 Marks Unit-: Geography as a discipline Unit-3: Landforms Unit-4: Climate Unit-5: Water (Oceans)
GEOGRAPHY (029) CLASS XI (207-8) One Theory Paper 70 Marks 3 Hours Part A Fundamentals of Physical Geography 35 Marks Unit-: Geography as a discipline Unit-3: Landforms Unit-4: Climate Unit-5: Water (Oceans)
Geography Class XI Fundamentals of Physical Geography Section A Total Periods : 140 Total Marks : 70. Periods Topic Subject Matter Geographical Skills
 Geography Class XI Fundamentals of Physical Geography Section A Total Periods : 140 Total Marks : 70 Sr. No. 01 Periods Topic Subject Matter Geographical Skills Nature and Scope Definition, nature, i)
Hydrological Modeling of Semi-Arid Region in Ungauged Watershed using AGWA Model
 Hydrological Modeling of Semi-Arid Region in Ungauged Watershed using AGWA Model 1,* Adnan Ismael, 2 Saleh Suleiman and 3 Abdulnaser Ahmed 1 Lecturer, Technical Institute/ Northern Technical University,
DROUGHT RISK EVALUATION USING REMOTE SENSING AND GIS : A CASE STUDY IN LOP BURI PROVINCE
 DROUGHT RISK EVALUATION USING REMOTE SENSING AND GIS : A CASE STUDY IN LOP BURI PROVINCE K. Prathumchai, Kiyoshi Honda, Kaew Nualchawee Asian Centre for Research on Remote Sensing STAR Program, Asian Institute
CHAPTER V WATERSHED CHARACTERIZATION USING GIS
 61 CHAPTER V WATERSHED CHARACTERIZATION USING GIS 5.1 GENERAL: In this chapter, introduction to watershed characterization and analysis has been presented in the first part. Methodology to compute important
Gis Based On Morphometric Analysis of Part of Manair River Basin in Karimnagar District, Telangana State.
 IOSR Journal of Applied Geology and Geophysics (IOSR-JAGG) e-issn: 0990, p-issn: 098.Volume, Issue Ver. II (Sep. Oct. 07), PP 0-07 www.iosrjournals.org Gis Based On Morphometric Analysis of Part of Manair
Morphometric Analysis for Hard Rock Terrain of Upper Ponnaiyar Watershed, Tamilnadu A GIS Approach
 International Journal of Research Studies in Science, Engineering and Technology Volume 1, Issue 9, December 2014, PP 205-209 ISSN 2349-4751 (Print) & ISSN 2349-476X (Online) Morphometric Analysis for
Surface Processes Focus on Mass Wasting (Chapter 10)
") Surface Processes Focus on Mass Wasting (Chapter 10) 1. What is the distinction between weathering, mass wasting, and erosion? 2. What is the controlling force in mass wasting? What force provides resistance?
Surface Processes Focus on Mass Wasting (Chapter 10) 1. What is the distinction between weathering, mass wasting, and erosion? 2. What is the controlling force in mass wasting? What force provides resistance?
MORPHOMETRIC ANALYSIS OF LAKSHMANTIRTHA RIVER BASIN AROUND HUNSUR TALUK, MYSORE, KARNATAKA, (INDIA)
") MORPHOMETRIC ANALYSIS OF LAKSHMANTIRTHA RIVER BASIN AROUND HUNSUR TALUK, MYSORE, KARNATAKA, (INDIA) Nilufer Arshad* and G.S. Gopalakrishna DOS in Geology University of Mysore, Mysore, (INDIA) Received
MORPHOMETRIC ANALYSIS OF LAKSHMANTIRTHA RIVER BASIN AROUND HUNSUR TALUK, MYSORE, KARNATAKA, (INDIA) Nilufer Arshad* and G.S. Gopalakrishna DOS in Geology University of Mysore, Mysore, (INDIA) Received
Data Repository. Spatiotemporal trends in erosion rates across a pronounced rainfall gradient: examples from the south central Andes
 Data Repository Spatiotemporal trends in erosion rates across a pronounced rainfall gradient: examples from the south central Andes Bodo Bookhagen 1 and Manfred R. Strecker 2 1 Geography Department, Ellison
Synoptic Analysis of Total Rainfall Patterns at Azerbaijan District.
 Synoptic Analysis of Total Rainfall Patterns at Azerbaijan District Samad Vahdati 1, Shahrokh Shahrokhi Shirvani 2, Abolfazl Nazari Giglou 3 1,3 Department of Civil Engineering, Parsabad Moghan Branch,
Mutah university faculty of Social Sciences The Study plan of the department of Geography 2006/2007
 Mutah university faculty of Social Sciences The Study plan of the department of Geography 2006/2007 Requirements university compulsory 22 Credit hours Course No Credit hours Prerequisite Requirements Faculty
Hydrologic Modelling of the Upper Malaprabha Catchment using ArcView SWAT
 Hydrologic Modelling of the Upper Malaprabha Catchment using ArcView SWAT Technical briefs are short summaries of the models used in the project aimed at nontechnical readers. The aim of the PES India
GEOL 1121 Earth Processes and Environments
 GEOL 1121 Earth Processes and Environments Wondwosen Seyoum Department of Geology University of Georgia e-mail: seyoum@uga.edu G/G Bldg., Rm. No. 122 Seyoum, 2015 Chapter 6 Streams and Flooding Seyoum,
MORPHOMETRIC ANALYSIS OF TURSIQ BASIN EAST OF IRAQ USING REMOTE SENSING AND GIS TECHNIQUES
 MORPHOMETRIC ANALYSIS OF TURSIQ BASIN EAST OF IRAQ USING REMOTE SENSING AND GIS TECHNIQUES Mutasim Ibrahim. Malik, Sarteel Hamid AL-Shammary, Sajad Abudlkadhem AL-yasry Waist University, College of Science,
Assessment of Lake Forest Lake Sediment Trapping Efficiency and Capacity. Marlon R. Cook Groundwater Assessment Program Geological Survey of Alabama
 Assessment of Lake Forest Lake Sediment Trapping Efficiency and Capacity Marlon R. Cook Groundwater Assessment Program Geological Survey of Alabama Impacts of the Lake at Lake Forest on the connectivity
Structural Analysis and Tectonic Investigation of Chamshir Dam Site, South West Zagros
 Open Journal of Geology, 2015, 5, 136-143 Published Online March 2015 in SciRes. http://www.scirp.org/journal/ojg http://dx.doi.org/10.4236/ojg.2015.53013 Structural Analysis and Tectonic Investigation
Sub-watershed prioritization based on potential zones of Kuttiadi river basin, A Geo-Morphometric approach using GIS
 INTERNATIONAL JOURNAL OF GEOMATICS AND GEOSCIENCES Volume 8, No 1, 2018 Copyright by the authors - Licensee IPA- Under Creative Commons license 3.0 Research article ISSN 0976 4380 Sub-watershed prioritization
Surface Water and Stream Development
 Surface Water and Stream Development Surface Water The moment a raindrop falls to earth it begins its return to the sea. Once water reaches Earth s surface it may evaporate back into the atmosphere, soak
PROANA A USEFUL SOFTWARE FOR TERRAIN ANALYSIS AND GEOENVIRONMENTAL APPLICATIONS STUDY CASE ON THE GEODYNAMIC EVOLUTION OF ARGOLIS PENINSULA, GREECE.
 PROANA A USEFUL SOFTWARE FOR TERRAIN ANALYSIS AND GEOENVIRONMENTAL APPLICATIONS STUDY CASE ON THE GEODYNAMIC EVOLUTION OF ARGOLIS PENINSULA, GREECE. Spyridoula Vassilopoulou * Institute of Cartography
Module/Unit: Landforms Grade Level: Fifth
 Module/Unit: Landforms Grade Level: Fifth PA Academic Standards for Science and Technology and Environment and Ecology: 3.1.7.B Describe the use of models as an application or scientific or technological
Sediment yield estimation from a hydrographic survey: A case study for the Kremasta reservoir, Western Greece
 Sediment yield estimation from a hydrographic survey: A case study for the Kremasta reservoir, Western Greece 5 th International Conference Water Resources Management in the Era of Transition,, Athens,
Application of SWAT Model to Estimate the Runoff and Sediment Load from the Right Bank Valleys of Mosul Dam Reservoir
 Application of SWAT Model to Estimate the Runoff and Sediment Load from the Right Bank Valleys of Mosul Dam Reservoir Dr Mohammad Ezeel Deen Prof. Nadhir Al-Ansari Prof Sven Knutsson Figure 1.Map of Iraq
STUDY GUIDE FOR CONTENT MASTERY. Surface Water Movement
 Surface Water SECTION 9.1 Surface Water Movement In your textbook, read about surface water and the way in which it moves sediment. Complete each statement. 1. An excessive amount of water flowing downslope
Morphometric Analysis of Jiya Dhol River Basin
 Morphometric Analysis of Jiya Dhol River Basin Luna Moin Das North-Eastern Hill University, Shillong Abstract: Basin morphometry is an important means of understanding a drainage basin using mathematically
GEOMORPHOLOGY APPROACH IN LANDSLIDE VULNERABILITY, TANJUNG PALAS TENGAH, EAST KALIMANTAN, INDONESIA
 GEOMORPHOLOGY APPROACH IN LANDSLIDE VULNERABILITY, TANJUNG PALAS TENGAH, EAST KALIMANTAN, INDONESIA *Twin H. W. Kristyanto Geology Study Program, FMIPA UI, Universitas Indonesia *Author for Correspondence:
Prioritization of sub-watersheds in semi arid region, Western Maharashtra, India using Geographical Information System
 American Journal of Engineering Research (AJER) e-issn : 2320-0847 p-issn : 2320-0936 Volume-02, Issue-10, pp-128-135 www.ajer.org Research Paper Open Access Prioritization of sub-watersheds in semi arid
INTERNATIONAL JOURNAL OF GEOMATICS AND GEOSCIENCES Volume 2, No 2, 2011
 INTERNATIONAL JOURNAL OF GEOMATICS AND GEOSCIENCES Volume 2, No 2, 2011 Copyright 2010 All rights reserved Integrated Publishing services Research article ISSN 0976 4380 A GIS morphometric analysis of
A STUDY ON MORPHOMETRIC PARAMETER OF A WATERSHED FOR SUSTAINABLE WATER CONSERVATION
 International Journal of Civil Engineering and Technology (IJCIET) Volume 8, Issue 9, September 2017, pp. 271 278, Article ID: IJCIET_08_09_031 Available online at http://http://www.iaeme.com/ijciet/issues.asp?jtype=ijciet&vtype=8&itype=9
Assessment of solid load and siltation potential of dams reservoirs in the High Atlas of Marrakech (Moorcco) using SWAT Model
 using SWAT Model") Assessment of solid load and siltation potential of dams reservoirs in the High Atlas of Marrakech (Moorcco) using SWAT Model Amal Markhi: Phd Student Supervisor: Pr :N.Laftrouhi Contextualization Facing
Assessment of solid load and siltation potential of dams reservoirs in the High Atlas of Marrakech (Moorcco) using SWAT Model Amal Markhi: Phd Student Supervisor: Pr :N.Laftrouhi Contextualization Facing
Watershed Delineation in GIS Environment Rasheed Saleem Abed Lecturer, Remote Sensing Centre, University of Mosul, Iraq
 Watershed Delineation in GIS Environment Rasheed Saleem Abed Lecturer, Remote Sensing Centre, University of Mosul, Iraq Abstract: The management and protection of watershed areas is a major issue for human
INTRODUCTION. Climate
 INTRODUCTION Climate Landslides are serious natural disasters in many parts of the world. Since the past 30 years, rainfall triggered landslides and debris flows had been one of the natural disasters of
Elevations are in meters above mean sea level. Scale 1:2000
 12.001 LAB 7: TOPOGRAPHIC MAPS Due: Monday, April 11 PART I: CONTOURING AND PROFILES (20 PTS) 1. Contour this area map using a 5 meter contour interval. Remember some fundamental rules of contour lines,
Stream Geomorphology. Leslie A. Morrissey UVM July 25, 2012
 Stream Geomorphology Leslie A. Morrissey UVM July 25, 2012 What Functions do Healthy Streams Provide? Flood mitigation Water supply Water quality Sediment storage and transport Habitat Recreation Transportation
Geog Lecture 19
 Geog 1000 - Lecture 19 Fluvial Geomorphology and River Systems http://scholar.ulethbridge.ca/chasmer/classes/ Today s Lecture (Pgs 346 355) 1. What is Fluvial Geomorphology? 2. Hydrology and the Water
Morphometric analysis of Kharlikani watershed in Odisha, India using spatial information technology Kishor Choudhari 1, Panigrahi B 2, Paul J.
 INTERNATIONAL JOURNAL OF GEOMATICS AND GEOSCIENCES Volume 4, No 4, 2014 Copyright 2010 All rights reserved Integrated Publishing services Research article ISSN 0976 4380 Morphometric analysis of Kharlikani
ASTER DEM Based Studies for Geological and Geomorphological Investigation in and around Gola block, Ramgarh District, Jharkhand, India
 International Journal of Scientific & Engineering Research, Volume 3, Issue 2, February-2012 1 ASTER DEM Based Studies for Geological and Geomorphological Investigation in and around Gola block, Ramgarh
Chapter 5. Morphometric Control on Food
 Chapter 5 Morphometric Control on Food Key Words: Morphometry, Linear Morphometry, Areal Morphometry, Relief Morphometry, Morphometric Control and Flood 5.1 Morphometric Aspects Drainage basin or basins
Streams. Stream Water Flow
 CHAPTER 14 OUTLINE Streams: Transport to the Oceans Does not contain complete lecture notes. To be used to help organize lecture notes and home/test studies. Streams Streams are the major geological agents
NIDIS Intermountain West Drought Early Warning System October 30, 2018
 10/30/2018 NIDIS Drought and Water Assessment NIDIS Intermountain West Drought Early Warning System October 30, 2018 Precipitation The images above use daily precipitation statistics from NWS COOP, CoCoRaHS,
Study of Hydrometeorology in a Hard Rock Terrain, Kadirischist Belt Area, Anantapur District, Andhra Pradesh
 Open Journal of Geology, 2012, 2, 294-300 http://dx.doi.org/10.4236/ojg.2012.24028 Published Online October 2012 (http://www.scirp.org/journal/ojg) Study of Hydrometeorology in a Hard Rock Terrain, Kadirischist
GIS Based Delineation of Micro-watershed and its Applications: Mahendergarh District, Haryana
 Kamla-Raj 2012 J Hum Ecol, 38(2): 155-164 (2012) GIS Based Delineation of Micro-watershed and its Applications: Mahendergarh District, Haryana Gulshan Mehra and Rajeshwari * Department of Geography, Kurukshetra
FLOOD RISK MAPPING AND ANALYSIS OF THE M ZAB VALLEY, ALGERIA
 River Basin Management IX 69 FLOOD RISK MAPPING AND ANALYSIS OF THE M ZAB VALLEY, ALGERIA AMEL OUCHERIF & SAADIA BENMAMAR National Polytechnic School of Algiers, Algeria ABSTRACT To contribute to flood
Laboratory Exercise #4 Geologic Surface Processes in Dry Lands
 Page - 1 Laboratory Exercise #4 Geologic Surface Processes in Dry Lands Section A Overview of Lands with Dry Climates The definition of a dry climate is tied to an understanding of the hydrologic cycle
Sediment- yield estimation, by M-PSIAC method in a GIS environment, case study:jonaghn river sub basin(karun basin)
") Sediment- yield estimation, by M-PSIAC method in a GIS environment, case study:jonaghn river sub basin(karun basin) Yavari-shahla *,Khdabakhsh-Saeed,Mohseni-Hasan, Rezai- Khalil Corresponding author: a
Sediment- yield estimation, by M-PSIAC method in a GIS environment, case study:jonaghn river sub basin(karun basin) Yavari-shahla *,Khdabakhsh-Saeed,Mohseni-Hasan, Rezai- Khalil Corresponding author: a
The relationship between drainage density and soil erosion rate: a study of five watersheds in Ardebil Province, Iran
 River Basin Management VIII 129 The relationship between drainage density and soil erosion rate: a study of five watersheds in Ardebil Province, Iran A. Moeini 1, N. K. Zarandi 1, E. Pazira 1 & Y. Badiollahi
Evaluation of Morphometric parameters of drainage networks derived from Topographic Map and Digital Elevation Model using Remote Sensing and GIS
 INTERNATIONAL JOURNAL OF GEOMATICS AND GEOSCIENCES Volume 5, No 4, 2015 Copyright by the authors - Licensee IPA- Under Creative Commons license 3.0 Research article ISSN 0976 4380 Evaluation of Morphometric
Missouri Educator Gateway Assessments
 Missouri Educator Gateway Assessments FIELD 019: EARTH SCIENCE June 2014 Content Domain Range of Competencies Approximate Percentage of Test Score I. Science and Engineering Practices 0001 0003 18% II.
GROUNDWATER CONFIGURATION IN THE UPPER CATCHMENT OF MEGHADRIGEDDA RESERVOIR, VISAKHAPATNAM DISTRICT, ANDHRA PRADESH
 GROUNDWATER CONFIGURATION IN THE UPPER CATCHMENT OF MEGHADRIGEDDA RESERVOIR, VISAKHAPATNAM DISTRICT, ANDHRA PRADESH Prof.P.Jagadeesara Rao Department of Geo-Engineering and Centre for Remote Sensing, College
EARTH AND SPACE SCIENCE
 EARTH AND SPACE SCIENCE Content Domain Range of Competencies l. Nature of Science 0001 0003 18% ll. Geology 0004 0007 25% lll. IV. Oceanography and Freshwater Systems 0008 0010 19% The Atmosphere, Weather,
Lecture Outlines PowerPoint. Chapter 5 Earth Science 11e Tarbuck/Lutgens
 Lecture Outlines PowerPoint Chapter 5 Earth Science 11e Tarbuck/Lutgens 2006 Pearson Prentice Hall This work is protected by United States copyright laws and is provided solely for the use of instructors
THE FLUVIAL ACTION OF THE KARLA BASIN STREAMS IN A NATURAL AND MAN MADE ENVIRONMENT
 Δελτίο της Ελληνικής Γεωλογικής Εταιρίας, 2010 Bulletin of the Geological Society of Greece, 2010 Πρακτικά 12ου Διεθνούς Συνεδρίου Proceedings of the 12th International Congress Πάτρα, Μάιος 2010 Patras,
Impact of the Danube River on the groundwater dynamics in the Kozloduy Lowland
 GEOLOGICA BALCANICA, 46 (2), Sofia, Nov. 2017, pp. 33 39. Impact of the Danube River on the groundwater dynamics in the Kozloduy Lowland Peter Gerginov Geological Institute, Bulgarian Academy of Sciences,
Morphometric Analysis of Didessa River Catchment in Blue Nile Basin, Western Ethiopia
 DOI: http://dx.doi.org/10.4314/star.v3i3.31 ISSN: 2226-7522(Print) and 2305-3372 (Online) Science, Technology and Arts Research Journal Sci. Technol. Arts Res. J., July-Sep 2014, 3(3): 191-197 Journal
Utilization of Global Map for Societal Benefit Areas
 Utilization of Global Map for Societal Benefit Areas The Fourth GEOSS AP Symposium Bali Indonesia, 11th March 2010 Shuhei Kojima Geographical Survey Institute Ministry of Land, Infrastructure, Transport
OBJECTIVES. Fluvial Geomorphology? STREAM CLASSIFICATION & RIVER ASSESSMENT
 STREAM CLASSIFICATION & RIVER ASSESSMENT Greg Babbit Graduate Research Assistant Dept. Forestry, Wildlife & Fisheries Seneca Creek, Monongahela National Forest, West Virginia OBJECTIVES Introduce basic
3/3/2013. The hydro cycle water returns from the sea. All "toilet to tap." Introduction to Environmental Geology, 5e
 Introduction to Environmental Geology, 5e Running Water: summary in haiku form Edward A. Keller Chapter 9 Rivers and Flooding Lecture Presentation prepared by X. Mara Chen, Salisbury University The hydro
ES 105 Surface Processes I. Hydrologic cycle A. Distribution % in oceans 2. >3% surface water a. +99% surface water in glaciers b.
 ES 105 Surface Processes I. Hydrologic cycle A. Distribution 1. +97% in oceans 2. >3% surface water a. +99% surface water in glaciers b. >1/3% liquid, fresh water in streams and lakes~1/10,000 of water
Name: Mid-Year Review #2 SAR
 Name: Mid-Year Review #2 SAR Base your answers to questions 1 through 3 on on the diagram below, which shows laboratory materials used for an investigation of the effects of sediment size on permeability,
MORPHOMETRIC ANALYSIS OF RAJGARDH WATERSHED OF MADHYA PRADESH
 International Journal of Civil Engineering and Technology (IJCIET) Volume 8, Issue 4, April 2017, pp. 1319 1328 Article ID: IJCIET_08_04_149 Available online at http://www.iaeme.com/ijciet/issues.asp?jtypeijciet&vtype8&itype4
Determination of flood risks in the yeniçiftlik stream basin by using remote sensing and GIS techniques
 Determination of flood risks in the yeniçiftlik stream basin by using remote sensing and GIS techniques İrfan Akar University of Atatürk, Institute of Social Sciences, Erzurum, Turkey D. Maktav & C. Uysal
Scientific registration n : 2180 Symposium n : 35 Presentation : poster MULDERS M.A.
 Scientific registration n : 2180 Symposium n : 35 Presentation : poster GIS and Remote sensing as tools to map soils in Zoundwéogo (Burkina Faso) SIG et télédétection, aides à la cartographie des sols
Landslide analysis to estimate probability occurrence of earthquakes by software ArcGIS in central of Iran
 Research Journal of Recent Sciences ISSN 2277-2502 Res.J.Recent Sci. Landslide analysis to estimate probability occurrence of earthquakes by software ArcGIS in central of Iran Abstract Hamid Reza Samadi
Directed Reading. Section: Types of Maps
 Skills Worksheet Directed Reading Section: Types of Maps 1. What are some of the characteristics of an area shown on maps used by Earth scientists? a. types of animals, types of plants, types of minerals
Keywords: Morphometry, Upper river basin, Remote sensing GIS, spatial information technology
 A STUDY OF MORPHOMETRIC ANALYSIS USING REMOTE SENSING TECHNIQUES OF UPPER NIRA DRAINAGE BASIN, MAHARASHTRA Anuradha Ohal Dept. of Geography Tilak Maharashtra Vidyapeeth, Pune ABSTRACT Nira is tributary
Influence of Terrain on Scaling Laws for River Networks
 Utah State University DigitalCommons@USU All Physics Faculty Publications Physics 11-1-2002 Influence of Terrain on Scaling Laws for River Networks D. A. Vasquez D. H. Smith Boyd F. Edwards Utah State
11/12/2014. Running Water. Introduction. Water on Earth. The Hydrologic Cycle. Fluid Flow
 Introduction Mercury, Venus, Earth and Mars share a similar history, but Earth is the only terrestrial planet with abundant water! Mercury is too small and hot Venus has a runaway green house effect so
Morphometric Properties of Bulkana (NaftKhanah) North-East Iraq from Topographic Maps
 North-East Iraq from Topographic Maps") Research Article International Journal of Current Engineering and Technology E-ISSN 2277 4106, P-ISSN 2347-5161 2014 INPRESSCO, All Rights Reserved Available at http://inpressco.com/category/ijcet Morphometric
Research Article International Journal of Current Engineering and Technology E-ISSN 2277 4106, P-ISSN 2347-5161 2014 INPRESSCO, All Rights Reserved Available at http://inpressco.com/category/ijcet Morphometric
WATER ON AND UNDER GROUND. Objectives. The Hydrologic Cycle
 WATER ON AND UNDER GROUND Objectives Define and describe the hydrologic cycle. Identify the basic characteristics of streams. Define drainage basin. Describe how floods occur and what factors may make
MODULE 7 LECTURE NOTES 5 DRAINAGE PATTERN AND CATCHMENT AREA DELINEATION
 MODULE 7 LECTURE NOTES 5 DRAINAGE PATTERN AND CATCHMENT AREA DELINEATION 1. Introduction Topography of the river basin plays an important role in hydrologic modelling, by providing information on different
International Journal of Modern Trends in Engineering and Research e-issn No.: , Date: April, 2016
 International Journal of Modern Trends in Engineering and Research www.ijmter.com e-issn No.:2349-9745, Date: 28-30 April, 2016 Landslide Hazard Management Maps for Settlements in Yelwandi River Basin,
Chapter 1 Quantitative Analysis of Geomorphometric Parameters of Wadi Kerak, Jordan, Using Remote Sensing and GIS
 Chapter 1 Quantitative Analysis of Geomorphometric Parameters of Wadi Kerak, Jordan, Using Remote Sensing and GIS Yahya Farhan, Ali Anbar, Omar Enaba, Nisrin Al-Shaikh Geomorphometric analysis was carried
Need of Proper Development in Hilly Urban Areas to Avoid
 Need of Proper Development in Hilly Urban Areas to Avoid Landslide Hazard Dr. Arvind Phukan, P.E. Cosultant/Former Professor of Civil Engineering University of Alaska, Anchorage, USA RI District Governor
4 th Joint Project Team Meeting for Sentinel Asia 2011
 A Revisit on the Structural Flood Mitigation Measure with the Application of Remote Sensing and GIS in Gin River Basin, Sri Lanka 4 th Joint Project Team Meeting for Sentinel Asia 2011 Geoinformatics Center