OPPORTUNITY YOUTH IN THE ROAD MAP PROJECT REGION
|
|
|
- Shonda Murphy
- 6 years ago
- Views:
Transcription

1 OPPORTUNITY YOUTH IN THE ROAD MAP PROJECT REGION DATA BRIEF Released: July 19, 2016 v2
2 DATA BRIEF OPPORTUNITY YOUTH IN THE ROAD MAP PROJECT REGION II ABOUT THE ROAD MAP PROJECT The Road Map Project is a collective impact initiative that began in 2010 to improve student achievement from cradle through college and career in seven King County, Washington school districts: Auburn, Federal Way, Highline, Kent, Renton, (South) Seattle, and Tukwila. Together, this region serves 92 percent of the county s high-poverty schools and has 125,000 students, of whom 70 percent are of color, 56 percent are low-income and 20 percent are English-language learners. Through multisector collaboration with more than 200 partners and individuals, the Road Map Project aims to increase equitable policies and practices in education systems by 2020 and for 70 percent of its region s youth to earn a college degree credential by About CCER and its Data Team The Community Center for Education Results (CCER) is a nonprofit created to staff and support the Road Map Project. CCER works alongside partner organizations and individuals to provide research, communications, strategy and operations support. The CCER Data Team manages the Education Data Warehouse and conducts analysis and research on behalf of community partners working for student success. The Data Team centralizes the wealth of information made available by educational institutions and governments to illuminate inequity, build systems and understand barriers to access across the seven Road Map Project region districts. COMMUNITY CENTER FOR EDUCATION RESULTS TH AVE S. SUITE 701 SEATTLE, WA info@ccedresults.org twitter.com/roadmapproject facebook.com/roadmapproject Suggested Citation Yohalem, N., Cooley, S. (2016) Opportunity Youth in the Road Map Project Region, Community Center for Education Results Data Brief
3 DATA BRIEF OPPORTUNITY YOUTH IN THE ROAD MAP PROJECT REGION III TABLE OF CONTENTS Page What is the local current opportunity youth data landscape? 1 Background 2 How many youth are out of school and work? 3 Who are our Opportunity Youth? 4 Where are out of school youth coming from? 5 What else do we know about out-of-school youth? 6 What when young people disengage? 11 What do we know about reengagement programs? 14 What do young people tell us? 16 Next Steps 17 End Notes

4 DATA BRIEF OPPORTUNITY YOUTH IN THE ROAD MAP PROJECT REGION 1 BACKGROUND Measuring the successes and barriers faced by our most vulnerable youth is a challenge in our region. While there is a lot of information gathered from K12 districts and colleges about student outcomes, few data exists among youth disengaged from work and school. The Community Center for Education results and King County staff the King County Opportunity Youth Reengagement Network and Opportunity Youth Advisor Group, workgroups under the Road Map Project initiative. These groups focus on alignment, capacity, data and quality instruction for the region s 18,000+ youth who are out of school. The following brief was created for both workgroups. This data brief details findings from research, descriptive data and youth themselves and is intended to capture outcomes and contexts unique to opportunity youth in the Road Map Project Region. Goal The CCER Data Team fulfilled community and direct service provider requests from the King County Reengagement Network and Advisory Groups of the Road Map Project. The goal of this document is to provide a foundation of information from which indicators of system and youth success can be created and tracked over time. The Data Team used the CCER Education Data Warehouse, student enrollment records and postsecondary data to determine the prevalence of youth leaving school and education outcomes among opportunity youth in the Road Map Project region. The following questions in the table of contexts, guided the analyses presented in this brief. Note. This brief provides information using the nationally known definition of opportunity youth (16- to 24-year-olds not in school and not working), as well as information on youth who are just disconnected from school and youth currently in reengagement programs. The definition of Opportunity Youth varies in these ways based on the data source. MORE THAN 18,000 OPPORTUNITY YOUTH IN THE ROAD MAP PROJECT REGION Photo courtesy Highline Public Schools
5 OPPORTUNITY YOUTH DATA LANDSCAPE Demographics DSHS Services K12 Enrollment Grade history Postsecondary Demographics DSHS Services K12 Enrollment Grade history Postsecondary Demographics K12 Enrollment Postsecondary Employment status Demographics K12 Enrollment Grade history Discipline Attendance Postsecondary Headcount & AAFTE Measures of Academic Progress Credentials Earned Demographics Exit status Measures of Academic Progress Credentials Earned Demographics Credentials Exit Status Measures of Academic Progress RMP State County & RMP RMP K12 CEDARS P210 SBCTC PCHEES DSHS Integrated Databases K12 CEDARS P210 SBCTC PCHEES DSHS Integrated Databases U.S. Census Bureau, American Community Survey K12 CEDARS SBCTC NSC State No database State 2016 County Winter 2016 No database No database 7 programs participating Deleena Patton (DSHS) Deleena Patton (DSHS) Vivien Savath (BERK) CCER Data Team Laurie Shannon (OSPI) Laurie Shannon (OSPI) CCER & Hanne Makhani (KC) Prevalence of barriers among DSHS and HCA-served OY Predictors of disengagement among DSHS and HCA-served OY OY prevalence OY prevalence and longitudinal education outcomes Annual program enrollment and aggregated performance Annual enrollment, demographics, performance Quarterly enrollment, demographics, performance and retention
6 NOTES ON ITEMS WITH MINIMAL INFORMATION These sources include student-level demographics on ELL services, FRPL, Homelessness (McKenny Vento status, not including housing instability). Barriers like adverse childhood experiences (ACES), parenting-status, health/well-being, TANIF, juvenile justice involvement are not included in CEDARS or requested by OSPI s student-level program data. Within the King County Quarterly Data some of these are requested but thus far have been reported with little fidelity. The United States Census American Community Survey includes enrollment status and educational attainment and little on behaviors within the school (e.g., no information regarding absences, discipline, grades etc.) CCER Education Data Warehouse includes student-level enrollment data on Road Map Project region students who have touched a reengagement program. This source can be helpful to track outcomes before and after enrollment in a program. Yet, only a few years of data on reengagement status exists and CEDARS does not include outcomes, supports or any information about students performance while enrolled in a program. Starting in 2016 CCER received the first year of student-level OSPI data, so this source is improving over time. OSPI s Student-level annual outcomes captures job-related measures of academic progress, allowing us to see how many students completed job training. Currently there is no region-wide data on dually employed and enrolled students in reengagement centers, or youth who obtained a job upon program completion.
7 11,152 Youth in the Road Map Region Can Benefit From the Dropout Re-engagement System Source: US Census American Community Survey Public Use Microdata Set; BERK, 2016 Target Population Characteristics Year Olds in Road Map Region 226, year olds in King County 139, year olds in the Road Map Region 18,816 Opportunity Youth not in school, not working 7,400 have diploma or GED 3,608 some college 2,169 AA degree or higher 11,152 no diploma and out of school + 5,639 5,513 no diploma working, out of school, no diploma
8 High School 21+ eligible Hispanic 1,436 1,030 2,466 24% 20% 22% Black or African American ,205 7% 15% 11% Some Other Race ,810 16% 16% 16% Two or More Races % 11% 9% Asian % 7% 6% Native Hawaiian and Other Pacific Island % 4% 3% American Indian and Alaska Native tribe % 2% 3% Total 6,043 5,109 11,152 Source: US Census American Community Survey Public Use Microdata Set; BERK, 2016 Target Population Characteristics Year Olds in Road Map Region, Out of School with No Diploma year olds in King County year olds in the Road Map Region Open Doors eligible By Age Age Total Working 587 1, ,877 5,513 Not Working 1,610 1, ,981 5,639 Total 2,197 2,472 1,625 4,858 11,152 Opportunity Youth 11,152 no diploma and out of school 35% 25% 30% By Race and Sex Race Male Female Total Non-Hispanic White 2,117 1,284 3,401
9 DATA BRIEF OPPORTUNITY YOUTH IN THE ROAD MAP PROJECT REGION 2 HOW MANY YOUTH ARE OUT OF SCHOOL AND WORK? youth aged in the Road Map Project region are out of school and out of work. Opportunity Youth are disproportionately students of color. Opportunity Youth Status by Race 3,552 2,747 3,971 8,547 18,817 2, ,508 5,513 14,471 10,895 31,044 58, ,405 Opportunity Youth Status by Age 2,805 7,284 8,728 18, ,049 2,877 5,513 46,661 32,318 36, ,405 1,610 2,048 1,981 5, ,349 3,067 7, ,666 1,763 3, ,917 2,169 Prevalence by Race 1, , ,339 2,791 11,490 2,008 6,473 1,112 12,368 1,534 69,050 8,547 22,889 1,999


 who leave")


10 DATA BRIEF OPPORTUNITY YOUTH IN THE ROAD MAP PROJECT REGION 3 WHO ARE THE REGION S OPPORUNITY YOUTH? Each year there are over 1,500 students (aged 14 years and up) who leave school in the Road Map Project Region. These are youth who have an enrollment code as Dropout (D or U code). While this is a large group, these rates may be an underestimate, as youth can disengage without having been formally unenrolled from school. Students-of-color are overrepresented in this group. High School Dropout Rates ,960 1,605 1,401 1,374 1, ,182 1,766 1,587 1,535 1, ,538 1,260 1,157 1,023 1, ,927 1,638 1,502 1,364 1,250 Racial Disproportionality in Youth Who Leave School


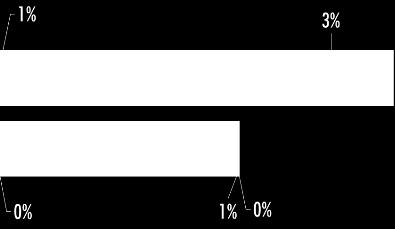
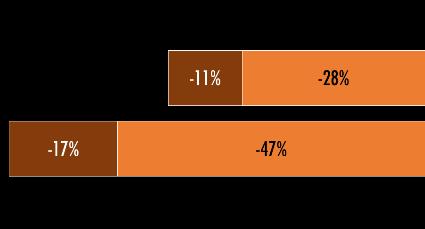
11 DATA BRIEF OPPORTUNITY YOUTH IN THE ROAD MAP PROJECT REGION 4 WHERE ARE OUT OF SCHOOL YOUTH COMING FROM? Regional and district rates of students leaving school are relatively low (between 3%-5%) and decreasing over time. However, when disaggregating by school type we see that students leave alternative schools at much higher rates than traditional high schools. These are small, often neighboring schools. Continued work will explore high school feeder patterns to examine enrollment trajectories prior to leaving school. \ 2015 School-level Dropout Rates


12 DATA BRIEF OPPORTUNITY YOUTH IN THE ROAD MAP PROJECT REGION 5 WHAT ELSE DO WE KNOW ABOUT OPPORUNITY YOUTH? Most youth who leave school have fewer credits compared to their same-aged peers who stayed enrolled. Yet, among youth who left school in the school year, met or passed the WA state 20-credit minimum required for graduation Total Credits Earned Road Map Region Students, aged 16 and up 2015 Proportion of Credits Earned among Youth who Left School by Age


13 DATA BRIEF OPPORTUNITY YOUTH IN THE ROAD MAP PROJECT REGION 6 Proportion of Opportunity Youth in each age-by-credit segment Most Road Map Project Region youth 16 years old and up who have left school are younger, 16- to 17- years-old. Examining student age by credit distance is another way to understand needs of youth who disengage. Using the credit and age groupings described above, here are the proportions of Opportunity Youth in each segment. Barriers Faced by Opportunity Youth Findings below are of DSHS-served youth in the Road Map Project region, aged 16 to 24, who were not engaged in school or work in Academic Year In that year, of the total population of 16- to 24-yearolds, 11% had no connection to school or work. Below are barriers and challenges faced by youth people prior to disengagement as well as positive factors and supports among our resilient youth.


 there were students who did not")


14 DATA BRIEF OPPORTUNITY YOUTH IN THE ROAD MAP PROJECT REGION 7 WHAT HAPPENS WHEN YOUNG PEOPLE DISENGAGE? Indicators can help us understand how well we re-engage students who have left traditional education within the first few years after they disengage. Additional measures examining groups of same-aged students over longer periods of time can tell us how the education system continues to serve (or limit) our youth. The following are outcomes for different measures examined over the last two years. a. Long-term postsecondary outcomes Of the entering 9 th graders in (Expected Graduating class of 2009) there were students who did not graduate high school within 5 years. Some of these students never graduated others took more than 6 years to do so. Postsecondary enrollments among our Opportunity Youth occurred 2-4 years after their expected graduation. Of this cohort, OY in Class of 2009 who enrolled in postsecondary within 4 years of expected HS graduation


15 DATA BRIEF OPPORTUNITY YOUTH IN THE ROAD MAP PROJECT REGION 8 OY in Class of 2009 who persisted in postsecondary at some point by 2015 (at age 24) OY in Class of 2009 who completed in postsecondary degree by 2015 (at age 24)
16 DATA BRIEF OPPORTUNITY YOUTH IN THE ROAD MAP PROJECT REGION 9 b. Short-term reengagement outcomes In , 1,905 youth ages 14 and up left school without graduating. Within two years of disengaging 44% (or 842) of the 1,905 youth had reengaged in the existing K12, reengagement system, or at a local Community and Technical Colleges (CTCs). Additionally, about 9% of the 1,905 students who left completed a high school credential (including GED) in the K12 or CTC system within 2 years of leaving. Note. CEDARs Data System does not include GEDs earned at stand-alone or private testing centers. Adding those GEDs could increase the proportion of students attaining a high school credential. Rates are similar among youth who left school in the school year. Reengaged youth who completed high school within 2 years 1,210 1, Rates of reengaging and completing a high school credential within 2 years of leaving school 2, , , , , ,


17 DATA BRIEF OPPORTUNITY YOUTH IN THE ROAD MAP PROJECT REGION 10 Racial disproportionality in student outcomes We see fewer White and Asian students leaving school, compared to proportions in the overall populations. Yet, White and Asian students who did leave school had higher rates of completion than their American Indian, Black, Hispanic, Pacific Islander and Multiracial peers Youth aged 14 and up who left school, Reengaged and Completed by Race


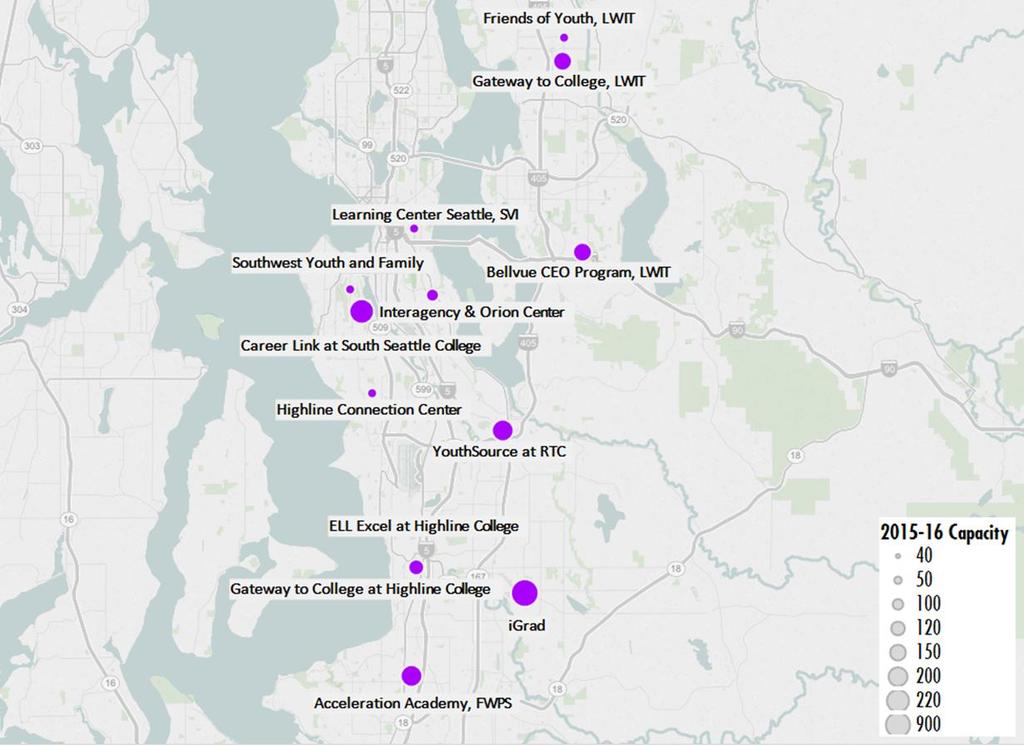


18 DATA BRIEF OPPORTUNITY YOUTH IN THE ROAD MAP PROJECT REGION 11 WHAT DO WE KNOW ABOUT REENGAGEMENT PROGRAMS? King County Open Doors Capacity King County Open Doors Programs and Estimated Program Capacity


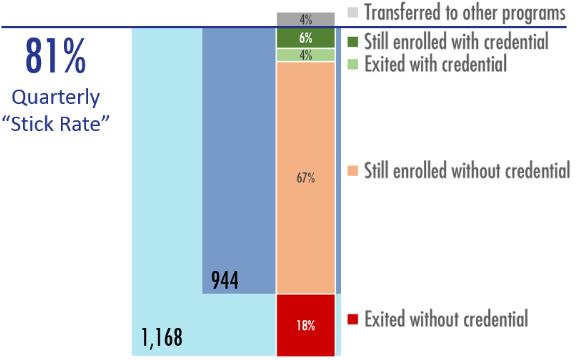
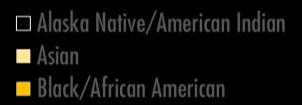
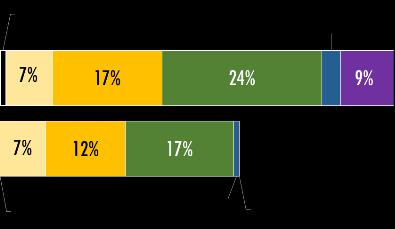

19 DATA BRIEF OPPORTUNITY YOUTH IN THE ROAD MAP PROJECT REGION Annual Open Doors Data NA , NA , NA NA ,125 2,745 1, NA ,089 2, NA NA NA NA NA 0 0 King County Quarterly Reengagement Program Data Aggregated data from 7 Open Doors programs in King County (1,337 students) was collected beginning in March, Information is being used for collaborative learning and informing system-wide progress. While quarterly retention rates are high, we see racial disproportionality in credential earning Racial Disproportionality in Quarterly Credential Earning of students completed a credential in Quarter 1. Yet, when examining a subset of 5 programs who entered data by race, we see that the group of credential earners were more likely to be White or Multiracial than any other race.


20 DATA BRIEF OPPORTUNITY YOUTH IN THE ROAD MAP PROJECT REGION 13 HIGH SCHOOL 21+ All King County High School 21+ Enrollments and Diplomas by Program Ages 21- to 24-years Enrollments Over Time Lake Washington IT 18 Lake Washington IT 8 Lake Washington IT 16 Renton Tech 1 Renton Tech 58 Renton Tech 108 Seattle Central 1 Seattle Central 1 Seattle Central 12 Shoreline 5 Shoreline 7 South Seattle 4 South Seattle 21 Green River 2 North Seattle 12 Highline 2 Diplomas Awarded Over Time Seattle Central 6 Seattle Central 3 Seattle Central 2 Renton Tech 3 Renton Tech 96 Renton Tech 122 Shoreline 2 Lake Washington IT 7 All King County High School 21+ Enrollments by Race and Ethnicity Ages 21- to 24-years


21 DATA BRIEF OPPORTUNITY YOUTH IN THE ROAD MAP PROJECT REGION 14 WHAT DO YOUNG PEOPLE TELL US? The Road Map Project has partnered with SOAR s King County Youth Advisory Council since late 2013 to ensure youth input informs and influences opportunity youth system-building efforts and to elevate the voices of young people from the region. i Through a range of focus groups over the course of the last 3 years, we have learned a lot from young people. This is a summary of key findings that has and should continue to inform our work: On Barriers: 1. Lack of trust and support at school 2. Some students feel tracked; some groups of youth seem to get more resources even in the same school 3. When students don t feel they are valued or welcome, they drop out 4. Awareness of and access to alternative education pathways are limited; information is vague and out-of-date when it exists 5. Youth have competing priorities and need individualized pathways 6. Money is needed to survive; sometimes youth have to decide between school and work 7. Undocumented youth face more barriers, even if they follow all the rules On Solutions: 1. Improve student-teacher relationships and teacher cultural competence 2. Provide youth more support academic and emotional to keep them in school 3. Connect youth with existing opportunities 4. Create pathways that are individualized 5. Create pathways that are connected to careers 6. Offer more community supports & mentors 7. Address transportation and other barriers to participation On Outreach to Opportunity Youth: 1. Messages should not imply you re already failing 2. Don t use the word dropout 3. Images should be colorful 4. Pictures should be groups, co-ed, racially diverse, smiling 5. Messages should be positive, empowering and future-oriented
22 DATA BRIEF OPPORTUNITY YOUTH IN THE ROAD MAP PROJECT REGION 15 On Effective Alternative Pathways 1. Warm, helpful teachers 2. A lot of one-on-one support; accessible counselors, case managers, social workers 3. Students treated with respect 4. Flexibility and freedom (e.g., students can attend class at night if that works better, students can work at home, students can work at their own pace) 5. Fewer distractions, easier to focus on school 6. Older students more comfortable than in a traditional high school

23 DATA BRIEF OPPORTUNITY YOUTH IN THE ROAD MAP PROJECT REGION 16 NEXT STEPS These data are just the start of understanding opportunity youth in the Road Map Project region. Already findings have been used to support the King County Opportunity Youth Reengagement Provider Network, United Way, King County s Reconnect to Opportunity and The Road Map Project Opportunity Youth Advisors. Additional analytic work will examine potential causal factors of student disengagement, impact of Open Doors on student outcomes and, the academic outcomes and with the help of partners we can begin to understand the compounding barriers faced by opportunity youth such as poverty, homelessness and early parenthood and how programs are reducing student barriers while promoting academic success. Opportunity Youth Data Requests As of the circulation of these findings in July 2016 and the February the following partners have requested CCER s opportunity youth data. Partner/Organization King County Opportunity Youth Reengagement Provider Network King County s Reconnect to Opportunity Road Map Project Opportunity Youth Advisors United Way Raikes Foundation RESOURCES Resource/Definition Source and URL Opportunity Youth Reengagement Provider Network Reconnect to Opportunity Opportunity Youth Advisors Road Map Project King County Road Map Project Was this helpful? Let us know how you ve used data in this brief! info@ccedresults.org
24 DATA BRIEF OPPORTUNITY YOUTH IN THE ROAD MAP PROJECT REGION 17 END NOTES i Partnership activities have included: Two Youth Council representatives participated in the opportunity youth work group during year one, as the plan was developed. The linkage between the Council and the work group was intentional, to ensure broader youth voice into the work and to provide youth with support outside of the work group. Road Map Project staff attend monthly Youth Advisory Council meetings in order to solicit broader youth input on specific issues that arise in the course of the work of the collaborative. The Road Map Project and SOAR work together to identify youth-led projects. For example, youth have conducted focus groups at re-engagement programs, presented at Road Map Project meetings, created videos featuring youth sharing their stories of re-engagement onto educational pathways, and are serving on the S. King County Discipline Coalition. The Youth Advisory Council held a Results Roundtable in March 2015 to share new Road Map Project data on school discipline, graduation rates, and college enrollment and persistence and to solicit youth input on data, root causes of youth outcomes, and other data-related questions. Youth have participated in advocacy activities focused on increasing funding for the state s College Bound Scholarship and State Need Grant and collaborated with SOAR staff to co-lead trainings on racial equity. ii Based on exit feedback from igrad graduates in particular
Cato Elementary School School Report Card Jacksonville Cato Road North Little Rock, AR
 Cato Elementary School School Report Card 2014 2015 9906 Jacksonville Cato Road North Little Rock, AR 72120 501 833 1160 SCHOOL CHARACTERISTICS Principal Superintendent STUDENT DEMOGRAPHICS Shyrel Lee
Landmark Elementary School School Report Card Arch Street Pike Little Rock, AR
 Landmark Elementary School School Report Card 2014 2015 16712 Arch Street Pike Little Rock, AR 72206 501 888 8790 SCHOOL CHARACTERISTICS Principal Superintendent STUDENT DEMOGRAPHICS Pam McCurry Jerry
College Station Elem. School School Report Card Frasier Pike, PO Bx 670 College Station, AR
 College Station Elem. School School Report Card 2014 2015 4710 Frasier Pike, PO Bx 670 College Station, AR 72053 501 490 5750 SCHOOL CHARACTERISTICS Principal Superintendent STUDENT DEMOGRAPHICS Emma Watson
PROGRAM EVALUATION PRELIMINARY REPORT. The following information is organized by program specialty areas for
 PROGRAM EVALUATION PRELIMINARY REPORT For the 2016-2017 academic year, DePaul Counseling Program faculty conducted a program evaluation by reviewing available data and surveying stakeholders. The following
PROGRAM EVALUATION REPORT The following information is organized by CACREP-Accredited Program Specialty Areas for
 PROGRAM EVALUATION REPORT 2016-2017 For the 2016-2017 academic year, DePaul Counseling Program faculty conducted a program evaluation by reviewing available data and surveying stakeholders. The following
ADDRESSING TITLE VI AND ENVIRONMENTAL JUSTICE IN LONG-RANGE TRANSPORTATION PLANS
 ADDRESSING TITLE VI AND ENVIRONMENTAL JUSTICE IN LONG-RANGE TRANSPORTATION PLANS Activities from the National Capital Region Transportation Planning Board Sergio Ritacco Transportation Planner 2017 Association
The Basics of Weighted Student (Need-Based) Education Funding:
 Education Funding:") The Basics of Weighted Student (Need-Based) Education Funding: An Overview Presenter: Mary Fertakis, M.Ed. LEV Advocates Training Sat., Feb. 11, 2017 The Current System is Not Closing Achievement Gaps
The Basics of Weighted Student (Need-Based) Education Funding: An Overview Presenter: Mary Fertakis, M.Ed. LEV Advocates Training Sat., Feb. 11, 2017 The Current System is Not Closing Achievement Gaps
Appendix B: Undergraduate Academic Interests Survey Spring 2009
 Appendix B: Undergraduate Academic Interests Survey Spring 2009 Thank you for participating in our survey. All questions are voluntary and the survey will be conducted anonymously; please do not put your
NSHE DIVERSITY REPORT
 University of Nevada, Las Vegas University of Nevada, Reno NSHE DIVERSITY REPORT 2006-07 Nevada State College at Henderson College of Southern Nevada December 2007 Prepared by the Office of Academic and
Click to edit Master title style
 Click to edit Master title style Click to edit Master subtitle style # L LCO N 2 0 1 8 # L i n ke d Le a r n i n g Click to edit Master title style PHOTO SLIDESHOW FROM PREVIOUS DAY Click to edit Master
Environmental Justice Analysis FOR THE MINNESOTA STATEWIDE FREIGHT SYSTEM PLAN
 Environmental Justice Analysis FOR THE MINNESOTA STATEWIDE FREIGHT SYSTEM PLAN Presentation Overview Minnesota Freight Plan Summary Environmental Justice (EJ) Background Freight Plan EJ Analysis Methodology
Pellissippi State Community College Spring Fact Book
 Pellissippi State Community College 2017 Spring Fact Book Table of Contents Spring Enrollment and Trend Data Spring Total Enrollment (Headcount)... 1 Spring Total Enrollment (FTE)... 1 Attendance (Full-time)...
NEW YORK AND CONNECTICUT SUSTAINABLE COMMUNITIES. Fair Housing & Equity Assessment & Regional Planning Enhancement
 NEW YORK AND CONNECTICUT SUSTAINABLE COMMUNITIES Fair Housing & Equity Assessment & Regional Planning Enhancement November 19, 2013 White Plains Public Library Federal grant to improve regional planning
Completions Institution: CUNY Borough of Manhattan Community College User ID: 36C0029
 Completions 207-8 Institution: CUNY Borough of Manhattan Community College User ID: 36C0029 (9052) Completions Overview Welcome to the IPEDS Completions survey component. The Completions component is one
PROGRAM EVALUATION: COMPUTER AND ELECTRONICS TECHNOLOGY. OIR Report No
 PROGRAM EVALUATION: COMPUTER AND ELECTRONICS TECHNOLOGY OIR Report No. 07-06 COMPUTER AND ELECTRONICS TECHNOLOGY, A.A.S., ELECTRONICS TECHNICIAN, CERTIFICATE FALL 2001 TO FALL 2005 Office of Institutional
B R I D G I N G T H E D I V E R S I T Y G A P
 H E A L T H W E A L T H C A R E E R B R I D G I N G T H E D I V E R S I T Y G A P B U I L D I N G A F R I C A N - A M E R I C A N A N D L A T I N O T A L E N T P I P E L I N E S F O R T H E F I N A N C
Completions Overview. Completions Common Errors
 9//08 Print Forms (data) Completions 08-9 Institution: Hope College (7030) User ID: P7030 Completions Overview Welcome to the IPEDS Completions survey component. The Completions component is one of several
Urban Climate Resilience
 Urban Climate Resilience in Southeast Asia Partnership Project Introduction Planning for climate change is a daunting challenge for governments in the Mekong Region. Limited capacity at the municipal level,
emerge Network: CERC Survey Survey Sampling Data Preparation
 emerge Network: CERC Survey Survey Sampling Data Preparation Overview The entire patient population does not use inpatient and outpatient clinic services at the same rate, nor are racial and ethnic subpopulations
Oregon Population Forecast Program
 Oregon Population Forecast Program Regional Forecast Meeting October 2, 2015 Presentation by Population Forecast Program Team Hood River County Oregon Population Forecast Program Project Team Xiaomin Ruan,
emerge Network: CERC Survey Survey Sampling Data Preparation
 emerge Network: CERC Survey Survey Sampling Data Preparation Overview The entire patient population does not use inpatient and outpatient clinic services at the same rate, nor are racial and ethnic subpopulations
Applying Health Outcome Data to Improve Health Equity
 Applying Health Outcome Data to Improve Health Equity Devon Williford, MPH, Health GIS Specialist Lorraine Dixon-Jones, Policy Analyst CDPHE Health Equity and Environmental Justice Collaborative Mile High
CRP 608 Winter 10 Class presentation February 04, Senior Research Associate Kirwan Institute for the Study of Race and Ethnicity
 CRP 608 Winter 10 Class presentation February 04, 2010 SAMIR GAMBHIR SAMIR GAMBHIR Senior Research Associate Kirwan Institute for the Study of Race and Ethnicity Background Kirwan Institute Our work Using
Institution: New Mexico Highlands University (187897) User ID: P Completions Overview distance education All Completers unduplicated count
 User ID: P Completions Overview distance education All Completers unduplicated count") Completions 207-8 Institution: New Mexico Highlands University (87897) User ID: P87897 Completions Overview Welcome to the IPEDS Completions survey component. The Completions component is one of several
Completions 207-8 Institution: New Mexico Highlands University (87897) User ID: P87897 Completions Overview Welcome to the IPEDS Completions survey component. The Completions component is one of several
Environmental Analysis, Chapter 4 Consequences, and Mitigation
 Environmental Analysis, Chapter 4 4.17 Environmental Justice This section summarizes the potential impacts described in Chapter 3, Transportation Impacts and Mitigation, and other sections of Chapter 4,
Institution: CUNY John Jay College of Criminal Justice (190600) User ID: 36C0029 Completions Overview distance education
 User ID: 36C0029 Completions Overview distance education") Completions 206-7 Institution: CUNY John Jay College of Criminal Justice (90600) User ID: 36C0029 Completions Overview Welcome to the IPEDS Completions survey component. The Completions component is one
Completions 206-7 Institution: CUNY John Jay College of Criminal Justice (90600) User ID: 36C0029 Completions Overview Welcome to the IPEDS Completions survey component. The Completions component is one
Discounts & Scholarships Tuition discount rate
 AFFORDABILITY best value for their tuition and fees and provide financial aid to support qualified students in meeting their education Tuition Revenue from tuition and fees (history) 5 0 0 0 0 5 Cost of
St. Luke s College Institutional Snapshot
 1. Student Headcount St. Luke s College Institutional Snapshot Enrollment # % # % # % Full Time 139 76% 165 65% 132 54% Part Time 45 24% 89 35% 112 46% Total 184 254 244 2. Average Age Average Age Average
Advising and Advice at Cal: What do Undergraduates Tell Us?
 Advising and Advice at Cal: What do Undergraduates Tell Us? G R E G G T H O M S O N, C Y N D Y S N Y D E R, & S E R E E TA A L E X A N D E R A S S I S T E D B Y A LY X F L O U R N O Y A N D P E D R O S
Section III: Poverty Mapping Results
 Section III: Poverty Mapping Results Figure 5: Gewog level rural poverty map 58. The most prominent result from the poverty mapping exercise of Bhutan is the production of a disaggregated poverty headcount
Enrollment at a Glance Fall 2015
 1. Number of Students Enrolled at Tenth Day of Fall Term 2011 2012 2013 2014 2015 3,705 ( 100.0% ) 3,626 ( 100.0% ) 3,706 ( 100.0% ) 3,746 ( 100.0% ) 3,891 ( 100.0% ) New 1 1,051 ( 28.4% ) 1,063 ( 29.3%
Tulare County Office of Education BTSA Induction Consortium
 Tulare County Office of Education BTSA Induction Consortium Biennial Report 5/17/10 Page 1 of 15 Local Educational Agency CD Code 54-10546 Section A, Part I: Contextual Information Biennial Report Contextual
Elem Reading I Methods. Elem Writing Methods. Elem SS Methods. Elem Reading II Methods
 Crosswalk: CO TQ + INTASC + CAEP Standards with TE Courses: July 2015 DRAFT 1 Learning & Dev Foundations 4322/ CO TQ 1a Teachers provide instruction that is aligned with the Colorado Academic Standards
Institution: CUNY Queensborough Community College (190673) User ID: 36C0029 Completions Overview distance education
 User ID: 36C0029 Completions Overview distance education") Completions 207-8 Institution: CUNY Queensborough Community College (90673) User ID: 36C0029 Completions Overview Welcome to the IPEDS Completions survey component. The Completions component is one of
Completions 207-8 Institution: CUNY Queensborough Community College (90673) User ID: 36C0029 Completions Overview Welcome to the IPEDS Completions survey component. The Completions component is one of
Completions Overview. Completions Common Errors
 Completions 207-8 Institution: Dakota State University (29082) User ID: P29082 Completions Overview Welcome to the IPEDS Completions survey component. The Completions component is one of several IPEDS
An Analysis of Field Test Results for Assessment Items Aligned to the Middle School Topic of Atoms, Molecules, and States of Matter
 An Analysis of Field Test Results for Assessment Items Aligned to the Middle School Topic of Atoms, Molecules, and States of Matter Cari F. Herrmann Abell and George E. DeBoer AAAS Project 2061 NARST Annual
COMMISSION ON ACCREDITATION 2011 ANNUAL REPORT ONLINE
 COMMISSION ON ACCREDITATION 2011 ANNUAL REPORT ONLINE SUMMARY DATA: POSTDOCTORAL PROGRAMS ^Clicking a table title will automatically direct you to that table in this document *Programs that combine two
About WE RE A PASSIONATE COMPANY FILLED WITH PASSIONATE INDIVIDUALS OUR MISSION OUR VISION OUR TAGLINE OUR NAME
 Media Kit About For more than 65 years, The Arc Northern Chesapeake Region (The Arc NCR) has helped people with intellectual and developmental disabilities to live, work and play in Harford and Cecil Counties.
Alternative Growth Goals for Students Attending Alternative Education Campuses
 Alternative Growth Goals for Students Attending Alternative Education Campuses AN ANALYSIS OF NWEA S MAP ASSESSMENT: TECHNICAL REPORT Jody L. Ernst, Ph.D. Director of Research & Evaluation Colorado League
NEW YORK DEPARTMENT OF SANITATION. Spatial Analysis of Complaints
 NEW YORK DEPARTMENT OF SANITATION Spatial Analysis of Complaints Spatial Information Design Lab Columbia University Graduate School of Architecture, Planning and Preservation November 2007 Title New York
This page is intentionally blank.
 SCHOOL PROGRAMS Contents School Programs Summary... 3 Regular Education... 4 Special Education... 9 School Counseling... 10 Elementary Art, Music and P.E.... 12 Vocational Education... 13 Library Media...
GEORGETOWN UNIVERSITY Standard 509 Information Report
 GEORGETOWN UNIVERSITY - 2018 Standard 509 Information Report 600 New Jersey Avenue, NW Washington, DC 20001 Phone: 202-662-9030 Website: https://www.law.georgetown.edu/ http://www.abarequireddisclosures.org
geographic patterns and processes are captured and represented using computer technologies
 Proposed Certificate in Geographic Information Science Department of Geographical and Sustainability Sciences Submitted: November 9, 2016 Geographic information systems (GIS) capture the complex spatial
PUBLIC HEALTH ASSOCIATION OF AUSTRALIA Strategic Plan
 PUBLIC HEALTH ASSOCIATION OF AUSTRALIA Strategic Plan March 2017 20 Napier Close Deakin ACT Australia 2600 PO Box 319 Curtin ACT Australia 2605 Table of Contents Introduction... 2 Vision for a healthy
CCSG Needs Assessment: Characterizing the cancer burden in our catchment area
 CCSG Needs Assessment: Characterizing the cancer burden in our catchment area Jason A. Mendoza, MD, MPH Associate Director of Minority Health and Health Disparities Pilot Grant on Catchment Area Health
The Church Demographic Specialists
 The Church Demographic Specialists Easy-to-Use Features Map-driven, Web-based Software An Integrated Suite of Information and Query Tools Providing An Insightful Window into the Communities You Serve Key
ARC Implementation in Residential Care
 ARC Implementation in The First Two Years: Refining the of Care & Building ARC Fidelity Emily Neal, LCSW, Clinical Director Jeremy Karpen, MA, LCPC, Director of Learning & Development 1 Session Objectives
ITEM 11 Information June 20, Visualize 2045: Update to the Equity Emphasis Areas. None
 ITEM 11 Information June 20, 2018 Visualize 2045: Update to the Equity Emphasis Areas Staff Recommendation: Issues: Background: Briefing on the TPB-approved methodology to update the Equity Emphasis Areas
Population Profiles
 U N D E R S T A N D I N G A N D E X P L O R I N G D E M O G R A P H I C C H A N G E MAPPING AMERICA S FUTURES, BRIEF 6 2000 2010 Population Profiles Atlanta, Las Vegas, Washington, DC, and Youngstown Allison
Developing the Next Generation Science Standards
 6/18/12 Developing the Next Generation Science Standards Chris Embry Mohr Olympia High School Stanford, Illinois Science and Agriculture Teacher, NGSS Writer chrisembry.mohr@olympia.org www.nextgenscience.org
COMMISSION ON ACCREDITATION 2017 ANNUAL REPORT ONLINE
 COMMISSION ON ACCREDITATION 2017 ANNUAL REPORT ONLINE SUMMARY DATA: DOCTORAL PROGRAMS ^Table titles are hyperlinks to the tables within this document INTRODUCTION The Annual Report was created in 1998
Report for the Masters of Counseling at Gordon-Conwell Theological Seminary Hamilton
 1 2016-2017 Report for the Masters of Counseling at Gordon-Conwell Theological Seminary Hamilton 1. Annual reviews of current students MACO students are reviewed once annually, either for an Annual or
PRESENTATION TITLE. Undeclared Students Paths to Major Declaration: A Data Mining Study. Afshin Karimi Sunny Moon, PhD Joshua Loudon Brian Stern
 PRESENTATION TITLE Undeclared Students Paths to Major Declaration: A Data Mining Study Afshin Karimi Sunny Moon, PhD Joshua Loudon Brian Stern 2015 CAIR Conference San Francisco, CA 11/5/2015 Our University
Institution: Eastern Washington University (235097) User ID: P Completions Overview distance education All Completers unduplicated count
 User ID: P Completions Overview distance education All Completers unduplicated count") Completions 207-8 Institution: Eastern Washington University (235097) User ID: P235097 Completions Overview Welcome to the IPEDS Completions survey component. The Completions component is one of several
Completions 207-8 Institution: Eastern Washington University (235097) User ID: P235097 Completions Overview Welcome to the IPEDS Completions survey component. The Completions component is one of several
SELF-STUDY FOR THE BACHELOR OF ARTS DEGREE IN GEOLOGY AT THE UNIVERSITY OF HAWAI I AT HILO
 SELF-STUDY FOR THE BACHELOR OF ARTS DEGREE IN GEOLOGY AT THE UNIVERSITY OF HAWAI I AT HILO 1. Is the Geology B.A. degree program organized to meet its objectives? The Bachelor of Arts in Geology program
8. Who is the university administrator responsible for verifying data (and completing IPEDS reports) at your institution?
 at your institution?") NAAB Annual Report -- I Statistical Report SECTION A. INSTITUTIONAL CHARACTERISTICS 1. Program Contact Information: Name University of Louisiana - Lafayette Title School of Architecture and Design Office
NAAB Annual Report -- I Statistical Report SECTION A. INSTITUTIONAL CHARACTERISTICS 1. Program Contact Information: Name University of Louisiana - Lafayette Title School of Architecture and Design Office
Institution: CUNY Hostos Community College (190585) User ID: 36C0029 Completions Overview distance education All Completers unduplicated count
 User ID: 36C0029 Completions Overview distance education All Completers unduplicated count") Completions 204-5 Institution: CUNY Hostos Community College (90585) User ID: 36C0029 Completions Overview Welcome to the IPEDS Completions survey component. The Completions component is one of several
Completions 204-5 Institution: CUNY Hostos Community College (90585) User ID: 36C0029 Completions Overview Welcome to the IPEDS Completions survey component. The Completions component is one of several
Night Comes to the Cumberlands and It s Awesome: Promoting Night Sky Conservation and Development in the Upper Cumberland
 Night Comes to the Cumberlands and It s Awesome: Promoting Night Sky Conservation and Development in the Upper Cumberland Jean Mercer Assistant Vice Chancellor for Research Office of Sponsored Programs
NEW YORK AND CONNECTICUT SUSTAINABLE COMMUNITIES. Fair Housing & Equity Assessment & Regional Planning Enhancement
 NEW YORK AND CONNECTICUT SUSTAINABLE COMMUNITIES Fair Housing & Equity Assessment & Regional Planning Enhancement November 18, 2013 Fordham University Bronx, NY Federal grant to improve regional planning
NAAB Annual Report -- Part I Statistical Report SECTION A. INSTITUTIONAL CHARACTERISTICS
 NAAB Annual Report -- I Statistical Report SECTION A. INSTITUTIONAL CHARACTERISTICS 1. Program Contact Information: Name Pennsylvania State University Title Department of Architecture Office Phone Number
Agenda Item B /20 Strategic Budget Development Phase I Preliminary Recommendations
 Agenda Item B-24 2019/20 Strategic Budget Development Phase I Preliminary Recommendations Board of Education February 13, 2019 2 Outline Preliminary Recommendations and Discussions School Staffing School
11/3/17. PSYC 100 discussion sessions can help you explore some of these possibilities! What can I do with my degree? Non-Linear Career Path
 PSYC 100 discussion sessions can help you explore some of these possibilities! What can I do with my degree? Credit: Celeste Spier, former UNL psychology advisor } I won t get a job after I graduate. }
The CRP stresses a number of factors that point to both our changing demographics and our future opportunities with recommendations for:
 Plan Overview The CRP represents the first broad planning initiative covering Lake, Porter and LaPorte counties. Unlike previous plans released by NIRPC, which focused primarily on transportation, the
CHEMISTRY PROGRAM REVIEW
 CHEMISTRY PROGRAM REVIEW 2008-2009 CHEMISTRY DEPARTMENT MATH/SCIENCE DIVISION COMPTON EDUCATION CENTER EL CAMINO COLLEGE Program Review (2008-2009) TABLE OF CONTENTS 1. OVERVIEW 2. RETENTION AND SUCCESS
COMMUNITY SERVICE AREA
 INSTITUTE FOR TRIBAL ENVIRONMENTAL PROFESSIONALS Tribal Waste and Response Assistance Program (TWRAP) Developing and Implementing a Tribal Integrated Solid Waste Management Plan April 12-14, 2016 Palm
P E O P L E A N A LY T I C S 4. 0
 H E A L T H W E A L T H C A R E E R P E O P L E A N A LY T I C S 4. 0 B U S T I N G T R A D I T I O N A L B O U N D A R I E S Jenny Anderson Lang Ip Kashmira Daruwalla W H O A R E W E? JENNY ANDERSON LANG
SOUTH DAKOTA BOARD OF REGENTS. Academic and Student Affairs ******************************************************************************
 SOUTH DAKOTA BOARD OF REGENTS Academic and Student Affairs AGENDA ITEM: 7 C (4) DATE: June 28-30, 2016 ****************************************************************************** SUBJECT: New Minor:
RSC Analytical Division Strategy
 RSC Analytical Division Strategy 2013-2017 The Analytical Division aims to promote and support analytical chemistry at all levels from public outreach and school education to the most innovative and cutting
GOVERNMENT MAPPING WORKSHOP RECOVER Edmonton s Urban Wellness Plan Mapping Workshop December 4, 2017
 GOVERNMENT MAPPING WORKSHOP 12.4.17 RECOVER Edmonton s Urban Wellness Plan Mapping Workshop December 4, 2017 In July of 2017, City Council directed administration to develop RECOVER, Edmonton s Urban Wellness
Mansfield Independent School District. Welcome to High School
 1 Welcome to High School 2 Becoming a Freshman! W h a t y o u n e e d t o k n o w t o m a s t e r t h e a r t o f h i g h s c h o o l. 3 Laying the Foundation M I S D G u i d i n g S t a t e m e n t s
Council Workshop on Neighbourhoods Thursday, October 4 th, :00 to 4:00 p.m. Burlington Performing Arts Centre
 Council Workshop on Neighbourhoods Thursday, October 4 th, 2012 1:00 to 4:00 p.m. Burlington Performing Arts Centre Agenda Introductions Warm-Up Exercise Presentation Exercise Neighbourhood Planning Break
U.S. SOCCER FEDERATION 2014 D&I SCORECARD
 D&I SCORECARD D&I SCORECARD How the D&I Scorecard is collected and prepared How s in the USOC D&I Scorecard are derived In accordance with the Ted Stevens Act, the USOC s Diversity and Inclusion department
Low-Income African American Women's Perceptions of Primary Care Physician Weight Loss Counseling: A Positive Deviance Study
 Thomas Jefferson University Jefferson Digital Commons Master of Public Health Thesis and Capstone Presentations Jefferson College of Population Health 6-25-2015 Low-Income African American Women's Perceptions
State of Wisconsin Higher Educational Aids Board
 State of Wisconsin Higher Educational Aids Board Agency Budget Request 2019 2021 Biennium September 17, 2018 Wisconsin.gov Table of Contents Cover Letter...3 Description...4 PROGRAMS, GOALS, OBJECTIVES
INSIDE. Metric Descriptions by Topic Area. Data Sources and Methodology by Topic Area. Technical Appendix
 As part of the Chicago Neighborhoods 2015 (CN2015) project, the Institute for Housing Studies at DePaul University collected data and built metrics to help The Chicago Community Trust and the City of Chicago
GIS and Community Health. GIS and Community Health. Institutional Context and Interests in GIS Development. GIS and Community Health
 GIS and Community Health GIS and Community Health Some critiques of GIS emphasize the potentially harmful social consequences of the diffusion of GIS technology, including reinforcing the power of state
JOB DESCRIPTION. Research Associate - Urban Economy and Employment
 JOB DESCRIPTION Research Associate - Urban Economy and Employment 2 Research Associate Urban Economy and Employment About Us The Indian Institute for Human Settlements (IIHS) is a national education institution
Summer Solstice. PreK 6 th A FREE RESOURCE PACK FROM EDUCATIONCITY. Topical Teaching Resources. Grade Range
 A FREE RESOURCE PACK FROM EDUCATIONCITY Summer Solstice PreK 6 th Topical Teaching Resources Grade Range Free school resources by EducationCity. This may be reproduced for class use. Topical Teaching Resources
Student Equity Plan Report
 Student Equity Plan Report Presentation to the Board of Trustees December 15, 2014 By: Juan Avalos Penny Skaff Deanna Valdez Georgina Guy Claire Cesareo Orlantha Nin Special Thank You: Chair: Dr. Georgina
Ticketed Sessions 1 Information in this list current as of August 2008
 Ticketed Sessions in this list current as of August 2008 1 2011 Annual Conference and Exhibit Show Ticketed Sessions Ticketed Sessions Saturday, March 26 8:00 9:00 a.m. 1101T Achievement Is Not Just a
Dublin City Schools Social Studies Graded Course of Study Grade 5 K-12 Social Studies Vision
 K-12 Social Studies Vision The Dublin City Schools K-12 Social Studies Education will provide many learning opportunities that will help students to: develop thinking as educated citizens who seek to understand
MAKING PLANNING LOCAL
 Georgia Social Vulnerability Index 2010 Atlas MAKING PLANNING LOCAL VULNERABLE & AT-RISK POPULATIONS DATA FOR JURISDICTIONS AT THE CENSUS TRACT LEVEL Public Health Districts Regional Coordinating Hospital
Community Inclusion in Colorado
 A Mapping Project for Emergency Preparedness and Response Aimee Voth Siebert, MA Julia Beems, MA Rachel Coles, MA Devon Williford, MPH Adam Anderson, MURP, MPH March 2015 understanding that HUMAN ENERGY
STAR COMMUNITY RATING SYSTEM OBJECTIVE EE-4: EQUITABLE SERVICES & ACCESS COMMUNITY LEVEL OUTCOMES FOR KING COUNTY, WA
 STAR COMMUNITY RATING SYSTEM OBJECTIVE EE-4: EQUITABLE SERVICES & ACCESS COMMUNITY LEVEL OUTCOMES FOR KING COUNTY, WA OUTCOME I: EQUITABLE ACCESS AND PROXIMITY Background: This analysis has been developed
COMMISSION ON ACCREDITATION 2012 ANNUAL REPORT ONLINE
 COMMISSION ON ACCREDITATION 2012 ANNUAL REPORT ONLINE SUMMARY DATA: POSTDOCTORAL PROGRAMS ^Clicking a table title will automatically direct you to that table in this document *Programs that combine two
GIS-Based Analysis of the Commuting Behavior and the Relationship between Commuting and Urban Form
 GIS-Based Analysis of the Commuting Behavior and the Relationship between Commuting and Urban Form 1. Abstract A prevailing view in the commuting is that commuting would reconstruct the urban form. By
8. Who is the university administrator responsible for verifying data (and completing IPEDS reports) at your institution?
 at your institution?") NAAB Annual Report -- I Statistical Report SECTION A. INSTITUTIONAL CHARACTERISTICS 1. Program Contact Information: Name rth Carolina State University Title School of Architecture, College of Design Office
NAAB Annual Report -- I Statistical Report SECTION A. INSTITUTIONAL CHARACTERISTICS 1. Program Contact Information: Name rth Carolina State University Title School of Architecture, College of Design Office
NERCHE Self-Assessment Rubric for the Institutionalization of Diversity, Equity, and Inclusion in Higher Education
 NERCHE Self-Assessment Rubric for the Institutionalization of Diversity, Equity, and Inclusion in Higher Education College of Education and Human Development University of Massachusetts Boston 100 Morrissey
Assessing Studies Based on Multiple Regression
 Assessing Studies Based on Multiple Regression Outline 1. Internal and External Validity 2. Threats to Internal Validity a. Omitted variable bias b. Functional form misspecification c. Errors-in-variables
A User s Guide to the Federal Statistical Research Data Centers
 A User s Guide to the Federal Statistical Research Data Centers Mark Roberts Professor of Economics and Director PSU FSRDC September 2016 M. Roberts () RDC User s Guide September 2016 1 / 14 Outline Introduction
Institution: CUNY Bronx Community College (190530) User ID: 36C0029 Completions Overview distance education All Completers unduplicated count
 User ID: 36C0029 Completions Overview distance education All Completers unduplicated count") Completions 204-5 Institution: CUNY Bronx Community College (90530) User ID: 36C0029 Completions Overview Welcome to the IPEDS Completions survey component. The Completions component is one of several
Completions 204-5 Institution: CUNY Bronx Community College (90530) User ID: 36C0029 Completions Overview Welcome to the IPEDS Completions survey component. The Completions component is one of several
USA GOLF 2013 D&I SCORECARD
 D&I SCORECARD D&I SCORECARD How the D&I Scorecard is collected and prepared In accordance with the Ted Stevens Act, the USOC s Diversity and Inclusion department annually collects diversity data from the
In-State Resident
 CAMPUS UW-Casper Distance 1 * UW-Casper Distance 1 HEADCOUNT for GENDER LEVEL FULL/PART-TIME FULL-TIME EQUIVALENT (FTE) ( students plus one-third of part-time students) 5,475 44 603 6,122 0 7 6,129 4,921
Programme title: MChem Chemistry (Mathematical and Computational Chemistry)
") Faculty of Life Sciences Programme Specification Programme title: MChem Chemistry (Mathematical and Computational Chemistry) Academic Year: 2018/19 Degree Awarding Body: Final and interim award(s): University
Faculty of Life Sciences Programme Specification Programme title: MChem Chemistry (Mathematical and Computational Chemistry) Academic Year: 2018/19 Degree Awarding Body: Final and interim award(s): University
Presentation by Thangavel Palanivel Senior Strategic Advisor and Chief Economist UNDP Regional Bureau for Asia-Pacific
 Presentation by Thangavel Palanivel Senior Strategic Advisor and Chief Economist UNDP Regional Bureau for Asia-Pacific The High-Level Euro-Asia Regional Meeting on Improving Cooperation on Transit, Trade
Planning for Economic and Job Growth
 Planning for Economic and Job Growth Mayors Innovation Project Winter 2012 Meeting January 21, 2012 Mary Kay Leonard Initiative for a Competitive Inner City AGENDA The Evolving Model for Urban Economic
Equations 8.EE.C.7 Procedural Skill and Fluency Mini-Assessment by Student Achievement Partners
 Equations 8.EE.C.7 Procedural Skill and Fluency Mini-Assessment by Student Achievement Partners OVERVIEW This mini-assessment is designed to illustrate aspects of the standard 8.EE.C.7, specifically the
Edexcel Geography Advanced Paper 2
 Edexcel Geography Advanced Paper 2 SECTION B: SHAPING PLACES Assessment objectives AO1 Demonstrate knowledge and understanding of places, environments, concepts, processes, interactions and change, at
Integrated Postsecondary Education Data System
 University of Nebraska Omaha DigitalCommons@UNO IPEDS Completions Integrated Postsecondary Education Data System 202 Completions 202-3 UNO Office of Institutional Effectiveness University of Nebraska at
4. 1. PROGRAM: Architectural Technology CODE: A40100 DEGREE: Associate in Applied Science DESCRIPTION/PURPOSE
 ARCHITECTURAL TECHNOLOGY DESCRIPTION/PURPOSE PROGRAM: Architectural Technology CODE: A40100 DEGREE: Associate in Applied Science The Architectural Technology curriculum prepares individuals with knowledge