Change in glacier volume between on M t H ood and M t R ainier
|
|
|
- Adela Washington
- 6 years ago
- Views:
Transcription

1 Change in glacier volume between on M t H ood and M t R ainier Chris K irkland & T anja H opmans G eography Digital T errain Analysis
2 Introduction & Background - G laciers provide tangible evidence of climate change and act as a measureable and quantifiable source of the effects of rising temperatures and changes with weather patterns - U se of historic and current D EM s to measure and quantify ice volume depletion and use of models to calculate rate of retreat and draw correlations to influential factors - M ultiple studies have shown that D EM s can be used to accurately quantify glacial ice loss and glacier surface elevation change ( Si sson 2011& M cn abb2012)
3 D atasets 1:100,000 Scale - All North American Glacier Outlines DRG / DLG / USGS Topo Map derived Limited accuracy at large scale and from area to area 1:5,000 Scale - Mount Rainier Glacier Outline file Lidar derived, higher accuracy for Rainier study area required due to resolution Historic DEM for Mount Rainier Study Area 10 meter horizontal and 1meter vertical accuracy 2006 DEM for Mount Rainier Study Area 1meter horizontal and 1meter vertical accuracy 1990 Historic DEM for Mount Hood Study Area 30 meter horizontal and 1meter vertical accuracy 2010 DEM for Mount Hood Study Area 3 foot horizontal and 1foot vertical accuracy

4 Mount Hood Study A rea

5 Mount Rainier Study A rea


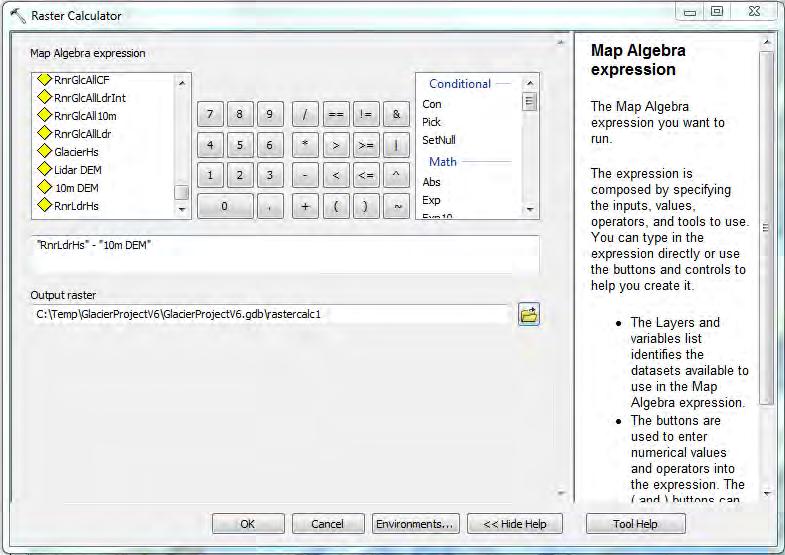
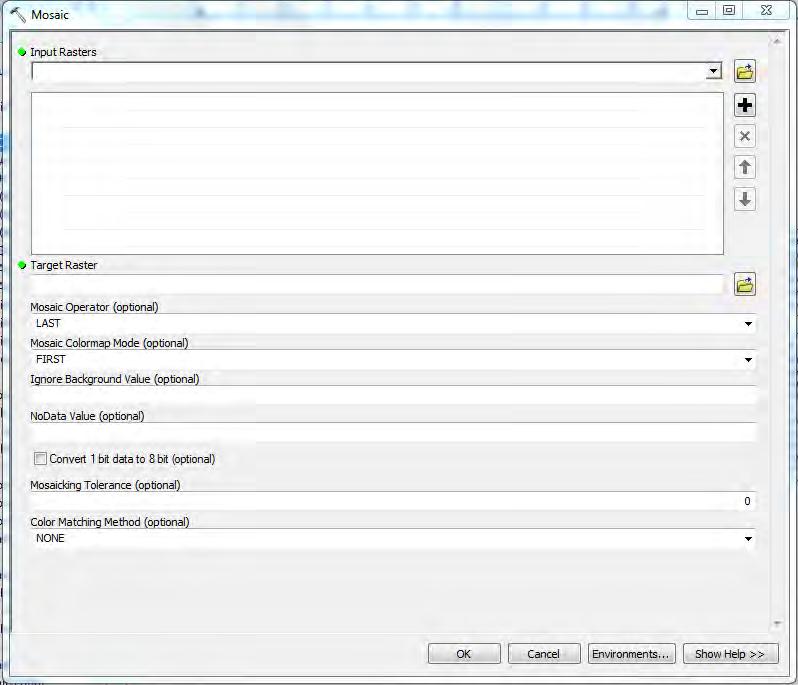
6 M ethods & T ools
7 M ethods & T ools M osaic DEM s together to create seamless study area Use glacier shapefile to extract / clip out data for all glaciers as well as individual glaciers Use Aggregate tool to convert to matching linear units between DEM s Use Raster snap function to align datasets Use Cut Fill to analyze volume increase, decrease and sum Use Raster calculator to determine height change over glacier surface Use Raster calculator to elevation units Use summary statistics and attribute table statistics to determine volume sum, increase, decrease and area

8 Results for Mount Hood Study Area Glacier Volume decrease (km 3 ) Volume increase (km 3 ) Net Change (km 3 ) Area (km 2 ) aspect Eliot North and east facing Sandy West and north facing Newton East facing Clark Zigzag e West and south facing Coe North facing Reid e West and north facing

9


10 Results for Mount Rainier Study Area Volume Total for Sisson variation due to original DEM error factor

11 Aspect Mount Rainier Study Area

12 Results for M ount R ainier Study A rea H eight C hange
13 Limitations and Further Research T he accuracy of the historic 10m D EMs of M ount R ainier is uncertain since metadata did not include accuracy or error definition or even exact year of acquisition A ccuracy of 1:100,000 k N orth A merican G lacier outline shapefile Accuracy of 30 meter D EM and omission of surface details in dataset L imited availability of temporal datasets to create multiple analyses and make comparisons Possible use of oldest available / accurate aerial photographs from specific years to create additional historic DEMs

14 1:100,000 k G lacier O utline Shapefile M isalignment Carbon G lacier M ount R ainier
15 Sources: P. Peduzzi, C. H erold, and W. Silverio. A ssessing high altitude glacier thickness, volume and area changes using field, G I S and remote sensing techniques: the case of N evado Coropuna (Peru) 23 A ugust 2010 T.W. Sisson1*, J.E. R obinson1*, and D.D. Swinney2* Whole-edifice ice volume change A.D to 2007/2008 at M ount R ainier, W ashington, based on LiDAR surveying. 1U.S. Geological Survey, 345 Middlefield R oad, Menlo Park, California 94025, USA 2 N ational Park Service, M ount R ainier N ational Park, A shford, W ashington 98304, U SA A ndrew G. Fountain, M atthew H offman, K eith Jackson, H assan Basagic, T homas N ylen, and D avid Percy D igital outlines and T opography of the A merican W est. USGS. R eston, V irginia: 2007 M ichael L eslie H ekkers. Climatic and Spatial V ariations of M ount R ainier s G laciers for the L ast 12,000 Years. Portland State University T homas H. N ylen. Spatial and T emporal V ariations of G laciers ( ) on Mt. R ainier and the relation with climate. Portland State University Frank D. G ranshaw. G lacier Change in the N orth Cascades N ational Park Complex, W ashington State U SA, 1958 to Portland State University R.W. M cn abb et al. U sing surface velocities to calculate ice thickness and bed topography: a case study at Columbia G lacier, A laska, U SA. Journal of Glaciology, Vol. 58, No. 212, K arl Lillquist, K aren W alker. H istoric Glacier and climate fluctuations at Mount H ood, Oregon. Arctic, Antarctic, and Alpine R esearch, vol.38,no.3, 2006, pp
ANALYSIS OF GLACIER CHANGE IN THE SIERRA NEVADA PORTLAND STATE UNIVERSITY DEPARTMENT OF GEOLOGY BRADLEY BUSELLI
 ANALYSIS OF GLACIER CHANGE IN THE SIERRA NEVADA PORTLAND STATE UNIVERSITY DEPARTMENT OF GEOLOGY BRADLEY BUSELLI Study area: Sierra Nevada (Glaciers, 2015) Closer look (Glaciers, 2015) Primary goal: Research
SECTION 2 How Is Pacific Northwest Climate Changing?
 SECTION 2 How Is Pacific Northwest Climate Changing? The Pacific Northwest is experiencing a suite of long-term changes that are consistent with those observed globally as a result of human-caused climate
The Retreat of the Grinnell Glacier: 1990-Present
 Falk, Hepler, Lopez 1 Megan Falk, Alex Hepler, Michelle Lopez GSP 270/ Graham Group Project/ Final Draft December 8, 2014 Word count: 1,148 Introduction The Retreat of the Grinnell Glacier: 1990-Present
A Temporal Hydrologic Database for Rapidly Changing Landscapes
 A Temporal Hydrologic Database for Rapidly Changing Landscapes Using Mt. St. Helens in Washington as a Pilot Site Adam Mosbrucker Geog 575 BACKGROUND: Client / User U.S. Geological Survey Cascades Volcano
The Retreating Glaciers of Mt. Jefferson, Oregon. Using EET Methods in Student Research Projects
 The Retreating Glaciers of Mt. Jefferson, Oregon Using EET Methods in Student Research Projects Image Hemphill, 2006 Earth Exploration Toolbook: Chapters Used Measuring Distance and Area in Satellite Images
Volcanic Hazards of Mt Shasta
 Volcanic Hazards of Mt Shasta Introduction Mt Shasta is a volcano in the northern part of California. Although it has been recently inactive for over 10,000 years. However, its eruption would cause damage
Examining Ice Volume Change in the Northern Cascades, Washington
 Abstract for Digital Terrain Analysis Project Examining Ice Volume Change in the Northern Cascades, Washington Candice Loveland (candicel@pdx.edu) and Christina Gray (ceg4@pdx.edu) Portland State University
Assessment of the Hood River Delta Hood River, Oregon
 Assessment of the Hood River Delta Hood River, Oregon Pacific Northwest Waterways Association Annual Meeting October 13, 2010 Michael McElwee, Executive Director Port of Hood River Overview U.S. Army Corps
Terrain Analysis of Taylor Valley, McMurdo Dry Valleys, Antarctica Logan Schmidt, University of Texas Institute for Geophysics.
 Terrain Analysis of Taylor Valley, McMurdo Dry Valleys, Antarctica Logan Schmidt, University of Texas Institute for Geophysics Abstract The surface geology of Taylor Valley records information about the
Volcanic Deformation and Evolution.
 Volcanic Deformation and Evolution of Mt. Saint SitHelens http://pubs.usgs.gov/sim/3008/ B. A. Digital perspective view derived from USGS Digital Elevation Model (DEM) of Mount St. Helens as seen from
Determining the spatio-temporal distribution of 20th Century Antarctic Peninsula glacier mass change
 Determining the spatio-temporal distribution of 20th Century Antarctic Peninsula glacier mass change Jon Mills, Pauline Miller, Matthias Kunz School of Civil Engineering & Geosciences / Centre for Earth
Alaska, USA. Sam Robbins
 Using ArcGIS to determine erosion susceptibility within Denali National Park, Alaska, USA Sam Robbins Introduction Denali National Park is six million acres of wild land with only one road and one road
Timing and magnitude of late Pleistocene and Holocene glaciations in Yosemite National Park
 National Park Service U.S. Department of the Interior Yosemite National Park Timing and magnitude of late Pleistocene and Holocene glaciations in Yosemite National Park Greg Stock Yosemite National Park
Copyright The McGraw-Hill Companies, Inc. Permission required for reproduction or display.
 CHAPTER 5 GIS DATA Acquisition 5.1 Existing GIS Data 5.1.1 Federal Geographic Data Committee 5.1.2 Geospatial One-Stop Box 5.1 Clearinghouse and Portal 5.1.3 U.S. Geological Survey 5.1.4 U.S. Census Bureau
Terms GIS GPS Vector Data Model Raster Data Model Feature Attribute Table Point Line Polygon Pixel RGB Overlay Function
 FINAL REVIEW FOR GIS (2016) PRACTICAL COMPONENT The first 40 mins of the exam will be open book and will require you to make a map using all the techniques learned over the semester. This map will be e-mailed
Geologic Evolution of the Skagit River Channel Migration Zone. J. Riedel National Park Service
 Geologic Evolution of the Skagit River Channel Migration Zone J. Riedel National Park Service LSWT BT OT CMZ defined by: 1) Areas within FEMA floodplain of Skagit River (100 and 500 year); 2) Areas within
Flood Inundation Mapping
 KU GIS Day 2009 November 18, 2009 Flood Inundation Mapping Wendy L. Pearson NOAA s National Weather Service Central Region Headquarters Kansas City, Missouri Flood Inundation Mapping Objectives: Overview
Topographic Maps Lab 1
 Topographic Maps Lab 1 I. Objectives 1. Construct a material model of typical terrain found in a landscape. 2. Construct a topographic map corresponding to the terrain model. 3. Learn how to interpret
Classification of Erosion Susceptibility
 GEO327G: GIS & GPS Applications in Earth Sciences Classification of Erosion Susceptibility Denali National Park, Alaska Zehao Xue 12 3 2015 2 TABLE OF CONTENTS 1 Abstract... 3 2 Introduction... 3 2.1 Universal
Geomorphologic Mapping by Airborne Laser Scanning in Southern Victoria Land
 Geomorphologic Mapping by Airborne Laser Scanning in Southern Victoria Land Bea Csatho, Terry Wilson, Tony Schenk, Garry McKenzie, Byrd Polar Research Center, The Ohio State University, Columbus, OH William
Posteruption glacier development within the crater of Mount St. Helens, Washington, USA
 Quaternary Research 61 (2004) 325 329 Short Paper Posteruption glacier development within the crater of Mount St. Helens, Washington, USA Steve P. Schilling, a, * Paul E. Carrara, b Ren A. Thompson, b
ISO Swift Current LiDAR Project 2009 Data Product Specifications. Revision: A
 ISO 19131 Swift Current LiDAR Project 2009 Data Product Specifications Revision: A Data product specifications: Swift Current LiDAR Project 2009 - Table of Contents- 1. Overview... 4 1.1. Informal description...
Hydrology and Watershed Analysis
 Hydrology and Watershed Analysis Manual By: Elyse Maurer Reference Map Figure 1. This map provides context to the area of Washington State that is being focused on. The red outline indicates the boundary
ELEVATION. The Base Map
 ELEVATION The Base Map Basic Elevation Types: Points X, Y, Z Irregular distribution Cumbersome Typical sources Lidar Stereo photography Ground survey ASCII, LAS formats Basic Elevation Types: Contour Lines
Historical Glacier and Climate Fluctuations at Mount Hood, Oregon
 Arctic, Antarctic, and Alpine Research, Vol. 38, No. 3, 2006, pp. 399 412 Historical Glacier and Climate Fluctuations at Mount Hood, Oregon Karl Lillquist* and Karen Walker *Geography and Land Studies
Lecture 3. Data Sources for GIS in Water Resources
 Lecture 3 Data Sources for GIS in Water Resources GIS in Water Resources Spring 2015 http://www.data.gov/ 1 USGS GIS data for Water http://water.usgs.gov/maps.html Watersheds of the US 2-digit water resource
The Nature of Kinematic Waves in Glaciers and their Application to Understanding the Nisqually Glacier, Mt. Rainier, Washington
 Portland State University PDXScholar University Honors Theses University Honors College 2016 The Nature of Kinematic Waves in Glaciers and their Application to Understanding the Nisqually Glacier, Mt.
Outcrop suitability analysis of blueschists within the Dry Lakes region of the Condrey Mountain Window, North-central Klamaths, Northern California
 Outcrop suitability analysis of blueschists within the Dry Lakes region of the Condrey Mountain Window, North-central Klamaths, Northern California (1) Introduction: This project proposes to assess the
Structure from Motion Photogrammetry for 3D Reconstruction of Crater Glacier on Mount St. Helens, Washington, USA
 Julian Cross GEOG 593 Department of Geography Portland State University 12/5/16 Structure from Motion Photogrammetry for 3D Reconstruction of Crater Glacier on Mount St. Helens, Washington, USA Abstract:
Eagle Creek Post Fire Erosion Hazard Analysis Using the WEPP Model. John Rogers & Lauren McKinney
 Eagle Creek Post Fire Erosion Hazard Analysis Using the WEPP Model John Rogers & Lauren McKinney Columbia River Gorge at Risk: Using LiDAR and GIS-based predictive modeling for regional-scale erosion susceptibility
A Detailed Examination of DTM Creation Methods and Sources. Study Area Overview
 A Detailed Examination of DTM Creation Methods and Sources Adam Mosbrucker & Melinda Lamb Geography 593: Dec. 2 nd, 2010 Study Area Overview Mt. St. Helens -active volcano many eruptions in the past 30
Uncertainty modeling of glacier surface mapping from GPS: An example from Pedersenbreen, Arctic
 Uncertainty modeling of glacier surface mapping from GPS: An example from Pedersenbreen, Arctic Xi Zhao, Songtao Ai 1 Chinese Antarctic Center of Surveying and Mapping, Wuhan University, Wuhan 430079,
Lidar Illustrated 2012 CALENDAR OREGON DEPARTMENT OF GEOLOGY AND MINERAL INDUSTRIES
 Lidar Illustrated 2012 CALENDAR OREGON DEPARTMENT OF GEOLOGY AND MINERAL INDUSTRIES Lidar Technology & Coverage in Oregon DOGAMI APPLICATIONS FOR HIGH-RESOLUTION LIDAR IMAGE: USGS Lidar (light detection
A u s t r i a n A l p s
 Documentation of the glacier retreat in the eastern part of the Granatspitz Mountains (Austrian Alps) using aerial photographs V. Kaufmann*, R. Plösch**, S. Ritter*, J. Streber* * Institute of Remote Sensing
What is GIS? Arizona Maps & GIS Spatial datasets Library GIS Services More Web resources GIS-AZUL HOME
 Research by SUBJECT: Geographic Information Systems The University of Arizona Library What is GIS? Arizona Maps & GIS Spatial datasets Library GIS Services More Web resources GIS-AZUL HOME GEOGRAPHIC INFORMATION
Summary Visualizations for Coastal Spatial Temporal Dynamics
 Summary Visualizations for Coastal Spatial Temporal Dynamics October 24 2011 Providence, RI Sidharth Thakur 1, Laura Tateosian 2, Helena Mitasova, Eric Hardin, and Margery Overton 1. sthakur@renci.org,
DATA SOURCES AND INPUT IN GIS. By Prof. A. Balasubramanian Centre for Advanced Studies in Earth Science, University of Mysore, Mysore
 DATA SOURCES AND INPUT IN GIS By Prof. A. Balasubramanian Centre for Advanced Studies in Earth Science, University of Mysore, Mysore 1 1. GIS stands for 'Geographic Information System'. It is a computer-based
ENGRG Introduction to GIS
 ENGRG 59910 Introduction to GIS Michael Piasecki March 17, 2014 Lecture 08: Terrain Analysis Outline: Terrain Analysis Earth Surface Representation Contour TIN Mass Points Digital Elevation Models Slope
Lecture 9: Reference Maps & Aerial Photography
 Lecture 9: Reference Maps & Aerial Photography I. Overview of Reference and Topographic Maps There are two basic types of maps? Reference Maps - General purpose maps & Thematic Maps - maps made for a specific
Change detection at the recently erupted Te Maari crater, Tongariro, from stereo aerial photographs
 Change detection at the recently erupted Te Maari crater, Tongariro, from stereo aerial photographs Strong, D.T., Jones, K.E., Ashraf, S. and Lee, J. Outline Geographic context Setting and eruption Science
Arctic Climate Connections Activity 3 Exploring Arctic Climate Data
 Arctic Climate Connections Activity 3 Exploring Arctic Climate Data Part A. Understanding Albedo Albedo is the ratio of incoming solar radiation that is reflected back into space. Albedo is expressed as
Geo 327G Semester Project. Landslide Suitability Assessment of Olympic National Park, WA. Fall Shane Lewis
 Geo 327G Semester Project Landslide Suitability Assessment of Olympic National Park, WA Fall 2011 Shane Lewis 1 I. Problem Landslides cause millions of dollars of damage nationally every year, and are
Fire Susceptibility Analysis Carson National Forest New Mexico. Can a geographic information system (GIS) be used to analyze the susceptibility of
 be used to analyze the susceptibility of") 1 David Werth Fire Susceptibility Analysis Carson National Forest New Mexico Can a geographic information system (GIS) be used to analyze the susceptibility of Carson National Forest, New Mexico to forest
1 David Werth Fire Susceptibility Analysis Carson National Forest New Mexico Can a geographic information system (GIS) be used to analyze the susceptibility of Carson National Forest, New Mexico to forest
Bathymetry Data and Models: Best Practices
 Bathymetry Data and Models: Best Practices Barry Eakins & Lisa Taylor The NOAA National Geophysical Data Center Over 600 data types - from the core of the Earth to the surface of the Sun NGDC Bathymetry
ENGRG Introduction to GIS
 ENGRG 59910 Introduction to GIS Michael Piasecki November 17, 2017 Lecture 11: Terrain Analysis Outline: Terrain Analysis Earth Surface Representation Contour TIN Mass Points Digital Elevation Models Slope
Prepared by: Ryan Ratcliffe GPH-903 December 10, 2011
 Prepared by: Ryan Ratcliffe GPH-903 December 10, 2011 Scientific studies have proven that global sea level has risen 7.1 inches in the past century and computer models have suggested that climate change
Supraglacial Lake Formation and What it Means for Greenland s Future
 Supraglacial Lake Formation and What it Means for Greenland s Future GreenPeace Ulyana Nadia Horodyskyj GEOG 5271 questions of interest How, when and where do these lakes form in Greenland? How do these
Quantifying 20th Century Glacier Change in the Sierra Nevada, California
 Arctic, Antarctic, and Alpine Research, Vol. 43, No. 3, 2011, pp. 317 330 Quantifying 20th Century Glacier Change in the Sierra Nevada, California H. J. Basagic*{ and A. G. Fountain* *Department of Geology,
SCIENTIFIC REPORT NERC GEF
 SCIENTIFIC REPORT NERC GEF Loan 927 Measuring changes in the dynamics of Pine Island Glacier, Antarctica A.M. Smith & E.C. King, British Antarctic Survey (BAS) pp J.B.T. Scott ABSTRACT A brief period of
The 3D Elevation Program: Overview. Jason Stoker USGS National Geospatial Program ESRI 2015 UC
 + The 3D Elevation Program: Overview Jason Stoker USGS National Geospatial Program ESRI 2015 UC + 2 A little history USGS has a long, proud tradition of mapmaking (2009) + 3 The changing times Mapping
Cooperative Institute for Research in Environmental Sciences (CIRES) CU-Boulder 2. National Oceanic and Atmospheric Administration
 CU-Boulder 2. National Oceanic and Atmospheric Administration") Moisture transport during the inland penetrating atmospheric river of early November 006 in the Pacific Northwest: A high-resolution model-based study Michael J. Mueller 1 and Kelly Mahoney 1 Cooperative
Moisture transport during the inland penetrating atmospheric river of early November 006 in the Pacific Northwest: A high-resolution model-based study Michael J. Mueller 1 and Kelly Mahoney 1 Cooperative
Final Project: Geodatabase of Mule Mountains Area, southeastern Arizona
 R. Aisner 11/24/09 GEO 386G Final Project: Geodatabase of Mule Mountains Area, southeastern Arizona Project goal: Develop a geodatabase with vector and raster data for future data organization and analysis.
Identifying Wildfire Risk Areas in Western Washington State
 Identifying Wildfire Risk Areas in Western Washington State Matthew Seto University of Washington Tacoma GIS Certification Program URISA 2015 Undergraduate Geospatial Skills Competition Introduction 2014
PSU GEOG 488 Final Project. Data Sources for Search & Rescue Mission Management. Loren Pfau 16 December Introduction:
 PSU GEOG 488 Final Project Data Sources for Search & Rescue Mission Management Loren Pfau 16 December 2009 Introduction: For my GEOG 488 final project I elected to conduct an analysis of the geospatial
Erin Costello A comparison of Solar Radiation Modeling Tools
 Erin Costello A comparison of Solar Radiation Modeling Tools The Oregon Department of Environmental Quality uses effective shade as an indicator of water quality parameters as well as a target for restoration
GIS Techniques for Avalanche Path Mapping and Snow Science Observations. By Douglas D. Scott AVALANCHE MAPPING/IDEA INTEGRATION
 GIS Techniques for Avalanche Path Mapping and Snow Science Observations GIS Techniques for Avalanche Path Mapping and Snow Science Observations. By Douglas D. Scott AVALANCHE MAPPING/IDEA INTEGRATION For
Erosion Susceptibility in the area Around the Okanogan Fire Complex, Washington, US
 Erosion Susceptibility in the area Around the Okanogan Fire Complex, Washington, US 1. Problem Construct a raster that represents susceptibility to erosion based on lithology, slope, cover type, burned
SENSITIVITY ANALYSIS OF THE RAMMS AVALANCHE DYNAMICS MODEL IN A CANADIAN TRANSITIONAL SNOW CLIMATE
 SENSITIVITY ANALYSIS OF THE RAMMS AVALANCHE DYNAMICS MODEL IN A CANADIAN TRANSITIONAL SNOW CLIMATE Ryan Buhler 1 *, Chris Argue 1, Bruce Jamieson 2, and Alan Jones 1 1 Dynamic Avalanche Consulting Ltd.,
Sea Level Scare in South Carolina. by William Witmer GEO 327G 5 December 2016
 Sea Level Scare in South Carolina by William Witmer GEO 327G 5 December 2016 Problem Hilton Head Island in South Carolina attracts 2.5 million tourists every year. This popular locale features endangered
Technical Drafting, Geographic Information Systems and Computer- Based Cartography
 Technical Drafting, Geographic Information Systems and Computer- Based Cartography Project-Specific and Regional Resource Mapping Services Geographic Information Systems - Spatial Analysis Terrestrial
Released Science Inquiry Task Encounter with an Active Volcano Grade 11
 Date: Your Name: Released Science Inquiry Task Encounter with an Active Volcano 2016 Grade 11 Directions: Science You will be reading a story and analyzing the data provided to answer a set of questions.
Title Accuracy assessment of GIS techniques for measuring volumetric loss at Mount St. Helens
 Andrew Nelson Geog 493 - Digital Terrain Analysis Portland State University 7 Dec, 2017 Title Accuracy assessment of GIS techniques for measuring volumetric loss at Mount St. Helens Abstract The 1980 eruption
Outline 24: The Holocene Record
 Outline 24: The Holocene Record Climate Change in the Late Cenozoic New York Harbor in an ice-free world (= Eocene sea level) Kenneth Miller, Rutgers University An Ice-Free World: eastern U.S. shoreline
Oakland Technical High School. AP PHYSICS SUMMER ASSIGNMENT Due Monday, August 22 nd
 Oakland Technical High School P PHYSICS SUMME SSIGNMENT Due Monday, ugust nd I. This packet is a review to brush up on valuable skills, and perhaps a means to assess whether you are correctly placed in
GLACIER VARIABILITY IN WYOMING'S WIND RIVER & TETON RANGES
 GLACIER VARIABILITY IN WYOMING'S WIND RIVER & TETON RANGES Derrick Thompson, Jeb Bell, Jake Edmunds, Glen Tootle & Greg Kerr University of Wyoming Department of Civil Engineering OUTLINE Background Research
The Invasion of False Brome in Western Oregon
 The Invasion of False Brome in Western Oregon GIS II Presentation Winter 2006 Will Fellers Kurt Hellerman Kathy Strope Statia Cupit False Brome (Brachypodium sylvaticum) Perennial bunchgrass native to
LANDSLIDE RISK ASSESSMENT IN YOSEMITE NATIONAL PARK. Edna Rodriguez December 1 st, 2016 Final Project
 LANDSLIDE RISK ASSESSMENT IN YOSEMITE NATIONAL PARK Edna Rodriguez December 1 st, 2016 Final Project Table of Contents Introduction... 2 Data Collection... 2 Data Preprocessing... 3 ArcGIS Processing...
Popular Mechanics, 1954
 Introduction to GIS Popular Mechanics, 1954 1986 $2,599 1 MB of RAM 2017, $750, 128 GB memory, 2 GB of RAM Computing power has increased exponentially over the past 30 years, Allowing the existence of
Using Ice Thickness and Bed Topography to Pick Field Sites Near Swiss Camp, Greenland
 Lauren Andrews 6 May 2010 GEO 386G: GIS final project Using Ice Thickness and Bed Topography to Pick Field Sites Near Swiss Camp, Greenland Problem Formulation My primary goal for this project is to map
Lecture 5. GIS Data Capture & Editing. Tomislav Sapic GIS Technologist Faculty of Natural Resources Management Lakehead University
 Lecture 5 GIS Data Capture & Editing Tomislav Sapic GIS Technologist Faculty of Natural Resources Management Lakehead University GIS Data Input Surveying/GPS Data capture Facilitate data capture Final
Grounding line mapping in Antarctica using 15 years of DInSAR data
 Grounding line mapping in Antarctica using 15 years of DInSAR data Jérémie Mouginot 1 Eric Rignot 1,2, Bernd Scheuchl 1 1 University of California, Irvine 2 Jet Propulsion Laboratory Introduction Outline
Global Warming and Changing Sea Level. Name: Part 1: Am I part of the problem?!
 Part 1: Am I part of the problem?! Name: The consumption of energy in the form of fossil fuel combustion is the largest single contributor to anthropogenic greenhouse gas emissions in the U.S. and the
Ü CL_EFD_06 E CL_##_## Thunder Creek. Map. Channel Migration Assessment. Channel Migration Zone
 CL_FD_ CL_FD_6 6 CL_FD_7 CL_TH_ Meters Feet Dickey River, F CL_FD_8 CL_TH_ aerial from Microsoft via SRI World Imagery :4, USGS DRG Roads from TIGR (US Census Bureau) Analyzed by: Patricia Olson, PhD,
Exercise 3: GIS data on the World Wide Web
 Exercise 3: GIS data on the World Wide Web These web sites are a few examples of sites that are serving free GIS data. Many other sites exist. Search in Google or other search engine to find GIS data for
The subject paper is being submitted for approval for publication in the annual volume entitled Geological Survey Research.
 Water Resources Division 345 Middlefield Road Menlo Park, California January 12, 1965 Memorandum To: Mr. Frank E. Clark, Chief, General Hydrology Branch Thru: Area Hydrologist PCA From: Valmore C. LaMarche
Phase One Development of a Comprehensive GIS for the Mentor Marsh and its Proximal Watershed
 FINAL REPORT Phase One Development of a Comprehensive GIS for the Mentor Marsh and its Proximal Watershed Lake Erie Protection Fund SG 120-99 Ohio State University Research Foundation RF 738027 December
Generation and analysis of Digital Elevation Model (DEM) using Worldview-2 stereo-pair images of Gurgaon district: A geospatial approach
 using Worldview-2 stereo-pair images of Gurgaon district: A geospatial approach") 186 Generation and analysis of Digital Elevation Model (DEM) using Worldview-2 stereo-pair images of Gurgaon district: A geospatial approach Arsad Khan 1, Sultan Singh 2 and Kaptan Singh 2 1 Department
186 Generation and analysis of Digital Elevation Model (DEM) using Worldview-2 stereo-pair images of Gurgaon district: A geospatial approach Arsad Khan 1, Sultan Singh 2 and Kaptan Singh 2 1 Department
What s New in Topographic Information - USGS National Map
 + What s New in Topographic Information - USGS National Map SARGIS Workshop November 14, 2016 Rob Dollison, 703-648-5724 rdollison@usgs.gov + USGS 2 National Geospatial Program The National Geospatial
GIS feature extraction tools in diverse landscapes
 CE 394K.3 GIS in Water Resources GIS feature extraction tools in diverse landscapes Final Project Anna G. Kladzyk M.S. Candidate, Expected 2015 Department of Environmental and Water Resources Engineering
Modelling of surface to basal hydrology across the Russell Glacier Catchment
 Modelling of surface to basal hydrology across the Russell Glacier Catchment Sam GAP Modelling Workshop, Toronto November 2010 Collaborators Alun Hubbard Centre for Glaciology Institute of Geography and
Supplementary material: Methodological annex
 1 Supplementary material: Methodological annex Correcting the spatial representation bias: the grid sample approach Our land-use time series used non-ideal data sources, which differed in spatial and thematic
!"#$%&'()*+%,-#$%.*&,/0*1)$2,0$3, %4#,5#2607)0%)8$,89,/#+%#*$,-0$030,
*+%,-#$%.*&,/0*1)$2,0$3, %4#,5#2607)0%)8$,89,/#+%#*$,-0$030,") !"#$%&'()*+%,-#$%.*&,/0*1)$2,0$3, %4#,5#2607)0%)8$,89,/#+%#*$,-0$030, (0*8$,@$+68", F07)G7,-6)10%#,H1A07%+,-8$+8*%).1, C$)D#*+)%&,89,I)7%8*)0, :0**&,-60*;#, 7#0$,?,@%18+A4#*)7,B7)#$7#+, C$)D#*+)%&,89,E-,
!"#$%&'()*+%,-#$%.*&,/0*1)$2,0$3, %4#,5#2607)0%)8$,89,/#+%#*$,-0$030, (0*8$,@$+68", F07)G7,-6)10%#,H1A07%+,-8$+8*%).1, C$)D#*+)%&,89,I)7%8*)0, :0**&,-60*;#, 7#0$,?,@%18+A4#*)7,B7)#$7#+, C$)D#*+)%&,89,E-,
Calhoun County, Texas Under 5 Meter Sea Level Rise
 Kyle Kacal GEO 327G Calhoun County, Texas Under 5 Meter Sea Level Rise PROBLEM AND PURPOSE: Sea level rise is threat to all coastal areas. Although natural sea level rise happens at a very slow rate, hurricanes
Esri Exam EADP10 ArcGIS Desktop Professional Version: 6.2 [ Total Questions: 95 ]
![Esri Exam EADP10 ArcGIS Desktop Professional Version: 6.2 [ Total Questions: 95 ]](/thumbs/73/68697597.jpg "Esri Exam EADP10 ArcGIS Desktop Professional Version: 6.2 [ Total Questions: 95 ]") s@lm@n Esri Exam EADP10 ArcGIS Desktop Professional Version: 6.2 [ Total Questions: 95 ] Question No : 1 An ArcGIS user runs the Central Feature geoprocessing tool on a polygon feature class. The output
s@lm@n Esri Exam EADP10 ArcGIS Desktop Professional Version: 6.2 [ Total Questions: 95 ] Question No : 1 An ArcGIS user runs the Central Feature geoprocessing tool on a polygon feature class. The output
Update on Seasonal Conditions & Summer Weather Outlook
 Update on Seasonal Conditions & Summer Weather Outlook Andy Bryant National Weather Service Portland, Oregon June 6, 2018 Overview Quick review of winter and spring conditions Seasonal water supply forecasts
Time Series Analysis with SAR & Optical Satellite Data
 Time Series Analysis with SAR & Optical Satellite Data Thomas Bahr ESRI European User Conference Thursday October 2015 harris.com Motivation Changes in land surface characteristics mirror a multitude of
UTILIZING LIDAR DATA FOR DETECTION OF CHANNEL MIGRATION TAYLOR VALLEY, ANTARCTICA ID: C34A-05
 Martin, M., Commonwealth Glacier, Dry Valleys, Digital Image, Oceanwide Expeditions UTILIZING LIDAR DATA FOR DETECTION OF CHANNEL MIGRATION TAYLOR VALLEY, ANTARCTICA ID: C34A-05 M. Camille Barlow, Jennifer
Georeferencing the Lackawanna Synclinorium using GIS
 Georeferencing the Lackawanna Synclinorium using GIS Conservation Services, LLC 2/20/2010 Contact: Philip Pass 570.510.1758 Rick Marquardt 570-335-7525 Managing Partners: Conservation Services LLC Author:
Display data in a map-like format so that geographic patterns and interrelationships are visible
 Vilmaliz Rodríguez Guzmán M.S. Student, Department of Geology University of Puerto Rico at Mayagüez Remote Sensing and Geographic Information Systems (GIS) Reference: James B. Campbell. Introduction to
Effects of input DEM data spatial resolution on Upstream Flood modeling result A case study in Willamette river downtown Portland
 Effects of input DEM data spatial resolution on Upstream Flood modeling result A case study in Willamette river downtown Portland By Hue Duong GEOG 593 Fall 2015 Digital Terrain Analysis Photo: Anh Duc
The last three sections of the main body of this report consist of:
 Threatened and Endangered Species Geological Hazards Floodplains Cultural Resources Hazardous Materials A Cost Analysis section that provides comparative conceptual-level costs follows the Environmental
Handling Raster Data for Hydrologic Applications
 Handling Raster Data for Hydrologic Applications Prepared by Venkatesh Merwade Lyles School of Civil Engineering, Purdue University vmerwade@purdue.edu January 2018 Objective The objective of this exercise
GIS compilation of coastline variability spanning 60 years in the Mackenzie Delta and Tuktoyaktuk in the Beaufort Sea
 GEOLOGICAL SURVEY OF CANADA OPEN FILE 7685 GIS compilation of coastline variability spanning 60 years in the Mackenzie Delta and Tuktoyaktuk in the Beaufort Sea S. Hynes, S.M. Solomon, and D. Whalen 2014
Mapping the extent of temperature-sensitive snowcover and the relative frequency of warm winters in the western US
 Mapping the extent of temperature-sensitive snowcover and the relative frequency of warm winters in the western US Anne Nolin Department of Geosciences Oregon State University Acknowledgements Chris Daly,
E CL_##_## Snag Creek. Map. Channel Migration Assessment. Channel Migration Zone
 CL_SC_ CL_SC_ nd of Delineation aerial from Microsoft via SRI World Imagery :4, USGS DRG Roads from TIGR (US Census Bureau) Meters Feet Analyzed by: Patricia Olson, PhD, LHG (WA Dept. of cology) Reviewed
Preliminary Data Release for the Humboldt Bay Sea Level Rise Vulnerability Assessment: Humboldt Bay Sea Level Rise Inundation Mapping
 Preliminary Data Release for the Humboldt Bay Sea Level Rise Vulnerability Assessment: Humboldt Bay Sea Level Rise Inundation Mapping Prepared by: Jeff Anderson, Northern Hydrology & Engineering (jeff@northernhydrology.com)
MCMURDO DRY VALLEYS ANTARCTICA
 POLAR WEEKEND MCMURDO DRY VALLEYS ANTARCTICA TOPIC: The McMurdo Dry Valleys, An Ecosystem of microbial life PROJECT PERSONNEL: Dr. Andrew G. Fountain, Geologist, Portland State University, Portland Oregon
Regionalization Methods for Watershed Management - Hydrology and Soil Erosion from Point to Regional Scales
 This paper was peer-reviewed for scientific content. Pages 1062-1067. In: D.E. Stott, R.H. Mohtar and G.C. Steinhardt (eds). 2001. Sustaining the Global Farm. Selected papers from the 10th International
A MODEL TO EVALUATE THE ENGINEERING GEOLOGY ON FROZEN GROUND FROM XIDATAN TO WUDAOLIANG ALONG THE QINGHAI-XIZANG HIGHWAY USING GIS
 A MODEL TO EVALUATE THE ENGINEERING GEOLOGY ON FROZEN GROUND FROM XIDATAN TO WUDAOLIANG ALONG THE QINGHAI-XIZANG HIGHWAY USING GIS Wu Qingbai, Mi Haizhen, Li Xin, Li Wenjun State Key Laboratory of Frozen
Trail Flow: Analysis of Drainage Patterns Affecting a Mountain Bike Trail
 Andy Belcher BAE 590 Professor Huffman 12.9.11 Location Trail Flow: Analysis of Drainage Patterns Affecting a Mountain Bike Trail The location of the project area rests in the Cary area of Wake County,