Multidimensional Spatial Heterogeneity in Ecosystem Service Values: Advancing the Frontier
|
|
|
- Erik Preston
- 6 years ago
- Views:
Transcription

1 Multidimensional Spatial Heterogeneity in Ecosystem Service Values: Advancing the Frontier Robert J. Johnston 1 Benedict M. Holland 2 1 George Perkins Marsh Institute and Department of Economics, Clark University 2 Environment and Natural Resources Division, Abt Associates, Inc. ACES A Community on Ecosystem Services 2016: Implementation Advances and Challenges. Jacksonville, FL, December 5-9
2 Spatial Heterogeneity in Values Spatial heterogeneity in ecosystem service value occurs because of relationships between spatial variations in ecosystem service demand and supply. Failure to recognize this heterogeneity can lead to large errors when calculating per household or aggregate value (typically willingness to pay, or WTP). Within stated preference analysis (survey-based valuation), spatial value heterogeneity is generally modeled as a function of distance between households and resources. May be discrete or continuous. Sometimes addresses directionality and substitutes.
3 Distance Decay in Ecosystem Service Values For many ecosystem services, the value of the service declines as a person moves farther away this is called distance decay. Marginal Benefit per Person ($/Unit/Person) $X MB $0 A B Distance from Outcome Figure 2.2 Marginal Benefits and Scale over Distance (or Populations Over Greater Areas)
4 Spatial Welfare Heterogeneity Other approaches to spatial heterogeneity include spatial threshold (or border) analyses. Less common approaches include kriging, spatial autocorrelation (Campbell et al. 2008, 2009) and hot spots (Johnston and Ramachandran 2014, Meyerhoff 2013). These and related approaches are all based on distance as the fundamental spatial unit (a one-dimensional measure). Commonly measured as the distance to nearest point between each household and an affected resource, either using geodesic or travel distance. But what about areas (two-dimensional measures)?

5 A Simple Illustration Household A is at distance zero from closest affected resource providing a service (e.g., restored riparian land). Household B is at distance one from the closest resource, but has a larger quantity in close proximity. Which household is closer? Which will have a higher value for improvements?
6 Questioning the Distance-Only Paradigm This paper develops an approach to model heterogeneity in stated preference WTP linked to two-dimensional measures. Models heterogeneity linked to the quantity of an resource surrounding each beneficiary (i.e., quantityat-distance-x). The distance radius for quantity measurements is optimized using model fit.
7 Relationship to Prior Work The use of areas-within-distances is common in some types of revealed preference analysis (e.g., hedonics). Similar approaches are rare as a means to characterize value heterogeneity within stated preference models. The few existing stated preference analyses that use quantity-within-distance measures do so using ad hoc distances (e.g., Yao et al. 2014; Czajkowski et al. 2016). An infinite number of possible distance bands (and hence areas) exist around each beneficiary s home, and selecting the best distance x is not trivial. This analysis chooses the optimal distance band (radius) using an iterative grid search over model log-likelihoods.
8 The Model Model contrasts distance-to-nearest-point (distance decay) and quantity-within-distance-x analysis, for policies affecting riparian land. Approaches illustrated using a random utility framework for household h and policy scenario p. U ph = γ h X ph λ h C ph + ψ h (s phg X ph ) φ h (s phg C ph ) + ε ph X ph are policy outcomes; C ph is household cost. s phg is distance-to-nearest-point or quantity-withindistance-x, with g={1,2} identifying the spatial measure. γ h, λ h, ψ h, φ h and are conforming parameter vectors or scalars to be estimated.
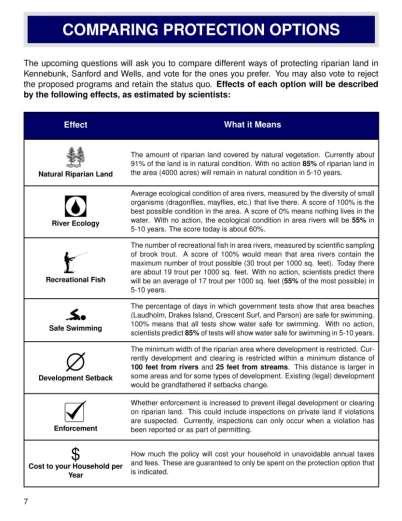
9 Stated Preference Choice Experiments Methods and results are illustrated using stated preference discrete choice experiments. Survey-based methods that estimate values from respondents votes over different policy options. Respondents choose among policies with different effects (e.g., on ecosystem services) and costs. By evaluating votes over many alternatives, we calculate tradeoffs that reveal values (willingness to pay, or WTP). Results are illustrated using a choice experiment on riparian land restoration in the Merriland, Branch Brook, and Little River (MBLR)Watershed in Maine, USA.
10 The Choice Experiment Technical Details Choice experiment was developed over 3 years in coordination with the Wells National Estuarine Research Reserve. Testing and revision including 9 focus groups plus cognitive interviews, verbal protocols and expert review. Surveys implemented December 2013 January 2014, with multiple wave mailings to maximize response. Mailed to 2,544 random households in the three towns. Of deliverable surveys, 734 were returned, for a response rate of 34% (of deliverable surveys).

11 Example Choice Question


12 Scenarios and Responses in Space s phg = 1,022m
13 Implementation and Modeling Two-step estimation of the quantity-within-distance model. First stage determines the optimal distance band using an iterative grid search algorithm over preference-space mixed logit log-likelihoods. Identifies optimal distance band of s phg = 1,022m. The second stage uses this optimal distance band to estimate the final discrete choice model in WTP-space (Scarpa et al. 2008; Train and Weeks 2005). Distance to nearest riparian land is used for parallel distance decay model. All ecological attributes included in percentage form, relative to the ecological reference condition.
14 WTP-Space Results: Distance Decay Attribute Main Effect Coefficients [ ω h, λ h ] (Std. Error) ASC (status quo) *** (12.199) Standard Deviations of ω h and λ h (Std. Error) *** (14.283) Area interactions [ η h, θ h ] (Std. Error) (3.151) Riparian Land Condition (0.546) (0.869) (0.197) River Condition 0.908*** (0.183) 1.194*** (0.327) (0.068) Recreational Fishing 0.986*** (0.185) 1.316*** (0.342) *** (0.067) Safe Swimming 1.401*** (0.566) (1.259) (0.212) Development Setbacks 0.152** (0.059) 0.522*** (0.069) (0.022) Enforcement *** (3.467) (7.437) (1.257) ln(λ h ) *** (0.196) 0.660*** (0.306) (0.080) Observations (N) 2136 Log-Likelihood Pseudo R Prob. > χ
15 WTP-Space Results: Area-within-Distance (1,200m) Attribute Main Effect Coefficients [ ω h, λ h ] (Std. Error) ASC (status quo) *** (11.498) Standard Deviations of ω h and λ h (Std. Error) *** (15.442) Area interactions [ η h, θ h ] (Std. Error) (24.730) Riparian Land Condition (0.457) 2.143*** (0.947) (1.371) River Condition 0.713*** (0.170) 1.462*** (0.272) (0.496) Recreational Fishing 0.439*** (0.154) 1.342*** (0.306) 1.346*** (0.491) Safe Swimming 1.938*** (0.504) (0.904) (1.527) Development Setbacks (0.050) 0.474*** (0.068) 0.413** (0.179) Enforcement *** (2.924) (6.958) (8.777) ln(λ h ) *** (0.234) 0.834*** (0.321) (0.416) Observations (N) 2136 Log-Likelihood Pseudo R Prob. > χ
16 Illustration: WTP for a 100 ft. Increase in Development Setbacks Across Three Towns Town Mean WTP: Mean WTP: WTP Difference: Prob: Quantitywithin-Distance Model (Std. Dev.) Distance Decay Model (Std. Dev.) Quantity-within- Distance versus Distance Decay (Std. Dev.) [H 0 : WTP Difference = 0] a Kennebunk, Maine (N=266) (0.29) (0.08) (0.25) Sanford, Maine (N=192) (0.71) (0.15) (0.63) Wells, Maine (N=276) (0.80) (0.96) 7.33 (0.74) WTP calculated using distance and area data for each observation in the sample. Reported estimates reflect means and standard deviations for households in each sampled town. Required development setbacks are determined at the town level in the US, so town-level WTP is most relevant.
17 Conclusions Results of the analysis demonstrate the insight available through two-dimensional models of spatial heterogeneity. Compared to a distance-to-nearest-point model, the quantity-within-distance model appears to better capture spatial WTP variation across our case study area. Although models such as those proposed here are more computationally intensive, they can identify patterns invisible to other approaches. A lack of WTP variation associated with one-dimensional distance measures should not be interpreted as a sign of homogeneity in ecosystem service values. Other types of spatial heterogeneity may be equally if not more relevant for modeling and policy analysis.


18 Questions? Robert J. Johnston Director, George Perkins Marsh Institute Professor, Department of Economics Clark University 950 Main St. Worcester, MA Phone: (508)
Enhancing the Geospatial Validity of Meta- Analysis to Support Ecosystem Service Benefit Transfer
 Enhancing the Geospatial Validity of Meta- Analysis to Support Ecosystem Service Benefit Transfer Robert J. Johnston Clark University, USA Elena Besedin Abt Associates, Inc. Ryan Stapler Abt Associates,
A NEW APPROACH TO CAPTURING THE
 PAPER SUBMISSION 19TH ANNUAL BIOECON CONFERENCE 21-22 SEPTEMBER 2017 TILBURG UNIVERSITY, THE NETHERLANDS A NEW APPROACH TO CAPTURING THE SPATIAL DIMENSIONS OF VALUE WITHIN CHOICE EXPERIMENTS TOMAS BADURA,
Assessment and valuation of Ecosystem Services for decision-makers
 Assessment and valuation of Ecosystem Services for decision-makers An introduction to the ARIES approach Ferdinando Villa *, Ken Bagstad Gary Johnson, Marta Ceroni *Basque Center for Climate Change, Bilbao,
Substitution Effects and Spatial Preference Heterogeneity in Single- and Multiple-Site Choice Experiments
 Substitution Effects and Spatial Preference Heterogeneity in Single- and Multiple-Site Choice Experiments Ivana Logar, Roy Brouwer Land Economics, Volume 94, Number 2, May 2018, pp. 302-322 (Article) Published
Outdoor Recreation Valuation (ORVal) User Guide
 User Guide") Outdoor Recreation Valuation (ORVal) User Guide Version 1.0 June 2016 Land, Environment, Economics and Policy (LEEP) Institute College of Social Sciences and International Studies University of Exeter
Outdoor Recreation Valuation (ORVal) User Guide Version 1.0 June 2016 Land, Environment, Economics and Policy (LEEP) Institute College of Social Sciences and International Studies University of Exeter
:: STUDENTS SUPPORTED
 PROGRESS REPORT REPORT PERIOD: 2/1/2014-1/31/2015 PROJECT NO: 2014-R/P-NERR-14-2-REG TITLE: Coastal Hazards and Northeast Housing Values: Comparative Implications for Climate Change Adaptation and Community
Combining discrete and continuous mixing approaches to accommodate heterogeneity in price sensitivities in environmental choice analysis
 Combining discrete and continuous mixing approaches to accommodate heterogeneity in price sensitivities in environmental choice analysis Danny Campbell Edel Doherty Stephen Hynes Tom van Rensburg Gibson
RURAL AMENITY VALUES AND LENGTH
 RURAL AMENITY VALUES AND LENGTH OF RESIDENCY ROBERT J. JOHNSTON,STEPHEN K. SWALLOW, TIMOTHY J. TYRRELL, ANDDANA MARIE BAUER New residents of rural communities are often assumed to have preferences for
The Economics of Ecosystems and Biodiversity on Bonaire. The value of citizens in the Netherlands for nature in the Caribbean
 The Economics of Ecosystems and Biodiversity on Bonaire The value of citizens in the Netherlands for nature in the Caribbean 2 The Economics of Ecosystems and Biodiversity on Bonaire The value of citizens
Spatial Units (Level 1)
") Spatial Units (Level 1) Project: Advancing the SEEA Experimental Ecosystem Accounting Overview: Spatial Units 1. Learning objectives 2. Review of Level 0 (5m) 3. Level 1 (Compilers): Presentation & group
Spatial Units (Level 1) Project: Advancing the SEEA Experimental Ecosystem Accounting Overview: Spatial Units 1. Learning objectives 2. Review of Level 0 (5m) 3. Level 1 (Compilers): Presentation & group
GIS Spatial Statistics for Public Opinion Survey Response Rates
 GIS Spatial Statistics for Public Opinion Survey Response Rates July 22, 2015 Timothy Michalowski Senior Statistical GIS Analyst Abt SRBI - New York, NY t.michalowski@srbi.com www.srbi.com Introduction
Spatial units (Levels 0 and 1)
") Spatial units (Levels 0 and 1) Project: Advancing the SEEA Experimental Ecosystem Accounting Overview: Spatial units 1. Learning objectives 2. Level 1: Presentation & group exercise Spatial units (10m
Spatial units (Levels 0 and 1) Project: Advancing the SEEA Experimental Ecosystem Accounting Overview: Spatial units 1. Learning objectives 2. Level 1: Presentation & group exercise Spatial units (10m
THE VALUE OF CULTURAL HERITAGE AN ECONOMIC ANALYSIS OF CULTURAL HERITAGE AND CULTURAL ENVIRONEMENTS
 ENGLISH SUMMARY THE VALUE OF CULTURAL HERITAGE AN ECONOMIC ANALYSIS OF CULTURAL HERITAGE AND CULTURAL ENVIRONEMENTS MENON PUBLICATION NR. 72/2017 By Caroline Wang Gierløff, Kristin Magnussen, Lars Stemland
06/04/2015. Overview: Spatial units. Advancing the SEEA Experimental Ecosystem Accounting Spatial units (Level 1)
") Advancing the SEEA Experimental Ecosystem Accounting Spatial units (Level 1) Advancing the SEEA-EEA Project Overview: Spatial units 1. Learning objectives 2. Level 1: Presentation & group exercise Spatial
Advancing the SEEA Experimental Ecosystem Accounting Spatial units (Level 1) Advancing the SEEA-EEA Project Overview: Spatial units 1. Learning objectives 2. Level 1: Presentation & group exercise Spatial
Resource and Energy Economics
 Resource and Energy Economics 32 (2010) 203 221 Contents lists available at ScienceDirect Resource and Energy Economics journal homepage: www.elsevier.com/locate/ree Demand-side factors in optimal land
AAEC 6524: Environmental Economic Theory and Policy Analysis. Outline. Introduction to Non-Market Valuation Part C. Klaus Moeltner Spring 2017
 AAEC 6524: Environmental Economic Theory and Policy Analysis Introduction to Non-Market Valuation Part C Klaus Moeltner Spring 2017 March 21, 2017 1 / 28 Outline 2 / 28 Quantity is usually understood to
The Diffusion of Wal-Mart and Economies of Density. by Tom Holmes
 The Diffusion of Wal-Mart and Economies of Density by Tom Holmes Economies of Density: network of stores. Cost savings achieved by having a dense Logistics of deliveries Save on trucking costs Facilitates
Fig 1. Steps in the EcoValue Project
 Assessing the Social and Economic Value of Ecosystem Services in the Northern Forest Region: A Geographic Information System (GIS) Approach to Landscape Valuation Principal Investigator(s): Dr. Matthew
INVESTIGATING DISTANCE EFFECTS ON ENVIRONMENTAL VALUES. A CHOICE MODELLING APPROACH
 1 INVESTIGATING DISTANCE EFFECTS ON ENVIRONMENTAL VALUES. A CHOICE MODELLING APPROACH Giovanni B. Concu Risk and Sustainable Management Group, University of Queensland (Australia) DEIR, Universita di Sassari
Context Similarity and the Validity of Benefits Transfer: Is the Common Wisdom Correct?
 Context Similarity and the Validity of Benefits Transfer: Is the Common Wisdom Correct? Robert J. Johnston Department of Agricultural and Resource Economics University of Connecticut April 6, 2006 Contact
ESTIMATING THE SOCIAL & ENVIRONMENTAL EFFECTS OF ADVENTURE TOURISM AND RECREATION ON CROWN LAND IN BRITISH COLUMBIA
 ESTIMATING THE SOCIAL & ENVIRONMENTAL EFFECTS OF ADVENTURE TOURISM AND RECREATION ON CROWN LAND IN BRITISH COLUMBIA Wolfgang Haider School of Resource and Environmental Mgt. Simon Fraser University Burnaby,
Mapping ecosystem services provided by benthic habitats in the European Atlantic Ocean
 Mapping and Assessment Ecosystem Services and Links to Good Environmental Status Mapping ecosystem services provided by benthic habitats in the European Atlantic Ocean Ibon Galparsoro, Angel Borja and
Economic Benefit Study on Value of Spatial Information Australian Experience
 Economic Benefit Study on Value of Spatial Information Australian Experience Dr Zaffar Sadiq Mohamed-Ghouse Director, International Relations Cooperative Research Centre for Spatial Information zsadiq@crcsi.com.au
VALUATION USING HOUSEHOLD PRODUCTION LECTURE PLAN 15: APRIL 14, 2011 Hunt Allcott
 VALUATION USING HOUSEHOLD PRODUCTION 14.42 LECTURE PLAN 15: APRIL 14, 2011 Hunt Allcott PASTURE 1: ONE SITE Introduce intuition via PowerPoint slides Draw demand curve with nearby and far away towns. Question:
Econ 673: Microeconometrics
 Econ 673: Microeconometrics Chapter 4: Properties of Discrete Choice Models Fall 2008 Herriges (ISU) Chapter 4: Discrete Choice Models Fall 2008 1 / 29 Outline 1 2 Deriving Choice Probabilities 3 Identification
NetRA Resources Assessment (NetRA) 1
 1") NetRA Resources Assessment (NetRA) 1 Dadhi Ram Adhikari Economist 2 Christopher Babis -Water Resources Policy Richard L. Bernknopf- Economist Craig D. Broadbent- Economist David S. Brookshire- Economist
NetRA Resources Assessment (NetRA) 1 Dadhi Ram Adhikari Economist 2 Christopher Babis -Water Resources Policy Richard L. Bernknopf- Economist Craig D. Broadbent- Economist David S. Brookshire- Economist
Innovations in Household Surveys. Kathleen Beegle Poverty And Inequality Course Module 1: Multi-Topic Household Surveys January 28, 2010
 Innovations in Household Surveys Kathleen Beegle Poverty And Inequality Course Module 1: Multi-Topic Household Surveys January 28, 2010 1 Overview of some new directions for LSMS/IS surveys Measuring ability
Dynamics of Firms and Trade in General Equilibrium. Robert Dekle, Hyeok Jeong and Nobuhiro Kiyotaki USC, Seoul National University and Princeton
 Dynamics of Firms and Trade in General Equilibrium Robert Dekle, Hyeok Jeong and Nobuhiro Kiyotaki USC, Seoul National University and Princeton Figure a. Aggregate exchange rate disconnect (levels) 28.5
A generic marginal value function for natural areas
 Ann Reg Sci (2017) 58:159 179 DOI 10.1007/s00168-016-0795-0 ORIGINAL PAPER A generic marginal value function for natural areas Mark J. Koetse 1 Erik T. Verhoef 2,3 Luke M. Brander 1,4 Received: 21 August
Lecture 1. Behavioral Models Multinomial Logit: Power and limitations. Cinzia Cirillo
 Lecture 1 Behavioral Models Multinomial Logit: Power and limitations Cinzia Cirillo 1 Overview 1. Choice Probabilities 2. Power and Limitations of Logit 1. Taste variation 2. Substitution patterns 3. Repeated
Surge Pricing and Labor Supply in the Ride- Sourcing Market
 Surge Pricing and Labor Supply in the Ride- Sourcing Market Yafeng Yin Professor Department of Civil and Environmental Engineering University of Michigan, Ann Arbor *Joint work with Liteng Zha (@Amazon)
A Dynamic Model for Investment Strategy
 A Dynamic Model for Investment Strategy Richard Grinold Stanford Conference on Quantitative Finance August 18-19 2006 Preview Strategic view of risk, return and cost Not intended as a portfolio management
A Joint Tour-Based Model of Vehicle Type Choice and Tour Length
 A Joint Tour-Based Model of Vehicle Type Choice and Tour Length Ram M. Pendyala School of Sustainable Engineering & the Built Environment Arizona State University Tempe, AZ Northwestern University, Evanston,
Environmental Economics Lectures 11, 12 Valuation and Cost-Benefit Analysis
 Environmental Economics Lectures 11, 12 Valuation and Cost-Benefit Analysis Florian K. Diekert April 9 and 30, 2014 Perman et al (2011) ch. 11-13 CON 4910, L11&12. Slide 1/ 28 Preview lecture 11 and 12
A/Prof. Mark Zuidgeest ACCESSIBILITY EFFECTS OF RELOCATION AND HOUSING PROJECT FOR THE URBAN POOR IN AHMEDABAD, INDIA
 A/Prof. Mark Zuidgeest ACCESSIBILITY EFFECTS OF RELOCATION AND HOUSING PROJECT FOR THE URBAN POOR IN AHMEDABAD, INDIA South African Cities Network/University of Pretoria, 09 April 2018 MOBILITY Ability
Modeling Land Use Change Using an Eigenvector Spatial Filtering Model Specification for Discrete Response
 Modeling Land Use Change Using an Eigenvector Spatial Filtering Model Specification for Discrete Response Parmanand Sinha The University of Tennessee, Knoxville 304 Burchfiel Geography Building 1000 Phillip
Overview of Methods. Terrestrial areas that are most important for conservation Conservation
 Overview of Methods The goal of the Western Lake Erie Coastal Conservation Vision project (WLECCV) is to define where we should be working locally to optimally achieve regional conservation impact. The
Application of eigenvector-based spatial filtering approach to. a multinomial logit model for land use data
 Presented at the Seventh World Conference of the Spatial Econometrics Association, the Key Bridge Marriott Hotel, Washington, D.C., USA, July 10 12, 2013. Application of eigenvector-based spatial filtering
Grant agreement number:
 EU Framework Programme 7 theme Community-based management of environmental challenges; funding scheme Research for the benefit of specific groups - Civil Society Organisations. Grant agreement number:
Marginal and Interaction Effects in Ordered Response Models
 MPRA Munich Personal RePEc Archive Marginal and Interaction Effects in Ordered Response Models Debdulal Mallick School of Accounting, Economics and Finance, Deakin University, Burwood, Victoria, Australia
Integrating advanced discrete choice models in mixed integer linear optimization
 Integrating advanced discrete choice models in mixed integer linear optimization Meritxell Pacheco Shadi Sharif Azadeh, Michel Bierlaire, Bernard Gendron Transport and Mobility Laboratory (TRANSP-OR) École
Incentivized Kidney Exchange
 Incentivized Kidney Exchange Tayfun Sönmez M. Utku Ünver M. Bumin Yenmez Boston College Boston College Boston College Kidney Exchange Kidney Exchange became a wide-spread modality of transplantation within
Spatio-temporal dynamics of the urban fringe landscapes
 Spatio-temporal dynamics of the urban fringe landscapes Yulia Grinblat 1, 2 1 The Porter School of Environmental Studies, Tel Aviv University 2 Department of Geography and Human Environment, Tel Aviv University
Mechanism Design II. Terence Johnson. University of Notre Dame. Terence Johnson (ND) Mechanism Design II 1 / 30
 Mechanism Design II 1 / 30") Mechanism Design II Terence Johnson University of Notre Dame Terence Johnson (ND) Mechanism Design II 1 / 30 Mechanism Design Recall: game theory takes the players/actions/payoffs as given, and makes predictions
Mechanism Design II Terence Johnson University of Notre Dame Terence Johnson (ND) Mechanism Design II 1 / 30 Mechanism Design Recall: game theory takes the players/actions/payoffs as given, and makes predictions
Convergent Validity of Revealed and Stated Recreation Behavior with Quality Change: A Comparison of Multiple and Single Site Demands
 Convergent Validity of Revealed and Stated Recreation Behavior with Quality Change: A Comparison of Multiple and Single Site Demands John Whitehead, ASU; Dan Phaneuf, NCSU; Chris Dumas, UNCW; Jim Herstine,
Responding to Natural Hazards: The Effects of Disaster on Residential Location Decisions and Health Outcomes
 Responding to Natural Hazards: The Effects of Disaster on Residential Location Decisions and Health Outcomes James Price Department of Economics University of New Mexico April 6 th, 2012 1 Introduction
A Spatial Multiple Discrete-Continuous Model
 A Spatial Multiple Discrete-Continuous Model Chandra R. Bhat 1,2 and Sebastian Astroza 1,3 1: The University of Texas at Austin 2: The Hong Kong Polytechnic University 3: Universidad de Concepción Outline
COMS 4771 Introduction to Machine Learning. Nakul Verma
 COMS 4771 Introduction to Machine Learning Nakul Verma Announcements HW1 due next lecture Project details are available decide on the group and topic by Thursday Last time Generative vs. Discriminative
Lecture 10 Demand for Autos (BLP) Bronwyn H. Hall Economics 220C, UC Berkeley Spring 2005
 Bronwyn H. Hall Economics 220C, UC Berkeley Spring 2005") Lecture 10 Demand for Autos (BLP) Bronwyn H. Hall Economics 220C, UC Berkeley Spring 2005 Outline BLP Spring 2005 Economics 220C 2 Why autos? Important industry studies of price indices and new goods (Court,
Lecture 10 Demand for Autos (BLP) Bronwyn H. Hall Economics 220C, UC Berkeley Spring 2005 Outline BLP Spring 2005 Economics 220C 2 Why autos? Important industry studies of price indices and new goods (Court,
Advanced Quantitative Research Methodology Lecture Notes: January Ecological 28, 2012 Inference1 / 38
 Advanced Quantitative Research Methodology Lecture Notes: Ecological Inference 1 Gary King http://gking.harvard.edu January 28, 2012 1 c Copyright 2008 Gary King, All Rights Reserved. Gary King http://gking.harvard.edu
Ecological Valuation for Land Use Planning Decision Support in South Florida: The Ecosystem Portfolio Model
 Ecological Valuation for Land Use Planning Decision Support in South Florida: The Ecosystem Portfolio Model Bill Labiosa, Rich Bernknopf, Paul Hearn, Dianna Hogan, Dave Strong, Leonard Pearlstine, Amy
Infill and the microstructure of urban expansion
 Infill and the microstructure of urban expansion Stephen Sheppard Williams College Homer Hoyt Advanced Studies Institute January 12, 2007 Presentations and papers available at http://www.williams.edu/economics/urbangrowth/homepage.htm
How wrong can you be? Implications of incorrect utility function specification for welfare measurement in choice experiments
 How wrong can you be? Implications of incorrect utility function for welfare measurement in choice experiments Cati Torres Nick Hanley Antoni Riera Stirling Economics Discussion Paper 200-2 November 200
DEPARTMENT OF HOUSING AND PROPERTY MANAGEMENT
 DEPARTMENT OF HOUSING AND PROPERTY MANAGEMENT I. MISSION STATEMENT The Mission of the Housing Department is to develop, maintain and make available affordable housing options for all North Slope Borough
Typical information required from the data collection can be grouped into four categories, enumerated as below.
 Chapter 6 Data Collection 6.1 Overview The four-stage modeling, an important tool for forecasting future demand and performance of a transportation system, was developed for evaluating large-scale infrastructure
HUMAN GEODESY SHAPING A NEW SCIENCE AND PROFESSION FOR THE WORLD OF TOMORROW. Walter Timo de Vries TUM München / Germany
 Presented at the FIG Working Week 2017, May 29 - June 2, 2017 in Helsinki, Finland HUMAN GEODESY SHAPING A NEW SCIENCE AND PROFESSION FOR THE WORLD OF TOMORROW Walter Timo de Vries TUM München / Germany
Internal Audit Report
 Internal Audit Report Right of Way Mapping TxDOT Internal Audit Division Objective To determine the efficiency and effectiveness of district mapping procedures. Opinion Based on the audit scope areas reviewed,
Throughput, Risk, and Economic Optimality of Runway Landing Operations
 Throughput, Risk, and Economic Optimality of Runway Landing Operations Babak Jeddi John Shortle Center for Air Transportation Systems Research George Mason University July 3, 27 7 th USA/Europe ATM 27
Year Term: 08S Course Name: S. HEALTH POLICY Course Number: L8274 Course Section: 1 Instructor(s): JONATHAN KLICK
: JONATHAN KLICK") Year Term: 8S Course Name: S. HEALTH POLICY Course Number: L874 Course Section: Instructor(s): JONATHAN KLICK Total Number of Registered Students: 9 Total Number of Students Evaluated the Course: 4. Overall
Year Term: 8S Course Name: S. HEALTH POLICY Course Number: L874 Course Section: Instructor(s): JONATHAN KLICK Total Number of Registered Students: 9 Total Number of Students Evaluated the Course: 4. Overall
The Geographic Diversity of U.S. Nonmetropolitan Growth Dynamics: A Geographically Weighted Regression Approach
 The Geographic Diversity of U.S. Nonmetropolitan Growth Dynamics: A Geographically Weighted Regression Approach by Mark Partridge, Ohio State University Dan Rickman, Oklahoma State Univeristy Kamar Ali
Modelling Czech and Slovak labour markets: A DSGE model with labour frictions
 Modelling Czech and Slovak labour markets: A DSGE model with labour frictions Daniel Němec Faculty of Economics and Administrations Masaryk University Brno, Czech Republic nemecd@econ.muni.cz ESF MU (Brno)
Freeman (2005) - Graphic Techniques for Exploring Social Network Data
 - Graphic Techniques for Exploring Social Network Data") Freeman (2005) - Graphic Techniques for Exploring Social Network Data The analysis of social network data has two main goals: 1. Identify cohesive groups 2. Identify social positions Moreno (1932) was
Freeman (2005) - Graphic Techniques for Exploring Social Network Data The analysis of social network data has two main goals: 1. Identify cohesive groups 2. Identify social positions Moreno (1932) was
The Use of Random Geographic Cluster Sampling to Survey Pastoralists. Kristen Himelein, World Bank Addis Ababa, Ethiopia January 23, 2013
 The Use of Random Geographic Cluster Sampling to Survey Pastoralists Kristen Himelein, World Bank Addis Ababa, Ethiopia January 23, 2013 Paper This presentation is based on the paper by Kristen Himelein
Urban sprawl will save ecosystems - what happens at the urban fringe?
 Urban sprawl will save ecosystems - what happens at the urban fringe? D. Czamanski Technion Israel Institute of Technology May 2009 Background: Czamanski, D., Benenson, I., Malkinson, D., Marinov, M.,
Public Preference for Ecosystem Services in the Danda River Basin, Nepal: A Choice Experiment Study
 Public Preference for Ecosystem Services in the Danda River Basin, Nepal: A Choice Experiment Study Samrat B. Kunwar a,, Alok K. Bohara a, Jennifer Thacher a a Department of Economics, University of New
Bertrand Model of Price Competition. Advanced Microeconomic Theory 1
 Bertrand Model of Price Competition Advanced Microeconomic Theory 1 ҧ Bertrand Model of Price Competition Consider: An industry with two firms, 1 and 2, selling a homogeneous product Firms face market
PROPOSED MST RESEARCH PROGRAM
 UNWTO Statistics and Tourism Satellite Account Programme COMMITTEE ON STATISTICS AND THE TOURISM SATELLITE ACCOUNT Seventeenth meeting UNWTO Headquarters, Madrid, Spain 24-25 January 2017 PROPOSED MST
Spatial Analysis with ArcGIS Pro STUDENT EDITION
 Spatial Analysis with ArcGIS Pro STUDENT EDITION Copyright 2018 Esri All rights reserved. Course version 2.0. Version release date November 2018. Printed in the United States of America. The information
Methodological issues in the development of accessibility measures to services: challenges and possible solutions in the Canadian context
 Methodological issues in the development of accessibility measures to services: challenges and possible solutions in the Canadian context Alessandro Alasia 1, Frédéric Bédard 2, and Julie Bélanger 1 (1)
Arijit Das Center for Economic Studies and Planning Jawaharlal Nehru University
 Arijit Das Center for Economic Studies and Planning Jawaharlal Nehru University A large number of case studies on collective action in Common property resources. Absence of universal model to identify
SA Geospatial Analysis Platform (GAP) Methodology*, collaborators & data sources
 Methodology*, collaborators & data sources") SA Geospatial Analysis Platform (GAP) Methodology*, collaborators & data sources Mesoframe CSIR, dti, the Presidency & GTZ Demarcation of South Africa into a grid of 50 Km 2 mesozones, nested within important
SA Geospatial Analysis Platform (GAP) Methodology*, collaborators & data sources Mesoframe CSIR, dti, the Presidency & GTZ Demarcation of South Africa into a grid of 50 Km 2 mesozones, nested within important
Use of GIS in road sector analysis
 Use of GIS in road sector analysis Uwe Deichmann, DECRG March 30, 2007 Transport Forum and Learning Week 2007 Transport Measurement Matters Indicators of Performance and Impact Geographic information Using
The New Keynesian Model
 The New Keynesian Model Basic Issues Roberto Chang Rutgers January 2013 R. Chang (Rutgers) New Keynesian Model January 2013 1 / 22 Basic Ingredients of the New Keynesian Paradigm Representative agent paradigm
Ralph s Strategic Disclosure 1
 Ralph s Strategic Disclosure Ralph manages a firm that operates in a duopoly Both Ralph s (privatevalue) production cost and (common-value) inverse demand are uncertain Ralph s (constant marginal) production
By Lillian Ntshwarisang Department of Meteorological Services Phone:
 By Lillian Ntshwarisang Department of Meteorological Services Phone: +267 3612200 Email: lntshwarisang@gov.bw/ lntshwarisang@gmail.com Introduction Mandate of DMS Function of the Department Services to
Application #: TEXT
 TOWN OF FORT MYERS BEACH 2008 PROPOSED COMPREHENSIVE PLAN AMENDMENTS Application #: 2008-13-TEXT Description: Modify the Coastal Management and Future Land Use Elements to reflect the state s new definition
(Behavioral Model and Duality Theory)
") 2018 (Behavioral Model and Duality Theory) fukuda@plan.cv.titech.ac.jp 2 / / (Rational Inattention) 6 max u(x 1,x 2 ) x 1,x 2 s.t. p 1 x 1 + p 2 x 2 = I u = V (p 1,p 2,I) I = M(p 1,p 2, ū) x H j (p 1,p
2018 (Behavioral Model and Duality Theory) fukuda@plan.cv.titech.ac.jp 2 / / (Rational Inattention) 6 max u(x 1,x 2 ) x 1,x 2 s.t. p 1 x 1 + p 2 x 2 = I u = V (p 1,p 2,I) I = M(p 1,p 2, ū) x H j (p 1,p
Lecture 5 Markups and Hedonics. Bronwyn H. Hall Economics 220C, UC Berkeley Spring 2005
 Lecture 5 Markups and Hedonics Bronwyn H. Hall Economics 220C, UC Berkeley Spring 2005 Outline Production function with scale (dis)economies and markups Demand system overview Characteristic space Product
Multivariate Regression Model Results
 Updated: August, 0 Page of Multivariate Regression Model Results 4 5 6 7 8 This exhibit provides the results of the load model forecast discussed in Schedule. Included is the forecast of short term system
Socio-Economic Atlas of Tajikistan. The World Bank THE STATE STATISTICAL COMMITTEE OF THE REPUBLIC OF TAJIKISTAN
 Socio-Economic Atlas of Tajikistan The World Bank THE STATE STATISTICAL COMMITTEE OF THE REPUBLIC OF TAJIKISTAN 1) Background Why there is a need for socio economic atlas? Need for a better understanding
Dummy coding vs effects coding for categorical variables in choice models: clarifications and extensions
 1 2 3 4 5 6 7 8 9 10 11 12 13 14 15 16 17 18 19 20 21 22 23 24 25 26 27 28 29 30 31 32 33 34 35 36 37 38 39 40 41 42 43 44 45 46 47 48 49 50 51 Dummy coding vs effects coding for categorical variables
Data Collection. Lecture Notes in Transportation Systems Engineering. Prof. Tom V. Mathew. 1 Overview 1
 Data Collection Lecture Notes in Transportation Systems Engineering Prof. Tom V. Mathew Contents 1 Overview 1 2 Survey design 2 2.1 Information needed................................. 2 2.2 Study area.....................................
Urban dependence on ecosystem services: a spatially explicit analysis of a megacity riverside settlement
 Urban dependence on ecosystem services: a spatially explicit analysis of a megacity riverside settlement Derek Vollmer PhD Candidate (Prof. Dr. Adrienne Grêt-Regamey, advisor) ETH Zürich/Future Cities
Country Fiche Lithuania
 Country Fiche Lithuania Updated June 2018 1. General information The Lithuanian maritime space is delimited by the Decree of the Government of the Republic of Lithuania of 6 December, 2004, No. 1597 and
Spatial Environmental and Natural Resource Economics
 From the SelectedWorks of Kathy Baylis January 2012 Spatial Environmental and Natural Resource Economics Contact Author Start Your Own SelectedWorks Notify Me of New Work Available at: http://works.bepress.com/kathy_baylis/41
Measuring The Benefits of Air Quality Improvement: A Spatial Hedonic Approach. Chong Won Kim, Tim Phipps, and Luc Anselin
 Measuring The Benefits of Air Quality Improvement: A Spatial Hedonic Approach Chong Won Kim, Tim Phipps, and Luc Anselin Paper prepared for presentation at the AAEA annual meetings, Salt Lake City, August,
USING GEOGRAPHICALLY WEIGHTED CHOICE MODELS TO ACCOUNT FOR SPATIAL HETEROGENEITY OF PREFERENCES
 Working Papers No. 17/2016(208) WIKTOR BUDZIŃSKI DANNY CAMPBELL MIKOŁAJ CZAJKOWSKI URŠKA DEMŠAR NICK HANLEY USING GEOGRAPHICALLY WEIGHTED CHOICE MODELS TO ACCOUNT FOR SPATIAL HETEROGENEITY OF PREFERENCES
Quantifying and Valuing Floodplain Nutrient and Sediment Retention
 Quantifying and Valuing Floodplain Nutrient and Sediment Retention Krissy Hopkins, Dianna Hogan, Emily Pindilli, Greg Noe, Fabiano Franco, and Stephanie Gordon A Community on Ecosystem Services December
The Stated Preference Approach to Environmental Valuation
 The Stated Preference Approach to Environmental Valuation Volume I: Foundations, Initial Development, Statistical Approaches Edited by Richard T. Carson University of California, San Diego, USA ASHGATE
SUPPLEMENT TO MARKET ENTRY COSTS, PRODUCER HETEROGENEITY, AND EXPORT DYNAMICS (Econometrica, Vol. 75, No. 3, May 2007, )
") Econometrica Supplementary Material SUPPLEMENT TO MARKET ENTRY COSTS, PRODUCER HETEROGENEITY, AND EXPORT DYNAMICS (Econometrica, Vol. 75, No. 3, May 2007, 653 710) BY SANGHAMITRA DAS, MARK ROBERTS, AND
Econometrica Supplementary Material SUPPLEMENT TO MARKET ENTRY COSTS, PRODUCER HETEROGENEITY, AND EXPORT DYNAMICS (Econometrica, Vol. 75, No. 3, May 2007, 653 710) BY SANGHAMITRA DAS, MARK ROBERTS, AND
EE214 Early Final Examination: Fall STANFORD UNIVERSITY Department of Electrical Engineering. SAMPLE FINAL EXAMINATION Fall Quarter, 2002
 STANFORD UNIVERSITY Department of Electrical Engineering SAMPLE FINAL EXAMINATION Fall Quarter, 2002 EE214 8 December 2002 CLOSED BOOK; Two std. 8.5 x 11 sheets of notes permitted CAUTION: Useful information
Assessing spatial distribution and variability of destinations in inner-city Sydney from travel diary and smartphone location data
 Assessing spatial distribution and variability of destinations in inner-city Sydney from travel diary and smartphone location data Richard B. Ellison 1, Adrian B. Ellison 1 and Stephen P. Greaves 1 1 Institute
A Dynamic Model of Aggregate Demand and Aggregate Supply
 A Dynamic Model of Aggregate Demand and Aggregate Supply 1 Introduction Theoritical Backround 2 3 4 I Introduction Theoritical Backround The model emphasizes the dynamic nature of economic fluctuations.
3/29/11. Why bother with tools? Incorporating Decision Support Tools into Climate Adaptation Planning. A Simplified Planning Process
 Incorporating Decision Support Tools into Climate Adaptation Planning Why bother with tools? Tools don t eliminate complexity but they can help deal with it" Tools can:"! Help incorporate science into
Ninth ARTNeT Capacity Building Workshop for Trade Research "Trade Flows and Trade Policy Analysis"
 Ninth ARTNeT Capacity Building Workshop for Trade Research "Trade Flows and Trade Policy Analysis" June 2013 Bangkok, Thailand Cosimo Beverelli and Rainer Lanz (World Trade Organization) 1 Selected econometric
I-1. The slope of the bid-price function, P{u}, is - t / H. Use Equation (35) to derive general
 to derive general") ECN 741, Professor Yinger Exercises Part I. Bid Functions and Density Functions I-1. The slope of the bid-price function, P{u}, is - t / H. Use Equation (35) to derive general expression for the slope
ECN 741, Professor Yinger Exercises Part I. Bid Functions and Density Functions I-1. The slope of the bid-price function, P{u}, is - t / H. Use Equation (35) to derive general expression for the slope
Urban Spatial Scenario Design Modelling (USSDM) in Dar es Salaam: Background Information
 in Dar es Salaam: Background Information") Urban Spatial Scenario Design Modelling (USSDM) in Dar es Salaam: Background Information Modelling urban settlement dynamics in Dar es Salaam Revision: 2 (July 2013) Prepared by: Katja Buchta TUM team
Urban Spatial Scenario Design Modelling (USSDM) in Dar es Salaam: Background Information Modelling urban settlement dynamics in Dar es Salaam Revision: 2 (July 2013) Prepared by: Katja Buchta TUM team
Choice Theory. Matthieu de Lapparent
 Choice Theory Matthieu de Lapparent matthieu.delapparent@epfl.ch Transport and Mobility Laboratory, School of Architecture, Civil and Environmental Engineering, Ecole Polytechnique Fédérale de Lausanne
Homework Solutions Applied Logistic Regression
 Homework Solutions Applied Logistic Regression WEEK 6 Exercise 1 From the ICU data, use as the outcome variable vital status (STA) and CPR prior to ICU admission (CPR) as a covariate. (a) Demonstrate that
Probit Estimation in gretl
 Probit Estimation in gretl Quantitative Microeconomics R. Mora Department of Economics Universidad Carlos III de Madrid Outline Introduction 1 Introduction 2 3 The Probit Model and ML Estimation The Probit