Design of Experiments (DOE) Instructor: Thomas Oesterle
|
|
|
- Cuthbert Ward
- 5 years ago
- Views:
Transcription
1 1 Design of Experiments (DOE) Instructor: Thomas Oesterle

2 2 Instructor Thomas Oesterle

3 3 Agenda Introduction Planning the Experiment Selecting a Design Matrix Analyzing the Data Modeling the Data, Optimizing Input Exercises
4 Minitab Analysis Significance 4
5 5 How to look at DOE data Big Picture (provides a general view of the data, to find the obvious, outliers, transcription errors etc) Histograms Scatter Plots DOE Output Main Effects & Interactions ANOVA P-Value and R-Sq. Residuals


6 Scatterplot 6


7 Scatterplot 7
8 8 ANOVA Analysis (R-Sq) R-Sq a measure of the strength of our model R-Sq.: 97.32% of the variation in our response is explained by the model R-Sq=f(sample size, model used) The closer to 100% the better Minimum R-Sq.: 80% Many processes desire 90% R-Sq(adj): takes terms vs sample size into consideration Launsby Consulting
9 9 ANOVA Analysis P(2tail) P: Probability that a term does not belong into the regression model P-value: probability that two means are identical H 0 : Mean 1 = Mean 2 If p is low, the Null must go! If p < α -> include into model Typically, α = 0.05 Launsby Consulting P < > Significant
10 10 Definition of Significance Layman s (or practical significance): Factor is a big deal relative to response in question Statistical significance: change made in response overwhelms the noise in experiment (signal is at least 2 or 3 times as large as the noise) Note: Practical significance and statistical significance are different
11 11 Significance of Standard Deviation Rule of Thumb: Use factor with steepest slope 1) Calculate standard deviation for low setting StDev(L) 2) Calculate standard deviation for high setting StDev(H) 3) If S(H) > 3 x S(L) -> good candidate to reduce variation
 2(+) 3(-) 5(+) (B) (C) Factors 2(-) 4(+) (D) All are statistically significant Variable Coefficient Std Error 95% CI Tolerance T P(2 Tail) Constant 17.")
12 12 Practical versus Statistical Significance b u m p Main Effects If the difference is not greater than 4, it is not of practical importance to the engineer h t A(-) (A) B(+) Need both before you get very excited 1(-) 2(+) 3(-) 5(+) (B) (C) Factors 2(-) 4(+) (D) All are statistically significant Variable Coefficient Std Error 95% CI Tolerance T P(2 Tail) Constant ± tech(a):a ± tech(a):b ± (B) ± (C) ± (D) ± Not a big deal

13 13 Statistical Significance in Comparison Source DF SS MS F p-value A B A*B Residual Error Total 11 Statistically Significant A: 89% Practically Significant B: 5% Practically NOT significant Res. Error: 4% A*B: 2%
14 14 Practical and Statistical Significance Statistically Significant? no Statistically Significant? yes Practically significant? No Practically significant? yes Ignore in future Noisy response, investigate further Do cost/benefit analysis Excellent

15 15 One Factor Analysis (ANOVA) Problem Statement A circuit board is related to high field failure. After careful analysis the primary failure was attributed to low adhesion of the circuitry. The subject matter expert hypothesized that the problem is related to the type of solder paste used during production. Three types of paste are used; Type A, Type B, and Type C. The team decides to evaluate which paste is best. They randomly select 9 circuit boards and randomly assign them to the three paste types. After curing the samples they subjected the boards to a tensile test to quantify the adhesion of the different paste types.


16 16 Prepare Data for Analysis 1 2 3


17 17 Analysis 1 2 3
18 ANOVA Result 18
19 19 Residual Error (PCB ANOVA) Check Store Residuals

20 20 Examine Data Further Residuals

21 21 Are Residual randomly distributed? Fact: Residuals should be normally distributed around 0. Test: STAT->Basic Statistics-> Normality Test; Select C6. Evaluate Plot
")
22 Understanding R-Sq (Shaft DIA) 22
23 23 Understanding ANOVA, Residual Errors Residual Example Run Time Pressure L1 L2 L3 Average (L) Replicates: 3 Prediction Residual Base Runs: α: Levels (Time) Levels (Pressure) Effect Grand Mean Linear Model ANOVA Analysis Term Coefficient SS (Sum of Squares) DF MS (Mean Square) F p Constant Main Effects Pressure Pressure Time Time Interaction Interaction Error Total Time -1 Pressure -1 5 Interaction 1 Length (Predict)
 During Analysis Selection,")
24 24 Residual Analysis (Alternate Method) During Analysis Selection, check
25 25 Residual Analysis Normal Even Distribution No Trending

26 26 Alternative Method Select Fits and Residuals below Storage during Analyze Design Process

27 Fits and Residuals 27


28 Analyze Normality of Residuals 28
29 Normality Check 29
30 30
 + Lack of Fit (Terms removed) Causes for MSE Bias (Pure Error) 1) (-) Repeats are taken and treated in Minitab as Replicates")
31 31 Avoiding MS Bias Error in an experiment is natural variation for replicates. Not sensitive enough? Too sensitive? Minitab ANOVA refers to this error as MSE MSE = Pure Error (replication) + Lack of Fit (Terms removed) Causes for MSE Bias (Pure Error) 1) (-) Repeats are taken and treated in Minitab as Replicates (measured variation smaller than actual) 2) (+) One replicate is run under different conditions and blocking feature is not used
32 32 Avoiding MS Bias Not sensitive enough? Causes for Lack of Fit 1) Terms are removed incorrectly from the model Too sensitive?

33 Indicators of MSE Bias 33

34 34 Remedies for MSE Bias Reference (last 4 Slides) Article from James A. Colton in Scientific Computing, Avoiding Mean Square Error Bias in Designed Experiments.
35 35
36 36 Confidence Levels Establish confidence level around mean Use Microsoft Excel Option 1: Standard Deviation of your process is known, use = confidence.norm(alpha, stddev, n) Option 2: Overall Standard Deviation is not known: Use = confidence.t(alpha, stddev, n) Alpha = 0.05 for 95% confidence level (Commands shown for Microsoft Excel 2010)
37 37 Confidence Levels Establish confidence level around mean: If the value as predicted by the model is within the mean +/ calculated confidence of the confirmation run, the model is good!
38 38 Formula If you do not have Microsoft Excel 2010, use the following equation: CI = mean +/- t * s/ n
39 39 T-Table for 95% Confidence Limit Degrees of Freedom t-value for 2-Sided 95% Confidence Limits on Mean t-value for 1-Sided 95% Confidence Limit On Mean df=n-1 t(n-1) t(n-1) Excerpted from Table II The t- Distribution, from Introductory Statistics, John A. Ingram, Cummings Publishing Company, Menlo Park, Ca (1974).
40 40 Example You completed a confirmation run with 20 samples. The sample mean is 40 cm. Standard deviation is 0.9 cm. 1)Calculate the confidence interval for alpha of 5% CI = Mean +/ x 0.9 / 20 = CI = 40 cm +/ cm
41 41 Why you may not confirm Data Transcription Error Experimental Deviation Unreliable / Incapable Measurement System Large Variation (MSE Bias) Missed Interactions Incorrect Interpretation of Interactions Inadequate Model Something along the way changed
42 42
43 43 Response Optimizer Example Multiple Response Example Suppose we are manufacturing bike tires. We have 3 responses we would like to optimize. They are tensile strength, hardness, and rolling resistance. You will optimize the factor levels using desirability function in Minitab. Factors are: (C) Mesh Size 40, 80 (B) % Ground Rubber: 3, 10 (A) Binder Amount: 5, 25 Specification: 1) Tensile Strength: less than 1390 unacceptable, 1390 to 1500 increasingly good, 1500 or greater perfect (Relative Importance: 10) 2) Hardness: 50 +/- 1 (Relative Importance: 10) 3) Rolling Resistance: Less than 20 is ideal; 20 to 30 is decreasingly acceptable; Greater than 30 is unacceptable (Relative Importance: 5)
44 44 Exercise 1) Generate a Full Factorial Design a. 2 Levels, 3 Factors 2) Open Worksheet Multiple Response Optimizer a. Analyze designs and generate response surface b. Generate
45 Tensile Strength 45

46 Hardness 46

47 Resistance 47

48 48 Response Optimizer Mintab Sequence


49 Minitab Set-Up 49

50 50 Response Optimizer Best fit when Composite Desirability is at 1
51 51 Response Optimizer Calculation % Tes. Tes. AVE DES AVE DES Ave DES Comp. Binder Ground Mesh Str. Str. Tensile Tensile Hardn. Hardn. Hardn. Hardn. Res. Res. Res. Res DES Refer to Engineering Today s Designed Experiments for equation on D
52 52
53 Airbag System 53
54 54 Airbag System Gas Weight Orifice diameter Propellant type and propellant weight Our task is to characterize a new engineering concept related to the deployment of an automotive air bag system. The subsystem consists of a steel canister filled with gas and charge. After the canister is filled, the orifice is welded closed with a steel sphere welded in place. The engineering team believes that the key variables are orifice diameter, gas weight, propellant weight, and type of charge.
55 55 Air Bag System Requirements Factors Orifice diameter Levels.086,.140 Gas Weight 12.8, 13.8 Prop. Type 23b, 35b Prop. Wt..9, 1.1 Response Pressure Max pressure First pre 2,3 T90 8,9,10 First Pressure Time Time to 90 % max Max pre 110,120,130 Bag fill and deflation is over in approximately.05 sec


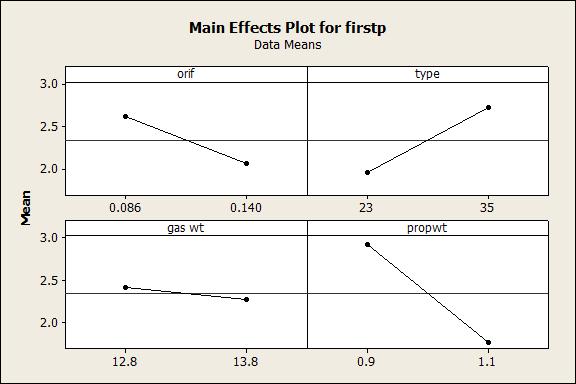
56 Main Effects 56
57 57
58 58 References and Further Reading Reference 1: Keki R. Bhote (2001) The Ultimate Six Sigma, Beyond Quality Excellence to Total Business Excellence, AMACOM Reference 2: Robert Launsby, Jayme Lahey (2006) Engineering Today s Designed Experiments, Launsby Consulting Further Reading Stephen R. Schmidt, Robert Launsby, Understanding Industrial Designed Experiments
Six Sigma Black Belt Study Guides
 Six Sigma Black Belt Study Guides 1 www.pmtutor.org Powered by POeT Solvers Limited. Analyze Correlation and Regression Analysis 2 www.pmtutor.org Powered by POeT Solvers Limited. Variables and relationships
Business Statistics. Lecture 10: Course Review
 Business Statistics Lecture 10: Course Review 1 Descriptive Statistics for Continuous Data Numerical Summaries Location: mean, median Spread or variability: variance, standard deviation, range, percentiles,
Inferences for Regression
 Inferences for Regression An Example: Body Fat and Waist Size Looking at the relationship between % body fat and waist size (in inches). Here is a scatterplot of our data set: Remembering Regression In
Inference for Regression Inference about the Regression Model and Using the Regression Line
 Inference for Regression Inference about the Regression Model and Using the Regression Line PBS Chapter 10.1 and 10.2 2009 W.H. Freeman and Company Objectives (PBS Chapter 10.1 and 10.2) Inference about
Correlation and Regression
 Correlation and Regression Dr. Bob Gee Dean Scott Bonney Professor William G. Journigan American Meridian University 1 Learning Objectives Upon successful completion of this module, the student should
Analysis of Covariance. The following example illustrates a case where the covariate is affected by the treatments.
 Analysis of Covariance In some experiments, the experimental units (subjects) are nonhomogeneous or there is variation in the experimental conditions that are not due to the treatments. For example, a
1 Introduction to Minitab
 1 Introduction to Minitab Minitab is a statistical analysis software package. The software is freely available to all students and is downloadable through the Technology Tab at my.calpoly.edu. When you
What If There Are More Than. Two Factor Levels?
 What If There Are More Than Chapter 3 Two Factor Levels? Comparing more that two factor levels the analysis of variance ANOVA decomposition of total variability Statistical testing & analysis Checking
ANOVA: Analysis of Variation
 ANOVA: Analysis of Variation The basic ANOVA situation Two variables: 1 Categorical, 1 Quantitative Main Question: Do the (means of) the quantitative variables depend on which group (given by categorical
INFERENCE FOR REGRESSION
 CHAPTER 3 INFERENCE FOR REGRESSION OVERVIEW In Chapter 5 of the textbook, we first encountered regression. The assumptions that describe the regression model we use in this chapter are the following. We
Inference for Regression Simple Linear Regression
 Inference for Regression Simple Linear Regression IPS Chapter 10.1 2009 W.H. Freeman and Company Objectives (IPS Chapter 10.1) Simple linear regression p Statistical model for linear regression p Estimating
Confidence Interval for the mean response
 Week 3: Prediction and Confidence Intervals at specified x. Testing lack of fit with replicates at some x's. Inference for the correlation. Introduction to regression with several explanatory variables.
Stats Review Chapter 14. Mary Stangler Center for Academic Success Revised 8/16
 Stats Review Chapter 14 Revised 8/16 Note: This review is meant to highlight basic concepts from the course. It does not cover all concepts presented by your instructor. Refer back to your notes, unit
Correlation & Simple Regression
 Chapter 11 Correlation & Simple Regression The previous chapter dealt with inference for two categorical variables. In this chapter, we would like to examine the relationship between two quantitative variables.
Business Statistics. Lecture 5: Confidence Intervals
 Business Statistics Lecture 5: Confidence Intervals Goals for this Lecture Confidence intervals The t distribution 2 Welcome to Interval Estimation! Moments Mean 815.0340 Std Dev 0.8923 Std Error Mean
Residual Analysis for two-way ANOVA The twoway model with K replicates, including interaction,
 Residual Analysis for two-way ANOVA The twoway model with K replicates, including interaction, is Y ijk = µ ij + ɛ ijk = µ + α i + β j + γ ij + ɛ ijk with i = 1,..., I, j = 1,..., J, k = 1,..., K. In carrying
Inference for the Regression Coefficient
 Inference for the Regression Coefficient Recall, b 0 and b 1 are the estimates of the slope β 1 and intercept β 0 of population regression line. We can shows that b 0 and b 1 are the unbiased estimates
Business Statistics. Chapter 14 Introduction to Linear Regression and Correlation Analysis QMIS 220. Dr. Mohammad Zainal
 Department of Quantitative Methods & Information Systems Business Statistics Chapter 14 Introduction to Linear Regression and Correlation Analysis QMIS 220 Dr. Mohammad Zainal Chapter Goals After completing
SMAM 314 Computer Assignment 5 due Nov 8,2012 Data Set 1. For each of the following data sets use Minitab to 1. Make a scatterplot.
 SMAM 314 Computer Assignment 5 due Nov 8,2012 Data Set 1. For each of the following data sets use Minitab to 1. Make a scatterplot. 2. Fit the linear regression line. Regression Analysis: y versus x y
Chapter 3 Multiple Regression Complete Example
 Department of Quantitative Methods & Information Systems ECON 504 Chapter 3 Multiple Regression Complete Example Spring 2013 Dr. Mohammad Zainal Review Goals After completing this lecture, you should be
23. Inference for regression
 23. Inference for regression The Practice of Statistics in the Life Sciences Third Edition 2014 W. H. Freeman and Company Objectives (PSLS Chapter 23) Inference for regression The regression model Confidence
W&M CSCI 688: Design of Experiments Homework 2. Megan Rose Bryant
 W&M CSCI 688: Design of Experiments Homework 2 Megan Rose Bryant September 25, 201 3.5 The tensile strength of Portland cement is being studied. Four different mixing techniques can be used economically.
" M A #M B. Standard deviation of the population (Greek lowercase letter sigma) σ 2
 σ 2") Notation and Equations for Final Exam Symbol Definition X The variable we measure in a scientific study n The size of the sample N The size of the population M The mean of the sample µ The mean of the
Notation and Equations for Final Exam Symbol Definition X The variable we measure in a scientific study n The size of the sample N The size of the population M The mean of the sample µ The mean of the
df=degrees of freedom = n - 1
 One sample t-test test of the mean Assumptions: Independent, random samples Approximately normal distribution (from intro class: σ is unknown, need to calculate and use s (sample standard deviation)) Hypotheses:
SMA 6304 / MIT / MIT Manufacturing Systems. Lecture 10: Data and Regression Analysis. Lecturer: Prof. Duane S. Boning
 SMA 6304 / MIT 2.853 / MIT 2.854 Manufacturing Systems Lecture 10: Data and Regression Analysis Lecturer: Prof. Duane S. Boning 1 Agenda 1. Comparison of Treatments (One Variable) Analysis of Variance
Econometrics. 4) Statistical inference
 Statistical inference") 30C00200 Econometrics 4) Statistical inference Timo Kuosmanen Professor, Ph.D. http://nomepre.net/index.php/timokuosmanen Today s topics Confidence intervals of parameter estimates Student s t-distribution
30C00200 Econometrics 4) Statistical inference Timo Kuosmanen Professor, Ph.D. http://nomepre.net/index.php/timokuosmanen Today s topics Confidence intervals of parameter estimates Student s t-distribution
Lecture 18: Simple Linear Regression
 Lecture 18: Simple Linear Regression BIOS 553 Department of Biostatistics University of Michigan Fall 2004 The Correlation Coefficient: r The correlation coefficient (r) is a number that measures the strength
Disadvantages of using many pooled t procedures. The sampling distribution of the sample means. The variability between the sample means
 Stat 529 (Winter 2011) Analysis of Variance (ANOVA) Reading: Sections 5.1 5.3. Introduction and notation Birthweight example Disadvantages of using many pooled t procedures The analysis of variance procedure
4.1. Introduction: Comparing Means
 4. Analysis of Variance (ANOVA) 4.1. Introduction: Comparing Means Consider the problem of testing H 0 : µ 1 = µ 2 against H 1 : µ 1 µ 2 in two independent samples of two different populations of possibly
Statistics for Managers using Microsoft Excel 6 th Edition
 Statistics for Managers using Microsoft Excel 6 th Edition Chapter 13 Simple Linear Regression 13-1 Learning Objectives In this chapter, you learn: How to use regression analysis to predict the value of
Estimating σ 2. We can do simple prediction of Y and estimation of the mean of Y at any value of X.
 Estimating σ 2 We can do simple prediction of Y and estimation of the mean of Y at any value of X. To perform inferences about our regression line, we must estimate σ 2, the variance of the error term.
Measurement Systems Analysis January 2015 Meeting. Steve Cox
 Measurement Systems Analysis January 2015 Meeting Steve Cox Steve Cox Currently retired 33 Years with 3M Mostly quality related: 37 total in Quality ASQ Certified Quality Engineer Certified Black Belt
DESAIN EKSPERIMEN BLOCKING FACTORS. Semester Genap 2017/2018 Jurusan Teknik Industri Universitas Brawijaya
 DESAIN EKSPERIMEN BLOCKING FACTORS Semester Genap Jurusan Teknik Industri Universitas Brawijaya Outline The Randomized Complete Block Design The Latin Square Design The Graeco-Latin Square Design Balanced
The Model Building Process Part I: Checking Model Assumptions Best Practice
 The Model Building Process Part I: Checking Model Assumptions Best Practice Authored by: Sarah Burke, PhD 31 July 2017 The goal of the STAT T&E COE is to assist in developing rigorous, defensible test
Tables Table A Table B Table C Table D Table E 675
 BMTables.indd Page 675 11/15/11 4:25:16 PM user-s163 Tables Table A Standard Normal Probabilities Table B Random Digits Table C t Distribution Critical Values Table D Chi-square Distribution Critical Values
Ch 11- One Way Analysis of Variance
 Multiple Choice Questions Ch 11- One Way Analysis of Variance Use the following to solve questions 1 &. Suppose n = 8 and there are 4 groups, how many between groups (samples) degrees of freedom are there?
y response variable x 1, x 2,, x k -- a set of explanatory variables
 11. Multiple Regression and Correlation y response variable x 1, x 2,, x k -- a set of explanatory variables In this chapter, all variables are assumed to be quantitative. Chapters 12-14 show how to incorporate
The Model Building Process Part I: Checking Model Assumptions Best Practice (Version 1.1)
") The Model Building Process Part I: Checking Model Assumptions Best Practice (Version 1.1) Authored by: Sarah Burke, PhD Version 1: 31 July 2017 Version 1.1: 24 October 2017 The goal of the STAT T&E COE
The Model Building Process Part I: Checking Model Assumptions Best Practice (Version 1.1) Authored by: Sarah Burke, PhD Version 1: 31 July 2017 Version 1.1: 24 October 2017 The goal of the STAT T&E COE
Basic Business Statistics 6 th Edition
 Basic Business Statistics 6 th Edition Chapter 12 Simple Linear Regression Learning Objectives In this chapter, you learn: How to use regression analysis to predict the value of a dependent variable based
The simple linear regression model discussed in Chapter 13 was written as
 1519T_c14 03/27/2006 07:28 AM Page 614 Chapter Jose Luis Pelaez Inc/Blend Images/Getty Images, Inc./Getty Images, Inc. 14 Multiple Regression 14.1 Multiple Regression Analysis 14.2 Assumptions of the Multiple
Exam details. Final Review Session. Things to Review
 Exam details Final Review Session Short answer, similar to book problems Formulae and tables will be given You CAN use a calculator Date and Time: Dec. 7, 006, 1-1:30 pm Location: Osborne Centre, Unit
This gives us an upper and lower bound that capture our population mean.
 Confidence Intervals Critical Values Practice Problems 1 Estimation 1.1 Confidence Intervals Definition 1.1 Margin of error. The margin of error of a distribution is the amount of error we predict when
Basic Business Statistics, 10/e
 Chapter 4 4- Basic Business Statistics th Edition Chapter 4 Introduction to Multiple Regression Basic Business Statistics, e 9 Prentice-Hall, Inc. Chap 4- Learning Objectives In this chapter, you learn:
Unit 10: Simple Linear Regression and Correlation
 Unit 10: Simple Linear Regression and Correlation Statistics 571: Statistical Methods Ramón V. León 6/28/2004 Unit 10 - Stat 571 - Ramón V. León 1 Introductory Remarks Regression analysis is a method for
Multiple Regression Methods
 Chapter 1: Multiple Regression Methods Hildebrand, Ott and Gray Basic Statistical Ideas for Managers Second Edition 1 Learning Objectives for Ch. 1 The Multiple Linear Regression Model How to interpret
Sociology 6Z03 Review II
 Sociology 6Z03 Review II John Fox McMaster University Fall 2016 John Fox (McMaster University) Sociology 6Z03 Review II Fall 2016 1 / 35 Outline: Review II Probability Part I Sampling Distributions Probability
Warm-up Using the given data Create a scatterplot Find the regression line
 Time at the lunch table Caloric intake 21.4 472 30.8 498 37.7 335 32.8 423 39.5 437 22.8 508 34.1 431 33.9 479 43.8 454 42.4 450 43.1 410 29.2 504 31.3 437 28.6 489 32.9 436 30.6 480 35.1 439 33.0 444
The Flight of the Space Shuttle Challenger
 The Flight of the Space Shuttle Challenger On January 28, 1986, the space shuttle Challenger took off on the 25 th flight in NASA s space shuttle program. Less than 2 minutes into the flight, the spacecraft
A discussion on multiple regression models
 A discussion on multiple regression models In our previous discussion of simple linear regression, we focused on a model in which one independent or explanatory variable X was used to predict the value
Ch 13 & 14 - Regression Analysis
 Ch 3 & 4 - Regression Analysis Simple Regression Model I. Multiple Choice:. A simple regression is a regression model that contains a. only one independent variable b. only one dependent variable c. more
LAB 5 INSTRUCTIONS LINEAR REGRESSION AND CORRELATION
 LAB 5 INSTRUCTIONS LINEAR REGRESSION AND CORRELATION In this lab you will learn how to use Excel to display the relationship between two quantitative variables, measure the strength and direction of the
Mathematical Notation Math Introduction to Applied Statistics
 Mathematical Notation Math 113 - Introduction to Applied Statistics Name : Use Word or WordPerfect to recreate the following documents. Each article is worth 10 points and should be emailed to the instructor
28. SIMPLE LINEAR REGRESSION III
 28. SIMPLE LINEAR REGRESSION III Fitted Values and Residuals To each observed x i, there corresponds a y-value on the fitted line, y = βˆ + βˆ x. The are called fitted values. ŷ i They are the values of
1. Review of Lecture level factors Homework A 2 3 experiment in 16 runs with no replicates
 Lecture 3.1 1. Review of Lecture 2.2 2-level factors Homework 2.2.1 2. A 2 3 experiment 3. 2 4 in 16 runs with no replicates Lecture 3.1 1 2 k Factorial Designs Designs with k factors each at 2 levels
Histogram of Residuals. Residual Normal Probability Plot. Reg. Analysis Check Model Utility. (con t) Check Model Utility. Inference.
 Check Model Utility. Inference.") Steps for Regression Simple Linear Regression Make a Scatter plot Does it make sense to plot a line? Check Residual Plot (Residuals vs. X) Are there any patterns? Check Histogram of Residuals Is it Normal?
Steps for Regression Simple Linear Regression Make a Scatter plot Does it make sense to plot a line? Check Residual Plot (Residuals vs. X) Are there any patterns? Check Histogram of Residuals Is it Normal?
Simple Linear Regression. Steps for Regression. Example. Make a Scatter plot. Check Residual Plot (Residuals vs. X)
") Simple Linear Regression 1 Steps for Regression Make a Scatter plot Does it make sense to plot a line? Check Residual Plot (Residuals vs. X) Are there any patterns? Check Histogram of Residuals Is it Normal?
Simple Linear Regression 1 Steps for Regression Make a Scatter plot Does it make sense to plot a line? Check Residual Plot (Residuals vs. X) Are there any patterns? Check Histogram of Residuals Is it Normal?
STA 108 Applied Linear Models: Regression Analysis Spring Solution for Homework #6
 STA 8 Applied Linear Models: Regression Analysis Spring 011 Solution for Homework #6 6. a) = 11 1 31 41 51 1 3 4 5 11 1 31 41 51 β = β1 β β 3 b) = 1 1 1 1 1 11 1 31 41 51 1 3 4 5 β = β 0 β1 β 6.15 a) Stem-and-leaf
(ii) Scan your answer sheets INTO ONE FILE only, and submit it in the drop-box.
 Scan your answer sheets INTO ONE FILE only, and submit it in the drop-box.") FINAL EXAM ** Two different ways to submit your answer sheet (i) Use MS-Word and place it in a drop-box. (ii) Scan your answer sheets INTO ONE FILE only, and submit it in the drop-box. Deadline: December
FINAL EXAM ** Two different ways to submit your answer sheet (i) Use MS-Word and place it in a drop-box. (ii) Scan your answer sheets INTO ONE FILE only, and submit it in the drop-box. Deadline: December
LEARNING WITH MINITAB Chapter 12 SESSION FIVE: DESIGNING AN EXPERIMENT
 LEARNING WITH MINITAB Chapter 12 SESSION FIVE: DESIGNING AN EXPERIMENT Laura M Williams, RN, CLNC, MSN MOREHEAD STATE UNIVERSITY IET603: STATISTICAL QUALITY ASSURANCE IN SCIENCE AND TECHNOLOGY DR. AHMAD
Chapter 16. Simple Linear Regression and Correlation
 Chapter 16 Simple Linear Regression and Correlation 16.1 Regression Analysis Our problem objective is to analyze the relationship between interval variables; regression analysis is the first tool we will
Chapter 14 Student Lecture Notes 14-1
 Chapter 14 Student Lecture Notes 14-1 Business Statistics: A Decision-Making Approach 6 th Edition Chapter 14 Multiple Regression Analysis and Model Building Chap 14-1 Chapter Goals After completing this
3. Factorial Experiments (Ch.5. Factorial Experiments)
") 3. Factorial Experiments (Ch.5. Factorial Experiments) Hae-Jin Choi School of Mechanical Engineering, Chung-Ang University DOE and Optimization 1 Introduction to Factorials Most experiments for process
3. Factorial Experiments (Ch.5. Factorial Experiments) Hae-Jin Choi School of Mechanical Engineering, Chung-Ang University DOE and Optimization 1 Introduction to Factorials Most experiments for process
STA 101 Final Review
 STA 101 Final Review Statistics 101 Thomas Leininger June 24, 2013 Announcements All work (besides projects) should be returned to you and should be entered on Sakai. Office Hour: 2 3pm today (Old Chem
Multiple Regression Examples
 Multiple Regression Examples Example: Tree data. we have seen that a simple linear regression of usable volume on diameter at chest height is not suitable, but that a quadratic model y = β 0 + β 1 x +
16.3 One-Way ANOVA: The Procedure
 16.3 One-Way ANOVA: The Procedure Tom Lewis Fall Term 2009 Tom Lewis () 16.3 One-Way ANOVA: The Procedure Fall Term 2009 1 / 10 Outline 1 The background 2 Computing formulas 3 The ANOVA Identity 4 Tom
Econ 3790: Business and Economics Statistics. Instructor: Yogesh Uppal
 Econ 3790: Business and Economics Statistics Instructor: Yogesh Uppal yuppal@ysu.edu Sampling Distribution of b 1 Expected value of b 1 : Variance of b 1 : E(b 1 ) = 1 Var(b 1 ) = σ 2 /SS x Estimate of
1 Introduction to One-way ANOVA
 Review Source: Chapter 10 - Analysis of Variance (ANOVA). Example Data Source: Example problem 10.1 (dataset: exp10-1.mtw) Link to Data: http://www.auburn.edu/~carpedm/courses/stat3610/textbookdata/minitab/
Multiple Regression. Inference for Multiple Regression and A Case Study. IPS Chapters 11.1 and W.H. Freeman and Company
 Multiple Regression Inference for Multiple Regression and A Case Study IPS Chapters 11.1 and 11.2 2009 W.H. Freeman and Company Objectives (IPS Chapters 11.1 and 11.2) Multiple regression Data for multiple
MBA 605, Business Analytics Donald D. Conant, Ph.D. Master of Business Administration
 t-distribution Summary MBA 605, Business Analytics Donald D. Conant, Ph.D. Types of t-tests There are several types of t-test. In this course we discuss three. The single-sample t-test The two-sample t-test
Lecture 14. Analysis of Variance * Correlation and Regression. The McGraw-Hill Companies, Inc., 2000
 Lecture 14 Analysis of Variance * Correlation and Regression Outline Analysis of Variance (ANOVA) 11-1 Introduction 11-2 Scatter Plots 11-3 Correlation 11-4 Regression Outline 11-5 Coefficient of Determination
Lecture 14. Outline. Outline. Analysis of Variance * Correlation and Regression Analysis of Variance (ANOVA)
") Outline Lecture 14 Analysis of Variance * Correlation and Regression Analysis of Variance (ANOVA) 11-1 Introduction 11- Scatter Plots 11-3 Correlation 11-4 Regression Outline 11-5 Coefficient of Determination
Outline Lecture 14 Analysis of Variance * Correlation and Regression Analysis of Variance (ANOVA) 11-1 Introduction 11- Scatter Plots 11-3 Correlation 11-4 Regression Outline 11-5 Coefficient of Determination
INTRODUCTION TO DESIGN AND ANALYSIS OF EXPERIMENTS
 GEORGE W. COBB Mount Holyoke College INTRODUCTION TO DESIGN AND ANALYSIS OF EXPERIMENTS Springer CONTENTS To the Instructor Sample Exam Questions To the Student Acknowledgments xv xxi xxvii xxix 1. INTRODUCTION
ASSIGNMENT 3 SIMPLE LINEAR REGRESSION. Old Faithful
 ASSIGNMENT 3 SIMPLE LINEAR REGRESSION In the simple linear regression model, the mean of a response variable is a linear function of an explanatory variable. The model and associated inferential tools
STAT 350 Final (new Material) Review Problems Key Spring 2016
 Review Problems Key Spring 2016") 1. The editor of a statistics textbook would like to plan for the next edition. A key variable is the number of pages that will be in the final version. Text files are prepared by the authors using LaTeX,
1. The editor of a statistics textbook would like to plan for the next edition. A key variable is the number of pages that will be in the final version. Text files are prepared by the authors using LaTeX,
Design of Engineering Experiments Part 2 Basic Statistical Concepts Simple comparative experiments
 Design of Engineering Experiments Part 2 Basic Statistical Concepts Simple comparative experiments The hypothesis testing framework The two-sample t-test Checking assumptions, validity Comparing more that
10 Model Checking and Regression Diagnostics
 10 Model Checking and Regression Diagnostics The simple linear regression model is usually written as i = β 0 + β 1 i + ɛ i where the ɛ i s are independent normal random variables with mean 0 and variance
Statistics For Economics & Business
 Statistics For Economics & Business Analysis of Variance In this chapter, you learn: Learning Objectives The basic concepts of experimental design How to use one-way analysis of variance to test for differences
Chapter 1. Linear Regression with One Predictor Variable
 Chapter 1. Linear Regression with One Predictor Variable 1.1 Statistical Relation Between Two Variables To motivate statistical relationships, let us consider a mathematical relation between two mathematical
Week 12 Hypothesis Testing, Part II Comparing Two Populations
 Week 12 Hypothesis Testing, Part II Week 12 Hypothesis Testing, Part II Week 12 Objectives 1 The principle of Analysis of Variance is introduced and used to derive the F-test for testing the model utility
1 Use of indicator random variables. (Chapter 8)
") 1 Use of indicator random variables. (Chapter 8) let I(A) = 1 if the event A occurs, and I(A) = 0 otherwise. I(A) is referred to as the indicator of the event A. The notation I A is often used. 1 2 Fitting
1 Use of indicator random variables. (Chapter 8) let I(A) = 1 if the event A occurs, and I(A) = 0 otherwise. I(A) is referred to as the indicator of the event A. The notation I A is often used. 1 2 Fitting
Multiple Regression: Inference
 Multiple Regression: Inference The t-test: is ˆ j big and precise enough? We test the null hypothesis: H 0 : β j =0; i.e. test that x j has no effect on y once the other explanatory variables are controlled
SMAM 314 Practice Final Examination Winter 2003
 SMAM 314 Practice Final Examination Winter 2003 You may use your textbook, one page of notes and a calculator. Please hand in the notes with your exam. 1. Mark the following statements True T or False
UNIVERSITY OF TORONTO SCARBOROUGH Department of Computer and Mathematical Sciences Midterm Test, October 2013
 UNIVERSITY OF TORONTO SCARBOROUGH Department of Computer and Mathematical Sciences Midterm Test, October 2013 STAC67H3 Regression Analysis Duration: One hour and fifty minutes Last Name: First Name: Student
Chapter 6 The 2 k Factorial Design Solutions
 Solutions from Montgomery, D. C. (004) Design and Analysis of Experiments, Wiley, NY Chapter 6 The k Factorial Design Solutions 6.. A router is used to cut locating notches on a printed circuit board.
Homework 2: Simple Linear Regression
 STAT 4385 Applied Regression Analysis Homework : Simple Linear Regression (Simple Linear Regression) Thirty (n = 30) College graduates who have recently entered the job market. For each student, the CGPA
Regression. Marc H. Mehlman University of New Haven
 Regression Marc H. Mehlman marcmehlman@yahoo.com University of New Haven the statistician knows that in nature there never was a normal distribution, there never was a straight line, yet with normal and
1-Way ANOVA MATH 143. Spring Department of Mathematics and Statistics Calvin College
 1-Way ANOVA MATH 143 Department of Mathematics and Statistics Calvin College Spring 2010 The basic ANOVA situation Two variables: 1 Categorical, 1 Quantitative Main Question: Do the (means of) the quantitative
Correlation and the Analysis of Variance Approach to Simple Linear Regression
 Correlation and the Analysis of Variance Approach to Simple Linear Regression Biometry 755 Spring 2009 Correlation and the Analysis of Variance Approach to Simple Linear Regression p. 1/35 Correlation
Correlation Analysis
 Simple Regression Correlation Analysis Correlation analysis is used to measure strength of the association (linear relationship) between two variables Correlation is only concerned with strength of the
ANOVA (Analysis of Variance) output RLS 11/20/2016
 output RLS 11/20/2016") ANOVA (Analysis of Variance) output RLS 11/20/2016 1. Analysis of Variance (ANOVA) The goal of ANOVA is to see if the variation in the data can explain enough to see if there are differences in the means.
ANOVA (Analysis of Variance) output RLS 11/20/2016 1. Analysis of Variance (ANOVA) The goal of ANOVA is to see if the variation in the data can explain enough to see if there are differences in the means.
Analysis of Covariance (ANCOVA) with Two Groups
 with Two Groups") Chapter 226 Analysis of Covariance (ANCOVA) with Two Groups Introduction This procedure performs analysis of covariance (ANCOVA) for a grouping variable with 2 groups and one covariate variable. This procedure
Chapter 226 Analysis of Covariance (ANCOVA) with Two Groups Introduction This procedure performs analysis of covariance (ANCOVA) for a grouping variable with 2 groups and one covariate variable. This procedure
Regression Analysis and Forecasting Prof. Shalabh Department of Mathematics and Statistics Indian Institute of Technology-Kanpur
 Regression Analysis and Forecasting Prof. Shalabh Department of Mathematics and Statistics Indian Institute of Technology-Kanpur Lecture 10 Software Implementation in Simple Linear Regression Model using
ECO220Y Simple Regression: Testing the Slope
 ECO220Y Simple Regression: Testing the Slope Readings: Chapter 18 (Sections 18.3-18.5) Winter 2012 Lecture 19 (Winter 2012) Simple Regression Lecture 19 1 / 32 Simple Regression Model y i = β 0 + β 1 x
Inference for Regression Inference about the Regression Model and Using the Regression Line, with Details. Section 10.1, 2, 3
 Inference for Regression Inference about the Regression Model and Using the Regression Line, with Details Section 10.1, 2, 3 Basic components of regression setup Target of inference: linear dependency
15.063: Communicating with Data
 15.063: Communicating with Data Summer 2003 Recitation 6 Linear Regression Today s Content Linear Regression Multiple Regression Some Problems 15.063 - Summer '03 2 Linear Regression Why? What is it? Pros?
Nature vs. nurture? Lecture 18 - Regression: Inference, Outliers, and Intervals. Regression Output. Conditions for inference.
 Understanding regression output from software Nature vs. nurture? Lecture 18 - Regression: Inference, Outliers, and Intervals In 1966 Cyril Burt published a paper called The genetic determination of differences
SMAM 314 Exam 3d Name
 SMAM 314 Exam 3d Name 1. Mark the following statements True T or False F. (6 points -2 each) T A. A process is out of control if at a particular point in time the reading is more than 3 standard deviations
9 One-Way Analysis of Variance
 9 One-Way Analysis of Variance SW Chapter 11 - all sections except 6. The one-way analysis of variance (ANOVA) is a generalization of the two sample t test to k 2 groups. Assume that the populations of
Battery Life. Factory
 Statistics 354 (Fall 2018) Analysis of Variance: Comparing Several Means Remark. These notes are from an elementary statistics class and introduce the Analysis of Variance technique for comparing several
Chapter 16. Simple Linear Regression and dcorrelation
 Chapter 16 Simple Linear Regression and dcorrelation 16.1 Regression Analysis Our problem objective is to analyze the relationship between interval variables; regression analysis is the first tool we will