Introduction to SuperPro Designer for Batch Processing Modelling
|
|
|
- Elaine Barton
- 5 years ago
- Views:
Transcription
1 Introduction to SuperPro Designer for Batch Processing Modelling
2 Session outline Getting started SuperPro Designer (SPD) interface Flowsheet drawing and editing Unit procedures initialisation Simulation execution & result checking

3 Getting started

4 Process Operation Mode Process operation mode : BATCH vs CONTINUOUS Default annual operating time

5 SuperPro Designer Interface Maximise the flowsheet


6 SuperPro Designer Interface Horizontal drawing size : 2 pages
7 Some common icons Cut / Copy / Paste Solve-Run the simulation Open an existing worksheet Select mode Connect mode-stream connection Start a new worksheet Toolbar for drawing
8 Main unit procedure in SPD Vessel Procedure Reactor Seed Reactor Fermentor Seed Fermentor Air-lift Fermentor Continuous Reaction (Stoichiometric, kinetic, equilibrium) CSTR PFR Fermentor Seed Fermentor Environmental (aerobic, anaerobic, UV radiation) Filtration Microfiltration Ultrafiltration RO Diafiltration Baghouse Air Filtration Plate & Frame Rotary vacuum Distillation Flash Batch Continuous Extraction Distillation Mixer-Settler Differential Centrifugal Absorption Homogenization High pressure Bead milling Nano milling Sedimentation Decanting Clarification Thickening Oil Separation Flotation
9 Unit Procedure in SPD
10 Biochemical case study Component registration View component properties
11 Biochemical Case Study
12 Case Study 1 A batch reactor is utilised to produce component C from reactant A and B: A + B C Component C is later separated from A and B by a batch plate &frame filter Solvent used : Heptane (soluble for A and B but insoluble for C) Task to be performed : Mass and energy balances Process Scheduling
13 Component registration Component Nitrogen, N 2 Oxygen, O 2 Water, H 2 O Heptane, C 7 H 16 A B C Database Default Default Default Designer New (user define) New (user define) New (used define)

14 Component registration Databanks in SuperPro Default component

15 Component registration Newly added Reference component

16 View component properties
17 Editing component properties Component MW Price Value ($/kg) A 150 Purchase 10 B 25 Purchase 15 C 175 Selling 200 Let s do changes before we proceed
18 Time to save your work
19 Reminder Always remember to save your work!

20 Flowsheet drawing and editing Locating the unit procedures Stream connection Editing the flowsheet
21 Unit Procedures

22 Looking for help (F1)
23 Unit Procedures
24 Adding a process stream Select mode Connect-mode Stream connection Single click (tip: Press ESC button to terminate the stream drawing)
25 Deleting a stream Make sure the cursor is in Select Mode (ESC button) Single left click on the stream/unit (turn into read) & press DELETE (on keyboard)

26 Completing the flowsheet Double click Single click Single click
27 Let s draw our flowsheet before we proceed further
28 Editing a stream elbow Make sure the cursor is in Select Mode (Esc button) Make sure the cursor is in Select Mode (ESC button) Stream elbow
29

30 Editing tag name of the stream
31 Changing the Stream ID Stream ID Change ID to S-101 Heptane S-102 A S-103 B S-104 Emission S-105 Rxt out S-106 Wash in S-107 C S-108 B+ Heptane S-109 Wash out Let s do changes before we proceed
32 Editing the style of a stream Change Stream thickness: 2pt Change stream colour: brown
33 Changing the stream title and style Stream Colour Thickness Heptane Brown 2 points A Brown 2 points B Brown 2 points Emission Green 1 points Rxt out Brown 2 points Wash in Blue 1 points C Brown 2 points B + Heptane Brown 2 ponts Wash out Blue 1 points Same style (Q: is there a faster way to do so?)
34 Pickup style from Heptane
35 Apply style to another stream Press Ctrl button to select multiple streams
36 Complete the style editing for the rest of the streams

37 Editing the style of the icon Apply the same pick-up & apply to change the style of the filter Icon colour : blue Description tag text; Font 10, bold, maroon

38 Adding a title to the case study This is too small Text mode Change your font here
39 Save file (s) Save your work
40 Initialising a Unit Procedure What a Unit Procedure? Initialising an Operation
41 What is a Unit Procedure? In the batch modeling mode, a Unit Procedure may consists of various Operations: Reactor procedure: feed charge, reaction, product withdraw, etc Filtration procedure: filtration, cake wash, CIP, etc In continuous modeling mode, a Unit Procedure= Unit Operation
42 Hierarchy in batch modeling Entire plant Procedure(s) level Operation(s) level The same for continuous process modeling
43 Function of each unit procedure Vessel Procedure (P-1): Acts as a batch reactor to carry out reaction: A + B C Heptane is used to dissolve components A & B, to aid separation in P-2 Plate and Frame Filtration (P-2): Component C is not dissolved in heptane, hence is filtered out by the filter cloth Heptane is used to wash out the trapped heptane ( and also the dissolved A & B) from the filter cake

44 Stream specification Heptane flow = 800 kg/batch Ingredient flow T, P = default Click to insert Heptane here
45 Set spec for Stream A & B Stream ID Component Amount (kg/batch) Temperature Pressure Heptane Heptane 800 A B A B Default
46 Working session Do not forget to save your work!!!
47 A question to ponder Q: Why do we only specify the inlet stream?
48 Sequential modular approach Individual equipment blocks may require iterative solution algorithms Overall process solution is sequential & not iterative (Turton et al., 1998)
49 Adding operations to P-1 3 Charge operation (to charge A, B and heptane respectively) 1 React (Stoichiometric) operation (for reaction to be carried out) 1 Transfer Out operation (to deliver product to next unit)

50 Adding operations to P-1 Add new operation before the currently selected operation Add new operation at the end of the list
51 Initialising operations in P-1

52 Initialising CHARGE-1 Emission calculation (next slide ) Vol. flowrate =100 L/min Setup time = 5 min 800 kg heptane
 Go to selected operation Previous operation (same tab none) Next operation (same")
53 Emission calculation lick to perform mission calculation OK, next operation (CHARGE-2) OK, previous Operation (none) Go to selected operation Previous operation (same tab none) Next operation (same tab)
54 Initialising CHARGE operation Operation Operating condition Emission CHARGE-1 Charge 800kg/batch of heptane using stream Heptane CHARGE-2 CHARGE-3 Setup time= 5 min Process time : 100L/min Charge 50 kg/batch of A (limiting component) using Stream A Setup time = 5min Process time: calculated based on 20 kg/min Charge 40/kg batch of B using Stream B (B is in excess) Setup time = 5 min Process time : calculated based on 20 kg/min Please complete the initialisation of CHARGE-2 & CHARGE-3 Perform heptane emission on this stream Nil
55 Initialising REACT-1 & TRANSFER-OUT-1 Operation Operating condition Volumes Reaction REACT-1 Final temp = 50 C TRANSFER- OUT-1 Heat transfer agent: steam Process time = 6 hour Leave other values as defaults Using stream Rxt out Duration: same as Cloth Filtration in P-2 (using Master-Slave Relationship) Max Allowable working/ vessel volume: 80 % Nil Extent of reaction = 95 % Reaction stoichiometry A + B C


56 Initilising REACT-1 in P-1 Final temp = 50 C Max allowable volume = 80 % Steam Process time = 6 h

 Delete stoichiometry (when needed)")
57 Initialising REACT-1 in P-1 Edit reaction stoichiometry Rename reaction Reaction extent = 95 % Add reaction(s) OK, next operation (Transfer-out) Delete stoichiometry (when needed) Molar stoichiometry

58 Initialising Transfer Out Transfer out stream Click here to select Master-and-Slave to calculate duration To quit Vessel Procedure Select the Master Operation in Master Procedure Select the Master Procedure
, until the master operation is met Both master and slave operation may exist in the same procedure or in another")
59 Master-Slave Relationship Slave Master Master operation processing step that control the duration of another operation (slave) When simulation is executed, duration calculation for the slave operation will be bypassed (note: M&E balances affected), until the master operation is met Both master and slave operation may exist in the same procedure or in another procedure
60 Working session Let s try before we proceed further
61 Initialising operation for P-2 Cloth Filtration operation (by default, to filter product C) Cake Wash operation (to wash out left over trapped A & B in filter cake) Transfer Out operation (to deliver product)
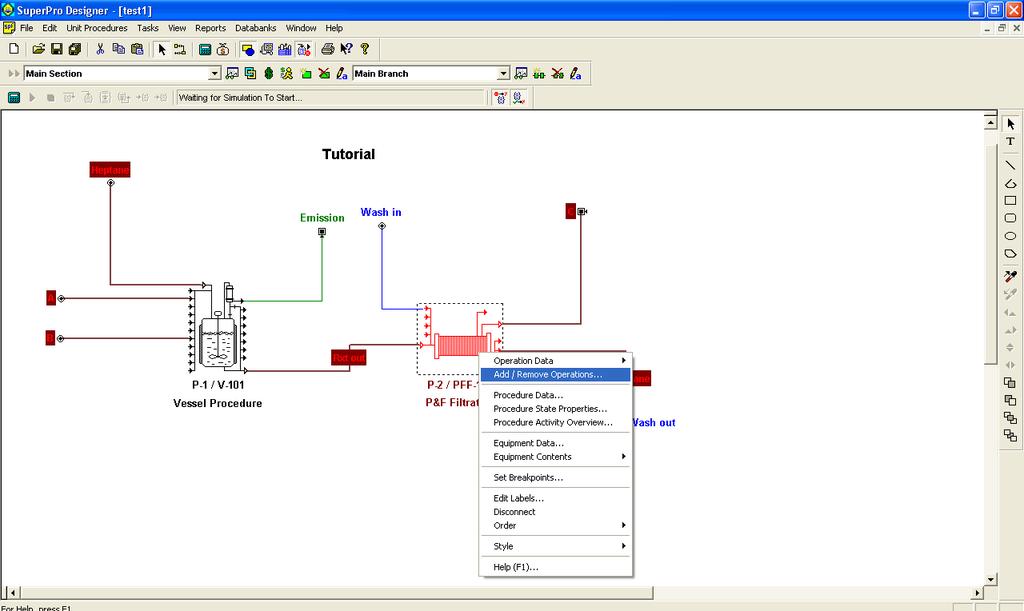
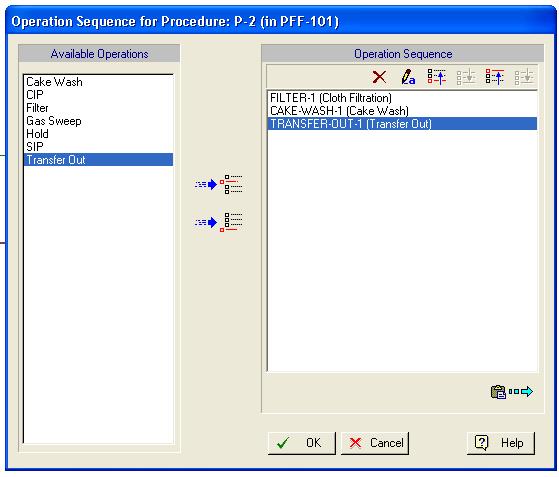
62 Adding operations to P-2
63 Initialising operations for P-2
64 Initialising FILTER-1 Operation Operating condition Scheduling FILTER-1 Particulate component removal: 95% C (assuming that A & B are completely soluble in Heptane & C is virtually insoluble). LOD (loss on drying) = 35% (this value cause a portion of heptane & any soluble component to be held in the wet cake 65% is insoluble C). Filtrate stream: B + Heptane By default, first operation of any batch unit procedure is scheduled to start at the beginning of the batch Start time: relative to the START of TRANSFER-OUT-1 operation in P-1 procedure


65 Initialising FILTER-1 Scheduling C = 95% removal LOD = 35% By default Filtration will only start when product is transferred out from P1 Filtrate


66 Initialising CAKE-WASH-1 & TRANSFER-OUT-1 Operation CAKE- WASH-1 TRANSFER- OUT-1 Operation condition Wash In stream: Wash in Wash Out stream: Wash out Wash solvent: heptane (click on Composition, select Autoadjust, the program will estimate a value automatically) Wash time: 30 minutes Wash type: slurry (Note: A slurry wash will essentially dilute the soluble components trapped in the cake and remove most of them in the wash stream, whereas a displacement wash will remove the soluble components form the cake in a plug-flow fashion.) Transfer out using stream C Duration: calculated based on 10kg/min
67 Working session Remember to save your file!
68 Simulating a flowsheet Execute the simulation Viewing the results
69 Simulating a process: 1. Menu bar: Task/ Solve M&E balances 2. Press Ctrl 3 3. Solve icon in menu bar 4. Press F9
70 Result viewing 1. Calculated output variables for each oeration can be viewed by revisiting the corresponding Operation Data dialog windows 2. To see the calculated equipment sizes, right click on the unit procedure icon & choose the Equipment Data option 3. The contents of a piece of equipment as a function of time can be viewed by right clicking on a unit procedure and selecting Equipment Contents or Operation Sequence 4. The calculated flowrates and compositions of intermediate & output streams can be viewed by in the Simulation Data dialog windows of each stream
71 Result viewing 5. A list of reports can be viewed in Reports: Stream Reports (SR) Economic Evaluation Report (EER) Itemized Cost Report (ICR) Cash Flow Report (CFR) Throughput Analysis Report (THR) Environmental Impact Assessment Report (EIR) Emission Reports (EMS) Input Data Report (EDR) Equipment Report (EQR) Let s visit the one by one

72 Equipment operation data Calculated heptane emission: 0.028%

73 Equipment data Calculated vessel volume: 1628 L

74 Equipment content

75 Stream simulation data
76 Generating a stream report
77 Check your scheduling results Reaction A + B C MW Initial content, m io (kg) - Initial mol, n io (kg-mol) - X= 95% (based on A) Current mol, n (kg-mol) n AO -n AO X n BO -n BO X n AO X Current content, m (kg)
78 Check your scheduling result Heptane charge = kg/batch (stream specification) Volumetric flowrate= L/min (in Operation Data/CHARGE-1) Task: Find out the density of the heptane stream from your simulation sheet Verify the heptane charging duration calculated by SPD heptane
79 Do not just take the computer s word as it is, please check your results accordingly!!! Remember the GIGO principle
Stoichiometric Reactor Simulation Robert P. Hesketh and Concetta LaMarca Chemical Engineering, Rowan University (Revised 4/8/09)
") Stoichiometric Reactor Simulation Robert P. Hesketh and Concetta LaMarca Chemical Engineering, Rowan University (Revised 4/8/09) In this session you will learn how to create a stoichiometric reactor model
Stoichiometric Reactor Simulation Robert P. Hesketh and Concetta LaMarca Chemical Engineering, Rowan University (Revised 4/8/09) In this session you will learn how to create a stoichiometric reactor model
Getting started with BatchReactor Example : Simulation of the Chlorotoluene chlorination
 Getting started with BatchReactor Example : Simulation of the Chlorotoluene chlorination 2011 ProSim S.A. All rights reserved. Introduction This document presents the different steps to follow in order
Reactors. Reaction Classifications
 Reactors Reactions are usually the heart of the chemical processes in which relatively cheap raw materials are converted to more economically favorable products. In other cases, reactions play essential
41. Sim Reactions Example
 HSC Chemistry 7.0 41-1(6) 41. Sim Reactions Example Figure 1: Sim Reactions Example, Run mode view after calculations. General This example contains instruction how to create a simple model. The example
Athena Visual Software, Inc. 1
 Athena Visual Studio Visual Kinetics Tutorial VisualKinetics is an integrated tool within the Athena Visual Studio software environment, which allows scientists and engineers to simulate the dynamic behavior
MAGNETITE OXIDATION EXAMPLE
 HSC Chemistry 7.0 1 MAGNETITE OXIDATION EXAMPLE Pelletized magnetite (Fe 3 O 4 ) ore may be oxidized to hematite (Fe 2 O 3 ) in shaft furnace. Typical magnetite content in ore is some 95%. Oxidation is
Esterification in CSTRs in Series with Aspen Plus V8.0
 Esterification in CSTRs in Series with Aspen Plus V8.0 1. Lesson Objectives Use Aspen Plus to determine whether a given reaction is technically feasible using three continuous stirred tank reactors in
Ammonia Synthesis with Aspen Plus V8.0
 Ammonia Synthesis with Aspen Plus V8.0 Part 1 Open Loop Simulation of Ammonia Synthesis 1. Lesson Objectives Become comfortable and familiar with the Aspen Plus graphical user interface Explore Aspen Plus
Space Objects. Section. When you finish this section, you should understand the following:
 GOLDMC02_132283433X 8/24/06 2:21 PM Page 97 Section 2 Space Objects When you finish this section, you should understand the following: How to create a 2D Space Object and label it with a Space Tag. How
Esterification in a PFR with Aspen Plus V8.0
 Esterification in a PFR with Aspen Plus V8.0 1. Lesson Objectives Use Aspen Plus to determine whether a given reaction is technically feasible using a plug flow reactor. 2. Prerequisites Aspen Plus V8.0
Process design decisions and project economics Dr. V. S. Moholkar Department of chemical engineering Indian Institute of Technology, Guwahati
 Process design decisions and project economics Dr. V. S. Moholkar Department of chemical engineering Indian Institute of Technology, Guwahati Module - 02 Flowsheet Synthesis (Conceptual Design of a Chemical
The OptiSage module. Use the OptiSage module for the assessment of Gibbs energy data. Table of contents
 The module Use the module for the assessment of Gibbs energy data. Various types of experimental data can be utilized in order to generate optimized parameters for the Gibbs energies of stoichiometric
1. Starting of a project and entering of basic initial data.
 PROGRAM VISIMIX TURBULENT SV. Example 1. Contents. 1. Starting of a project and entering of basic initial data. 1.1. Opening a Project. 1.2. Entering dimensions of the tank. 1.3. Entering baffles. 1.4.
ISIS/Draw "Quick Start"
 ISIS/Draw "Quick Start" Click to print, or click Drawing Molecules * Basic Strategy 5.1 * Drawing Structures with Template tools and template pages 5.2 * Drawing bonds and chains 5.3 * Drawing atoms 5.4
An area chart emphasizes the trend of each value over time. An area chart also shows the relationship of parts to a whole.
 Excel 2003 Creating a Chart Introduction Page 1 By the end of this lesson, learners should be able to: Identify the parts of a chart Identify different types of charts Create an Embedded Chart Create a
Using the Budget Features in Quicken 2008
 Using the Budget Features in Quicken 2008 Quicken budgets can be used to summarize expected income and expenses for planning purposes. The budget can later be used in comparisons to actual income and expenses
Connect the Vernier spectrometer to your lap top computer and power the spectrometer if necessary. Start LoggerPro on your computer.
 Connect the Vernier spectrometer to your lap top computer and power the spectrometer if necessary. Start LoggerPro on your computer. The screen shown in Fig. 1 may be displayed. If status line displays
Chem 1 Kinetics. Objectives. Concepts
 Chem 1 Kinetics Objectives 1. Learn some basic ideas in chemical kinetics. 2. Understand how the computer visualizations can be used to benefit the learning process. 3. Understand how the computer models
WS Prediction of the carbon deposition in steam reforming unit (Equilibrium reaction calculation in Gibbs Reactor)
") WS-4-03 Prediction of the carbon deposition in steam reforming unit (Equilibrium reaction calculation in Gibbs Reactor) Problem Steam reformer is often used in refineries or chemical plants. Design and
WS-4-03 Prediction of the carbon deposition in steam reforming unit (Equilibrium reaction calculation in Gibbs Reactor) Problem Steam reformer is often used in refineries or chemical plants. Design and
Aspen Dr. Ziad Abuelrub
 Aspen Plus Lab Pharmaceutical Plant Design Aspen Dr. Ziad Abuelrub OUTLINE 1. Introduction 2. Getting Started 3. Thermodynamic Models & Physical Properties 4. Pressure Changers 5. Heat Exchangers 6. Flowsheet
Aspen Plus PFR Reactors Tutorial using Styrene with Pressure Drop Considerations By Robert P. Hesketh and Concetta LaMarca Spring 2005
 Aspen Plus PFR Reactors Tutorial using Styrene with Pressure Drop Considerations By Robert P. Hesketh and Concetta LaMarca Spring 2005 In this laboratory we will incorporate pressure-drop calculations
Computational Study of Chemical Kinetics (GIDES)
") Computational Study of Chemical Kinetics (GIDES) Software Introduction Berkeley Madonna (http://www.berkeleymadonna.com) is a dynamic modeling program in which relational diagrams are created using a graphical
Computational Study of Chemical Kinetics (GIDES) Software Introduction Berkeley Madonna (http://www.berkeleymadonna.com) is a dynamic modeling program in which relational diagrams are created using a graphical
ON SITE SYSTEMS Chemical Safety Assistant
 ON SITE SYSTEMS Chemical Safety Assistant CS ASSISTANT WEB USERS MANUAL On Site Systems 23 N. Gore Ave. Suite 200 St. Louis, MO 63119 Phone 314-963-9934 Fax 314-963-9281 Table of Contents INTRODUCTION
v Prerequisite Tutorials GSSHA WMS Basics Watershed Delineation using DEMs and 2D Grid Generation Time minutes
 v. 10.1 WMS 10.1 Tutorial GSSHA WMS Basics Creating Feature Objects and Mapping Attributes to the 2D Grid Populate hydrologic parameters in a GSSHA model using land use and soil data Objectives This tutorial
α m ! m or v T v T v T α m mass
 FALLING OBJECTS (WHAT TO TURN IN AND HOW TO DO SO) In the real world, because of air resistance, objects do not fall indefinitely with constant acceleration. One way to see this is by comparing the fall
The Quantizing functions
 The Quantizing functions What is quantizing? Quantizing in its fundamental form is a function that automatically moves recorded notes, positioning them on exact note values: For example, if you record
INTRODUCTION TO CHEMICAL PROCESS SIMULATORS
 INTRODUCTION TO CHEMICAL PROCESS SIMULATORS DWSIM Chemical Process Simulator A. Carrero, N. Quirante, J. Javaloyes October 2016 Introduction to Chemical Process Simulators Contents Monday, October 3 rd
13. Equilibrium Module - Description of Menus and Options
 15008-ORC-J 1 (57) 13. Equilibrium Module - Description of Menus and Options 15008-ORC-J 2 (57) SUMMARY HSC Equilibrium module enables user to calculate multi-component equilibrium compositions in heterogeneous
The data for this lab comes from McDonald Forest. We will be working with spatial data representing the forest boundary, streams, roads, and stands.
 GIS LAB 6 Using the Projection Utility. Converting Data to Oregon s Approved Lambert Projection. Determining Stand Size, Stand Types, Road Length, and Stream Length. This lab will ask you to work with
HSC Chemistry 7.0 User's Guide
 HSC Chemistry 7.0 47-1 HSC Chemistry 7.0 User's Guide Sim Flowsheet Module Experimental Mode Pertti Lamberg Outotec Research Oy Information Service P.O. Box 69 FIN - 28101 PORI, FINLAND Fax: +358-20 -
How to Make or Plot a Graph or Chart in Excel
 This is a complete video tutorial on How to Make or Plot a Graph or Chart in Excel. To make complex chart like Gantt Chart, you have know the basic principles of making a chart. Though I have used Excel
WEATHER AND CLIMATE COMPLETING THE WEATHER OBSERVATION PROJECT CAMERON DOUGLAS CRAIG
 WEATHER AND CLIMATE COMPLETING THE WEATHER OBSERVATION PROJECT CAMERON DOUGLAS CRAIG Introduction The Weather Observation Project is an important component of this course that gets you to look at real
DISCRETE RANDOM VARIABLES EXCEL LAB #3
 DISCRETE RANDOM VARIABLES EXCEL LAB #3 ECON/BUSN 180: Quantitative Methods for Economics and Business Department of Economics and Business Lake Forest College Lake Forest, IL 60045 Copyright, 2011 Overview
module, with the exception that the vials are larger and you only use one initial population size.
 Population Dynamics and Space Availability (http://web.as.uky.edu/biology/faculty/cooper/population%20dynamics%20examples%2 0with%20fruit%20flies/TheAmericanBiologyTeacher- PopulationDynamicsWebpage.html
Building Inflation Tables and CER Libraries
 Building Inflation Tables and CER Libraries January 2007 Presented by James K. Johnson Tecolote Research, Inc. Copyright Tecolote Research, Inc. September 2006 Abstract Building Inflation Tables and CER
Pressure Swing Distillation with Aspen Plus V8.0
 Pressure Swing Distillation with Aspen Plus V8.0 1. Lesson Objectives Aspen Plus property analysis RadFrac distillation modeling Design Specs NQ Curves Tear streams Understand and overcome azeotrope Select
Preparations and Starting the program
 Preparations and Starting the program https://oldwww.abo.fi/fakultet/ookforskning 1) Create a working directory on your computer for your Chemkin work, and 2) download kinetic mechanism files AAUmech.inp
Acid-Base ph Titration Introduction
 Electronic Supplementary Material (ESI) for Chemistry Education Research and Practice. This journal is The Royal Society of Chemistry 2016 Appendix B: Example of Traditional Investigation Acid-Base ph
Structural Analysis of an Unknown Compound and Determination of its pk a by NMR Spectroscopy
 Structural Analysis of an Unknown Compound and Determination of its pk a by NMR Spectroscopy Yoshitaka Ishii, Dan McElheny, and Isamu Matsuda, August 31, 2013 (revised January 14, 2014) 1. Theoretical
Experiment: Oscillations of a Mass on a Spring
 Physics NYC F17 Objective: Theory: Experiment: Oscillations of a Mass on a Spring A: to verify Hooke s law for a spring and measure its elasticity constant. B: to check the relationship between the period
Determining the Conductivity of Standard Solutions
 Determining the Conductivity of Standard Solutions by Anna Cole and Shannon Clement Louisiana Curriculum Framework Content Strand: Science as Inquiry, Physical Science Grade Level 11-12 Objectives: 1.
Automatic Watershed Delineation using ArcSWAT/Arc GIS
 Automatic Watershed Delineation using ArcSWAT/Arc GIS By: - Endager G. and Yalelet.F 1. Watershed Delineation This tool allows the user to delineate sub watersheds based on an automatic procedure using
Create Satellite Image, Draw Maps
 Create Satellite Image, Draw Maps 1. The goal Using Google Earth, we want to create and import a background file into our Adviser program. From there, we will be creating paddock boundaries. The accuracy
EXPERIMENT 8 Determining K sp
 EXPERIMENT 8 Determining K sp Introduction The solubility product constant, or K sp of a compound is an equilibrium constant that describes the degree to which a solid dissolves in water. The K sp is calculated
let s examine pupation rates. With the conclusion of that data collection, we will go on to explore the rate at which new adults appear, a process
 Population Dynamics and Initial Population Size (Module website: http://web.as.uky.edu/biology/faculty/cooper/population%20dynamics%20examples%20 with%20fruit%20flies/theamericanbiologyteacher-populationdynamicswebpage.html
Determination of the Equivalent Weight and the K a or K b for a Weak Acid or Base
 INTRODUCTION Determination of the Equivalent Weight and the K a or K b for a Weak Acid or Base Chemists frequently make use of the equivalent weight (eq. wt.) as the basis for volumetric calculations.
Soil Cation Analysis Using High-Performance Capillary Zone Electrophoresis Last Modified: October 20, 2006
 Soil Cation Analysis Using High-Performance Capillary Zone Electrophoresis Last Modified: October 20, 2006 Introduction: Capillary electrophoresis (CE) is a relatively new, but rapidly growing separation
User Manuel. EurotaxForecast. Version Latest changes ( )
") User Manuel EurotaxForecast Version 1.23.0771- Latest changes (19.07.2003) Contents Preface 5 Welcome to Eurotax Forecast...5 Using this manual 6 How to use this manual?...6 Program overview 7 General
User Manuel EurotaxForecast Version 1.23.0771- Latest changes (19.07.2003) Contents Preface 5 Welcome to Eurotax Forecast...5 Using this manual 6 How to use this manual?...6 Program overview 7 General
VISIMIX TURBULENT. TACKLING SAFETY PROBLEMS OF STIRRED REACTORS AT THE DESIGN STAGE.
 VISIMIX TURBULENT. TACKLING SAFETY PROBLEMS OF STIRRED REACTORS AT THE DESIGN STAGE. This example demonstrates usage of the VisiMix software to provide an Inherently Safer Design of the process based on
Tutorial: Premixed Flow in a Conical Chamber using the Finite-Rate Chemistry Model
 Tutorial: Premixed Flow in a Conical Chamber using the Finite-Rate Chemistry Model Introduction The purpose of this tutorial is to provide guidelines and recommendations for setting up and solving the
Activity P11: Collision Impulse and Momentum (Force Sensor, Motion Sensor)
") Name Class Date Activity P11: Collision Impulse and Momentum (Force Sensor, Motion Sensor) Concept DataStudio ScienceWorkshop (Mac) ScienceWorkshop (Win) Newton s Laws P11 Impulse.DS P14 Collision P14_COLL.SWS
Name Class Date Activity P11: Collision Impulse and Momentum (Force Sensor, Motion Sensor) Concept DataStudio ScienceWorkshop (Mac) ScienceWorkshop (Win) Newton s Laws P11 Impulse.DS P14 Collision P14_COLL.SWS
Tutorial 12 Excess Pore Pressure (B-bar method) Undrained loading (B-bar method) Initial pore pressure Excess pore pressure
 Undrained loading (B-bar method) Initial pore pressure Excess pore pressure") Tutorial 12 Excess Pore Pressure (B-bar method) Undrained loading (B-bar method) Initial pore pressure Excess pore pressure Introduction This tutorial will demonstrate the Excess Pore Pressure (Undrained
Tutorial 12 Excess Pore Pressure (B-bar method) Undrained loading (B-bar method) Initial pore pressure Excess pore pressure Introduction This tutorial will demonstrate the Excess Pore Pressure (Undrained
NMR Predictor. Introduction
 NMR Predictor This manual gives a walk-through on how to use the NMR Predictor: Introduction NMR Predictor QuickHelp NMR Predictor Overview Chemical features GUI features Usage Menu system File menu Edit
Virtual Cell Membrane Potential Tutorial IV
 Virtual Cell Membrane Potential Tutorial IV Creating the BioModel Creating the Application!" Application I -Studying voltage changes in a compartmental model!" Application II - Studying voltage, sodium,
(1) This reaction mechanism includes several undesired side reactions that produce toluene and benzene:
 This reaction mechanism includes several undesired side reactions that produce toluene and benzene:") HYSYS Multiple Reactions - Styrene Prepared by Robert P. Hesketh Spring 005 Styrene Reactor System You have been studying how to use HYSYS using the example of a Styrene reactor system. In this session
HYSYS Multiple Reactions - Styrene Prepared by Robert P. Hesketh Spring 005 Styrene Reactor System You have been studying how to use HYSYS using the example of a Styrene reactor system. In this session
Quantification of JEOL XPS Spectra from SpecSurf
 Quantification of JEOL XPS Spectra from SpecSurf The quantification procedure used by the JEOL SpecSurf software involves modifying the Scofield cross-sections to account for both an energy dependency
Operation Manual. SPECTRO-NANO4 Nucleic Acid Analyzer PLEASE READ THIS MANUAL CAREFULLY BEFORE OPERATION
 Operation Manual SPECTRO-NANO4 Nucleic Acid Analyzer PLEASE READ THIS MANUAL CAREFULLY BEFORE OPERATION 3, Hagavish st. Israel 58817 Tel: 972 3 5595252, Fax: 972 3 5594529 mrc@mrclab.com MRC. 4.18 Foreword
Watershed Modeling Orange County Hydrology Using GIS Data
 v. 10.0 WMS 10.0 Tutorial Watershed Modeling Orange County Hydrology Using GIS Data Learn how to delineate sub-basins and compute soil losses for Orange County (California) hydrologic modeling Objectives
The Geodatabase Working with Spatial Analyst. Calculating Elevation and Slope Values for Forested Roads, Streams, and Stands.
 GIS LAB 7 The Geodatabase Working with Spatial Analyst. Calculating Elevation and Slope Values for Forested Roads, Streams, and Stands. This lab will ask you to work with the Spatial Analyst extension.
Introduction to Google Drive Objectives:
 Introduction to Google Drive Objectives: Learn how to access your Google Drive account Learn to create new documents using Google Drive Upload files to store on Google Drive Share files and folders with
Ligand Scout Tutorials
 Ligand Scout Tutorials Step : Creating a pharmacophore from a protein-ligand complex. Type ke6 in the upper right area of the screen and press the button Download *+. The protein will be downloaded and
ICP-OES DETERMINATION OF IRON. Introduction:
 ICP-OES DETERMINATION OF IRON. Introduction: Silver impregnated cloth has bene used in bandages and dressings to help kill bacteria associated with a wound. Cloth samples are to anaysed for silver and
Lab 1 Uniform Motion - Graphing and Analyzing Motion
 Lab 1 Uniform Motion - Graphing and Analyzing Motion Objectives: < To observe the distance-time relation for motion at constant velocity. < To make a straight line fit to the distance-time data. < To interpret
17. E - ph (Pourbaix) Diagrams Module
 Diagrams Module") HSC - EpH 15011-ORC-J 1 (16) 17. E - ph (Pourbaix) Diagrams Module E - ph diagrams show the thermodynamic stability areas of different species in an aqueous solution. Stability areas are presented as a
HSC - EpH 15011-ORC-J 1 (16) 17. E - ph (Pourbaix) Diagrams Module E - ph diagrams show the thermodynamic stability areas of different species in an aqueous solution. Stability areas are presented as a
Mnova Software for Analyzing Reaction Monitoring NMR Spectra
 Mnova Software for Analyzing Reaction Monitoring NMR Spectra Version 10 Chen Peng, PhD, VP of Business Development, US & China Mestrelab Research SL San Diego, CA, USA chen.peng@mestrelab.com 858.736.4563
RATE LAW DETERMINATION OF CRYSTAL VIOLET HYDROXYLATION
 Rate Law Determination of Crystal Violet Hydroxylation Revised 5/22/12 RATE LAW DETERMINATION OF CRYSTAL VIOLET HYDROXYLATION Adapted from "Chemistry with Computers" Vernier Software, Portland OR, 1997
2010 Autodesk, Inc. All rights reserved. NOT FOR DISTRIBUTION.
 Wastewater Profiles 2010 Autodesk, Inc. All rights reserved. NOT FOR DISTRIBUTION. The contents of this guide were created for Autodesk Topobase 2011. The contents of this guide are not intended for other
Jasco V-670 absorption spectrometer
 Laser Spectroscopy Labs Jasco V-670 absorption spectrometer Operation instructions 1. Turn ON the power switch on the right side of the spectrophotometer. It takes about 5 minutes for the light source
VISIMIX TURBULENT. BATCH REACTOR SCALING UP.
 Introduction. VISIMIX TURBULENT. BATCH REACTOR SCALING UP. This example is based on a practical case application of VisiMix Turbulent by one of our clients. It is related to development of a new process
Zetasizer Nano-ZS User Instructions
 Zetasizer Nano-ZS User Instructions 1. Activate the instrument computer by logging in to CORAL. If needed, log in to the local instrument computer Username: zetasizer. Password: zetasizer. 2. Instrument
Leaf Spring (Material, Contact, geometric nonlinearity)
") 00 Summary Summary Nonlinear Static Analysis - Unit: N, mm - Geometric model: Leaf Spring.x_t Leaf Spring (Material, Contact, geometric nonlinearity) Nonlinear Material configuration - Stress - Strain
00 Summary Summary Nonlinear Static Analysis - Unit: N, mm - Geometric model: Leaf Spring.x_t Leaf Spring (Material, Contact, geometric nonlinearity) Nonlinear Material configuration - Stress - Strain
Tutorial. Getting started. Sample to Insight. March 31, 2016
 Getting started March 31, 2016 Sample to Insight CLC bio, a QIAGEN Company Silkeborgvej 2 Prismet 8000 Aarhus C Denmark Telephone: +45 70 22 32 44 www.clcbio.com support-clcbio@qiagen.com Getting started
EXPERIMENT 4 ONE DIMENSIONAL MOTION
 EXPERIMENT 4 ONE DIMENSIONAL MOTION INTRODUCTION This experiment explores the meaning of displacement; velocity, acceleration and the relationship that exist between them. An understanding of these concepts
CHEMDRAW ULTRA ITEC107 - Introduction to Computing for Pharmacy. ITEC107 - Introduction to Computing for Pharmacy 1
 CHEMDRAW ULTRA 12.0 ITEC107 - Introduction to Computing for Pharmacy 1 Objectives Basic drawing skills with ChemDraw Bonds, captions, hotkeys, chains, arrows Checking and cleaning up structures Chemical
Application Note. U. Heat of Formation of Ethyl Alcohol and Dimethyl Ether. Introduction
 Application Note U. Introduction The molecular builder (Molecular Builder) is part of the MEDEA standard suite of building tools. This tutorial provides an overview of the Molecular Builder s basic functionality.
Task 1: Start ArcMap and add the county boundary data from your downloaded dataset to the data frame.
 Exercise 6 Coordinate Systems and Map Projections The following steps describe the general process that you will follow to complete the exercise. Specific steps will be provided later in the step-by-step
EXPERIMENT: LIMITING REAGENT. NOTE: Students should have moles of reactants in DATASHEET converted into masses in grams prior to the lab period.
 Revised 12/2015 EXPERIMENT: LIMITING REAGENT Chem 1104 Lab NOTE: Students should have moles of reactants in DATASHEET converted into masses in grams prior to the lab period. INTRODUCTION Limiting reactant
Electric Fields and Equipotentials
 OBJECTIVE Electric Fields and Equipotentials To study and describe the two-dimensional electric field. To map the location of the equipotential surfaces around charged electrodes. To study the relationship
10. Facies Modeling Sequential Indicator Simulation (SIS)
") 10. Facies Modeling 10.1 Sequential Indicator Simulation (SIS) In this section the process of building a basic facies model conditioned to well observations using SIS. The variogram type, ranges, and azimuth
10. Facies Modeling 10.1 Sequential Indicator Simulation (SIS) In this section the process of building a basic facies model conditioned to well observations using SIS. The variogram type, ranges, and azimuth
Kinetics of Crystal Violet Bleaching
 Kinetics of Crystal Violet Bleaching Authors: V. C. Dew and J. M. McCormick* From Update March 12, 2013 with revisions Nov. 29, 2016 Introduction Chemists are always interested in whether a chemical reaction
Molecular Modeling and Conformational Analysis with PC Spartan
 Molecular Modeling and Conformational Analysis with PC Spartan Introduction Molecular modeling can be done in a variety of ways, from using simple hand-held models to doing sophisticated calculations on
Supernatant: The liquid layer lying above the solid layer after a precipitation reaction occurs.
 Limiting Reagent Introduction The quantities of substances involved in a chemical reaction represented by a balanced equation are often referred to as stoichiometric amounts. Solution stoichiometry is
Computer simulation of radioactive decay
 Computer simulation of radioactive decay y now you should have worked your way through the introduction to Maple, as well as the introduction to data analysis using Excel Now we will explore radioactive
ScienceWord and PagePlayer Chemical formulae. Dr Emile C. B. COMLAN Novoasoft Representative in Africa
 ScienceWord and PagePlayer Chemical formulae Dr Emile C. B. CMLAN Novoasoft Representative in Africa Emails: ecomlan@yahoo.com ecomlan@scienceoffice.com Web site: www.scienceoffice.com Chemical formulae
Inside VMG - January 2013 [News - Articles - Courses - Webinars] - Virtual Materials Group, Inc.
![Inside VMG - January 2013 [News - Articles - Courses - Webinars] - Virtual Materials Group, Inc.](/thumbs/96/126604944.jpg "Inside VMG - January 2013 [News - Articles - Courses - Webinars] - Virtual Materials Group, Inc.") Tuesday, January 22, 2013 VMG USA New Address and Phone Number We are pleased to announce our new office location in Houston s energy corridor. The office is located just off of I-10 on Park Row Drive.
Tuesday, January 22, 2013 VMG USA New Address and Phone Number We are pleased to announce our new office location in Houston s energy corridor. The office is located just off of I-10 on Park Row Drive.
Experiment 2: Reaction Stoichiometry by Thermometric Titration
 Experiment 2: Reaction Stoichiometry by Thermometric Titration Introduction The net result of a reaction (a chemical change) is summarized by a chemical equation. In order to write a chemical equation,
Shown below is a sample titration curve for a diprotic acid. Note the two equivalence points.
 EXPERIMENT 9 Titration Curve for a Polyprotic Acid INTRODUCTION Other than by strength and concentration, another way of classifying acids involves the number of H + ions an acid can donate. A monoprotic
You w i ll f ol l ow these st eps : Before opening files, the S c e n e panel is active.
 You w i ll f ol l ow these st eps : A. O pen a n i m a g e s t a c k. B. Tr a c e t h e d e n d r i t e w i t h t h e user-guided m ode. C. D e t e c t t h e s p i n e s a u t o m a t i c a l l y. D. C
MASSACHUSETTS INSTITUTE OF TECHNOLOGY Physics Department. Experiment 03: Work and Energy
 MASSACHUSETTS INSTITUTE OF TECHNOLOGY Physics Department Physics 8.01 Fall Term 2010 Experiment 03: Work and Energy Purpose of the Experiment: In this experiment you allow a cart to roll down an inclined
BUILDING BASICS WITH HYPERCHEM LITE
 BUILDING BASICS WITH HYPERCHEM LITE LAB MOD1.COMP From Gannon University SIM INTRODUCTION A chemical bond is a link between atoms resulting from the mutual attraction of their nuclei for electrons. There
Planning Softproviding Meat User Documentation
 Great ideas are always simple Softproviding simply makes them happen. Planning Softproviding Meat User Documentation Version: 1.00 Date: 24 August 2017 Release: v5.50 Softproviding AG Riehenring 175 CH-4058
13. EQUILIBRIUM MODULE
 HSC Chemistry 5.0 13 1 13. EQUILIBRIUM MODULE Fig. 1. Equilibrium Module Menu. This module enables you to calculate multi component equilibrium compositions in heterogeneous systems easily. The user simply
Tutorial 23 Back Analysis of Material Properties
 Tutorial 23 Back Analysis of Material Properties slope with known failure surface sensitivity analysis probabilistic analysis back analysis of material strength Introduction Model This tutorial will demonstrate
Protocol Particle size distribution by centrifugal sedimentation (CPS)
") Protocol Particle size distribution by centrifugal sedimentation (CPS) 1. Method The CPS Disc Centrifuge separates particles by size using centrifugal sedimentation in a liquid medium. The sedimentation
Protocol Particle size distribution by centrifugal sedimentation (CPS) 1. Method The CPS Disc Centrifuge separates particles by size using centrifugal sedimentation in a liquid medium. The sedimentation
13. EQUILIBRIUM MODULE
 HSC Chemistry 7.0 13-1 13. EQUILIBRIUM MODULE Fig. 1. Equilibrium Module Menu. This module enables you to calculate multi-component equilibrium compositions in heterogeneous systems easily. The user simply
Process Classification
 Process Classification Before writing a material balance (MB) you must first identify the type of process in question. Batch no material (mass) is transferred into or out of the system over the time period
A Study of Beer s Law Prelab
 1. What is the purpose of this experiment? A Study of Beer s Law Prelab 2. Using the absorbance versus wavelength curve given in Figure I, determine the approximate value of max of the dye used to construct
Rate law Determination of the Crystal Violet Reaction Using the Isolation Method
 Rate law Determination of the Crystal Violet Reaction Using the Isolation Method Introduction A common challenge in chemical kinetics is to determine the rate law for a reaction with multiple reactants.
Esri UC2013. Technical Workshop.
 Esri International User Conference San Diego, California Technical Workshops July 9, 2013 CAD: Introduction to using CAD Data in ArcGIS Jeff Reinhart & Phil Sanchez Agenda Overview of ArcGIS CAD Support
M E R C E R W I N WA L K T H R O U G H
 H E A L T H W E A L T H C A R E E R WA L K T H R O U G H C L I E N T S O L U T I O N S T E A M T A B L E O F C O N T E N T 1. Login to the Tool 2 2. Published reports... 7 3. Select Results Criteria...