Copyright is owned by the Author of the thesis. Permission is given for a copy to be downloaded by an individual for the purpose of research and
|
|
|
- Chrystal Davis
- 5 years ago
- Views:
Transcription
1 Copyright is owned by the Author of the thesis. Permission is given for a copy to be downloaded by an individual for the purpose of research and private study only. The thesis may not be reproduced elsewhere without the permission of the Author.
2 i Mammalian Evolution and Phylogeny from Complete Mitochondrial Genomes A thesis in partial fulfillment of the requirements for the degree of Doctor of Philosophy in Molecular BioSciences at Massey University Yu-Hsin Lin 2001

3 Complete mitochondrial genomes and mammalian phylogeny
4 ii ACKNOWLEDGEMENTS I would like to express my gratitude to my supervisor, David Penny, for his patient guidance through my Ph.D. project. He gave me far more than knowledge of research methods in biology. His wisdom, tolerance, patience and open-mindedness, all the requirements of a good scientist, were an inspiration to me. I also thank my other supervisors, Michael Hendy and Peter Lockhart, who have taught me the mysteries of tree building in the simplest language. Abby Harrison and Trish McLenachan are the people I need to give my acknowledge most for their help and suggestion in my lab work. I am also indebted to all the people, who helped me to arrange and provide the samples, who undertook the sequencing and who wrote the computer programs. Matt Phillip always provided good suggestions and discussions, thank you. I also thank the New Zealand Marsden Fund for their financial support. I am also very appreciative to Trish McLenachan, Abby Harrison, and my supervisor, David Penny for their help with my manuscript. Finally, my adorable wife and two daughters, they made me enjoy my life while I was studying.
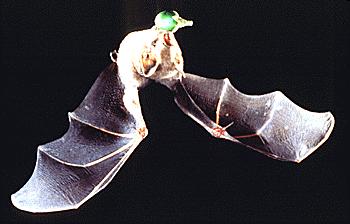
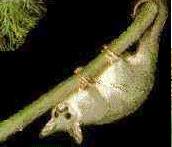
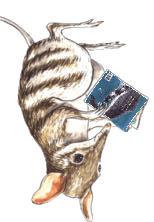
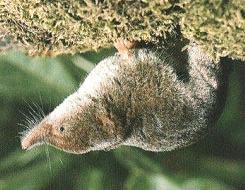
5 iii ABSTRACT The evolutionary tree of mammals is being resolved quickly. Complete mitochondrial DNA sequences are valuable data for deep mammalian phylogenetic relationships. From this study, the use of long-range PCR followed by short-range PCR and sequencing was proven to be a successful strategy for sequencing complete mt-genomes. This method is more efficient and cheaper than current cloning approaches. This method is also able to avoid most of the nuclear mitochondrial copies. Long branch attraction is a problem confusing the deep mammalian phylogeny. By sequencing complete mt-genomes of key taxa (2 marsupials, 2 bats, a pika, a gymnure, a rodent and a shrew) to break up long branches, this study resolve some ambiguous relationships in mammalian phylogeny. The 8 mammalian mitochondrial DNA sequences from this study give additional support for the 4 groupings (Xenarthrans, Afrotheria, Supraprimates and Laurasiatheria) of placental mammals from current molecular studies. Some of the ambiguous relationships of higher mammalian relationships also get improved resolution. Bats are a monophyletic group but megabats may be paraphyletic. Eulipotyphla is a monophyletic group and deepest in the Laurasiatheria. Rodents are monophyletic and apart from a problem with the tree shrew, are sister to lagomorphs (Glires). With the new gymnure complete mt-dna available, the aberrant hedgehog mt-genome is returning to its traditional position in the placental tree and joins other Eulipotyphla (mole, shrew). This monophyletic Eulipotyphla is observed for the first time in the mammalian mitochondrial tree. The Erinaceidae (hedgehog and gymnure) and murid rodent seem to be under different processes of evolution and are attracted to the outgroups. By comparing trees without outgroups (unrooted trees) and with outgroups (rooted trees) and by constraining group(s) with unstable positions, the influence of marsupials/platypus outgroups on Erinaceidae and murid rodent can be investigated. The results from this study suggest that there is a long branch attraction problem between marsupials/platypus outgroups and murid rodent and Erinaceidae; the basal postions of Erinaceidae and murid rodent found in previous studies may be long branch attraction artifacts. The resolved mammalian tree will be the basis for further molecular studies for estimating the time of divergence of extant mammalian orders, for the prediction of protein secondary structure, for the processes of transition of nucleotides and amino acids sequences in the tree, etc. Having a resolved mammalian tree is not the end for this research, rather a pivotal step for understanding evolution in molecular level.
6 iv TABLE OF CONTENTS Acknowledgements...ii Abstract...iii Table of contents...iv Chapter 1 Introduction 1.1 Fossil records and mammal evolution Morphology versus molecules in mammal phylogeny Theria and marsupionta Systematics of placental mammals Xenarthra Afrotheria Supraprimates Laurasiatheria Rooting the placental tree Explosive radiation after K-T boundary VS before K-T boundary radiation Congruence of morphological and molecular characters Mitochondrial genomes and mammalian evolution Origin and structure of mitochondrial DNA Advantages of mitochondrial genome in molecular phylogenetic studies Mitochondrial genomes for deep-level mammalian phylogenetic reconstruction Pitfalls of using mitochondrial DNA in phylogeny Phylogenetic inference The neutral theory of evolution Tree reconstruction Evaluation of tree reconstruction Assessing the reliability of individual branches Problems of inconsistency Rooting evolutionary tree The molecular clock...39 Reference list... 41
7 v Chapter 2 Material and methods 2.1 Introduction Development of long-range polymerase chain reaction Primer design Sequencing complete mitochondrial genomes DNA extraction Polymerase Chain Reaction, PCR PCR product purification PCR product quantification Cloning Sequencing Data alignment Programs used for phylogenetic inference in the present study Reference list Chapter 3 Results Background and Overview of my contribution Yu-Hsin Lin and David Penny (2001) Implications for bat evolution from two new complete mitochondrial genomes. Molecular Biology and Evolution 18(4): Matthew J Phillips, Yu-Hsin Lin, Gabrielle L. Harrison and David Penny (2001) Mitochondrial genomes of a bandicoot and a brushtail possum confirm the monophyly of australidelphian marsupials. Proceedings of the Royal Society of London Series B- Biological Sciences. 268: Yu-Hsin Lin, Peter J Waddell and David Penny (2001) Pika and vole mitochondrial genomes add support to both rodent monophyly and Glires. (submitted to Gene) Yu-Hsin Lin, Patrica A McLenachan, Alica R Gore, Matthew J Phillips and David Penny (2001) Four new mitochondrial genomes, and the stability of evolutionary trees of mammals. (prepare to submit to Molecular Biology and Evolution ) Chapter 4 Discussion 4.1 Is our strategy: long PCR short PCR sequencing successful?
8 vi 4.2 Data alignment and database manipulation General conclusions from this study How reliable is the tree from mt-genomes? Are the trees inferred consistent with palaeontological and biological evidence? Future perspectives Future progress in mammalian mitochondrial tree Secondary structure prediction and phylogenetic inference Application of the mammalian mitochondrial tree: molecular evolution, timing Reference list...151
9 Chapter 1 Introduction 1 Chapter 1 Introduction After decades of research, morphologists have identified 18 extant mammalian orders. Although the composition of the orders is, apart from Insectivora, well established, there is much less agreement on the phylogenetic relationship between these orders (Simpson, 1945; Novacek, 1992). Overall, trees constructed from DNA sequences agree extremely well the composition of the orders with those constructed with morphological data. However, molecular studies of some ordinal relationships and divergence times largely contradict morphological studies, (for example, Waddell et al., 1999a; Waddell et al., 1999c; Murphy et al., 2001; Madsen et al., 2001) and these discrepancies must be resolved. 1.1 Fossil records and mammal evolution More than 85% of mammalian genera are extinct (Novacek, 2001). These mammalian fossils provide direct evidence for mammal evolution and are essential for calibrating times of divergence. From the studies of homologous characters between these fossils and living mammals we can trace the evolutionary history of modern mammals. The first mammal-like form that appears in the fossil record is from late Triassic period, at least 225 million years ago (Mya). They are small shrew-like animals, no longer than a few centimeters. Through the Mesozoic period, the largest mammals were no bigger than a small cat (Rougier and Novacek, 1998; Novacek, 1997). Modern forms of Mesozoic mammals are restricted to a few lineages: monotremes, marsupials and possibly lipotyphylan insectivores. No other representatives of a modern therian order have ever been unambiguously identified from the Cretaceous (Stucky and Mckenna, 1993; Novacek, 1993; Normile, 1998). Earlier evidence of possible fossils of contemporary mammals from the Mesozoic period had been discounted and attributed to either incorrect identification or mis-dating (Alroy, 1999; Benton, 1999a).
10 Chapter 1 Introduction 2 The fossil record of Mesozoic mammals is poor and mainly consists of teeth, hence the relationships of these fossils to modern mammals are based on analyses of dental characters (Wyss, 2001). Mammalian teeth are complex and diverse, and convey a great deal of information on phylogeny (Rougier, 1998). However, teeth alone can be unreliable taxonomic characters, and the evolution of teeth can be convergent; that is, distantly related mammals can have teeth that look very similar (Easteal, 1999; Zimmer, 1999). However, it seems a number of these Mesozoic mammalian lineages have diversified to different dental forms which implies they ate different kinds of foods (Novacek, 1997). Dental characters may differentiate closely related groups but may not be appropriate for inferring deep phylogenetic relationships within the mammals. Skeleton characters are also not very reliable for inferring deep divergences within mammals. Recently, a nearly complete skeleton of an early-cretaceous symmetrodont mammal (a common ancestor of both marsupial and placental mammals) was discovered in China. The mosaic assembly of ancestral and modern characters in this symmetrodont mammal demonstrates that homoplasies in skeletal characters are common in early mammals (Rich et al., 1997; Hu et al., 1997). Because of the scarcity of the mammalian fossil record in this period, many times a new fossil does not fill a gap (Rougier and Novacek, 1998) and new fossils may change our previous interpretation about the evolutionary history of the group as a whole. For example, an Australian Tribosphenic mammal fossil found by Rich et al. (1997) may rewrite the history of mammal evolution. Tribosphenic mammals have complex molars and are the most important dental feature of marsupials and placentals (Luo et al. 2001). Rich et al. (1997) put this fossil mammal as an ancestral placental. It has long been assumed that terrestrial placentals entered Australia no earlier than 5 Mya, from another part of Euroasia. The discovery of the 120 Mya Tribosphenic mammal in Australia pushes back the Australian record of terrestrial placentals by at least 100 million years. A new hypothesis was proposed to modify the traditional one that placental and marsupials originate from the Laurasia supercontinent that occupied the north hemisphere (Luo et al., 2001; Weil, 2001). Except for some possible insectivore fossils, the great majority of modern mammalian orders are first identified in the late Paleocene to early Eocene (about Mya) with
11 Chapter 1 Introduction 3 no record in the Cretaceous (Stucky and Mckenna, 1993; Normile, 1998). Compared to Mesozoic mammal fossil records, Tertiary fossils are not only abundant but also have clear relationships to modern mammals. Even with these plentiful fossils records, some groups of mammals are well represented, others are still incomplete. DNA sequence data can be obtained for extant mammals and used to infer phylogenetic relationships within and between orders. In addition, DNA can be obtained from fossils less than 100,000 years old (Poinar, 1999; Lindahl, 2000); however fossils from this time interval would not resolve mammalian ordinal relationships which date back at least 60 million years. One of the difficulties with getting DNA from fossils older than 100,000 years is the preservation of biomolecules. Some tests have been developed to evaluate the preservation of key molecules in the fossil specimens through evaluating racemization of amino acids (Kelman and Moran, 1996; Bada et al., 1999). If the specimen failed the test, even if PCR and sequencing works for this specimen, the genuineness of the DNA can be questioned. Contamination is also a big problem for ancient DNA studies. Some claims of obtaining DNA seauences from dinosaur fossils in Cretaceous era are proven to be wrong and can be contamination of human DNA (Hedges, 1995). Most fossils have been touched by different people or animals and it is very hard to prevent all possible contamination sources. Most laboratories dealing with ancient DNA have developed strategies to minimize contamination. Even with the difficulties mentioned above, fossil DNA has been successfully extracted from different tissues and even faeces (Stokstad, 1998) and used to study human evolution (Relethford, 2001; Adcock et al., 2001; Ovchinnikov et al., 2000; Hoss, 2000) and that of different animals (Hofreiter et al., 2000; Loreille et al., 2001; Cooper et al., 2001). 1.2 Morphology versus molecules in mammal phylogeny Morphological and palaeontological studies are thought of as traditional approaches to phylogeny, whereas molecular studies are supposed to be modern techniques, which may challenge traditional views. The fact that morphological and molecular trees often agree, shows that these two disciplines can complement each other. In a morphological study, finding homologous characters is the first step toward inferring phylogenetic relationships. It is hard to exclude convergent characters, for
12 Chapter 1 Introduction 4 example the teeth and skeleton homoplasy as mentioned above. For deep mammalian phylogeny, morphological data are unable to give enough resolution for relationships (see Fig 1.1) even when more characters are used (Novacek, 1992; Allard et al., 1999; Gura, 2000). Over such a long time period ( Mya) more analogous characters than homologous characters can be accumulated. DNA sequences also suffer from reverse and multiple changes. By using longer sequences and choosing appropriate genes with a suitable evolutionary rate for the period of interest, this problem can be overcome. Compared to morphological characters, the advantages of using sequence data for reconstructing evolutionary trees are more than this. Penny et al. (1990) summarized the advantages which include: their wide scope; different range of evolutionary rates; large number of characters; easier use of objective methods for building and testing trees; the use of information from mechanisms of nucleotide changes; easier data handling; the lower cost of obtaining information; and the predictability of finding useful characters. The fast advance of DNA sequencing technology and tree building methods make molecular phylogenetics a practical approach. Some major differences between morphological trees and molecular trees in mammals are show in Figs 1.1 and 1.2. The details of these conflicts are discussed below. 1.3 Theria and marsupionta Traditionally, there has been a general consensus that monotremes (Prototheria) represent the earliest branch among mammals. The remaining mammals (Theria) are subdivided into two infraclasses, marsupials (Metatheria) and placental mammals (Eutheria) (Simpson, 1945; Novacek, 1992). Nucleotide sequences from whole mitochondrial DNA (Janke et al., 1996; Janke et al., 1997) and a DNA hybridization study (Kirsch and Mayer, 1998) put monotremes and marsupials as sister groups. This is a weak form of the marsupionta hypothesis first proposed by (Gregory, 1947) who had monotremes within marsupials. Though the bootstrap support was very high for this monotreme-marsupials relationship in Janke et al. (1997), it still needs more careful investigation.
13 Chapter 1 Introduction 5 Figure 1.1 Morphological tree adapted from Novacek, (1992) Primates Scandentia (tree shrew) Dermoptera (flying lemur) Chiroptera (bat) Insectivora (golen mole) Insectivora (mole, shrew, hedgehog) Carnivora (cat, dog, seal) Cetacea (whale) Artiodactyla (cow, hippo) Perissodactyla (horse,rhino) Hyracoidea (hyrax) Proboscidea (elephant) Sirenia (manatee, dugong) Tubulidentata (aardvark) Macroscelidae (elephant shrew) Rodentia (mouse, vole, guinea pig) Lagomorpha (rabbit, pika) Xenarthra (armadillo, sloth) Pholidota(pangolin) Marsupials (possum, bandicoot) Monotreme (platypus, echidna)
14 Chapter 1 Introduction 6 Fig 1.2 Molecular tree adapted from Madsen, et al., (2001); Murphy, et al., (2001); and Lin, et al., (2001a). Dashed line: no complete mt-dna data available. Primates Euarchonta Scandentia (tree shrew) Dermoptera (flying lemur) Lagomorpha (rabbit, pika) Glires Rodentia (mouse, vole, guinea pig) Eulipotyphla (mole, shrew, hedgehog) Chiroptera (bat) Carnivora (cat, dog, seal) Pholidota (pangolin) Cetacea (whale) Artiodactyla (cow, hippo) Perissodactyla (horse,rhino) Paenungula Proboscidea (elephant) Sirenia (manatee, dugong) Hyracoidea (hyrax) Macroscelidae (elephant shrew) Chrysochloridae (golen moles) Tenrecidae (tenrecs) Tubulidentata (aardvark) Xenarthra (armadillo, sloth) Marsupials (possum, bandicoot) Monotremes (platypus, echidna)
15 Chapter 1 Introduction 7 As mentioned later in section 2.6.6, rooting a tree can be problematic due to the long branch attraction problem, especially when rooting with a very distantly related outgroup. Currently, the only available outgroups for rooting the mammalian tree are from reptiles, birds and amphibia (Waddell et al., 1999b; Janke et al., 1996; Janke et al., 1997; Kirsch and Mayer, 1998; Janke et al., 2001) and they have been separated from mammals for more than 310My (Benton, 1993). Different evolutionary rates in the outgroup and the ingroup can cause problems. For example, a high evolutionary rate in crocodilian mitochondrial genomes (Janke et al., 2001) and a slow evolutionary rate in monotremes (Kirsch and Mayer, 1998) can make monotremes and marsupials come together. Recently discovered symmetrodont fossil in China still give strong support for the Therian hypothesis, separating the marsupial-placental clade from the monotreme clade by a number of evolutionary steps (Hu et al., 1997; Rougier and Novacek, 1998). The question of how to root the mammalian tree is still unsolved. Possible solutions to root the mammalian tree using molecular data are: including more taxa from ingroups (monotremes, marsupias and eutherians) and outgroups; choosing taxa with appropriate rates, using algorithms robust to rate variation; and comparing analyses from nuclear genes. For this current study, complete mitochondrial genomes from two marsupials, a possum and a bandicoot were sequenced to get a better estimate for eutherian rooting. 1.4 Systematics of placental mammals Compared to morphological studies in some ambiguous mammal relationships, many molecular studies seem to give more congruent results (Novacek M. J., 2001). Recent molecular studies recognize 4 groups in the placental tree (Fig 1.2) (Waddell et al., 1999c; Murphy et al., 2001; Madsen et al., 2001; Eizirik et al., 2001). The four groups are: Xenarthra Afrotheria Supraprimates Laurasiatheria Each group is discussed below.
16 Chapter 1 Introduction Xenarthra All morphological studies confirm Xenarthra (armadillos, sloth and anteaters) as a monophyletic group and also as an early (even the earliest) branch to the eutherian radiation. Evidence from morphological studies supported the orders Xenarthra and Pholidota (pangolins) as a superorder Edentata (Novacek, 1992; Gaudin et al., 1996). Other morphological studies did not agree with this relationship and found most of the alleged synapmorphic characters are ambiguous or homoplastic (for example, Rose and Emry, 1993). Recent molecular studies using both nuclear and mitochondrial DNA sequences (Van Dijk et al., 1999; Waddell et al., 1999c) agree with Xenarthra as a monophyletic group but put Pholidota more closely related to Carnivora. The root for the molecular trees comes either, between Xenarthra plus Afrotheria and the rest of placetal mammals, or on the branch leading to Afrotheria (Murphy et al., 2001; Madsen et al., 2001). At present there is only one complete mitochondrial genome from Xenarthra available (armadillo - Arnason et al., 1997). Early results using this sequence lead to a novel hypothesis suggesting that armadillo is a sister group to Cetferuungulata (carnivores, perissodactyls and cetartiodactyla). On this analysis the hedgehog or rodents were the deepest branch in the eutherian tree, instead of armadillo (Arnason et al., 1997). A more recent study incorporating additional complete mitochondrial genomes (mole - Mouchaty et al., 2000b) shows that armadillo tending to group with the Afrotheria (elephant, tenrec and aardvark), or become a single branch with unstable position. In contrast to the current mitochondrial tree, there is mixed support from nuclear DNA studies for an early branch leading to Xenarthra. A sloth complete mitochondrial genome is being sequenced from our laboratory in order to break the long branch leading to armadillo. In addition to the sloth sequence, in this current study, I also sequenced two new mitochondrial genomes, a gymnure and a vole to break up the long branches leading to hedgehog and mouse/rat respectively and hope the root of placental tree can be settled. Our results are more congruent to the
17 Chapter 1 Introduction 9 morphological and nuclear tree: Xenarthrans are closer to the outgroup and hedgehog and rodents are not as deep as we previous assumed (see Results) Afrotheria Afrotheria includes the seven orders of Proboscidea (elephants), Sirenia (manatees and dugongs), Hyracoidea (hyraxes), Macroscelidea (elephant shrews), Tubulidentata (aardvarks), Chrysochloridae (golden mole) and Tenrecidae (tenrecs) (Fig1.2) (Stanhope et al., 1998; Stanhope et al., 1998; Springer et al., 1997; Lavergne et al., 1996). This new relationship of eutheria was proposed from molecular studies. Except the superorder: Paenungulata (Sirenia, Proboscidea, and Hyracoidea) which was well supported from morphological analysis (Novacek, 1992; Prothero, 1993; Fischer and Tassy, 1993) there is not a single morphological synapmorphy that supports this morphologically diverse clade of African origin (Asher, 1999). From morphology: aardvark is closer to hoofed mammals (Artiodactyla, Perisodactyla and Paenungulata) (Shoshani, 1993; Fischer and Tassy, 1993) golden mole and tenrec are part of Lipotyphla (see section 1.4.4) (MacPhee and Novacek, 1993) elephant shrew is the sister group of lagomorphs (Novacek, 1992). From paleontological evidence, members of the Afrotheria contain several lineages of primarily African origin (Benton, 1993). Molecular clock estimates suggest the origin of this clade in the mid-cretaceous, at a time when Africa was isolated from the rest of the world (Hedges, 2001) (see also Fig 4.1). This implies that the seven groups may come from a common ancestor in Africa and diverged into different forms of mammals. Recently, a more comprehensive nuclear gene analysis placed Afrotheria in a basal position (Madsen et al., 2001; Murphy et al., 2001) to the rest of placentals. It has long been argued that insectivores retain many primative features and may be closer to ancestral stock of mammals. The monophyletic status of insectivora had been based on their derived anatomical characters and was dissolved when golden moles and tenrecs were found to belong to Afrotheria. A basal position of Afrotherian is possible in this respect.
18 Chapter 1 Introduction Supraprimates Archonta The superorder Archonta, which was recognized from morphological studies including: Primates, Scandentia (tree shrews), Dermoptera (flying lemurs) and Chiroptera (bats) (Novacek, 1992). Trees inferred from mitochondrial DNA (Adkins and Honeycutt, 1991) and nuclear genes (Miyamoto et al., 2000; Murphy et al., 2001; Madsen et al., 2001) suggest bats are not part of Archonta. Analyses using the complete mitochondrial DNA of bats also place them as a sister group to Fereuungulata (Carnivora + Perissodactyla + Cetartiodactyla), (Pumo et al., 1998; Nikaido et al., 2000; Lin and Penny, 2001). A more recently morphological study using tarsal and dental characters supported Archonta monophly but excluding bats (Hooker, 2001). Archonta would be a monophyletic group if bats are included; without bats, the rest of this group (Primates, Scandentia and Dermoptera ) is monophyletic and called Euarchonta (Waddell et al., 1999c). It was suggested by early nuclear data that Euarchonta and Glires (rabbits and rodents) may be sister groups (Miyamoto and Goodman, 1986; Miyamoto, 1996) called Supraprimates (Lin et al., 2001a). Most recent nuclear data, which included more taxa in the analysis, gave strong support of this group. However the position of Scandentia and Dermoptera varies within this group (Murphy et al., 2001; Madsen et al., 2001). Mitochondrial DNA analysis initially did not support this Supraprimate association (for example, Reyes et al., 1998; Schmitz et al., 2000) in the rooted tree. However, the inclusion of our two new complete mitochondrial genomes (pika and vole), gives strong support for this group (although the position of tree shrew varies within this group) (Lin et al. 2001b). Glires The superorder, Glires, as defined by morphological analysis (Novacek, 1992) includes Lagomorpha (rabbits and pikas) and Rodentia (Fig 1.1). This grouping was not supported by most early molecular studies (for example, Graur et al., 1996; Gissi et al., 1998). Even the monophyly of rodents have been challenged by analysis using complete mitochondrial DNA (D'Erchia et al., 1996) and nuclear DNA (Graur et al., 1991; Li et al., 1992) and this questions has become the subject of a hot debate in the
19 Chapter 1 Introduction 11 literature. A reanalysis of D Erchia s mitochondrial DNA data set with three additional taxa included, a tree showing not only rodent monophyly but also monophyly of Glires (though with low bootstrap support; Philippe, 1997). Some molecular studies support rodent monophyly (Robinson-Rechavi et al., 2000; Frye and Hedges, 1995) The recently published papers with more comprehensive taxa included in the data set gave strong support for both Glires and rodent monophyly (Philippe, 1997; Murphy et al., 2001; Madsen et al., 2001). Including pika and vole complete mitochondrial sequences successfully broke up the long branches leading to the rabbit and mouse/rat lineages. Glires was recovered and joined Euarchonta as a sister group the Supraprimates (Lin et al., 2001a). There is still however some uncertainty based on mitochondrial genomes of the position of the tree shrew (tupaia). It is within Supraprimtates but tends to oscillate between Euarchonta and Glires Laurasiatheria This group (without bat, hedgehog and mole) was first proposed from mitochondrial genomes (for example, Xu et al., 1996). Subsequent analyses using whole mitochondrial sequences of bats and the mole showed that both of them joined deeply to this group (Pumo et al., 1998; Mouchaty et al., 2000a). That hedgehog belongs to this group is supported by nuclear data analysis, but so far not from mitochondrial DNA. The lineages belonging to this group includes Eulipotyphyla (mole, shrew, hedgehog), Chiroptera (bats), Cetacea (whales), Artiodactyla (cow, hippopotamus), Perissodactyla (horse, rhinocerous) and Carnivora (dog, seal) (Fig 1.2). A pangolin mitochondrial genome is not yet available but on nuclear data they are within this group and the sister taxon of Carnivora (Madsen, et al. 2001). The relationship of different lineages within Laurasiatheria is not settled yet. From morphological analysis, Perissodactyla (horses and their relatives) is either a sister group to Paenungulata (elephants, manatees and hyraxes) or nested within the Paenungulata (Novacek, 1992; Prothero, 1993). Contrary to morphological claims, molecular data indicate that the order Perissodactyla is neither part of the superordinal taxon Paenungulata, nor an immediate outgroup of the paenungulates. Rather,
20 Chapter 1 Introduction 12 Perissodactyla is closer to Carnivora and Cetartiodactyla (Cetacea + Artiodactyla) than it is to the Paenungulata. Some previous analyses of mitochondrial proteins strongly support the Carnivora/Perissodactyla grouping excluding Cetartiodactyla (Artiodactyla + Cetacea) as an outgroup (Xu et al., 1996). Whereas, using nuclear genes and/or mitochondrial genes, Perissodactyla is closer to Cetartiodactyla than either taxon is to Carnivora (Stanhope et al., 1996; Graur et al., 1997). Other recently published papers also have mixed results and this may indicate a possible trichotomy that evolved in a short period of time. Analyses using the complete mitochondrial genome of a mole (Mouchaty et al., 2000a) indicated a close relationship of Chiroptera/Eulipotyphla (i.e, bat/mole) clade. Reanalysis of the mitochondrial genome data also gave a strong support for this relationship (Cao et al., 2000). When we included the genomes of two more Chiroptera (New Zealand long-tailed bat and little red flying fox) in the analysis, this relationship becomes locally stable. Mole can become a sister taxon to the rest of Laurasiatheria including bats (Lin and Penny, 2001). Position of whale Whales are an interesting topic for evolutionary study because their rich fossil records acoss the land - water transition. The position of whale is an important calibration point in the timing of the placental lineage because there are many whale fossils that date to Mya (Bajpai and Gingerich, 1998; Arnason et al., 2000). Traditionally, cetaceans and their extinct terrestrial ungulate relatives, the mesonychids have been a sister group to the Artiodactyla [even-toed hoofed mammals]. Molecular studies showed that cetaceans are not a sister group to Artiodactyla but are nested within Artiodactyla (Graur and Higgins, 1994). Mitochondrial sequences (Montgelard et al., 1997; Ursing et al., 2000; Ursing and Arnason, 1998) and nuclear sequences (Gatesy et al., 1999; Kleineidam et al., 1999; Shimamura et al., 1997) put hippopotamus as their closest relatives. The use of retrotransposons: short interpersed repetitive elements (SINEs) is becoming an important marker for phylogeny (Shedlock and Okada, 2000). Studies using SINEs gave strong support for this whales hippos sister relationship (Shimamura et al., 1997; Shimamura et al., 1999; Nikaido et al., 1999,
21 Chapter 1 Introduction 13 Shedlock et al., 2000). That is, Artiodactyla is a paraphyletic group. In other words, whales were artiodactyls that became adapted to aquatic life. Though all the molecular evidence seems very congruent in the position of whale, one recent morphological study argued the importance of the fossil record in recovering the tree. When all fossils are removed from the analysis, Artiodactyla is paraphyletic with Cetacea nested inside, indicating that inclusion of mesonychians and other extinct stem taxa in a phylogenetic analysis of the ungulate clade is integral to the recovery of artiodactyl monophyly (O'Leary and Geisler, 1999). This argument is irrelevant when using sequence data unless there is convergent evolution leading to the grouping of whales and hippopotamus. Considering the fact that sequences from different genes all converge to the same tree, the evidence from molecular studies is very convincing. The other option is that mesonychians are not ancestral to whales and that homologous characters supporting this linkage (based on similarities in the teeth) are misleading. A whale specimen found in Pakistan weakens the link between the whales and mesonchians (Thewissen et al., 1997; Normile, 1998) can be a first step for this option. The phylogenetic relationships among the major groups of whales remains hotly debated. In the traditional morphological grouping, cetaceans are divided into two monophyletic suborders: Odontoceti (toothed whales) and Mysticeti (baleen whales). Molecular studies from Milinkovitch s group suggest another relationship. One group of toothed whales (the sperm whales) is more closely related to baleen whales than to other toothed whales (Milinkovitch et al., 1993; Milinkovitch et al., 1994; Milinkovitch et al., 1995; Hasegawa et al., 1997). On the other hand, evidence from SINEs supported the traditional grouping of Odontocetes as a monophyletic group (Nikaido et al., 2001). Considering the proposal of Odontoceti paraphyly was from short fragments of ribosomal RNA genes (Milinkovitch et al., 1993), this hypothesis is worth of testing with longer sequences. A complete mitochondrial genome from Hector s dolphin was sequenced in our laboratory and combined with two baleen whales (blue whale and finback whale) and one sperm whale in order to give more evidence for their relationships.
22 Chapter 1 Introduction 14 The problems with bats Historically, chiroptera has been considered as a monophyletic group and includes two suborder, Microchiroptera or microbats, and Megachiroptera or megabats. However a study of visual-brain nervous pathways suggested that Megachiroptera are more closely related to primates than to Microchiroptera (Pettigrew, 1986; Pettigrew et al., 1989). Molecular studies upheld the traditional morphological view this time with all the genes supporting bat monophyly (Mindell et al., 1991; Van Den Bussche et al., 1998; Nikaido et al., 2000). A high A-T base composition was found in bat genomes, in DNA hybridization studies (Kirsch and Pettigrew, 1998; Pettigrew and Kirsch, 1998; Pettigrew, 1994) and was suggested that this was the reason trees based on molecular data showed that bats were monophyletic. However the gene sequences used for molecular studies did not have a high A-T bias. Another relationship inferred from molecular analyses is the sister relationship of Rhinolophorous bats to Megachiroptera (Hutcheon et al., 1998; Teeling et al., 2000). If Rhinolophorous bats are indeed closely related to Megachiroptera, many synapomorphies of Microchiroptera require re-investigation. For example, this implies echolocation in microbats originated in the common ancestor of bats and has been lost in megabat lineage (Springer et al., 2001b). A Rhinolophorous bat complete mitochondrial DNA was sequenced in our laboratory in order to test this relationship (Lin et al., 2001a). Insectivora The term insectivore is used in two ways. One is based on ecological/life history, an animal that primarily lives on insects. The second is a taxonomic group, the Insectivora. The two usages are distinguished by capitalizing (or not) the first letter. Traditionally, members of the order Insectivora are regarded as descendents from a single common ancestor and it is comprised of the following families: Soricidae (shrews), Talpidae (moles), Erinaceidae (hedgehogs and gymnures), Solenodontidae (solenodons), Chrysochloridae (golden moles) and Tenrecidae (tenrecs) (MacPhee and Novacek, 1993). Tree shrew and flying lemurs were once placed in this group (Simpson, 1945). MacPhee and Novacek (1993) reviewed this group using morphological data and placed flying lemurs in the order Dermoptera and tree shrew
23 Chapter 1 Introduction 15 in the order Scandentia, both are closer to Primates. The remaining insectivore lineages represent a monophyletic group known as Lipotyphyla. The order Insectivora is among the least stable of the higher taxa in placental mammals, both in its contents and in its phylogenetic position in the mammalian tree. The different hypothesis arise from the identification of homologous characters, classification Insectivora into 2 or 3 suborders (Butler, 1988; MacPhee and Novacek, 1993). Recent molecular studies from mitochondrial and nuclear genes put golden moles and tenrecs into a clade with endemic African mammals: Afrotheria (see section 1.4.2) (Springer et al., 1997; Stanhope et al., 1998; Springer et al., 1999). The association of golden moles and tenrecs had been proposed before (Butler, 1988) but their relationships with other Afrotherian were never suggested from morphological studies. The fossil records of these two clades were restricted to Africa (MacPhee and Novacek, 1993; Hedges, 2001) which gives interesting support for this Afrotherian superorder. The rest of the Insectivora, the hedgehog, mole and shrew remain as the Eulipotyphla (Waddell et al., 1999c). From complete mitochondrial DNA analysis, hedgehog and mole do not form a monophyletic clade. Mole can be joined with bat as a sister group, deep in the Laurasiatheria (Mouchaty et al., 2000a, see above). Analyses using the complete mitochondrial DNA sequence of hedgehog put it as sister to all the rest of placental mammals (Krettek et al., 1995). The position of hedgehog will be discussed in the next section. 1.5 Rooting the placental tree As mentioned in section 1.4.1, Xenarthra may be an early branch of the eutherian tree. Insectivora can also be a candidate as the deepest branch in the eutherian tree because of their primitive features. It is almost certain that the earliest placentals (and marsupials) were insectivores, even if not members of the Insectivora. In trees inferred from nuclear genes, the basal branch of placental mammals can be Afrotheria and/or Xenarthra (Murphy et al., 2001; Madsen et al., 2001). In trees inferred from complete mitochondrial genomes using monotremes and marsupials as
24 Chapter 1 Introduction 16 the outgroups, hedgehog is an earlier branch among placental mammals followed by rodents (Krettek et al., 1995; Mouchaty et al., 2000a; Mouchaty et al., 2000b; Mouchaty et al., 2001). The hedgehog sits on a very long branch in the mammalian tree and has the largest base composition shift in the nucleotide and amino acid sequence data (Penny et al., 1999; Waddell et al., 1999b). In theory, this long edge can be attracted to the monotreme/marsupials outgroup. The basal position of hedgehog is suspect in this respect. For this reason, most studies exclude hedgehog from their data set and analysis (for example, Pumo et al., 1998; Schmitz et al., 2000; Reyes et al., 1998; Cao et al., 2000). If hedgehog was removed from the analysis then the branch leading to murid rodents becomes basal (Janke et al., 1994; Janke et al., 1996; Janke et al., 1997; Reyes et al., 2000). The murid rodents have a fast evolution rate (Gissi et al., 2000; Pesole et al., 1999; Philippe, 1997) so the rooting on rodent may also be unreliable, in addition this contradicts both the morphological evidence and nuclear DNA analysis. In our analysis of mitochondrial genomes, we include two new genomes, gymnure and vole, to break the long branches leading to hedgehog and rat/mouse respectively, the root of placental mammals can fall on the branch leading to the Afrotheria and/or Xenarthra (see section 1.4.1). When more and more genomes become available, the placental tree will be more stable and the rooting problem will be able to be solved. 1.6 Explosive radiation after K-T boundary VS before K-T boundary radiation It has been suggested that the two most conspicuous events in metazoan fossil records were the dramatic origin of major new structures and body plans in the Cambrian explosion around 545 Mya and the adaptive radiations of birds and mammals after the Cretaceous/Tertiary (K/T) extinction event 65 Mya (Feduccia, 1995). As mentioned in section 1.1, most of the earliest fossils representing mammalian orders are identified only in the early Tertiary after the K-T boundary (65Myr). Mesozoic mammal fossils are relatively rare and mostly represent archaic forms (Novacek, 1992; Feduccia, 1995). The coincidence of the K-T boundary mass extinction event, the disappearance of dinosaurs, and the emergence of modern
25 Chapter 1 Introduction 17 mammal fossils led to an assumption that mammals began to diversify from a few primitive mammals, after ecological niches were released by the demise of the dinosaurs. The discovery that a large asteroid or comet struck the earth at the end of the Cretaceous period, 65 Mya, coupled with long term climatic changes (Kyte, 1998) made this hypothesis appear attractive. Some researchers still doubt how widespread this catastrophe and its global effects were (Sarjeant and Currie, 2001) but a catastrophic event is more dramatic and attractive to the public and this made the K-T boundary radiation hypothesis so popular. The fossil record is often thought of as the only direct evidence of evolutionary history but this direct evidence depends on phylogenetic interpretation of the fossils - the homologous characters in morphology are also an inference. There are still no ways to tell homologous characters from convergent characters in morphology. Different explanations of fossil records can dramatically change the perception of evolutionary history. Many analyses of mitochondrial and nuclear DNA have estimated divergence times using a molecular clock (The definition of divergence times of an order is different from the first appearance of diagnosable characters or origin of the crown group, see Fig 1.3). There are a few serious discrepancies between fossil dating and molecular dating - one of these is the appearance of modern mammalian orders (Benton, 1999a). From molecular studies, the divergence time scale was pushed further back to the middle to early-cretaceous and the divergence between these mammal lineages are very deep (Penny et al., 1999; Hedges et al., 1996; Kumar and Hedges, 1998; Waddell et al., 1999a; Eizirik et al., 2001). In response to the challenge from molecular dating, Novacek, (1999) recalibrated the divergence times on fossil records, he claims that the radiation of mammals orders after the K-T boundary is still well supported. Does the fossil record underestimate divergence times of mammalian lineages or does the molecular clock go too fast? The discrepancies between fossils evidence and molecular dating can be explained in the following three aspects.
26 Chapter 1 Introduction 18 Divergence time of an order First appearance of diagnosable characters Origin of the crown group New order Fig 1.3 Three ways to define the time of origin of groups (such as a mammalian order). Molecular estimates give the time a lineage diverged from related forms, and is the oldest of the three estimates. The diagnosable criterion is when characteristic features of the new group are recognized in fossils. It must be more recent from the time of divergence, but how much so depends partly on the completeness of the fossil record. The third criterion is the crown group and is timed from the most recent common ancestor of all extant members of the group. Each of the three timings is valid, but some of the disagreement between molecular and paleontological results comes from measuring different aspects of the process.
27 Chapter 1 Introduction The molecular clock varies too much (Benton, 1999b; Normile, 1998). It is suggested that during the early Tertiary, mammals experienced a high rate of evolution caused by dramatically environment change. However, the overall rate (that controls the rate of molecular evolution) is controlled by at least 70 genes (Yu et al. 1999). Arbitrary speeding up and slowing down in many different lineages is just not possible. From the mechanism of DNA mutation, morphological changes for radiative adaptation need only a few genes and the overall rate of DNA replacement may not have major change. The molecular clock can run at different rate in different lineage, different genes and even different time. Some works have been done in this respect either by doing a relative rate test or restricting their analysis to those genes with no rate difference (Hedges et al., 1996; Kumar and Hedges, 1998). 2. The fossil record is too incomplete and there are many older fossils waiting to be recovered (Bromham et al., 1999; Lee, 1999). The Cretaceous representatives of the modern mammals were small and fragile and hard to preserve as fossils. Even had they left some fossils, they may not contain enough synapomorphic characters for their relationship to be identified. Cooper and Fortey, (1998) also suggested that the new discovery of some pre-k/t boundary fossil records (for example, Archibald, 1996; Gheerbrant et al., 1996) supports the molecular dating. But, Benton (1999) opposed this and claimed that these specimens are not proven to be members of modern orders. In addition, the fossil records of modern mammal taxa has a strong geographical bias, most of them are located in the northern hemisphere (Cooper and Penny, 1997). The possibility of Gondwanan (southern hemisphere) origin of extant placentals (Madsen et al., 2001) makes the claim of possible Mesozoic fossils in modern mammals at least possible. 3. Genetic evolution has happened without much morphological change (Cooper and Fortey, 1998). The Mesozoic mammals which lived under the dominance of dinosaurs, are mostly shrew and mouse like and difficult to distinguish in morphology even though they have evolved on a distinct lineage. Sequence evolution is more or less constant but morphological evolution can have a dramatic change from small changes in control and developmental genes. After the K-T boundary, it is possible that these mammalian lineages started a dramatic change in morphology in a short time scale.
28 Chapter 1 Introduction Congruence of morphological and molecular characters Is an exclusion of morphological and fossil information and the total dependence on molecular data necessary to recover the correct mammalian phylogenetic tree? I believe the answer is no. Molecular data confirm, supplement or modify our understanding of traditional phylogenetic relationships derived from comparative anatomy and fossil data. Sequences do not replace morphological characters but supplement them. There is only one evolutionary history and it may be reconstructed from different characters on different levels. Disagreements between morphological trees and molecular trees indicate that aspects of the trees must be wrong. We need to explore the differences between these two data sources and try to find out what makes them incongruent. It is not wise to ignore any evidence relevant to evolutionary history. To discover what misleads morphological or molecular tree inferences needs to be explored. One approach total evidence attempts to join both morphological and molecular characters. While the principle is basically sound, without some measurement of the reliability of the two types of data this approach may not give us better resolution of the mammal tree but make possible solutions emerge from the noise (Lapointe et al., 1999). Some researchers claim they get a good tree from total evidence. But it is possible that they choose the molecular data that can comply with the morphology tree and ignore the contradictions. For example, Allard et al. (1996) used transversions of the COII data combined with other morphological data to get a single tree similar to a morphological tree and claim Archonta monophyly (bats are part of Archonta). The author admitted however that most of the nuclear and mitochondrial genes put Archonta as a polyphyletic group (bats are not part of Archonta). The possible solution may depend on the advance of biological knowledge. Molecular studies are producing longer sequences from more and more taxa and tree building methods are becoming more consistent. In morphological studies, attempts are being made to understand the characters used for analysis, and prevent bias in analysis by using characters from fast evolving genes, or derived from the same development genes (Gura, 2000; Jablonski, 1999). For example, some characters in soft tissue may provide good signal in deep mammal phylogeny. Because the fossil evidence can only
29 Chapter 1 Introduction 21 be studied on hard tissues: bones or teeth, soft tissue characters are not available to morphologists. As mentioned above, dental traits seem prone to rapid and parallel change and are inefficient descriptions of higher mammal relationships. Some new studies used soft tissue characters and yield robust phylogenetic hypotheses that are compatible with the molecular phylogeny (Gibbs et al., 2000; Penny et al., 1982; Shoshani and McKenna, 1998). If we can prove that soft tissues are more conserved than hard tissues and are a proper character in ordinal level of mammal phylogeny, we will have more confidence in using this trait. Evolutionary history has left a signal in the DNA sequence, which can translate to protein sequences and present in morphological features. The task is how to extract the signal from the noise itself, no matter whether it is a molecular or a morphological signal. In addition to information from morphology and DNA sequence, the research of biological evolution needs to cooperate from different fields, including biogeography, structure biology, biomathematics etc. When all the results converge to a single answer, the history of life on earth will be recovered. 1.8 Mitochondrial genomes and mammalian evolution Origin and structure of mitochondrial DNA Mitochondria (Fig 1.4) evolved from free-living bacteria that long ago had a symbiotic relationship inside an early eukaryotic cell. Over the long period of time since then the genome of this endosymbiont became reduced and become specialized in its functions. Today, inside all mitochondria, is a genome separate from that of the nucleus, called mitochondrial DNA (mtdna) (Andersson and Kurland, 1999). Most of the evidence suggests that all mitochondria derive from a single endosymbiotic event, the mitochondria appearing to be monophyletic for all the life forms (Gray et al., 1999; Lang et al., 1999). Animal mitochondrial DNA is a circular double stranded DNA molecule ranging in size from 14kb to more than 42kb (Wolstenholme, 1992). Mammalian mitochondrial DNA (Fig 1.5) is about 15-18kb long and the size variations are attributed to differences in the length of the control region, some of which contain repeated sequences. The length and sequences of the control region can also have some minor
30 Chapter 1 Introduction 22 differences even in the same organism. Mitochondrial DNA molecules that are of different sizes or that contain sequence differences are found in individuals of some species, a condition known as heteroplasmy (Wolstenholme, 1992). Unlike nuclear DNA, mitochondrial DNA is not coated by protective histones and it is tethered to the inner mitochondrial membranes, close to the respiratory chain, which is a potent source of oxygen free radicals. These factors are believed to contributed to a high rate of mitochondrial DNA mutation (Chinnery et al., 2000). The gene content of animal mitochondrial DNA is nearly constant. The mammalian mitochondrial genome encodes 13 protein-coding genes which make up part of the mitochondrion protein essential for respiration, 2 ribosomal RNAs, and 22 transfer RNAs (Fig 1.5) (Boore, 1999). Between the trna-pro and trna-phe is a noncoding region. This sequence has been shown to include the signals necessary for the initiation of H-strand synthesis (replication origin); therefore it has been designated the control region. The control region is poorly conserved between species but is often useful for population studies. The L-strand synthesis origin sits between trna-asn and trna-cys and is a short sequence of about 30 nucleotides (Wolstenholme, 1992). Unlike nuclear DNA, mitochondrial DNA is tightly coded and lacks intron. The genetic code is also different from nuclear DNA. Some mammalian mitochondrial protein genes end either in T or TA, rather than a complete translation termination codon (TAA or TAG). Such incomplete stop codons can be modified by posttranscriptional polyadenylation to a complete termination codon (Chinnery et al., 2000). For its 13 protein coding genes, only NADH dehydrogenase subunit 6 is coded from the light strand, the rest are coded from the heavy strand. For RNA genes, t-gln, t-ala, t-asn, t-cys, t-tyr, t-ser, t-glu, t-pro are read from light strand and the rest are read from the heavy strand (Wolstenholme, 1992). The gene order in the mt-genome is different between major taxonomic groups (Curole and Kocher, 1999). Marsupials have a different gene order compared to placental mammals, monotremes and indeed many other vertebrates (translocation of some trnas) (Paabo et al., 1991; Gemmell et al. 1994). This rearrangement involving trnas occurs more frequently than rearrangements involving protein and rrna genes. Gene arrangement comparisons are a powerful tool for phylogenetic studies, especially for ancient relationships because rearrangements do not happen frequently (Boore and Brown, 1998; Curole and Kocher, 1999; Boore, 1999).


31 Chapter 1 Introduction 23 Fig. 1.4 Mitochondria are small, oval shaped organelles surrounded by two highly specialized membranes. Mitochondria are the sites of aerobic respiration, and are generally the major energy production center in eukaryotes. Fig Vertebrate mitochondrial genomes are normally circular, ~16 kb in length, and encode 13 proteins, as well as 22 trnas and 2 rrnas. Many organisms use one genetic code to translate nuclear mrnas, and a second one for their mitochondrial mrnas. This is an example of gene map of a complete mitochondrial genome from New Zealand longtailed bat (Chalinolobus tuberculatus).
32 Chapter 1 Introduction Advantages of mitochondrial genome in molecular phylogenetic studies Mitochondrial genomes have been popular for molecular phylogenetic studies since the 1980s (Barton, 1983). Because of the abundant copies of the mitochondrial genome in a cell and its small size, this genome is easy to isolate and study, especially for difficult specimens (subfossils, for example). Animal mitochondrial DNA offers advantages over other genes for phylogenetic analysis. Because the mitochondrial genome is haploid, comparison of paralogous genes are not a concern. While the study of nuclear sequences with PCR may require separation of allelic variants by different techniques (denatured electrophoresis, for example). Maternal inheritance and lack of obvious recombination allows direct reconstruction of a bifurcating tree topology (Chinnery et al., 2000). Heteroplasmy is rare in most of the coding regions. In mammals, the rate of nucleotide substitution for mitochondrial DNA is generally more rapid than that of nuclear DNA. Overall, mitochondrial DNA evolves at a rate 5-10 times faster than single copy nuclear DNA (Brown et al., 1979; Vawter and Brown, 1986). Uniparental inheritance also reduces the effective population size for mitochondrial DNA to reconstruct an evolutionary tree and mutations are fixed more quickly. Since the first complete mitochondrial genome sequenced in 1981 (Anderson et al., 1981), the number of complete mt-genomes sequenced has been accumulating at an increasing rate. To sequence a complete mitochondrial genome is becoming much easier since the invention of the PCR technique and the mt-genome from two fossilized birds, moa have even been sequenced completely (Cooper et al., 2001, Haddrath and Baker, 2001). Mammals have been sequenced far more extensively than others (Curole and Kocher, 1999) Mitochondrial genomes for deep-level mammalian phylogenetic reconstruction Because the rate of mutation in mitochondrial DNA is relatively fast, it was first thought that mitochondrial DNA would not be useful for resolving divergences deeper than a few million years ago (Curole and Kocher, 1999). Short sequences from a few individual genes may produce different topologies and most of the early studies using
33 Chapter 1 Introduction 25 small fragments of mitochondrial DNA sequences for deep-level mammalian phylogeny have since been shown to be wrong (Arnason and Johnsson, 1992; Cao et al., 1998). Statistical analyses have shown that stochastic effects decrease as sequences length increases (Cao et al., 1994). With the technological improvements, and availability of more and more complete mt-genomes it has been possible to resolve phylogenies deeper than was originally expected, but resolution for highly divergent lineages is still controversial. Springer et al. (2001a) compared the power of recovering bench mark clades from mitochondrial and nuclear genes respectively and concluded that the nuclear exons performed better than mitochondrial genes. In contrast, Arnason et al. (1999) suggested that the shorter expected coalescence time of mitochondrial genome may make the mitochondrial genes more efficient than nuclear genes. The better performance of nuclear genes in Springer et al. s analysis may reflect the fast evolution rate of the mitochondrial genome, with aligned mammalian mt-genome exhibiting more superimposed substitutions and higher among-site rate variation than aligned nuclear genes. It should be noted that, Springer et al. (2001a) also emphasized that complete mitochondrial genomes contain considerably more resolving power than single mitochondrial genes and have provided strong support for some of the deep-level clades that are supported by nuclear sequences. The convergence of trees from complete mitochondrial genomes and trees from nuclear genes are remarkably in agreement (see results). The possibility of getting trees with the same topology using two totally distinct DNA (nucleus and cytoplasmic) is extremely small (see the calculation in Lin et al., 2001a) and that we do, indicates that we are getting to a complete resolution of the mammalian phylogeny Pitfalls of using mitochondrial DNA in phylogeny While mitochondrial DNA possesses several advantages for phylogenetic analysis, it represents only a small amount of the organism s genome. The entire mitochondrial genome represents a single genetic marker unlinked to nuclear genes, thus patterns of variation for nuclear and mitochondrial DNA marker may not be concordant
34 Chapter 1 Introduction 26 (Harrison, 1999). Further studies of nuclear markers maybe required to confirm mitochondrial phylogeny. Rate variation between lineages It has been known that the rate of evolution in mitochondrial genomes is different in major groups of animals as well as different lineages of mammals, for example, a higher evolutionary rate is observed in birds and mammals compared to amphibians and fishes (Adachi et al., 1993). The different evolutionary rate in mammals has been well studied (Gissi et al., 2000; Adkins et al., 1996; Lavergne et al., 1996; Curole and Kocher, 1999). General conclusions from these studies are as follows: the fast - evolving orders are Primates and Proboscidea followed by Insectivora (hedgehog) and Rodentia and the slowest evolving mammals are Perissodactyla. The ratio between the fastest evolving mammals and the slowest is less than 1.8. It has been proposed that differences in the rate of substitution in different lineages may produce different phylogenies of the eutherian mammals (Holmes, 1991; Philippe and Laurent, 1998). In addition to the rate variation between lineages mentioned above, some rate differences may be hidden because some part of the gene is fast but another is slow and biases the analysis. For the tree inference methods so far, it is hard to detect such difference especially if it affects some nucleotide changes more than others. Using the methods for tree inference that are current available, one way around this problem might be to build trees with ingroups and then add outgroups. By comparing the change of ingroups when outgroups are included, the possible effects of the outgroup may be detected (see section 4.4). Mitochondrial DNA recombination One of the prevalent assumptions about mitochondria is they do not recombine. Although many study consistent with this assumption, some are not. Some evidence implied that mtdna may recombine but in very low frequency. Electron microscopy studies found that human sperm mitochondria enter the egg wherethey can potentially recombine with egg mitochondria DNA (Ankelsimons and Cummins, 1996). Kajander et al., (2000) also observed rearranged mtdna molecules, which are supposed to come from intramitochndrial recombination, present at very low level in
35 Chapter 1 Introduction 27 different tissues of human. Recently, studies using the human mitochondrial control region implied that recombination could be a possibility to explain the high homoplasy in the observed data (Eyre-Walker et al., 1999; Wallis, 1999; Morris and Lightowlers, 2000; Eyre-Walker, 2000; Hey, 2000). On the other hand, some of this is contradicted. For example, none was observed in 55 Maori samples (relative to Eastern Polynesia), which have been separated for at leat 800 years (Murray- McIntosh et al., 1998). The claim of recombination in the mitochondrial genome still needs more investigation to exclude other posibilities and to suggest a complete mechanism for such a process. If the claim of recombination is true then, estimates of the evolutionary rate within species and the assumption of a molecular clock will not be appropriat because multiple changes can be erased by recombination. Recombination would also be a big problem for population studies because the analysis of population structure can become more complex (network rather than a bifurcating tree). For the purpose of this current research, recombination is not expected to affect our tree (because it occurs at a species level) but the length of the branches and the estimate of a molecular clock will require more careful investigation. Nuclear mitochondrial DNA It is known in many taxa that different parts of the mitochondrial DNA can be incorporated into the nuclear genome and become pseudogenes (Lopez et al., 1994; Arctander, 1995; Lopez et al., 1996; Perna and Kocher, 1996; Sorenson and Fleischer, 1996; Herrnstadt et al., 1999). Nuclear mitochondrial DNA is usually a small fragment but it can be as large as 5-8kb (Lopez et al., 1994; Lopez et al., 1996; Herrnstadt et al., 1999). The frequency of incorporating fragments of mitochondrial DNA to the nuclear genome is more common than was first assumed. In one study from the mitochondrial control region of seven species of ducks it was found that the nuclear mitochondrial DNA derived from six independent transposition events, all occurring within the last 1.5 million years (Sorenson and Fleischer, 1996). The evolutionary rate of nuclear mitochondrial DNA can be much slower than mitochondrial DNA from 10 times at all positions to 39 times at the 3 rd position of mitochondrial protein coding genes (Arctander, 1995; Perna and Kocher, 1996;
36 Chapter 1 Introduction 28 Sorenson and Fleischer, 1996). While the nuclear sequences themselves are interesting, and capable of serving as valuable molecular tools they can also confound phylogenetic and population genetic studies if they are unintentionally included (Zhang and Hewitt, 1996). How can we tell we have amplified a nuclear mitochondrial DNA rather than a mitochondrial DNA? Some clues can help to identify possible nuclear mitochondrial DNA. Because nuclear mitochondrial DNA is generally non-functional, the sequence may contain multiple stop codons and/or frameshift mutations in protein coding genes. However, mitochondrial DNA that has recently transferred to the nucleus can retain high sequence identity to its mitochondrial counterpart and may not be distinguishable by stop codons, or frameshift mutations (Collura et al., 1996). Also, nuclear transfers from ribosomal RNA genes and non-coding regions are more difficult to detect because there are no reading frames. The slow evolutionary rate of nuclear mitochondrial DNA is a useful characteristic to detect the existence of nuclear copies. In this case, a tree from these sequences and some tests (relative rate test, for example) are needed to calculate this. But there is good news, as more and more complete mitochondrial genomes are sequenced, nuclear mitochondrial DNA can be identified by comparison with these. (More information and discussion about nuclear mitochondrial DNA can be found in Because the slow evolutionary rate of nuclear mitochondrial DNA, they are more conserved in sequences compared to their mitochondria partner. In PCR amplification using universal primers, nuclear mitochondrial DNA can be preferentially amplified (Collura and Stewart, 1995; Bensasson et al., 2001). The use of universal primers in PCR techniques is becoming routine in biological sciences and a number of strategies can be applied to minimize the chance of amplifying nuclear mitochondrial DNA. One is to use DNA extracted from mitochondria-rich cells such as liver and muscle (Arctander, 1995). But even the use of ultracetrifuge purified mitochondria cannot guarantee to eliminate the chances of amplifying nuclear mitochondrial DNA copies, given the power of PCR. Collura et al. (1996) suggested using RT-PCR on mrna of the mitochondrial protein coding genes to guarantee genuine mitochondrial genes are PCR amplified. The instability of RNA, and the fact that only short fragments of protein coding genes can be amplified make this approach impractical. Our strategy of
37 Chapter 1 Introduction 29 doing long-range PCR amplification of two 9 kb fragments seems to be sufficient to eliminate amplification of nuclear copies of mitochondrial DNA, and this is discussed again later. 1.9 Phylogenetic inference DNA, RNA and protein sequences contain large amount of information about their history. Phylogenetic inference is using this information to reconstruct evolutionary history that is, evolutionary trees The neutral theory of evolution Historically, before DNA sequencing, morphological analysis was used to infer evolutionary relationships. Morphological analysis demonstrated that the evolutionary rate varies markedly between lineages. Some species may remain unchanged for a long period of time, other species can evolve quite fast. Consequently it was assumed that the evolution rate at the molecular level should follow the rate in morphological level: fast evolving species have fast molecular evolution rate and vice versa. This however was not found to be the case. The studies of Motoo Kimura inferred that most amino acids changes within and between species are neutral with respect to selection (Kimura, 1983). This is the neutral theory of molecular evolution. The neutral theory can make many testable predictions, for example, a high level of genetic variability within species and molecular clock if the mutation rate is unchanged. Most of these predictions are generally supported but many features, for examples, levels of heterozygosity observed for many species were often not as high as expected under the neutral theory, cannot be explained by the simple neutral models (Page and Holmes, 1998). Some alternative models have been proposed but still fail to explain these aberrant features (Gillespie, 1994). Evolution in molecular level is more complicated than we expected. The fast accumulation of sequence data will unveil the secret of evolution soon Tree reconstruction Any method of inferring a tree can be considered in three parts (Penny and Hendy, 2001).
38 Chapter 1 Introduction 30 A) Models and assumptions about the mechanisms of evolution for the type of data used. B) The optimality criterion, which measures how the data fits a specific tree C) A search strategy for finding the optimal tree. These aspects are discussed below. A) Models A model can be considered as three parts: Basic structure, a tree: we assume that it is a binary tree for evolutionary study. On some occasions, a network can be a useful option to express conflicting signals in a binary tree. A mechanism of change: Different tree building models apply different mechanisms for changes (including no correction for multiple changes). Most nucleotide models assume changes to the sequences are stochastic (random) and independent and identically distributed (i.i.d.), that is changes are considered independent both between sites along the sequence and between positions on the tree. Rate or probability of changes on each edge of the tree. These models can range from simple Poisson models that have a single substitution probability and assume all character states have equal frequencies - for example, the Jukes and Cantor model for nucleotides. The Kimura models allow different probabilities for transitions and transversions and the Hasegawa-Kishino-Yano model (HKY85) further allows for unequal base frequencies. The General Time-Reversible model (GTR) has a probability matrix with six parameters, such that each possible substitution has its own probability. GTR also allows for unequal base frequencies. Additional details of these mechanisms can be found in Swofford, et al (1996) and Page and Holmes (1998). As more complex models accommodate more parameters such as those given above, they are a closer reflection of the biological reality. However, there is a trade off when choosing an appropriate model for a particular data set. While a simple model may not represent biological reality, it can still converge to the correct tree though the
39 Chapter 1 Introduction 31 branch lengths may be underestimated (Lio and Goldman, 1998). On the other hand, a complex model with too many parameters and may lose the ability of discrimination in different trees. The suggestion from David Swofford in Molecular systematics (Swofford et al., 1996) is choose an overall goodness-of-fit statistic and then search for a model that maximizes this statistic without adding unnecessary parameters that do little more than explain random fluctuations in the data. B) Optimality criteria These measure how well the data fits a given tree. Three routinely used optimality criteria are discussed here: two of them use sequences information directly- Maximum Parsimony (MP) and Maximum Likelihood (ML) and the third uses genetic distances- Minimum Evolution (ME) Maximum parsimony For each tree to be evaluated, the minimum possible number of changes for each character (nucleotide or amino acids in this study) is calculated. The minimum number of changes across all sites are totalled to obtain the parsimony score for a tree. The tree selected is the one that requires the fewest changes across all sites and is independent of branch lengths on the tree. It is usually applied to the data as observed (maximum parsimony) but can be applied to data corrected for multiple changes. This requires a Hadamand conjugation and it is then called corrected parsimony (Penny et al., 1996). MP can be inconsistent when the evolutionary rate across lineage varies. MP has been the most widely used approach to inferring phylogeny so far and the time required to evaluate it on a single tree increases linearly with the number of taxa. Although parsimony does not assume an explicit model of evolution, it requires certain assumptions. When there is no common mechanism between sites, then parsimony is the maximum likelihood estimator (Steel and Penny, 2000). Maximum likelihood Given an assumed model of evolution, ML finds the combination of trees and rates of evolution that maximizes the probability of getting the observed data. ML first calculates the probabilities at a single site, and then the probability for all sites multiplied together. In practice, the log-likelihood is calculated at every sequence
40 Chapter 1 Introduction 32 position and the overall score for any tree is the sum of these values for all positions. The tree with the best (maximum) log-likelihood is chosen as the optimal tree. Compared to other methods, ML methods are often more accurate in inferring the correct tree. However due to its calculation complexity ML consumes much computer time i.e., is slow. The time required to caculate the likelihood for a single site increases exponentially with the number of taxa. Minimum evolution As previously stated, this is a distance base criterion. Evolutionary trees are constructed by searching for the tree that shows the smallest sum of branch lengths. Distance methods have the advantage of being faster and simpler than those using sequences directly. On the other hand, converting from sequence data to distance data may result the lost of information (Steel et al., 1988). C) Search strategies A major problem in tree building is the computational difficulty in analysis large numbers of taxa. For number of taxa n, the number of unrooted binary trees is (2n-5)!! and rooted binary trees is (2n-3)!!. The double factorial notation (!!) is multiplying by every second number, 9!!= The total number of possible trees increases exponentially and currently it is computational prohibitive to evaluate all possible trees when there is greater than about 11 taxa (34,459,425 possible trees). There are two search strategies, exact searches and heuristic searches. Exact searches consider all trees and find the optimal tree. An algorithm which searches all possible trees is an exhaustive algorithm. Currently exhaustive algorithms are computationlly impossible with greater than 11 taxa as mentioned above. Branch and bound methods (Hendy and Penny, 1982) can improve the efficiency of complete searches and greatly reduce the time in searching for the best trees. Branch and bound eliminates suboptimal trees in the early stage of searches that exceed the bound from the search space and does not consider them further. It is not exhaustive but does reach an optimal answer with less computation than truely exhaustive searches. Branch and bound is only possible at present with less than about 20 taxa. Exact searches do not guarantee that the
41 Chapter 1 Introduction 33 optimal tree found is the correct tree, it is the best tree for the data given and the optimality criterion used. Heuristic searches are used when the data set is too large. Heuristic searches do not guarantee to find the optimal tree and can be trapped in local optima. One of the most popular heuristic search strategy is Neighbor-Joining (NJ). NJ can be implemented with many optimal criteria but normally it is usually implemented for distances. NJ works by joining a pair of taxa with the largest internal edge, then treats this pair of taxa as a single taxon, and adds the third taxon with largest internal edge and thereafter. Because distances can be readily corrected for multiple changes, different correction methods can be implemented to NJ. When reliability tests are conducted, neighbor-joining (at least with moderate numbers of taxa) generally gives conclusions very similar to those obtained by the more extensive tree search algorithms (Nei et al., 1998). Hill-Climbing (HC) begins with a random selected tree or NJ tree and progressively change the tree topology by branch swapping (collapsing an internal edge, for example). If a better tree is found, it keeps this tree and begins branch swapping again. It repeats this procedure till no better tree is found under the defined criterion. HC like many heuristic methods, is prone to being caught in a local optimal. Star Decomposition (SC) first connects all the terminal taxa in a star tree containing a single internal node. It then evaluates by the given optimal criterion, all possible combinations of joining two terminal nodes into a clade. The tree with the best score will be saved and the process is repeated on that 'best tree till a complete binary tree is recovered Evaluation of tree reconstruction methods Five criteria have been proposed to evaluate tree reconstruction methods (Penny et al., 1990; Penny et al., 1992): Efficient: An efficient method requires that the time increases only according to a Fpower of n, the number of taxa n in this case. If the time increases exponentially with n, then the method is not efficient. While an exhaustic search gives an optimal tree, the searches are slow (not efficient). Heuristic methods can be fast (efficient) but do not guarantee an optimal tree.
42 Chapter 1 Introduction 34 Powerful: A method that can use relative short sequences and infer to a correct tree is called powerful. A powerful method can use more information from the data so it can converge faster. The power of methods is expected to be: ML closest tree > MP > distance methods. Consistent: Consistent is converging to the correct tree as longer sequences become available. The more biological knowledge we know about our data, the more appropriate model we can choose to converge to the correct tree. Robust: Deviation from underlined model and still can converge to the correct tree is robust. For example, most methods assume an independent identical distribution (iid) of changes in the sequences, if the data set violate this assumption, yet the method still converge to the correct tree, then the method is robust to this assumption. Falsifiable: To reject a model from the data is a basic requirement for scientific method. Most tree building methods do not meet this requirement. One approach can be done is by comparing trees from different data set. For example, trees from mitochondrial DNA and nuclear DNA. An ideal tree-building method would meet all five criterion, currently none do. More efficient methods tend to be inconsistent. In addition, many methods have biological flaws, for example most examples assume iid, but this assumption is violated when analysing functional proteins. It is also impossible to test that the optimal tree found is the true tree, rather it is the optimal tree given the data, an assumed optimality criterion and a search strategy. However, it is still possible to give a reasonable estimate of the reliability of the final tree using different tests (Penny and Hendy, 1986). When most of the evidence such as combined data from different genes, fossils dates, morphological tree and geographical distribution, converge to a single tree, our confidence that molecular tree is the historical evolutionary tree increases Assessing the reliability of individual branches Many methods have been suggest to test the degree of support for particular branch but the most popular techniques is the bootstrap (Felsenstein, 1985; Hillis and Bull, 1993). This estimates how well a group is reflected by all the data in a sequence alignment, given the data analysis method used. It works by randomly resampling the
43 Chapter 1 Introduction 35 original data sets to create multiple new data sets with the same number of characters as the original. A tree is inferred from each of the new datasets and a consensus tree is produced from these. Bootstrap support for an edge is the percentage of times the resampled trees contain that edge. High bootstrap value doesn t mean that this internal branch is a real. Bootstrap is a measure of convergence, the ability of this data set to return to this tree or this branch, not a measure of consistency Problems of inconsistency (A) Long branch attraction Currently there are no methods that are robust to an artifact termed long branch attraction. This long branch attraction results from unequal rates of evolution and/or deep divergences (Hendy and Penny, 1989). It is especially likely to occur when there are short internal edges with long edges on either side. With short internal edges, there is frequently not enough information in the data to recover the correct tree. A special case is called the Felsenstein zone as it was first identified by Felsenstein in 1978 (Felsenstein, 1978) with an example of 4 taxa. The resulting affect is that the methods converge to an incorrect tree joining the long branches as sister taxa. Although optimality criteria such as ML are consistent if the assumptions about the mechanism of evolution are correct, it too can fail if the actual mechanism differs from the assumed mechanism (Lockhart et al., 1996). One way the problem is addressed is by adding more taxa, specifically, taxa that will break up the long branches (Hendy and Penny, 1989; Graybeal, 1998). In reality finding the appropriate taxa to break the long branch is not so easy and occasionally impossible. Good examples of taxa being misplaced in the evolutionary tree due to faster rate of molecular evolution resulting in a long-branch artefact are discussed in (Philippe and Laurent, 1998). With regard to this study, the rat/mouse and the hedgehog are good (or bad) examples caused by long branch attraction (Lin et al., 2001a; Lin et al., 2001b). In each case, these appear to be a change in the process (mechanism) of evolution. Assuming a single process over the whole tree means that even ML is no longer guaranteed to be consistent. To address this issue I have increased the data by sequencing the complete
44 Chapter 1 Introduction 36 mitochondrial genomes of taxa to break deep divergences (for example, vole and gymnure to break long branches to rat/mouse and hedgehog respectively). (B) Correction for multiple changes / site saturation Through time, sites can undergo repeated substitution (where a given nucleotide position has changed more than once since the two taxa diverged). Each substitution reduces information that site convey about evolutionary change. As time increases, the observed data decreases in its true representation of evolutionary distances and decrease the estimate of branch length. By giving greater weight in phylogenetic analyses to characters changing less frequently (and less weight to characters changing frequently), problems from multiple changes can be reduced. In this current study, 1 st and 2 nd codons of coding genes, amino acids sequences and RY coding are used to reduce this problem. Methods to correct for multiple changes can be found in Hillis (1997) (C) Nucleotide composition bias It is well documented that nucleotide composition varies between taxa and this can lead to convergence to a wrong tree by joining taxa with similar nucleotide compositions (Hasegawa and Kishino, 1989; Penny et al., 1990; Hasegawa and Hashimoto, 1993; Mooers and Holmes, 2000). A good example of this - with respect to this thesis - is the hedgehog (Echinops telfairi). The hedgehog s unique nucleotide composition has been shown to bias the mammalian mitochondrial tree (Waddell et al., 1999b). In this situation, LogDet can be employed to analyse the data. LogDet (Lockhart et al., 1994) transforms the observed evolutionary distance and hence the resulting distance value is closer to being linear with time. LogDet is robust in the face of differing nucleotide or amino acids composition and has been used in analyzing mammalian evolution (Penny et al., 1999). It is still insufficient with regard to the hedgehog (Waddell et al., 1999b). This may come from the process of evolution, which is deviate from a random and neutral model of evolution. For example, it does not include any selection on amino acid sites. (D) Rate variation
45 Chapter 1 Introduction 37 Rate variation occurs both between taxa and within sequences. Possible mechanisms causing rate variation include differences in mutation rate and fixation rate. Mutation rates vary between species and can come from effects of (1) generation time, (2) metabolic rate, and (3) the efficiency of DNA repair (Mindell and Thacker, 1996; Page and Holmes, 1998). Any one of them cannot explain alone the rate variation between species, for example in Bromham et al. (1996). Rate variation between species is not enough to explain the variation in the molecular clock. Rate variation within a sequence also has profound effect in the molecular clock. For example, rate variation occurs within a sequence when different function and/or structure constrains are in place. For example, consider protein coding genes, the evolution rate is 2 nd codon < 1 st codon < 3 rd codon. Some sites are constrained not to change (invariant) and others are not (variant). The overall rate is reduced by the invariant sites, the resulting effect is an inappropriately reduced branch length (Lockhart et al., 1996; Steel et al., 2000). Moreover, biases in the nucleotide composition can be hidden, multiple changes can be underestimated and there is also a reduced in the speed of molecular clock. Gamma (Γ) distribution models (Yang, 1996), though not actually a true reflection of biochemistry, is the most commonly used model for rate heterogeneity. A low shape parameter (α) in the gamma distribution reflects that most sites are evolving very slowly but a few are evolving quickly. As α increase to infinity the rate difference decreases, such that it approaches all sites evolving equally. Another useful model which may be closer to biological reality is covarion model (Tuffley and Steel, 1998): the fixation of mutations may alter the probability that any given position will be fixed in the next change. Simulation analyses showed that the covarion hypothesis makes better predictions than does the gamma version of the one-parameter model (Miyamoto and Fitch, 1995; Penny et al., 2001) Rooting evolutionary trees Tree building methods produce unrooted trees which represent the relationship between the given taxa. However, from the point of view of evolutionary studies, it is important to understand the direction of the relationships. One simple method of root
46 Chapter 1 Introduction 38 placement is the midpoint method: the midpoint of longest internal path along the tree is the root when a molecular clock is constrained. Another molecular clock method places the root on a branch which is at equal distance from all terminal nodes. Clearly, both methods rely on the data being clock like and are not robust when this assumption is violated. To get it right, as we have seen this is not necessary so, both methods are not robust when this assumption is violated. An outgroup is commonly employed to determine the root of the tree. When one or more outgroup taxa are used, the root sits between the outgroup and the ingroup. This method does not require the enforcement of a molecular clock but does require an appropriate outgroup to correctly root the tree. This method is susceptible to long branch attraction and rate heterogeneity between taxa (Hendy and Penny, 1989). For example, the argument of putting monotremes and marsupials as a sister group (by rooting between platypus/marsupials and placentals) - the Marsupionta hypothesis (Janke et al., 1996; Penny and Hasegawa, 1997; Janke et al., 1997; Kirsch and Mayer, 1998) still needs careful investigation because it may be caused by long branch attraction. Even rooting the placental mammals has problems because of the fast evolutionary rate in murid rodents and some insectivores (Gissi et al., 2000). Without suitable outgroups to root a tree, a duplicated gene method can be applied to decide the root. For example, a few duplicated genes are useful to root the universal tree of life (Lopez et al., 1999).
47 Chapter 1 Introduction The molecular clock The discovery that many of the protein sequences appeared to show a picture of longterm rate constancy explained by the neutral theory (see section 2.6.1) leads to a prediction of the molecular clock. For over two decades, molecular systematics has been trying to use mitochondrial DNA to estimate times of species divergence. Molecular clock works by converting genetic distance between lineages to divergence time. This includes adjustment of rate (from observed distance to expected distance) and a calibration by a known fossil date to extrapolate or interpolate the tree and calculate the evolutionary rate along the edge. The use of a molecular clock is still controversial and after years of research, it was reckoned that there are no universal molecular clock but local molecular clocks because of rate heterogeneity across different lineages and different genes (Bromham et al., 1996; Strauss, 1999). A stable and reliable mammalian tree is the first requirement in order to have a correct estimate of the divergence time. As mentioned above, use of longer sequences and breaking up long branches to retrieve a consistent tree is the strategy for this current study. The second requirement is a good estimate of the branch length or rate. Lineage variation in the rate of molecular evolution (for example, slower rates in apes, sharks, turtle and a faster rates in rats) have been well documented (Bromham et al., 1996; Pesole et al., 1999; Gissi et al., 2000; Weinreich, 2001). One way of dealing with the rate variation is to use a clock test to select rate-constant sequences (Bromham et al., 1999). Clock tests are commonly based on a relative-rate test which compares the distance of two ingroup sequences with respect to an outgroup (Tajima, 1993). A triplet relative rates test was proposed to detect moderate levels of lineagespecific rate variation (Bromham et al., 1999; Bromham et al., 2000). The third requirement is an adequate calibration point. The choice of calibration point has a profound effect on estimates of separation times. Because of the incomplete fossil records, the oldest fossil does not necessarily mean that it represents the separation time from its sister lineage. The earliest representatives of two lineages establishes a minimum time of divergence of these lineages (see Fig 1.3). Some popular calibration points used in molecular studies are listed here: Synapsids/Diapsids (310 Mya) (Kumar and Hedges, 1998),
48 Chapter 1 Introduction 40 Marsupial/Eutherian (160 Mya) (Janke et al., 1994; Arnason et al., 1999; Cao et al., 2000), Artiodactyla/Cetacea (52-60 Mya) (Arnason et al., 1996; Penny et al., 1999; Cao et al., 2000; Arnason et al., 2000), horse/rhinoceros (50-55 Mya) (Xu et al., 1996; Penny et al., 1999), tooth whale/baleen whale (33 Mya) (Arnason et al., 2000), orangutan/african apes (13-18 Mya) (Cao et al., 2000). Some morphologist may think these studies have serious flaws, such as include using only a single calibration point, large confidence limits, extrapolation rather than interpolation and misunderstanding of the divergence time from the fossil records (Alroy, 1999). New developments for estimating divergence dates include the use of a quartet method (Cooper and Fortey, 1998; Cooper and Penny, 1997; Rambaut and Bromham, 1998). This method does not depend on any universal clock and is less sensitive to rate variation among lineages. At this point, it is time to present the materials and methods used, and then consider the results.
49 Chapter 1 Introduction 41 Reference List 1. Adachi, J., Cao, Y., Hasegawa, M. (1993). Tempo and mode of mitochondrial DNA evolution in vertebrates at the amino acid sequence level: rapid evolution in warm-blooded vertebrates. Journal of Molecular Evolution 36, Adcock, G.J., Dennis, E.S., Easteal, S., Huttley, G.A., Jermiin, L.S., Peacock, W.J., Thorne, A. (2001). From the Cover: Mitochondrial DNA sequences in ancient Australians: Implications for modern human origins. Proceedings of the National Academy of Sciences of the United States of America 98, Adkins, R.M., Honeycutt, R.L. (1991). Molecular phylogeny of the superorder Archonta. Proceedings of the National Academy of Sciences of the United States of America 88, Adkins, R.M., Honeycutt, R.L., Disotell, T.R. (1996). Evolution of eutherian cytochrome C oxidase subunit II: heterogeneous rates of protein evolution and altered interaction with cytochrome C. Molecular Biology and Evolution 13, Allard, M.W., Honeycutt, R.L., Novacek, M.J. (1999). Advances in higher level mammalian relationships. Cladistics 15, Allard, M.W., Mcniff, B.E., Miyamoto, M.M. (1996). Support for interordinal eutherian relationships with an emphasis on primates and their Archontan relatives. Molecular Phylogenetics and Evolution 5, Alroy, J. (1999). The fossil record of North American mammals: evidence for a paleocene evolutionary radiation. Systematic Biology 48, Anderson, S., Bankier, A.T., Barrell, B.G., de Bruijn, M.H., Coulson, A.R., Drouin, J., Eperon, I.C., Nierlich, D.P., Roe, B.A., Sanger, F., Schreier, P.H., Smith, A.J., Staden, R., Young, I.G. (1981). Sequence and organization of the human mitochondrial genome. Nature 290, Andersson, S.G., Kurland, C.G. (1999). Origins of mitochondria and hydrogenosomes. Current Opinion in Microbiology 2, Ankelsimons, F., Cummins, J.M. (1996). Misconceptions about mitochondria and mammalian fertilization: implications for theories on human evolution. Proceedings of the National Academy of Sciences of the United States of America 93, Archibald, J.D. (1996). Fossil evidence for a late Cretaceous origin of ''hoofed'' mammals. Science 272, Arctander, P. (1995). Comparison of a mitochondrial gene and a corresponding nuclear pseudogene. Proceedings of the Royal Society of London Series B-Biological Sciences 262, Arnason, U., Gullberg, A., Gretarsdottir, S., Ursing, B., Janke, A. (2000). The Mitochondrial genome of the sperm whale and a new molecular reference for estimating eutherian divergence dates. Journal of Molecular Evolution 50, Arnason, U., Gullberg, A., Janke, A. (1997). Phylogenetic analyses of mitochondrial DNA suggest a sister group relationship between Xenarthra (Edentata) and Ferungulates. Molecular Biology and Evolution 14, Arnason, U., Gullberg, A., Janke, A. (1999). The mitochondrial DNA molecule of the aardvark, Orycteropus afer, and the position of the Tubulidentata in the eutherian tree. Proceedings of the
50 Chapter 1 Introduction 42 Royal Society of London Series B-Biological Sciences 266, Arnason, U., Gullberg, A., Gretarsdottir, S., Ursing, B., Janke, A. (2000). The Mitochondrial genome of the sperm whale and a new molecular reference for estimating eutherian divergence dates. Journal of Molecular Evolution 50, Arnason, U., Johnsson, E. (1992). The complete mitochondrial DNA sequence of the harbor seal, Phoca vitulina. Journal of Molecular Evolution 34, Arnason, U., Gullberg, A., Janke, A., Xu, X.F. (1996). Pattern and timing of evolutionary divergences among Hominoids based on analyses of complete mtdnas. Journal of Molecular Evolution 43, Asher, R.J. (1999). A morphological basis for assessing the phylogeny of the "Tenrecoidea" (Mammalia, Lipotyphla). Cladistics 15, Bada, J.L., Wang, X.S., Hamilton, H. (1999). Preservation of key biomolecules in the fossil record: current knowledge and future challenges. Philosophical Transactions of the Royal Society of London Series B-Biological Sciences 354, Bajpai, S., Gingerich, P.D. (1998). A new Eocene archaeocete (Mammalia, Cetacea) from India and the time of origin of whales. Proceedings of the National Academy of Sciences of the United States of America 95, Barton, N., Jones, J.S. (1983). Mitochondrial DNA: new clues about evolution. Nature 306, Bensasson, D., Zhang, D., Hartl, D.L., Hewitt, G.M. (2001). Mitochondrial pseudogenes: evolution's misplaced witnesses. Trends in Ecology & Evolution 16, Benton, M.J. (1993). The Fossil Record 2. Chapman & Hall Press, London. 25. Benton, M.J. (1999a). Early origins of modern birds and mammals: molecules vs. morphology. Bioessays 21, Benton, M.J. (1999b). Molecular evidence for the early divergence of placental mammals - reply. Bioessays 21, Boore, J.L. (1999). Animal mitochondrial genomes. Nucleic Acids Research 27, Boore, J.L., Brown, W.M. (1998). Big trees from little genomes: mitochondrial gene order as a phylogenetic tool. Current Opinion in Genetics & Development 8, Bromham, L., Phillips, M.J., Penny, D. (1999). Growing up with dinosaurs: molecular dates and the mammalian radiation. Trends in Ecology & Evolution 14, Bromham, L., Penny, D., Rambaut, A., Hendy, M.D. (2000). The power of relative rates tests depends on the data. Journal of Molecular Evolution 50, Bromham, L., Rambaut, A., Harvey, P.H. (1996). Determinants of rate variation in mammalian DNA sequence evolution. Journal of Molecular Evolution 43, Brown, W.M., George, M. Jr, Wilson, A.C. (1979). Rapid evolution of animal mitochondrial DNA. Proceedings of the National Academy of Sciences of the United States of America 76, Butler, B.A. (1998). Sequence analysis using GCG. Bioinformatics 39, Butler, P.M. (1988). Phylogeny of the Insectivores. Pp in The phylogeny and
51 Chapter 1 Introduction 43 classification of the Tetrapods, vol 2. Mammals, ed. M.J. Benton, Clarendon Press, Oxford. 35. Cao, Y., Adachi, J., Janke, A., Paabo, S., Hasegawa, M. (1994). Phylogenetic relationships among eutherian orders estimated from inferred sequences of mitochondrial proteins: instability of a tree based on a single gene. Journal of Molecular Evolution 39, Cao, Y., Fujiwara, M., Nikaido, M., Okada, N., Hasegawa, M. (2000). Interordinal relationships and timescale of eutherian evolution as inferred from mitochondrial genome data. Gene 259, Cao, Y., Janke, A., Waddell, P.J., Westerman, M., Takenaka, O., Murata, S., Okada, N., Paabo, S., Hasegawa, M. (1998). Conflict among individual mitochondrial proteins in resolving the phylogeny of eutherian orders. Journal of Molecular Evolution 47, Chinnery, P.F., Thorburn, D.R., Samuels, D.C., White, S.L., Dahl, H.H.M., Turnbull, D.M., Lightowlers, R.N., Howell, N. (2000). The inheritance of mitochondrial DNA heteroplasmy: random drift, selection or both? Trends in Genetics 16, Collura, R.V., Auerbach, M.R., Stewart, C. (1996). A quick, direct method that can differentiate expressed mitochondrial genes from their nuclear pseudogenes. Current Biology 6, Collura, R.V., Stewart, C.-B. (1995). Insertions and duplications of mtdna inthe nuclear genomes of Old World monkeys and hominoids. Nature 378, Cooper, A., Fortey, R. (1998). Evolutionary explosions and the phylogenetic fuse. Trends in Ecology & Evolution 13, Cooper, A., Lalueza-Fox, C., Anderson, S., Rambaut, A., Austin, J., Ward, R. (2001). Complete mitochondrial genome sequences of two extinct moas clarify ratite evolution. Nature 409, Cooper, A., Penny, D. (1997). Mass survival of birds across the Cretaceous-Tertiary boundary: molecular evidence. Science 275, Curole, A.P., Kocher, T.D. (1999). Mitogenomics: digging deeper with complete mitochondrial genomes. Trends in Ecology & Evolution 14, D'Erchia, A.M., Gissi, C., Pesole, G., Saccone, C., Arnason, U. (1996). The guinea-pig is not a rodent. Nature 381, Easteal, S. (1999). Molecular evidence far the early divergence of placental mammals. Bioessays 21, Eizirik, E., Murphy, W.J., O'Brien, S.J. (2001). Molecular dating and biogeography of the early placental mammal radiation. Journal of Heredity 92, Eyre-Walker, A. (2000). Do mitochondria recombine in humans? Philosophical Transactions of the Royal Society of London Series B-Biological Sciences 355, Eyre-Walker, A., Smith, N.H., Smith, J.M. (1999). How clonal are human mitochondria? Proceedings of the Royal Society of London Series B-Biological Sciences 266, Feduccia, A. (1995). Explosive evolution in Tertiary birds and mammals. Science 267, Felsenstein, J. (1978). Cases in which parsimony or compatibility methods will be positive misleading. Systematic Zoology 27, Felsenstein, J. (1985). Confidence limits on phylogenies: An approach using the bootstrap. Evolution 39,
52 Chapter 1 Introduction Fischer, M.S., Tassy, P. (1993). The interrelation between Proboscidea, Sirenia, Hyracoidea, and Mesaxonia: the morphological evidence. Pp in Mammal phylogeny, ed. F.S. Szalay, M.J. Novacek, and M.C. McKenna, Springer-Verlag Press, New York. 54. Frye, M.S., Hedges, S.B. (1995). Monophyly of the order Rodentia inferred from mitochondrial- DNA sequences of the genes for 12s ribosomal-rna, 16s ribosomal- RNA, and transfer-rna- Valine. Molecular Biology and Evolution 12, Gatesy, J., Milinkovitch, M., Waddell, V., Stanhope, M. (1999). Stability of cladistic relationships between Cetacea and higher-level Artiodactyl taxa. Systematic Biology 48, Gaudin, T.J., Wible, J.R., Hopson, J.A., Turnbull, W.D. (1996). Reexamination of the morphological evidence for the Cohort Epitheria (Mammalia, Eutheria). Journal of Mammalian Evolution 3, Gemmell NJ, Janke A, Western PS, Watson JM, Paabo S, Graves JA. (1994) Cloning and characterization of the platypus mitochondrial genome. Journal of Molecular Evolution. 39, Gheerbrant, E., Sudre, J., Cappetta, H. (1996). A Palaeocene Proboscidean from Morocco. Nature 383, Gillespie, J.H. (1994). Alternatives to the Neutral Theory. ed. B. Golding, Pp in Non-neutral evolution : theories and molecular data, Chapman & Hall Press, New York. 60. Gibbs, S., Collard, M., Wood, B. (2000). Soft-tissue characters in higher Primate phylogenetics. Proceedings of the National Academy of Sciences of the United States of America 97, Gissi, C., Gullberg, A., Arnason, U. (1998). The complete mitochondrial DNA sequence of the rabbit, Oryctolagus Cuniculus. Genomics 50, Gissi, C., Reyes, A., Pesole, G., Saccone, C. (2000). Lineage-specific evolutionary rate in mammalian mtdna. Molecular Biology and Evolution 17, Graur, D., Duret, L., Gouy, M. (1996). Phylogenetic position of the order Lagomorpha (rabbits, hares and allies). Nature 379, Graur, D., Gouy, M., Duret, L. (1997). Evolutionary affinities of the order Perissodactyla and the phylogenetic status of the superordinal taxa Ungulata and Altungulata. Molecular Phylogenetics and Evolution 7, Graur, D., Hide, W.A., Li, W.H. (1991). Is the guinea-pig a rodent? Nature 351, Graur, D., Higgins, D.G. (1994). Molecular evidence for the inclusion of cetaceans within the order Artiodactyla. Molecular Biology and Evolution 11, Gray, M.W., Burger, G., Lang, B.F. (1999). Mitochondrial evolution. Science 283, Graybeal, A. (1998). Is it better to add taxa or characters to a difficult phylogenetic problem? Systematic Biology 47, Gregory, W.K. (1947). The monotremes and the palimpsest theory. Bulletin, American Museum Natural History 88, Gura, T. (2000). Bones, molecules... or both? Nature 406, Haddrath, O., Baker, A. J. (2001). Complete mitochondrial DNA genome sequences of extinct birds: ratite phylogenetics and the vicariance biogeography hypothesis. Philosophical Transactions
53 Chapter 1 Introduction 45 of the Royal Society of London Series B-Biological Sciences 268, Hasegawa, M., Hashimoto, T. (1993). Ribosomal RNA trees misleading? Nature 361, Hasegawa, M., Kishino, H. (1989). Heterogeneity of tempo and mode of mitochondrial DNA evolution among mammalian orders. Japanese Journal of Genetics 64, Harrison, R.G. (1999). Animal mitochondrial DNA as a genetic marker in population and evolutionary biology. Trends in Ecology and Evolution 14, Hasegawa, M., Adachi, J., Milinkovitch, M.C. (1997). Novel phylogeny of whales supported by total molecular evidence. Journal of Molecular Evolution 44 Suppl 1, S117-S Hedges, S.B. (2001). Afrotheria: plate tectonics meets genomics. Proceedings of the National Academy of Sciences of the United States of America 98, Hedges,S.B. (1995). Decting dinosaur DNA. Nature 268, Hedges, S.B., Parker, P.H., Sibley, C.G., Kumar, S. (1996). Continental breakup and the ordinal diversification of birds and mammals. Nature 381, Hendy, M.D., Penny, D. (1982). Branch and bound algorithm for finding evolutionary trees. Discrete Mathematics 96, Hendy, M.D., Penny, D. (1989). A framework for the quantitative study of evolutionary trees. Systematic Zoology 38, Herrnstadt, C., Clevenger, W., Ghosh, S.S., Anderson, C., Fahy, E., Miller, S., Howell, N., Davis, R.E. (1999). A novel mitochondrial DNA-like sequence in the human nuclear genome. Genomics 60, Hey, J. (2000). Human mitochondrial DNA recombination: can it be true? Trends in Ecology & Evolution 15, Hillis, D.M. (1997). Phylogenetic analysis. Current Biology 7, Hillis, D.M., Bull, J.J. (1993). An empirical test of bootstrapping as a method for assessing confidence in phyligenetic analysis. Systematic Biology 42, Hofreiter, M., Poinar, H.N., Spaulding, W.G., Bauer, K., Martin, P.S., Possnert, G., Paabo, S. (2000). A molecular analysis of ground sloth diet through the last glaciation. Molecular Ecolology 9, Holmes, E.C. (1991). Different rates of substitution may produce different phylogenies of the eutherian mammals. Journal of Molecular Evolution 33, Hooker, J.J. (2001). Tarsals of the extinct insectivoran family Nyctitheriidae (Mammalia): evidence for archonan relationships. Zoological journal of the Linean Society 132, Hoss, M. (2000). Neanderthal population genetics. Nature 404, Hu, Y., Wang, Y., Luo, Z., Li, C. (1997). A new symmetrodont mammal from China and its implications for mammalian evolution. Nature 390, Hutcheon, J.M., Kirsch, J.A., Pettigrew, J.D. (1998). Base-compositional biases and the bat problem. III. The questions of microchiropteran monophyly. Philosophical Transactions of the Royal Society of London Series B-Biological Sciences 353, Jablonski, D. (1999). The future of the fossil record. Science 284,
54 Chapter 1 Introduction Janke, A., Erpenbeck, D., Nilsson, M., Arnason, U. (2001). The Mitochondrial genomes of the Iguana (Iguana Iguana) and the Caiman (Caiman Crocodylus): Implications for amniote phylogeny. Proceedings of the Royal Society of London Series B-Biological Sciences 268, Janke, A., Feldmaier-Fuchs, G., Thomas, W.K., von Haeseler, A., Paabo, S. (1994). The marsupial mitochondrial genome and the evolution of placental mammals. Genetics 137, Janke, A., Gemmell, N.J., Feldmaierfuchs, G., Vonhaeseler, A., Paabo, S. (1996). The mitochondrial genome of a monotreme - the platypus (Ornithorhynchus anatinus). Journal of Molecular Evolution 42, Janke, A., Xu, X.F., Arnason, U. (1997). The complete mitochondrial genome of the wallaroo (Macropus robustus) and the phylogenetic relationship among monotremata, marsupialia, and eutheria. Proceedings of the National Academy of Sciences of the United States of America 94, Kajander, O.A., Rovio, A.T., Majamaa, K., Poulton, J., Spelbrink, J.N., Holt, I.J., Karhunen, P.J., Jacobs, H.T. (2000). Human mtdna sublimons resemble rearranged mitochondrial genoms found in pathological states. Human Molecular Genetics 9, Kelman, Z., Moran, L. (1996). Degradation of ancient DNA. Current Biology 6, Kimura, M. (1983). The Neutral Theory of Molecular Evolution. Cambridge University Press, Canbridge. 99. Kirsch, J.A.W., Mayer, G.C. (1998). The platypus is not a rodent: DNA hybridization, amniote phylogeny and the palimpsest theory. Philosophical Transactions of the Royal Society of London Series B-Biological Sciences 353, Kirsch, J.A.W., Pettigrew, J.D. (1998). Base-compositional biases and the bat problem. II. DNAhybridization trees based on AT- and GC-enriched tracers. Philosophical Transactions of the Royal Society of London Series B-Biological Sciences 353, Kirsch, J.A.W., Mayer, G.C. (1998). The platypus is not a rodent: DNA hybridization, amniote phylogeny and the palimpsest theory. Philosophical Transactions of the Royal Society of London Series B-Biological Sciences 353, Kleineidam, R.G., Pesole, G., Breukelman, H.J., Beintema, J.J., Kastelein, R.A. (1999). Inclusion of cetaceans within the order Artiodactyla based on phylogenetic analysis of pancreatic ribonuclease genes. Journal of Molecular Evolution 48, Krettek, A., Gullberg, A., Arnason, U. (1995). Sequence analysis of the complete mitochondrial DNA molecule of the hedgehog, Erinaceus europaeus, and the phylogenetic position of the Lipotyphla. Journal of Molecular Evolution 41, Kumar, S., Hedges, S.B. (1998). A molecular timescale for vertebrate evolution. Nature 392, Kyte, F.T. (1998). A meteorite from the Cretaceous/Tertiary boundary. Nature 396, Lang, B.F., Gray, M.W., Burger, G. (1999). Mitochondrial genome evolution and the origin of eukaryotes. Annual Review of Genetics 33, Lapointe, F.J., Kirsch, J.A.W., Hutcheon, J.M. (1999). Total evidence, consensus, and bat phylogeny: a distance-based approach. Molecular Phylogenetics and Evolution 11, Lavergne, A., Douzery, E., Stichler, T., Catzeflis, F.M., Springer, M.S. (1996). Interordinal mammalian relationships: evidence for paenungulate monophyly is provided by complete
55 Chapter 1 Introduction 47 mitochondrial 125 rrna sequences. Molecular Phylogenetics and Evolution 6, Lee, M.S.Y. (1999). Molecular clock calibrations and Metazoan divergence dates. Journal of Molecular Evolution 49, Li, W.H., Hide, W.A., Graur, D. (1992). Origin of rodents and guinea-pigs. Nature Lin, Y.H., McLenachan, P.A., Gore, A.R., Phillips, M.J., Penny, D. (2001a). Four new mitochondrial genomes, and the stability of evolutionary trees of mammals. Prepared for submission to Molecular Biology and Evolution Lin, Y.H., Penny, D. (2001). Implication for bat evolution from two complete mitochondrial genomes. Molecular Biology and Evolution. 18, Lin, Y.H., Waddell, P.J., Penny, D. (2001b). Pika and vole mitochondrial genomes add support to both rodent monophyly and Glires. Prepared for submission to Gene Lindahl, T. (2000). Fossil DNA. Current Biolgy Lio, P., Goldman, N. (1998). Models of molecular evolution and phylogeny. Genome Research 8, Lockhart, P.J., Larkum, A.W., Steel, M., Waddell, P.J., Penny, D. (1996). Evolution of chlorophyll and bacteriochlorophyll: the problem of invariant sites in sequence analysis. Proceedings of the National Academy of Sciences of the United States of America 93., Lockhart, P.J., Steel, M.A., Hendy, M.D., Penny, D. (1994). Recovering evolutionary trees under a more realistic model of sequence evolution. Molecular Biology and Evolution 11, Lopez, J.V., Cevario, S., O'Brien, S.J. (1996). Complete nucleotide sequences of the domestic cat (Felis catus) mitochondrial genome and a transposed mtdna tandem repeat (Numt) in the nuclear genome. Genomics 33, Lopez, P., Forterre, P., Philippe, H. (1999). The root of the tree of life in the light of the covarion model. Journal of Molecular Evolution 49, Lopez, J.V., Yuhki, N., Masuda, R., Modi, W., O'Brien, S.J. (1994). Numt, a recent transfer and tandem amplification of mitochondrial DNA to the nuclear genome of the domestic cat. Journal of Molecular Evolution 39, Loreille, O., Orlando, L., Patou-Mathis, M., Philippe, M., Taberlet, P., Hanni, C. (2001). Ancient DNA analysis reveals divergence of the cave bear, Ursus spelaeus, and brown bear, Ursus arctos, lineages. Current Biology 11, Luo, Z.X., Cifelli, R.L., Kielan-Jaworowska, Z. (2001). Dual origin of Tribosphenic mammals. Nature 409, MacPhee, R.D.E., Novacek, M.J. (1993). Definition and relationships of Lipotyphla. Pp in Mammal phylogeny, ed. F.S. Szalay, M.J. Novacek, and M.C. McKenna, Springer-verlag Press, New York Madsen, O., Scally, M., Douady, C.J., Kao, D.J., Debry, R.W., Adkins, R., Amrine, H.M., Stanhope, M.J., De Jong, W.W., Springer, M.S. (2001). Parallel adaptive radiations in two major clades of placental mammals. Nature 409, Milinkovitch, M.C., Meyer, A., Powell, J.R. (1994). Phylogeny of all major groups of cetaceans based on DNA sequences from three mitochondrial genes. Molecular Biology and Evolution 11,
56 Chapter 1 Introduction Milinkovitch, M.C., Orti, G., Meyer, A. (1993). Revised phylogeny of whales suggested by mitochondrial ribosomal DNA sequences. Nature 361, Milinkovitch, M.C., Orti, G., Meyer, A. (1995). Novel phylogeny of whales revisited but not revised. Molecular Biology and Evolution 12, Mindell, D.P., Dick, C.W., Baker, R.J. (1991). Phylogenetic relationships among megabats, microbats, and primates. Proceedings of the National Academy of Sciences of the United States of America 88, Mindell, D.P., Thacker, C.E. (1996). Rates if molecular evolution: phylogenetic issues and applications. Annual Review of Systematics. 27, Miyamoto, M.M. (1996). A congruence study of molecular and morphological data for eutherian mammals. Molecular Phylogenetics and Evolution 6, Miyamoto, M.M., Fitch, W.M. (1995). Testing the covarion hypothesis of molecular evolution. Molecular Biology and Evolution 12, Miyamoto, M.M., Goodman, M. (1986). Biomolecular systematics of eutherian mammals: Phylogenetic patterns and classification. Systematic Zoology 35, Miyamoto, M.M., Porter, C.A., Goodman, M. (2000). C-Myc gene sequences and the phylogeny of bats and other eutherian mammals. Systematic Biology 49, Montgelard, C., Catzeflis, F.M., Douzery, E. (1997). Phylogenetic relationships of Artiodactyls and Cetaceans as deduced from the comparison of cytochrome B and 12s rrna mitochondrial sequences. Molecular Biology and Evolution 14, Mooers, A.O., Holmes, E.C. (2000). The evolution of base composition and phylogenetic inference. Trends in Ecology & Evolution 15, Morris, A.A.M., Lightowlers, R.N. (2000). Can paternal mtdna be inherited? Lancet 355, Mouchaty, S.K., Catzeflis, F., Janke, A., Arnason, U. (2001). Molecular evidence of an African Phiomorpha-South American Caviomorpha clade and support for hystricognathi based on the complete mitochondrial genome of the cane rat (Thryonomys Swinderianus). Molecular Phylogenetics and Evolution 18, Mouchaty, S.K., Gullberg, A., Janke, A., Arnason, U. (2000a). The phylogenetic position of the Talpidae within eutheria based on analysis of complete mitochondrial sequences. Molecular Biology and Evolution 17, Mouchaty, S.K., Gullberg, A., Janke, A., Arnason, U. (2000b). Phylogenetic position of the Tenrecs (Mammalia : Tenrecidae) of Madagascar based on analysis of the complete mitochondrial genome sequence of Echinops Telfairi. Zoologica Scripta 29, Murphy, W.J., Eizirik, E., Johnson, W.E., Zhang, Y.P., Ryder, O.A., O'Brien, S.J. (2001). Molecular phylogenetics and the origins of placental mammals. Nature 409, Murray-McIntosh, R.P., Scrimshaw, B.J., Hatfield, P.J., Penny, D. (1998). Testing migration patterns and estimating founding population size in Polynesia by using human mtdna sequences. Proceedings of the National Academy of Sciences of the United States of America 95, Nei, M., Kumar, S., Takahashi, K. (1998). The optimization principle in phylogenetic analysis tends to give incorrect topologies when the number of nucleotides or amino acids used is small. Proceedings of the National Academy of Sciences of the United States of America 95,
57 Chapter 1 Introduction Nikaido M, Rooney AP, Okada N. (1999). Phylogenetic relationships among cetartiodactyls based on insertions of short and long interpersed elements: hippopotamuses are the closest extant relatives of whales. Proceedings of the National Academy of Sciences of the United States of America 96, Nikaido, M., Harada, M., Cao, Y., Hasegawa, M., Okada, N. (2000). Monophyletic origin of the order Chiroptera and its phylogenetic position among mammalia, as inferred from the complete sequence of the mitochondrial DNA of a Japanese megabat, the Ryukyu flying fox (Pteropus Dasymallus). Journal of Molecular Evolution 51, Nikaido, M., Matsuno, F., Hamilton, H., Brownell, R.L. Jr, Cao, Y., Ding, W., Zuoyan, Z., Shedlock, A.M., Fordyce, R.E., Hasegawa, M., Okada, N. (2001). Retroposon analysis of major cetacean lineages: the monophyly of toothed whales and the paraphyly of river dolphins. Proceedings of the National Academy of Sciences of the United States of America 98, Normile, D. (1998). New views of the origin of mammals. Science 281, Novacek, M.J. (1992). Mammalian phylogeny: shaking the tree. Nature 356, Novacek, M.J. (1993). Reflections on higher mammalian phylogenetics. Journal of Mammalian Evolution 1, Novacek, M.J. (1997). Mammalian evolution: an early record bristling with evidence. Current Biology 7, Novacek, M.J. (1999). 100 Million years of land vertebrate evolution: the Cretaceous- early Tertiary transition. Annals of the Missouri Botanical Garden 86, Novacek M. J. (2001). Mammalian phylogeny: genes and supertrees. Current Biology 11, R573- R O'Leary, M.A., Geisler, J.H. (1999). The position of Cetacea within Mammalia: phylogenetic analysis of morphological data from extinct and extant taxa. Systematic Biology 48, Ovchinnikov, I.V., Gotherstrom, A., Romanova, G.P., Kharitonov, V.M., Liden, K., Goodwin, W. (2000). Molecular analysis of Neanderthal DNA from the northern Caucasus. Nature 404, Paabo, S., Thomas, W.K., Whitfield, K.M., Kumazawa, Y., Wilson, A.C. (1991). Rearrangements of mitochondrial transfer RNA genes in marsupials. Journal of Moleculae Evolution 33, Page, R.D.M., Holmes, E.C. (1998). Models of Molecular Evolution. ed. E.C. Holmes Oxford, Pp in Molecular evolution : a phylogenetic approach, Blackwell Science Press, MA USA Penny, D., McComish, B.J., Charleston, M.A., Hendy, M.D. (2001). Mathematical elegance with biochemical realism: the covarion model of molecular evolution. Journal of Molecular Evolution in press Penny, D., Foulds, L.R., Hendy, M.D. (1982). Testing the theory of evolution by comparing phylogenetic trees constructed from five different protein sequences. Nature 297, Penny, D., Hasegawa, M. (1997). Molecular systematics - the platypus put in its place. Nature 387, Penny, D., Hasegawa, M., Waddell, P.J., Hendy, M.D. (1999). Mammalian evolution: timing and implications from using the Logdeterminant transform for proteins of differing amino acid composition. Systematic Biology 48,
58 Chapter 1 Introduction Penny, D., Hendy, M. (1986). Estimating the reliability of evolutionary trees. Molecular Biology and Evolution 3, Penny, D., Hendy, M. (2001). Phylogenetics: Parsimony and Distance Methods. Pp in Handbook of statistical genetics, Hohn Wiley & Sons, LTD, New York Penny, D., Hendy, M.D., Lockhart, P.J., Steel, M.A. (1996). Corrected parsimony, minimum evolution, and hadamard conjugations. Systematic Biology 45, Penny, D., Hendy, M.D., Steel, M.A. (1992). Progress with methods for constructing evolutionary trees. Trends in ecology and evolution 7, Penny, D., Hendy, M.D., Zimmer, E.A., Hamby, R.K. (1990). Trees from sequences: panacea or pandora's box? Australia Systematic Botany 3, Perna, N.T., Kocher, T.D. (1996). Mitochondrial DNA - molecular fossils in the nucleus. Current Biology 6, Pesole, G., Gissi, C., De Chirico, A., Saccone, C. (1999). Nucleotide substitution rate of mammalian mitochondrial genomes. Journal of Molecular Evolution 48, Pettigrew, J.D. (1986). Flying primates? Megabats have the advanced pathway from eye to midbrain. Science 231, Pettigrew, J.D. (1994). Genomic evolution. Flying DNA. Current Biology 4, Pettigrew, J.D., Jamieson, B.G., Robson, S.K., Hall, L.S., McAnally, K.I., Cooper, H.M. (1989). Phylogenetic relations between microbats, megabats and primates (Mammalia: Chiroptera and Primates). Philosophical Transactions of the Royal Society of London Series B-Biological Sciences 325, Pettigrew, J.D., Kirsch, A.W. (1998). Base-compositional biases and the bat problem. I. DNAhybridization melting curves based on AT- and GC-enriched tracers. Philosophical Transactions of the Royal Society of London Series B-Biological Sciences 353, Philippe, H. (1997). Rodent monophyly: pitfalls of molecular phylogenies. Journal of Molecular Evolution 45, Philippe, H., Laurent, J. (1998). How good are deep phylogenetic trees? Current Opinion in Genetics & Development 8, Poinar, H.N. (1999). DNA from fossils: the past and the future. Acta Paediatr Supplement 88, Prothero, D.R. (1993). Ungulate phylogeny: molecular vs. morphological evidence. Pp in Mammalian phylogeny: Placentals, ed. F.S. Szalay, M.J. and Novacek, M.C., Mckenna Springer-Verlag Press, New York Pumo, D.E., Finamore, P.S., Franek, W.R., Phillips, C.J., Tarzami, S., Balzarano, D. (1998). Complete mitochondrial genome of a neotropical fruit bat, Artibeus Jamaicensis, and a new hypothesis of the relationships of bats to other eutherian mammals. Journal of Molecular Evolution 47, Rambaut, A., Bromham, L. (1998). Estimating divergence dates from molecular sequences. Molecular Biology and Evolution 15, Relethford, J.H. (2001). Ancient DNA and the origin of modern humans. Proceedings of the National Academy of Sciences of the United States of America 98,
59 Chapter 1 Introduction Reyes, A., Pesole, G., Saccone, C. (1998). Complete mitochondrial DNA sequence of the fat dormouse, Glis Glis: further evidence of rodent paraphyly. Molecular Biology and Evolution 15, Reyes, A., Pesole, G., Saccone, C. (2000). Long-branch attraction phenomenon and the impact of among-site rate variation on rodent phylogeny. Gene 259, Rich, T.H., Vickers-Rich, P., Constantine, A., Flannery, T.F., Kool, L., van Klaveren, N. (1997). A tribosphenic mammal from the Mesozoic of Australia. Science 278, Robinson-Rechavi, M., Ponger, L., Mouchiroud, D. (2000). Nuclear gene Lcat supports rodent monophyly. Molecular Biology and Evolution 17, Rose, K.D., Emry, R.J. (1993). Relationships of Xenarthra, Pholidota, and fossil "Edentates": the morphological evidence. Pp in Mammal phylogeny, ed. F.S. Szalay, M.J. Novacek, and M.C. McKenna, Springer-Verlag Press, New York Rougier, G.W., Novacek, M.J. (1998). Early mammals: teeth, jaws and finally... a skeleton! Current Biology 8, R284-R Sarjeant, W.A.S., Currie, P.J. (2001). The "great extinction" that never happened: the demise of the dinosaurs considered. Canadian Journal of Earth Sciences 38, Schmitz, J., Ohme, M., Zischler, H. (2000). The complete mitochondrial genome of Tupaia Belangeri and the phylogenetic affiliation of Scandentia to other eutherian orders. Molecular Biology and Evolution 17, Shedlock, A.M., Milinkovitch, M.C., Okada, N. (2000). Sine evolution, missing data, and the origin of whales. Systematic Biology 49, Shedlock, A.M., Okada, N. (2000). SINE insertions: powerful tools for molecular systematics. Bioessays 22, Shimamura, M., Abe, H., Nikaido, M., Ohshima, K., Okada, N. (1999). Genealogy of families of Sines in Cetaceans and Artiodactyls: the presence of a huge superfamily of trna(glu)-derived families of Sines. Molecular Biology and Evolution 16, Shimamura, M., Yasue, H., Ohshima, K., Abe, H., Kato, H., Kishiro, T., Goto, M., Munechika, I., Okada, N. (1997). Molecular evidence from retroposons that whales form a clade within even-toed ungulates. Nature 388, Shoshani, J. (1993) Hyracoidea-Tethytheria affinity based on myological data. Pp in Mammal phylogeny / Chapter 17 ed. Szalay, Frederick S., Novacek, Michael J., and McKenna, Malcolm C, Springer-Verlag Press, New York Shoshani, J., McKenna, M.C. (1998). Higher taxonomic relationships among extant mammals based on morphology, with selected comparisons of results from molecular data. Molecular Phylogenetic Evolution 9, Simpson, G.G. (1945). The principles of classification and the classification of mammals. Bulletin, American Museum of Natural History 85, Sorenson, M.D., Fleischer, R.C. (1996). Multiple independent transpositions of mitochondrial DNA control region sequences to the nucleus. Proceedings of the National Academy of Sciences of the United States of America 93, Springer, M.S., Amrine, H.M., Burk, A., Stanhope, M.J. (1999). Additional support for Afrotheria and Paenungulata, the performance of mitochondrial versus nuclear genes, and the impact of data partitions with heterogeneous base composition. Systematic Biology 48,
60 Chapter 1 Introduction Springer, M.S., Cleven, G.C., Madsen, O., Dejong, W.W., Waddell, V.G., Amrine, H.M., Stanhope, M.J. (1997). Endemic African mammals shake the phylogenetic Tree. Nature 388, Springer, M.S., Debry, R.W., Douady, C., Amrine, H.M., Madsen, O., De Jong, W.W., Stanhope, M.J. (2001a). Mitochondrial versus nuclear gene sequences in deep-level mammalian phylogeny reconstruction. Molecular Biology and Evolution 18, Springer, M.S., Teeling, E.C., Madsen, O., Stanhope, M.J., de Jong, W.W. (2001b). Integrated fossil and molecular data reconstruct bat echolocation. Proceedings of the National Academy of Sciences of the United States of America 98, Stanhope, M.J., Madsen, O., Waddell, V.G., Cleven, G.C., De Jong, W.W., Springer, M.S. (1998). Highly congruent molecular support for a diverse superordinal clade of endemic african mammals. Molecular Phylogenetics and Evolution 9, Stanhope, M.J., Smith, M.R., Waddell, V.G., Porter, C.A., Shivji, M.S., Goodman, M. (1996). Mammalian evolution and the interphotoreceptor retinoid binding protein (IRBP) gene: convincing evidence for several superordinal clades. Journal of Molecular Evolution 43, Stanhope, M.J., Waddell, V.G., Madsen, O., De Jong, W., Hedges, S.B., Cleven, G.C., Kao, D., Springer, M.S. (1998). Molecular evidence for multiple origins of insectivora and for a new order of endemic African insectivore mammals. Proceedings of the National Academy of Sciences of the United States of America 95, Steel, M., Huson, D., Lockhart, P.J. (2000). Invariable sites models and their use in phylogeny reconstruction. Systematic Biology 49, Steel, M.A., Hendy, M.D., Penny, D. (1988). Loss of information in genetic distances. Nature 336, Stokstad, E. (1998). A fruitful scoop for ancient DNA. Science 281, Strauss, E. (1999). Can mitochondrial clocks keep time? Science 283, Stucky, R.K., Mckenna, M.C. (1993). Mammalian. Pp in The fossil record, ed. M.J. Benton, Chapman and Hall Press, London Swofford, D.L., Olsen, G.J., Waddel, P.J., Hillis, D.M. (1996). Phylogenetic Inference. Pp in Molecular systematics, Sinauer Associates, Inc, Sunderland MA USA Tajima, F. (1993). Simple methods for testing the molecular evolutionary clock hypothesis. Genetics 135, Teeling, E.C., Scally, M., Kao, D.J., Romagnoli, M.L., Springer, M.S., Stanhope, M.J. (2000). Molecular evidence regarding the origin of echolocation and flight in bats. Nature 403, Thewissen, J.G., Hussain, S.T., Arif, M. (1997). New Kohatius (Omomyidae) from the Eocene of Pakistan. Journal of Human Evolution 32, Tuffley, C., Steel, M. (1998). Modeling the covarion hypothesis of nucleotide substitution. Mathematic Biosciences 147, Ursing, B.M., Arnason, U. (1998). Analyses of mitochondrial genomes strongly support a hippopotamus-whale clade. Proceedings of the Royal Society of London Series B-Biological Sciences 265, Ursing, B.M., Slack, K.E., Arnason, U. (2000). Subordinal Artiodactyl relationships in the light of phylogenetic analysis of 12 mitochondrial protein-coding genes. Zoological Scripta 29,
61 Chapter 1 Introduction Van Den Bussche, R.A., Baker, R.J., Huelsenbeck, J.P., Hillis, D.M. (1998). Base compositional bias and phylogenetic analyses: a test of the "flying DNA" hypothesis. Molecular Phylogenetics and Evolution 10, Van Dijk, M.A.M., Paradis, E., Catzeflis, F., De Jong, W.W. (1999). The virtues of gaps: Xenarthran (Edentate) monophyly supported by a unique deletion in alpha a-crystallin. Systematic Biology 48, Vawter, L., Brown, W.M. (1986). Nuclear and mitonchondrial DNA comparisons reveal extreme rate variation in the molecular clock. Science 234, Waddell, P.J., Cao, Y., Hasegawa, M., Mindell, D.P. (1999a). Assessing the Cretaceous superordinal divergence times within birds and placental mammals by using whole mitochondrial protein sequences and an extended statistical framework. Systematic Biology 48, Waddell, P.J., Cao, Y., Hauf, J., Hasegawa, M. (1999b). Using novel phylogenetic methods to evaluate mammalian mtdna, including amino acid invariant sites Logdet plus site stripping, to detect internal conflicts in the data, with special reference to the positions of hedgehog, armadillo, and elephant. Systematic Biology 48, Waddell, P.J., Okada, N., Hasegawa, M. (1999c). Towards resolving the interordinal relationships of placental mammals. Systematic Biology 48, Weinreich, D.M. (2001). The rates of molecular evolution in rodent and primate mitochondrial DNA. Journal of Molecular Evolution 52, Wallis, G.P. (1999). Do animal mitochondrial genomes recombine? Trends in Ecology & Evolution 14, Weil, A. (2001). Mammalian evolution - relationships to chew over. Nature 409, Wolstenholme, D.R. (1992). Animal mitochondrial DNA: structure and evolution. International Review of Cytology 141, Wyss, A. (2001). Paleontology. Digging up fresh clues about the origin of mammals. Science 292, Xu, X., Janke, A., Arnason, U. (1996). The complete mitochondrial DNA sequence of the greater Indian rhinoceros, Rhinoceros unicornis, and the Phylogenetic relationship among Carnivora, Perissodactyla, and Artiodactyla (+ Cetacea). Molecular Biology and Evolution 13, Yu, Z., Chen, J., Ford, B.N., Brackley,M.E., Glickman, B.W., (1999). Human DNA repair systems: an overview. Environ. Molec. Mutag. 33, Zhang, D.X., Hewitt, G.M. (1996). Nuclear integrations: challenges for mitochondrial DNA markers. Trends in Ecology & Evolution 11, Zimmer, C. (1999). Fossil offers a glimpse into mammal s past. Science 283, Yang, Z.H. (1996). Among-site rate variation and its impact on phylogenetic analyses. Trends in Ecology & Evolution 11,
62 Chapter 2 Material and methods 54 Chapter 2 Material and methods 2.1 Introduction Mammal complete mt-dna is about kb (see section 1.8.1). Many vertebrate complete mitochondrial genomes have been sequenced using a shot-gun cloning approach - for example, (Krettek et al., 1995; Xu and Arnason, 1997; Arnason et al., 1997; Arnason et al., 1999). This method involves isolation of pure mt-dna followed by enzyme digestion and cloning into a vector. It is time-consuming, however sequences can be determined without any prior information of the sequence of the genome. However, now that large numbers of mitochondrial genomes of vertebrates have been sequenced, an improved approach is possible. Our strategy for sequencing complete mitochondrial genomes is as follows: first, total DNA is extracted in small quantities using High Pure PCR Template Purification Preparation kit (Roche). Then the complete mitochondrial genome is amplified by long-range PCR in 2 to 4 overlapping fragments of 3-10 kb in length. If necessary, these fragments may be gel purified. The long-range fragments then become templates for a series of shorter, overlapping PCR fragments (0.5-2kb) which are cleaned (either through a column or enzymatically) and then sequenced. This strategy is dependent on the availablibility of other complete mitochondrial genomes from related taxa, from which suitable primers may be designed. If there are no such sequences then cloning approaches will be the only option. 2.2 Development of long-range polymerase chain reaction Polymerase chain reaction (PCR), invented in 1983, has had a major impact on molecular biology. The development of PCR makes it possible to amplify any target DNA fragments and to read the genetic sequences of these DNA fragments. Before the technique of long-range PCR developed in 1994, the maximum size of a PCR fragment was less than 5kb long (Cohen, 1994). Some reports using a two-step PCR
63 Chapter 2 Material and methods 55 procedure and an annealing temperature of 65 C amplified template up to 10Kb long (Kainz et al., 1992). After the introduction of another enzyme into the reaction (Pfu, for example) which can correct any mismatches during polymerization, more stable long-range PCR amplification of more than 10Kb become easier. The length of longrange PCR products can reach more than 35Kb (for example, (Barnes, 1994) in lambda bacteriophage templates). This long-range PCR technique has become more and more popular and has been used to amplify mitochondrial genomes. Complete amplification of mitochondrial genomes had been reported with different success in different taxa (Cheng et al., 1994; Nelson et al., 1996). As well as decreasing the time needed to purify mitochondrial DNA, one of the reasons we use long-range PCR to amplify mitochondrial genomes is to reduce the chances of amplifying nuclear copies of mitochondrial DNA (see section 1.8.4). 2.3 Primer design Our laboratory is currently sequencing many different mitochondrial genomes from mammals and birds. For this study, primers were designed to sites conserved across most of the available mammal sequences. Complete mammal mitochondrial genomes were downloaded from GenBank and different parts of the sequences were aligned in ClustalX ( to find conserved sites. The computer program Oligo4 (National Biosciences Inc Annapolis Lane. Plymouth, MN 55447, USA.) was used to design new primers. Some general principles of primer design are listed here: Decide on the annealing temperature for PCR reaction: Primers are usually about bases and a desirable annealing temperature (Tm) is from 55 C to 70 C. A quick way of estimating annealing temperature is: 4 (G+C) C + 2 (A+T) C. A more precise annealing temperature estimate can be obtained from Oligo4. For a long-range PCR amplification, higher annealing temperature and longer primers can guarantee primers binding to correct sites and decrease the chance of mispriming; longer PCR products require longer primers. Avoid secondary structure, self annealing and upper-lower primer annealing: If these conditions occur, they will decrease the amount of free primers which can bind to the target positions. Self annealing and upper-lower primer annealing is
64 Chapter 2 Material and methods 56 even worse if the annealing site is in the 3 position. Taq enzyme can polymerize from this position and make a longer but useless primer. A general rule is: prevent any secondary structure which has negative free energy, prevent 3 end mispriming more than 2-4 base pairs. Avoid mispriming with other part of the genome: Where possible, check against other known sequences from the template for PCR or other closely related species whose mitochondrial genome sequences are available. The same rule can apply for this criterion: avoid 3 end mispriming. Use of degenerate sites: Degenerate sites are created by incorporating more than one base into a particular site of the primer. They are generally used to increase the chance of the primer annealing to the target sequence and may make the primer more useful for other taxa. It is better not to use too many degenerate sites, 2 or 3 in a 20 nucleotide primer is usually OK as degenerate sites can decrease a primers Tm and specificity. Nucleotide T binds with other bases: It seems that the nucleotide T can bind with any other base without significant effect (Kwok et al., 1990). Often, T can be used instead of a degenerate site. Other useful hints: If it is possible, design a primer with G+C content > 50%. This can increase annealing temperature and primer-template binding strength. If the annealing temperature difference between upper primer and lower primer is less than 3 then the PCR reaction will be easy to optimize. If possible, there should be G or C at the 3 end of the primer to help annealing. The primers for this study were ordered either from Sigma Genosys in Australia ( or from Gibco BRL, Life Technology in New Zealand ( Some examples of long-range PCR primers (L for forward primer, H for reverse primer) L23 GCAAGGCACTGAAAATGCCTAGAT ; H5100 AGGCTTTTGAAGGCCTTTGGTCT L2050 CCGTGCAAAGGTAGCATAATCAC ; H7580 CGCCTGGAATAGCATCTGCT TTT L7371 GGYCATCAATGATAYTGAAGCTA ; H13734 AGGCCAAATTGRGCTGATTT TCC L12175 TGRGAAGGAGTRGGMATTATRTC ; H29 AAACCCATCTARGCATTTTC AGTG
65 Chapter 2 Material and methods 57 Some examples of short-range PCR primers (L for forward primer, H for reverse primer) L1753 AACTGGGATTAGATACCCCACTAT H2157 CCATAGGGTCTTCTCGTCTT L2520 AATCCAGGTC GGTTTCTATC T H4461 TGGGCRATTG ATGAGTATGC L3148 CWCARACWAT YTCYTATGAA GT H5549 TRATAGGTAT TACTATAAAG AA L5310 CCTACTCRGC CATTTTACCT ATG H7197 TCTACTTCTT GNGCRTCTAT L8200 ATGAACGAAAATCTATTTACCTCTT H9803 CTCATTCTAGTCCTTTATTTAATA L8373 CTTATTTATTCAACCTATAGCATTAGC H11708 TAAGACCAATGGATAACTTCT L10647 TTTGAAGCAG CAGCCTGATAYTG H14363 CTCGGCAKATGTGKGTTACGGA L13322 CTAGGMTATTTCCCAMCTATTATACA H15412 GTTTATTAGAATBTCAGCTTTGGG L15305 CCATTACMYCGGTYTTGTAAACC H15751 GCGGGWTGSTGRTYTCTCG Note: Y=C+T, R=A+G, W=A+T, K=T+G, M=A+C, S=C+G, D=A+T+G, N=A+T+C+G Our primer sequences are kept in a data base created with the GCG package (Butler, 1998). Once some initial sequence has been obtained, it is possible, using Fasta search in GCG to find primers that will bind to allow primer walking. The Fasta function in GCG is also useful for comparing new sequences with those from other taxa to check for any possibility of contamination. 2.4 Sequencing complete mitochondrial genomes DNA extraction DNA contamination is a major problem for PCR amplification and contaminating DNA can be detected, particularly with universal primers, from fentogram amounts (G.H., pers. comm.). Tissue samples should be from reliable sources (for this study, tissues sources can be found in Chapter 3). All reagents and equipment used for DNA extraction should be free from DNA contamination. The bench was cleaned with ethanol before DNA extraction began, fresh sterile scalpel blades were used and changed between samples. Solutions from the extraction kit were aliquoted by pouring and the milliq water used for elution was sterilised by autoclaving. Filter tips were used through out and gloves were worn when handling the tissue and other equipment. A personal set of DNA free pipettes was kept. Generally, in our laboratory, cross contamination is a minor problem, these precautions seem adequate in preventing it.
66 Chapter 2 Material and methods 58 The High Pure PCR Template Preparation Kit (Roche) was used for genomic extraction. The protocol is available from the web site ( and was modified slightly for our purposes. Typically, mg of tissue (liver or muscle) was cut into small pieces and digested with proteinase-k (800 µg) in 200 ul of Tissue Lysis Buffer at 55º C. [Proteinase-K removes nuclease that can degrade the DNA; for successful long range PCR amplification, it is important to have high molecular weight DNA, of good quality.] The digest was checked after 1-2 hours; if it was incomplete, additional proteinase K was added and the digestion continued. The digest could be left overnight. It was important to break the tissue down as much as possible, otherwise it might clog up the filter in the following steps. [Proteinase K will break down if stored at -20º C for a long time.] Following digestion, an equal volume of Binding Buffer was added to the tube, and the digest incubated at 72º C for 10 min, after which 100 µl isopropanol was added. [Binding Buffer contains a high salt concentration necessary for binding the DNA to the filter in the column. Isopropanol precipitates high molecular weight DNA, also preventing it from passing through the filter.] At this point, the solution was loaded on to a column and spun for 1 min at 8000 rpm in a bench top centrifuge. The supernatant was collected and discarded and the column washed with Wash Buffer (1 min, 8000 rpm) to clean the DNA bound to the column. After the wash step, the column was dried to remove excess ethanol (which can interfere with PCR reactions) by spinning for 10 sec at maximum speed. The collection tube was then discarded and the column placed in a clean 1.5 ml microcentrifuge tube. The DNA was eluted in a low salt buffer, either with Elution Buffer (supplied with kit) or sterile water, that had been prewarmed to 70º C. To increase elution efficiency, the elution buffer was typically left on the column for 10 minutes before the final spin (2 min, 8000 rpm). The column could also be heated at 70º C for 1minute before the final spin. An aliquot of genomic DNA was run on a 0.8% (w/v)/1xtae agarose gel to check the concentration. The DNA was then used for long-range PCR, which was generally more successful if the genomic DNA was from a fresh extraction. The DNA was stored at 4º C for a
67 Chapter 2 Material and methods 59 short time (< 1 week). Typically, genomic DNA was aliquoted (50 µl) and stored at -20º C or -80º C for 1-2 months Polymerase Chain Reaction, PCR Long-range PCR was done using Expand Long PCR System (Roche) following the manufacturer s protocol and from web site: The thermocycling program for long range PCR was adopted and modified from (Nelson et al., 1996), as follows (for a 9 kb fragment): [1] 93 C, 2 min [2] 93 C, 30 sec [3] 60 C, 30 sec [4] 68 C, 7 min [5] go to step 2 repeated 9 times [6] 93 C, 30 sec [7] 60 C, 30 sec [8] 68 C, 7 min + 20 sec each cycle [9] go to step 6, repeated 24 times [10] 68 C, 7 min [11] 4 C, for ever. Annealing temperature (step 3 and 7) is dependent on the Tm of the primers and on how well they match the target DNA. For this thesis annealing temperatures from 52 C to 60 C were used. The time for product extension (step 4 and 8) depends on the length of template, as a rule of thumb, sec is allowed for each 1kb. After long-range PCR amplification, 5-10% of the PCR products was run on a 0.8% (w/v)/1xtae agarose gel which is then stained in ethidium bromide for 15 min and the size of products was determined. An example of such a gel (from the vole sample) is shown on Fig 2.1 A. The long-range PCR products were gel cut purified (see section 2.4.3) and used as template for a series of short PCR amplifiction (0.5-2 kb, depending on the availability of primers) using Taq DNA polymerase (Roche or Sigma). The thermocycling program for PCR was as follow: [1] 94 C, 2 min [2] 94 C, 30 sec [3] C, 30 sec [4] 72 C, min [5] 72 C, 7 min [6] go to 2, repeated 30 times [7] 4 C forever PCR product purification To obtain high quality sequencing data in which there is very little ambiguity, it is essential to have a single PCR product that is free of primers. If primers are present
68 Chapter 2 Material and methods 60 during dye terminator cycle sequencing they can act as extension primers, creating two sets of labeled fragments. If there are multiple bands present after PCR amplification from mispriming, for example (as in Fig 2.1B, c), the band of interest can be purified by running the whole reaction mix on an agarose gel. The fragment of interest was then excised with a scalpel and the DNA purified out of the agarose using a gel purification kit (Concert Gel Extraction Systems, GibcoBRL) and following the manufacturer s protocol. Typically, recovering from gel extraction is 50-80%; 5-10% of the DNA product was run on a 0.8% (w/v)/1xtae agarose gel and quantified again before being used in a sequencing reaction. If a single PCR product is present after amplification (Fig 1.2d) it can be purified by either: Column purification (Concert Rapid PCR Purification System, GibcoBRL), according to the manufacturer s protocol. This method typically recovers 70-90% of the product; the product is quantified before being used for sequencing. Enzymatic digestion with exonuclease I (ExoI, GibcoBRL) and shrimp alkaline phosphatase (SAP, GibcoBRL). ExoI degrades the residual PCR primers and SAP dephosphorylates the residual dntps. Typically, 1 µl ExoI and 2 µl SAP are added to the PCR reaction and incubated at 37º C, 30 min. This is followed by 15 min incubation at 80º C to kill both enzymes. The PCR product is then used directly for cycle sequencing PCR product quantification Using the correct amount of PCR product in a cycle sequencing reaction is critical to the quality of sequence data; too little can decrease the signal strength and the length of the read while too much DNA in the reaction can generate high signals over the first 300 bases, which decline to little or no signal. A rough estimate of the amount required can be made by dividing the size of the fragment by 20. For example, for a PCR product of 500 bp, 25 ng will be required in the sequencing reaction. For this study, the concentration of PCR products was estimated by comparing their


69 Chapter 2 Material and methods Kb 5 Kb 2 Kb Fig 2.1 A: Long PCR gel run. L: 1Kb plus ladder from GibcoBRL. 5 Kb 2 Kb Fig 2.1 B: Short PCR gel run. L1: 1Kb plus ladder from GibcoBRL. L2 low DNA mass ladder from Gibco.
70 Chapter 2 Material and methods 62 fluorescence to that of of a low molecular weight mass ladder (Gibco BRL, Fig 2.1B, L2) on an ethidium-stained agarose gel. Though not particularly accurate compared to other quantification such as High Performance Liquid Chromatography (HPLC), the above estimates were sufficient to routinely obtain high-quality sequence data Cloning It is not always possible to get high-quality sequence by direct sequencing PCR products; products from the mitochondrial control region are particularly difficult. This is due to two characteristics of direct PCR sequencing from a control region. One is the presence of different copy numbers of a G/C homopolymer (more than 10 bases in this study) in a single sequencing reaction (Fig 2.2 d). Slippage during the PCR reaction is blamed for this phenomena (in ABI Prism technical booklet, Mitochondrial DNA sequencing, Perkin Elmer). A second possibility is the occurrence of heteroplasmy (the occurence of different sequences in a particular region, in different cells of the same organism) in a repetitive motif, usually located in the 3 portion of the control region (Fig 2.2 b). Heteroplasmy in the control region of mitochondrial DNA is well documented (Xu and Arnason, 1994; Krettek et al., 1995; Xu et al., 1996; Kim et al., 1998). The number of repetitive motifs varies a lot and a study of 77 clones from control regions found the distribution of repeat numbers followed a binomial distribution (Xu and Arnason, 1994). In both cases, following the G, C homopolymers and repetitive motifs regions results in an unreadable pattern (Fig 2.2 b and d). To solve this problem we cloned the PCR product in E. Coli. (Fig 2.2 a and c ). All the clones sequenced are in the control region, less than 1kb long. Sequences were obtained from both directions with more than 70% overlapping.

71 Chapter 2Material and methods 63 a b c d Figure 2.2 An electrophenograph from Sequence Navigator. a and c are from cloned products, b and d are PCR products. After an AT repeat in 2 and a G homopolymer in 4, the sequences become messy and cannot be read. Clone the PCR products made the sequences readable again (a and c).
72 Chapter 2 Material and methods 64 A. Ligation and cloning PCR fragments were ligated to the vector pgem -T vector (Promega) according to the manufacturer s protocol. An equi-molar ratio of insert to vector was used and the ligations were carried out in a total volume of 10 µl, at 4 C overnight. Following ligation, 50 µl of Max Efficiency DH5α Competent Cells (GibcoBRL ) were defrosted in ice and added to the reaction which was heat shocked at 42 C for 45 sec then put on ice for 2 min. LB or SOC medium (300 µl, see Promega manual) was added and the reaction mix was shaken at 37 C for 1hr then plated on Luria plates containing 50 µl X-Gal, 100 µl IPTG and 100 µg/ml Ampicillin (see Promega manual). The plates were incubated at 37 C overnight. Blue and white colonies developed on the plates, white colonies were chosen as these contain an insert which interrupts the β-galactosidase gene. White colonies were picked into 3 ml LB medium containing 100 µg/µl Ampicillin at 37 C with shaking (225 rpm) overnight. B. Purificationation of plasmid DNA Plasmid DNA was extracted using the GenElute Plasmid Miniprep kit (Sigma) according to the manufacturer s protocol. The procedure takes less than one hour and typically recovers 15 µg of plasmid DNA from 1-2 µl of overnight culture. After purification, the plasmid DNA was digested with Pst1 (Gibco) in a 25 µl reaction containing 1x buffer (supplied by manufacturer), 10 µl Pst1, and 5 µl plasmid DNA at 37 C for 30min. The digestion was run on a 0.8% (w/v)/1xtae agarose gel. The enzyme Pst1 cuts once in the vector sequence. The vector, pgem -T is 2.9 kb in length, therefore a recombinant plasmid with insert should be: plasmid DNA (2.9kb) + insert DNA in length, for example plasmid with a 2 kb insert would give a band at 4.9 kb. Plasmid DNA of the correct size was chosen and sequenced using primers within the insert or the universal forward and reverse primers which binds vector sequence franking the insert.
73 Chapter 2 Material and methods Sequencing Most of the sequences were obtained in both the forward and reverse directions. If there were ambiguities in sequence reading, another sequence reaction using different primer was carried out to check the ambiguity. A. Sequencing reaction Sequencing reactions were performed using a protocol modified from the PE Applied Biosystems manual. A half reaction (10 µl) was made containing 4 µl Big Dye (PE), 1.6 µl, 1 pmole/µl primer, ng PCR or plasmid template DNA (see section 2.4.4) and added water to 10µl. The thermocycling program was as follows: [1] 96 C, 10 sec [2] 50 C, 5 sec [3] 60 C, 4 min [4] go to 1, repeated 24 times [5] 4 C, forever. B. Precipitation After the sequencing reaction had finished it was concentrated for loading on a gel by precipitation as follows: 25 µl of 95% (v/v) ethanol and 1 µl 3M sodium acetate acid (NaOAc Ph 4.7) were added to the reaction, which then stood for more than 15 min or longer at room temperature before being centrifuged at 13,000-14,000 rpm for 15 min. The supernatant was removed with a pipette and µl 70% (v/v) ethanol added to wash the pellet. The tube was centrifuged again,13,000-14,000 rpm for 5 min and dried at room temperature or at C for 5-10 min. C. Sequence analysis The loading, running and tracking of the sequences was done on a 377 ABI Applied Biosystems automated sequencer either in the Institute of Molecular BioSciences, Massey University, Palmerston North or in the department of Biolgical Sciences, the University of Waikato, Hamilton. The resulting electropherograms of the sequence data were processed using Sequencing Analysis 3.4 (Perkin Elmer Applied Biosystems Inc., and these sequences were then checked and made into contig using Sequence Navigator software (Perkin Elmer Applied Biosystems Inc., This software aligns two sequences using a Clustal algorithm then compares the sequences and marks the
74 Chapter 2 Material and methods 66 differences by creating a shadow sequence. An example of sequences and electropherograms is shown in Fig 2.2. Entire mitochondrial genomes were assembled in Sequence Navigator and checked for any differences in overlapping regions, particularly regions of overlap at the ends of long range fragments. D. Good sequences vs. bad sequences Primer binding, quality and quantity of template are the three main factors that can influence the quality of sequencing reaction. In addition to the criteria for PCR primers discussed in section 2.3, sequencing primers normally need more specific binding to the target sequence compared to PCR primers. The template for sequencing must be free from the primers used to generate it in the PCR as well as other contaminating DNA fragments (template clean-up is discussed in section 2.4.3). The correct amount of template in the sequencing reaction is also crucial to the quality of the data, the longer the template, the larger amount of DNA it needs. If sequencing fails or is noisy, you can suspect these three conditions: 1) the primer is not matched well with the template or more than one primer site exists in the reaction solution, 2) template is not of good quality or contaminated with mispriming products, 3) template amount is too high or too low. If you still have bad sequences back after you have tried everything, even a positive control, you may suspect some mistakes may have happened from the sequencing facility. E. Finding the position of different regions in the complete mitochondrial genome After all the fragments and contigs are assembled and the complete mitochondrial genome is finally finished, the sequences can be exported in text format. To locate the positions of the 13 amino acids and 24 RNA coding regions, the sequence was aligned with complete sequence from other closely related mammals, using ClustalX. One data set of aligned protein coding regions and another of aligned RNA coding regions were created in Se-Al ( by manually aligning the new sequence with the sequences from related mammals. The beginning and the ends
75 Chapter 2 Material and methods 67 of the proteins and the RNAs are conserved and easily checked. Another more efficient method of defining the starts and stops in the sequence is by using Sequin program from GenBank. A known mitochondrial sequence can be replaced with a new one using the update sequences function. Sequin automatically aligns the two sequences and redefines the coding regions and RNAs. 2.5 Data alignment To align is to arrange the sequence in accordance to position homology, that is, characters from different taxa derived from the same ancestor are aligned into a single column. Sequence alignment is not a trivial problem because similarity does not guarantee derived from the same ancestor. Alignment algorithms are designed to maximize sequences similarity and penalties are introduced in order to maximize their similarity. For example, gaps from insertions or deletions are considered to be less frequent than nucleotide substitutions, consequently are given higher penalty. Likewise, for nucleotide substitutions, transversions are less common compared to transitions, so transversions carry a lower penalty than gaps but greater than transitions (Page and Holmes, 1998). Structures are normally more conserved than sequence, therefore they can make a better reference in alignment. For RNA genes, rates of nucleotide substitution are lower in stems than loops (Springer et al., 1995). It is also advised to use different alignment data sets to build trees and compare their results. Like morphology data, convergence can happen but in different respects. There are only 4 nucleotides for molecular characters so multiple changes (for example, A G T) and reverse changes (for example, A G A) can happen frequently and make alignment difficult. Even these sequences are aligned to their homologous sites, the accumulation of multiple changes will decrease the distance of internal edge and/or converge to a wrong tree. Two alignment programs were used in this study: ClustalX ( and Se-Al ( ClustalX builds a Neighbor Joining tree first from pairwise alignments, then aligns
76 Chapter 2 Material and methods 68 multiple sequences automatically, based on the tree. Se-Al is a manual alignment program that you can change the alignment by eye. Se-Al also has some useful options, for example translating the data into amino acids and representing the amino acids in color on the screen, which can make alignment easier. For RNA-encoding sequence data, alignments were made on the basis of secondary structure ( All complete mammalian mitochondrial genomes available from GenBank were downloaded and aligned in two files, one containing concatenated protein gene sequences and the other concatenated rrna and trna sequences. As mitochondrial genomes in this study were finished, they were aligned to the two data sets. The data sets were exported from Se-Al in various formats, for example, the data can be saved as amino acids, and/or with ambiguous sites excluded, and /or with third positions in codons excluded, or it can be recorded in two states, R/Y (purine/pyrimide). The exported data sets were ready to use in molecular phylogenetic programs. 2.6 Programs used for phylogenetic inference in the present study Paup* ( or was written by David Swofford (1998) and originally means: Phylogenetic Analysis Using Parsimony. It has become much broader with the inclusion of more methods. It includes parsimony, distance matrix, and maximum likelihood methods and many statistical tests. This program is very friendly and easily to manipulate. It can do most analyses for nucleotide sequences but has only limited functions for amino acids sequences. Molphy: ( (Adachi and Hasegawa, 1995). Jun Adachi and Masami Hasegawa have written a package MOLPHY, currently in version 2.3, carrying out maximum likelihood inference of phylogenies for either nucleotide sequences or protein sequences. This program use ML method based on the Dayhoff model and JTT model (Dayhoff et al., 1978) for amino acid replacements. To increase the efficiency, the searching
77 Chapter 2 Material and methods 69 strategy star decomposition is used and this searching strategy is fast enough for a ML method. When the nucleotide frequencies of protein coding genes differ among lineages, amino acid frequencies may differ less (Adachi and Hasegawa, 1992). This allows ML on amino acids sequence to have good performance. Protdet programs (Penny et al., 1999) This program calculates LogDet (paralinear) distances (Lockhart et al., 1994) on protein sequences. From these it can do a distance Hadamard transform, from which the closest tree can be found or a Lento plot made (Lento et al., 1995) Other phylogeny and molecular biology program. A comprehensive collection of phylogenetic programs can be found and links to download from the web sites: and
78 Chapter 2 Material and methods 70 Reference List 1. Adachi, J., Hasegawa, M. (1992). Amino acid substitution of proteins coded for in mitochondrial DNA during mammalian evolution. Japan Journal of Genetics 67, Adachi, J., Hasegawa, M. (1995). MOLPHY: Programs for Molecular Phylogenetics Ver Tokyo, Japan: Institute of Statistical Mathematics. 3. Arnason, U., Gullberg, A., Janke, A. (1997). Phylogenetic analyses of mitochondrial DNA suggest a sister group relationship between Xenarthra (Edentata) and Ferungulates. Molecular Biology and Evolution 14, Arnason, U., Gullberg, A., Janke, A. (1999). The mitochondrial DNA molecule of the aardvark, Orycteropus afer, and the position of the Tubulidentata in the eutherian tree. Proceedings of the Royal Society of London Series B-Biological Sciences 266, Barnes, W.M. (1994). PCR amplification of up to 35-kb DNA with high fidelity and high yield from lambda bacteriophage templates. Proceedings of the National Academy of Sciences of the United States of America 91, Cheng, S., Higuchi, R., Stoneking, M. (1994). Complete mitochondrial genome amplification. Nature Genetics 7, Cohen, J. (1994). 'Long PCR' leaps into larger DNA sequences. Science 263, Dayhoff, M.O., Honeycutt, R.L., Ruvolo, M. (1978). A Model of Evolutionary Change in Proteins. Pp in Atlas of protein sequence structure, National Biomedical Research Foundation Press, Washington. 9. Kainz, P., Schmiedlechner, A., Strack, H.B. (1992). In vitro amplification of DNA fragments greater than 10 kb. Analytical Biochemistry 202, Kim, K.S., Lee, S.E., Jeong, H.W., Ha, J.H. (1998). The complete nucleotide sequence of the domestic dog (Canis familiaris) mitochondrial genome. Molecular Phylogenetics and Evolution 10, Krettek, A., Gullberg, A., Arnason, U. (1995). Sequence analysis of the complete mitochondrial DNA molecule of the hedgehog, Erinaceus europaeus, and the phylogenetic position of the Lipotyphla. Journal of Molecular Evolution 41, Kwok, S., Kellogg, D. E., McKinney, N., Spasic, D., Goda, L., Levenson, C., and Sninsky, J. J. (1990) Effects of primer-template mismatches on the polymerase chain reaction: human immunodeficiency virus type 1 model studies. Nucleic Acids Research 18, Lento, G.M., Hickson, R.E., Chambers, G.K., Penny, D. (1995). Use of spectral analysis to test hypotheses on the origin of pinnipeds. Molecular Biology and Evolution 12, Lin, Y.H., McLenachan, P.A., Gore, A.R., Phillips, M.J., Penny, D. (2001a). Four new mitochondrial genomes, and the stability of evolutionary trees of mammals. Prepared for submission to Molecular Biology and Evolution. 15. Lin, Y.H., Waddell, P.J., Penny, D. (2001b). Pika and vole mitochondrial genomes add support to both rodent monophyly and Glires. Prepared for submission to Gene. 16. Lockhart, P.J., Steel, M.A., Hendy, M.D., Penny, D. (1994). Recovering evolutionary trees under a more realistic model of sequence evolution. Molecular Biology and Evolution 11, Nelson, W.S., Prodohl, P.A., Avise, J.C. (1996). Development and application of long-pcr for the assay of full- length animal mitochondrial DNA. Molecular Ecology 5,
79 Chapter 2 Material and methods Page, R.D.M., Holmes, E.C. (1998). Models of Molecular Evolution. ed. E.C. Holmes Oxford, Pp in Molecular evolution : a phylogenetic approach, Blackwell Science Press, MA USA. 19. Springer, M.S., Hollar, L.J., Burk, A. (1995). Compensatory substitutions and the evolution of the mitochondrial 12s ribosomal-rna gene in mammals. Molecular Biology and Evolution 12, Swofford, D.L. (1998). PAUP*, Phylogenetic Analysis Using Parsimony (*and Other Methods). Version 4, Sinauer Associates, Inc, Sunderland MA USA. 21. Xu, X., Arnason, U. (1994). The complete mitochondrial DNA sequence of the horse, Equus caballus: extensive heteroplasmy of the control region. Gene 148, Xu, X., Gullberg, A., Arnason, U. (1996). The complete mitochondrial DNA (mtdna) of the donkey and mtdna comparisons among four closely related mammalian species-pairs. Journal of Molecular Evolution 43, Xu, X.F., Arnason, U. (1997). The complete mitochondrial DNA sequence of the white rhinoceros, Ceratotherium Simum, and comparison with the mtdna sequence of the Indian rhinoceros, Rhinoceros Unicornis. Molecular Phylogenetics and Evolution 7,
80 Chapter 3 Results 72 Chapter 3 Results Background and overview of my contribution Compared to traditional morphological studies, molecular phylogenetics has led come to a well resolved mammalian tree. The most important is that the mammalian trees derived from nuclear genes have good agreement with that from mitochondrial data sets (including this current study). Based on the strong agreement of mammalian trees from different genes (mitochondrial protein coding genes, mitochondrial RNA genes and nuclear genes), the evolutionary tree of mammals will be resolved soon. The final results from this study, in agreement with the nuclear genes, is the split of mammalian orders into four major groups (see Lin et al. 2001). Some of my results give support to hypotheses from morphological analysis but some do not. These disagreement will be settled soon in respect of the fast accumulation of sequence data. Overall I have sequenced 8 mitochondrial genomes from mammals. I learned the techniques on the possum and bandicoot samples. The other six I sequenced entirely on my own, though in conjunction with others in the laboratory. 1. Matthew J Phillips, Yu-Hsin Lin, Gabrielle L. Harrison and David Penny (2001) Mitochondrial genomes of a bandicoot and a brushtail possum confirm the monophyly of australidelphian marsupials. Proceedings of the Royal Society of London Series B-Biological Sciences. 268: From morphological studies, the marsupial mammals are identified as 7 orders. One hypothesis is that these 7 orders are united into two cohorts: Ameridelphia and Australidelphia. However, previous molecular studies from mitochondrial genes have tended to favor bandicoot (Australidelphia) associated with Ameridelphian group or as a marsupial root. In contrast, analysis from nuclear genes have supported the monophyletic Australidelphia.
81 Chapter 3 Results 73 Our complete mitochondrial sequences from two marsupials: brushtail possum and northern brown bandicoot, together with previous available marsupial mitochondrial genomes: Virginia opossum and the wallaroo, provide support of the Ameridelphia / Australidelphia split. The results from previous mitochondrial studies may be biased from short sequences and the nucleotide composition bias may have also contributed to this. From this study, we also found that, RY coded data possess higher signal-to-noise ratios and reduce the composition bias. Thus, RY coding appears to be the most appropriate treatment of this data. The DNA extraction was done by myself and Matthew and I did most of the PCR and sequencing. The possum and bandicoot samples were organized by Matthew. Basically, I learned sequencing techniques, alignment, phylogeny and wrote the first draft of the paper, Matthew finished it. 2. Yu-Hsin Lin and David Penny (2001) Implications for bat evolution from two new complete mitochondrial genomes. Molecular Biology and Evolution 18(4): The evolutionary history of bats and their position in the eutherian tree is uncertain. Some hypotheses have even split the bats into two unrelated groups (microbats and megabats), others have the megabats evolving from within microbats. Complete mitchondrial genomes of two bats: a New Zealand long-tailed bat (a microbat) and a little red flying fox (a megabat) were sequenced. The new sequences combined with other available complete mitochondrial genomes are used to test the possible position of bats in the eutherian tree. Our results support the monophyly of bats and reject the hypothesis that megabats are closer to primates than to bats. The Archonta (primates, bats, tree shrews and flying lemurs) did not form a natural group from this data set. Bats are a member of Laurasiatheria but their sister relationship to mole from previous study is questioned. From this study, we cannot rule out the possibility that flying fox can be nested inside the microbats and more bats from other families (especially, from Rhinolophidae) await examination. The approximate timing of the origin of the bat lineage is more than 70 millions years ago.
82 Chapter 3 Results 74 In this study, we used two independent data sets from RNA and protein coding genes. The conclusions of this study are reinforced from similar results using these data sets. I did all the laboratory work (DNA extraction, long + short-range PCR, sequencing), alignment and most of the phylogenetic analysis for two bats. The manuscript was written by myself and David. The microbat sample was from Brian Lloyd and the megabat sample was arranged by Matthew. 3. Yu-Hsin Lin, Peter J Waddell and David Penny (2001) Pika and vole mitochondrial genomes add support to both rodent monophyly and Glires. (submitted to GENE) The position of rodents in the eutherian tree is unknown. Whether the rodents and the lagomorphs (pikas and rabbits) form a monophyletic group (Glires) needs more evidence to support it. Even the monophyly of rodents have been questioned. We have sequenced the complete mitochondrial mitochondrial genomes of the collared pika (a lagomorph) and Taiwan vole (a rodent) in order to approach the questions above. The pika and vole complete mitochondrial sequences were analysed together with 27 other mammalian mt-genomes The results from this study is as follow: 1) The seven rodent genomes are always monophyletic in the unrooted placental tree. 2) Glires (monophyletic rodents and lagomorphs) appears frequently. 3) In trees rooted with marsupials and platypus, the root can come into the three murid rodents (rat, mouse and vole), and distort some groups that are shown in the unrooted tree, including the monophyly of rodents. In rooted trees constrained for rodent monphyly, they looked similar to unrooted tree and Glires is recovered. 4) Tree shrew is locally stable but it frequently with lagomorphs rather than joins the primates to form the Archonta. 5) The deficit of DNA repair system in murid rodents may blamed for their high DNA transition rate.
83 Chapter 3 Results 75 From this study, the result emphasis the importance of carrying both carrying out both an unrooted and rooted analysis. I arranged the vole sample and pika was from Peter. I did all the laboratory work, alignment and most of the phylogenetic analysis for a pika and a vole. Manuscript was written with David and Peter. 4. Yu-Hsin Lin, Patrica A McLenachan, Alica R Gore, Matthew J Phillips and David Penny (2001) Four new mitochondrial genomes, and the stability of evolutionary trees of mammals. (prepared for submission to Molecular Biology and Evolution ). Four new complete mitochondrial genomes, a gymnure, a shrew, a horseshoe bat, and a fur seal, were sequenced in order to improve the stability of placental tree. A revision to the hedgehog sequence is also reported. From the nuclear and mitochondrial data sets, placental mammals are tending to split into four groups. These are: Xenarthrans, Afrotheria, Supraprimates, and Laurasiatheria. However, trees from complete mitochondrial mt-genomes did not have this four group classification, the hedgehog did not join the other Lipotyphla (the mole) but as the deepest branch and distorted the placental tree. The hedgehog has an anomalous nucleotide composition in the mitochondrial sequences and the position of hedgehog is questioned. The question whether the megabats derived from within microbats is also studied in this data set. With our 4 mitochondrial genomes included and carefully compared the unroooted trees (Within the Laurasiatheria, within the Eutheria) and the rooted trees (eutherian trees rooted with placental and marsupial outgroups). We can find the possible long branches attracted to the outgroups. In this study, hedgehog and gymnure were sister to the mole/shrew but are attracted to the outgroups in the eutherian and mammalian tree. When we tried to constrained the Lipotyphla (hedgehog, gymnure, mole and shrew) as a monophyletic group, we have same 4 splits as mentioned above. The root of the eutherian tree is still not resolved.
84 Chapter 3 Results 76 The micrbats can be either monophyletic or paraphyletic, depending on the data sets and analysis methods. I arranged the samples of shrew and horseshoe bat. The fur seal was provided by Padraig Duignan and the gymnure arranged by Abby. I did all the laboratory work for the shrew and the gymnure. I did part of the DNA extraction and long-range PCR of horseshoe bat, Trish complete the laboratory work for the bat. The fur seal was sequenced by Alicia and Trish. I did the alignment and most of the phylogenetic analysis for these four taxa. The manuscript was written by myself and David with input from Trish and Matthew. The first two manuscripts have been published and are included as pdf files. The pika/vole manuscript has been submitted to Gene and the fourth is about ready to be submitted to Molecular Biology and Evolution. The complete mitochondrial genomes sequenced for this study are available from GenBank on the web site: or under the accession numbers: brushtail possum Trichosurus vulperula: NC_003039; northern brown bandicoot Isoodon macrourus: NC_ ; New Zealand long-tailed bat Chalinolobus tuberculatus: NC_002626; little red flying fox Pteropus scapulatus: NC_002619; gymnure or moon rat Echinosorex gymnura: NC002808; collared pika Ochonta collaris: NC_003033; Formosan shrew Soriculus fumidus: NC_ and Taiwan vole Microtus kikuchii: NC_03041.
85 Chapter 3 Results 88 Pika and Vole Mitochondrial Genomes Increase Support for both Rodent Monophyly and Glires Yu-Hsin Lin 1, Peter J Waddell 1,2, and David Penny 1 1 Institute of Molecular BioSciences Massey University Palmerston North New Zealand 2 Present address: Department of Statistics University of South Carolina Columbus, SC USA Address for correspondence: Yu-Hsin Lin, Institute of Molecular BioSciences Massey University Palmerston North New Zealand Y.lin@massey.ac.nz Key words: Glires, long branch attraction, mammals, mitochondrial genomes, pika, rodent monophyly, vole pika & vole 13/12/10, page 88
86 Chapter 3 Results 89 Abstract Complete mitochondrial genomes are reported for a pika (Ochotona collaris) and a vole (Microtus kikuchii) then analysed together with 35 other mitochondrial genomes from mammals. As expected, the pika joins with the other lagomorph (rabbit) and the vole with murid rodents (rat and mouse). In addition, with hedgehog excluded, the seven rodent genomes are consistently a homogeneous group in the unrooted placental. Except for uncertainty of the position of tree shrew, the clade Glires (monophyletic rodents plus lagomorphs) is consistency found. The unrooted tree obtained by ProtML is compatible with a reclassification of mammals (Waddell, et al. Syst Biol 48:1-5, 1999) which is also supported by other recent studies. However, when this tree is rooted with marsupials plus platypus, the outgroup often joins the lineage leading to the three murid rodents, so the rodents are no longer monophyletic. Apart from misplacing the root, the presence of the outgroups also distorts other parts of the unrooted tree. Either constraining the tree to maintain rodents or omitting murids maintains the ingroup tree and sees the outgroup join to Xenarthra, Afrotheria, or these two groups together. This emphasises the importance of carrying out both an unrooted and a rooted analysis. It is known from cancer research that murid rodents have reduced activity in some DNA repair mechanisms and this alters their substitution pattern - this may be the case for mtdna as well. Comparing nucleotide compositions may identify taxa that differ in aspects of their DNA repair mechanisms. pika & vole 13/12/10, page 89
87 Chapter 3 Results 90 Introduction The superordinal tree of placental mammals is rapidly being resolved (Madsen et al., 2001; Murphy et al., 2001; Waddell et al., 1999a) but several important questions remain. These include the question of the monophyly of rodents, the position of rodents within Placentalia, and whether rodents plus lagomorphs (rabbits plus pikas) form a monophyletic group (Glires). All have been controversial. For example, Graur et al. (1991), D Erchia et al. (1996) and Reyes et al. (1998), did not get rodent monophyly using mitochondrial data, and tended to assume that the guinea pig was not a rodent. In contrast, several authors (Cao et al., 1997; Sullivan and Swofford, 1997; Penny et al., 1999; Phillipe, 1997; Waddell et al., 1999b) do report rodent monophyly using mitochondrial genomes. These differences appear to result from taxon sampling and the method of analysis used, for example, NJ on amino acid sequences favours rodent monophyly. It would be very desirable to see more consistency between methods on larger datasets, which should come with increased density of taxon sampling. However, even when rodent monophyly has been obtained (see Cao et al., 1997; Sullivan and Swofford, 1997; Penny et al., 1999; Waddell et al., 1999b), the position of the lagomorph (rabbit) with respect to rodents has been variable. Although historically the position of lagomorphs within placentals has been uncertain (see Wood, 1957; van Valen 1964), in recent morphological analyses (Novacek and Wyss, 1986; Shoshani, and McKenna, 1998; Liu and Miyamoto, 1999) strong support has been found for Glires (a strictly monophyletic group of rodents plus lagomorphs). Although nuclear data has recently been grouping rodents and lagomorphs (Stanhope et al., 1996; Madsen et al., 2001; Murphy et al., 2001), the only evidence of Glires with mtdna proteins remains ambivalent (Waddell, et al., 1999b). It is particularly desirable to include a lagomorph from the family Ochotonidae (pikas, mouse hares and conies) to go with the rabbit (Leporidae, rabbits and hares) because this is a fairly deep divergence. In addition to the above more classical groups, further superordinal groupings pertinent to the position of rabbits plus lagomorphs have recently emerged. Tree shrew has come with rabbit (e.g. Schmitz et al., 2000), rather than with Euarchonta (tree shrews, flying lemurs and primates) which has recently appeared as sister taxon to Glires (Madsen et al., 2001; Murphy et al., 2001; Waddell et al., 1999a). Another probable deep partition in the placental tree, Xenarthrans and Afrotheria versus all other placentals, is consistent with nuclear data (Madsen et al., 2001; Murphy et al., 2001; pika & vole 13/12/10, page 90
88 Chapter 3 Results 91 Waddell et al., 1999a) but is contradicted by recent analyses of mtdna proteins (e.g. Reyes et al. 2000). The rooting of the mtdna tree has been questioned by Waddell et al. (1999b) based on evidence of different trees from the trna genes and the non-stationarity of amino acid frequencies in taxa near the root. While there is no evidence of a significant difference between the rooted trna and mtdna protein trees, there is a strong incompatibility between the combined mtdna tree and a tree based on independent data (Waddell et al. 2000). Our findings suggest that for the unrooted placental tree, the mtdna protein evidence is consistent with a tree very similar to that of Madsen et al. (2001), Murphy et al. (2001) and Waddell et al. (1999a). In contrast, the rooted trees of mtdna proteins are generally, for the earliest diverging placental orders, quite unlike the rooted trees of the three previous references. Thus far, most work on mitochondrial genomes has focused on phylogeny, but as the tree becomes more stable, a wide range of other applications is possible (e.g., Pollock et al., 2000). Recent statistical tests have emphasised the distinct amino acid composition of hedgehog, primates, murid rodents, and whales amongst placental mtdna (Waddell et al., 1999a, Table 1). Thus, apart from representing very long branches (edges), it was possible that rat and mouse are evolving anomalously, while guinea pig is a more typical rodent. It is well-categorized in DNA repair studies (Holmquist and Filinski 1994; Karlin and Mrázek 1997) that some murid rodents have a reduced effectiveness in their nuclear DNA repair. This leads to a different mutational process and, as predicted by the neutral theory of molecular evolution (Kimura, 1983) differences in sequence evolution. Addition of a more divergent murid rodent (vole Microtus kikuchii) is desirable to both break up this edge and hopefully help by showing a less divergent amino acid composition. The simple mechanism for a change in amino acid composition is a change in the relative mutation rate between some pairs of nucleotides. An example would be relative increase, for example, in C T interchanges. Karlin and Mrázek (1997) have detected a change in dinucleotide frequencies for murid rodents, relative to other placental mammals. Thus there is certainly prior evidence of a change in the nucleotide composition in nuclear genes relative to other mammals (Cortopassi and Wang, 1996; Holmquist and Filinski, 1994; Klaude et al., pika & vole 13/12/10, page 91
89 Chapter 3 Results ; Op het Veld, et al., 1997; Vogel and Natarajan, 1995). It will be interesting to see if mtdna follows the same pattern, or suggests a distinct repair mechanism. Materials and methods DNA was extracted from liver or muscle of the collared pika Ochotona collaris and the Taiwan vole Microtus kikuchii using High Pure PCR Template Purification Preparation Kit (Roche). In order to avoid amplifying nuclear copies long range PCR was applied using the Expand Long template PCR kit (Roche). The mtdna primers and their sequences for two ~ 9 kb fragments were: Long 16S-For (AATTAGGGTTTACGACCTCGATGTTGGATCAGG) to H11685-Rev (CCTAAGACCA ATGGATTACT TCTATCCT) and L11012-For (AGCTCTATCTGCTTTCGTCAAACAG) to Long16S-Rev (TGATTATGCTACCTTTGCACGGTCAGGATACC). Long PCR DNA fragments were sequenced directly and also used as template for short range PCR of 0.5 ~ 2Kb. Sequencing reactions were done according to manufacturer s protocols and run on a 377 ABI Applied Biosystems automated DNA sequencer. The genome was sequenced in both directions. Because of the problem of different lengths in C or G homopolymers, and different copy numbers of tandem repeats in the control region, we could not always get clear sequences directly from PCR products. Where necessary, PCR products were amplified and cloned into the vector pgem-t (Promega). Sequencing was performed on a single clone; heteroplasmy was not assessed. Complete mammalian mt-dna sequences were obtained from Genbank for the following 30 taxa. Rodentia: mouse Mus musculus [NC_001569]; rat Rattus norvegicus [NC_001665]; guinea pig Cavia porcellus [NC_000884]; dormouse Myoxus glis [NC001892]; squirrel Sciurus vulgaris [NC_002369]; cane rat Thryonomys swinderianus [NC_002658]. Lagomorpha: rabbit Oryctolagus cuniculus [NC_001913]. Primates: human Homo sapiens [NC_001807]; gibbon Hylobates lar [NC_002082]; baboon Papio hamadryads [NC_001992]; Macaca Macaca sylvanus [NC002764]; Cebus Cebus albifrons [NC_002763]; Loris Nycticebus coucang [NC_002765]. Scandentia: tree shrew Tupaia belangeri [NC_ ]. Tubulindentata: aardvark Orycteropus afer [NC_002078]. Proboscidia: elephant Loxodonta africana [NC_000934]. Afrosoricida: tenrec Echinops telfairi [NC_002631]. Xenarthra: armadillo Dasypus novemcinctus [NC_001821]. Chiroptera: fruit bat Artibeus jamaicensis [NC_002009]; flying fox Pteropus scapulatus [NC_002619]. Eulipotyphla: mole Talpa europaea [NC_002391]. Carnivora: dog Canis familiaris [NC_002008]; cat Felis catus [NC_001700]; harbor seal Phoca vitulina [NC_001325]. Perissodactyla: horse Equus caballus pika & vole 13/12/10, page 92
90 Chapter 3 Results 93 [NC_001640]; white rhinoceros Ceratotherium simum [NC_001808]. Cetartiodactyla: hippopotamus Hippopotamus amphibius [NC_000889]; cow Bos taurus [NC_001567]; fin whale Balaenoptera physalus [NC_001321]; pig Sus scrofa [NC_000845]. Selection of taxa amongst the growing set of all mammal mtdna s is a concern since it can seem arbitrary and unrepresentative. Our criteria were to include sequences of all deep-splitting lineages within the groups of immediate interest, here Afrotheria, Xenarthra, rodents, lagomorphs and primates. For orders within Laurasiatheria, lineages were selected to give the deepest splits as long as intra-ordinal placement was unambiguous based on mtdna data. Accordingly, uncertainty regarding the position of llama and the New Zealand long-tailed bat saw them excluded. (For taxa included in each of the above mentioned superorders, see Waddell et al., 1999a.) The hedgehog was omitted since prior analyses suggest it is seriously misplaced (see Sullivan and Swofford, 1997; Waddell et al., 1999b) perhaps due to a high rate of nucleotide substitution that is also non-stationary and affecting amino acid composition. A reanalysis of its position will be presented shortly, along with other new laurasiatherian sequences including gymnure (Lin, McLenachan, Gore, Phillips and Penny, in preparation). For the outgroup, mitochondrial genomes from four marsupials, plus a platypus [NC_00089], were used. The marsupials included the previously published sequences for opossum Didelphus virginiana [NC_001610] and wallaroo Macropus robustus [NC_001794], together with a bandicoot [NC_002746] and a brush-tailed possum [NC_003039] from our laboratory (see Phillips et al., 2001). SeAl version 1.0 a1 ( was used for aligning RNA and protein-coding datasets. RNA sequences were aligned using secondary structure ( Alignments were made independently by Y-HL and PJW, and then edited to remove regions of ambiguity. The five outgroups were similar enough that their inclusion did not require removal of further sites. The first dataset comprised RNA sequences (rrnas+trnas) and the second the 12 protein genes coded on the same DNA strand (both as 1 st and 2 nd position nucleotides plus translated to amino acids). The RNA and protein data sets were also combined as nucleotides. The RNA and protein data sets allow independent estimates of the gene phylogeny in that they share no nucleotides in common. Data sets are available from (http//imbs.massey.ac.nz/mugs.htm). pika & vole 13/12/10, page 93
91 Chapter 3 Results 94 PAUP* 4d65 (Swofford 1998) was used for all analyses, except for Maximum Likelihood analysis of amino acids sequences which used ProtML in the MOLPHY package (Adachi and Hasegawa, 1996), and protein LogDet which used the programs of Penny et al. (1999) and Waddell et al. (1999b). Trees were compared quantitatively using the partition metric (e.g. Steel and Penny 1993). ProtML trees searches were seeded with multiple near optimal trees from different methods, to avoid local optima due to limited edge interchanges. The inequality test of Lockhart et al. (1998) was used to test for evidence of covarion evolution as opposed to i.i.d. models with unequal substitution rates across sites. This tests whether sites are always in the same rate class (rates across sites models), or whether sites can vary in their rate of evolution as the secondary and tertiary structure of the macromolecule evolves (Penny et al., 2001). A triple Markov analysis (analyzing three sequences simultaneously, rather than pairs of sequences) was undertaken by the procedure of Lake (1997) This gives direct estimates of the transition matrices for each of three lineages. Results The pika and vole sequences are reported under GenBank numbers AF and AF respectively. The sequences have the standard gene order for mammals, and are 16,968 and 16,312 nucleotides long, respectively. There were no notable features in their gene organisation, total length, start and stop codons, etc. A problem with the phylogenetic analysis of sequence data is that there are now well over a hundred variants of methods differing in optimality criterion, search strategy, and the assumed mechanism of evolution. Not unexpectedly, there are some differences in results between the methods of analysis. This makes it difficult to quantitatively compare trees from independent data sets because the trees will vary slightly, depending on the analysis. Before starting our analysis we had, from previous experience, decided to compare the ProtML tree for the amino acid data set (using MOLPHY), with the ML tree on nucleotides (using PAUP*). In addition, we wanted to know if the four main groups of placentals (Xenarthrans, Afrotheria, Supraprimates, and Laurasiatheria) appearing in Waddell et al. (1999b) and subsequent work, would appear on this mitochondrial data set, especially with the pairing of (Xenarthrans, Afrotheria) (Supraprimates, Laurasiatheria), see Figure 1. (Note, the term Supraprimates means above or beyond Primates and is used also in Waddell et al. (in preparation), where all included taxa are analysed. It includes all the taxa in Euarchonta and Glires). pika & vole 13/12/10, page 94
92 Chapter 3 Results 95 Beginning with the unrooted tree of ingroup taxa (which is expected to be more stable), Figure 2 shows the protein ML tree for the 32 placentals, using the 12 proteins coded on the same DNA strand. Similar trees were inferred for the three nucleotide datasets (1+2; RNA; combined 1+2+RNA, trees not shown). In general the trees are highly similar, apart from the position of the tree shrew (Tupaia) which is locally unstable; results for the tree shrew are shown in Table 1. It can occur just outside the primates as a member of the Euarchonta which is its expected position but it was more frequently found basal to the lagomorphs (pika and rabbit), and sometimes basal to the Supraprimates (but still within that grouping) in these analyses. In only one analysis is it found outside the Supraprimates, joining with the armadillo (see Table 1). However, this maybe a long edge artifact. The addition of a partially-complete mitochondrial genome for a sloth sees the tree shrew stay within the Supraprimates and is consistent with this expectation (unpublished data). Acknowledging that the position of the tree shrew does vary within the Supraprimates, the rest of the tree is virtually the same for both the protein and RNA data which we consider now. There are two one-step rearrangements of note mole joins with the bats within the laurasiatherians, while within the afrotherians aardvark and tennrec group together. Thus there is this excellent agreement between the trees from the RNA and the protein coding genes. It is interesting to consider such congruence objectively. For 31 taxa (excluding tree shrew), the probability of randomly selecting two trees with only two differences on the partition tree comparison metric is 0.5 x10-36 with all trees equally likely (Steel and Penny, 1993). Similarly, Figure 2 is virtually the same as the tree on the combined DNA data set (RNA coding plus 1 st and 2 nd position of protein coding genes). The only difference between trees from the combined and RNA datasets is the one-step rearrangement within Afrotheria. However, in this case (comparing trees from the amino acid (or RNA) and combined data sets) the datasets are not independent. The important conclusion is that two data sets with no sites in common (the protein and RNA datasets) give extremely similar trees, meaning that the mammalian trees are converging as additional taxa are added. Restricting the comparisons just to orders, the tree in Figure 2 is also highly congruent with the super-ordinal classification of mammals in Waddell et al. (1999a), which is generally supported by recent analyses (Madsen et al., 2001; Murphy et al., 2001). There are 13 orders in the Figure 2 (not including the subgroups of Cetartiodactyla which might be considered orders). So for a 13 taxon pika & vole 13/12/10, page 95
93 Chapter 3 Results 96 unrooted binary tree, and assuming all trees to be equally likely, the probability of 8 out of 10 partitions being identical by chance is still less than 1 in 10 8 (Steel and Penny, 1993). Thus, in addition to the afore mentioned analyses, the mtdna data is strongly congruent with the new classification. Finally, here is another way to consider the remarkable congruence we are seeing. Figure 1 shows the relationships and composition of the 4 main groups of placentals postulated in Waddell et. al. (1999a), Madsen et al. (2001), and Murphy et al. (2001), together with the number of representatives of each group used in this study one xenarthran (armadillo), 3 afrotherians, 12 laurasians, and 16 supraprimates giving 32 species. We find this same arrangement now based only on mitochondrial data. The probability of randomly selecting a tree with the same taxa in the same configuration is approximately The calculation is based on the following. Let b(n) = (2n-5)!! be the number of unrooted binary trees on n taxa, where the double factorial notation is multiplying by every second number (in this case it equals n-5). The number of rooted trees for n taxa is b(n+1). The taxa in each of the four subsets can be arranged in b(n+1) rooted trees, and still be consistent with the tree in Figure 1. Thus the number of 32 taxon trees which have this structure is b(2)*b(4)*b(13)*b(17)/3. Hence the probability of obtaining this basic tree on a an independent data set is this number (b(2)*b(4)*b(13)*b(17)*3) divided by the number of unrooted trees on n taxa, b(32). A little care is required in interpreting this value. It is not in any sense the probability that the tree is correct (there could be another tree almost as good on the same data sets). Rather, it is more comparable to the g-statistic of Huelsenbeck (1991) that there is a strong signal in the datasets. However it is a more direct measure, and for a specific signal deep in the placental tree. Given that both the protein and the RNA datasets give this four-way division, and that this is in agreement with the prior hypothesis, we are convinced there is clear signal here. Before focussing on the position of the new sequences in the tree, consider further the overall structure and stability. The laurasian taxa (represented here by bats, carnivores, artiodactyls, perissodactyls, whales and Eulipotyphlans or core insectivores) is always monophyletic in our analyses. There is some local variation in positions within the Laurasiatheria. For example whether bats and Eulipotyphla form a group, or whether the latter are deeper (the Scrotifera hypothesis of Waddell et al., 1999a) is not certain. However, the latter resolution is being seen more frequently with greater taxon sampling (e.g., Cao et al., 2000; Lin and Penny, 2001; Lin et al. in preparation, Waddell et al. in preparation). The afrotherians, represented here by elephant, tenrec and aardvark are pika & vole 13/12/10, page 96
94 Chapter 3 Results 97 united in this tree, although the bootstrap support is low. A hyrax or a dugong genome may help stabilise the tree in this region. Again, the single Xenarthran (armadillo) groups with the Afrotheria, agreeing with the trees in Waddell et al. (1999a), Madsen et al. (2001), and Murphy et al. (2001). This leaves relationships within the group of (primates/ rodents/lagomorphs/tree shrew) from Waddell et al. (1999a) to be considered further we use the name Supraprimates for this group. Focusing on the new sequences in the unrooted tree, there is no ambiguity in support for Lagomorpha since pika and rabbit always come together. The three murids (vole/rat/mouse) also always come together with 100% bootstrap support. The vole joins about one third of the way up on the rat/mouse lineage (which had been the longest internal branch in the tree). The two hystricomorph rodents (cane rat and guinea pig) are united, in agreement with Mouchaty et al. (2001). Similarly the squirrel and the dormouse are united, though this result is not predicted on current classifications squirrel is in the Sciuromorpha and dormouse is usually assigned to a basal position among myomorph rodents. However, Kramerov et al. (1999) report a squirrel and dormouse grouping based on their sharing copy number of a retrotransposon. Similarly Huchon, et al. (2000) report a relatively close association between dormouse and squirrel and, with a quite different class of data (profiles of DNA on caesium chloride gradients), the dormouse (Gliridae) does not fit within the myomorph rodents (Douady et al., 2000). Given the present results, together with the three previous results, it appears that the squirrel/dormouse association is feasible. The Sciuromorphs generally were not closer to the murids than the hystricognaths, though this will depend on where the rodent subtree is rooted. Given that aspects of the mutational mechanism appear to have changed in murid rodents (see later) then any final conclusions on this point may have to await improved taxon sampling or models. The next step of the analysis is to root the placental tree using 4 marsupials and platypus (monotreme) as the outgroup (Figure 4). It is at this point that it could be said, all hell breaks loose, the position of the root differs markedly to those obtained with either morphological or nuclear data and is consistent with the rooting problem in this data suspected previously (Waddell et al. 1999a). With the outgroup added, most of the mitochondrial datasets and most methods (Table 1) move murids deepest in the placentals - to the base of the tree (the main exception is using just the first two codon positions of the protein coding genes). Thus most trees are rooted on the murid rodents, making rodents paraphyletic. However, the same 4-way division of placentals (Afrotheria, Laurasiatheria, etc.) is still maintained as in Waddell et al. (1999a), and there are no major rearrangements on the ingroup tree. The same rooting is found with the LogDet correction on amino pika & vole 13/12/10, page 97
95 Chapter 3 Results 98 acids (Penny et al., 1999, Waddell et al. 1999a) and remains even as all constant sites are removed. However, if the murid rodents are omitted, then the rooting comes to the base of the afrotherian group not to the remaining rodents. This shift away from the rodents contradicts their being basal and implies it is a particular feature of the murid rodents that is interacting with the outgroup, not a general similarity of their sequences. The same result was also found using the ML for DNA sequences with a gamma correction. However, forcing the gamma shape to be more extreme did see the outgroups joining on the internal edge separating the afrotherians plus Xenarthra (though some changes to the ingroup then started to appear). This is the group Atlantogenata, and conforms to the rooting suggested in Waddell et al Examining the substitution characteristics of murids Asking why the murids are attracted to the root, perhaps the most likely explanation is some change in the evolutionary process in murid rodents, a change in process that is largely uncorrected for by the tree-building programs. The introduction has already noted that it is known from cancer research that some of the DNA-repair mechanisms are less efficient in murid rodents. A way of testing for this is by using a triple Markov method (Chang, 1996; Lake, 1997, see also Barry and Hartigan 1987) to analyse three sequences simultaneously using tensors (three-dimensional matrices). The 4x4x4 tensor has sufficient information to estimate the 4x4 Markov transition matrices for each of the lineages from the root to the three species. Results with mt genomes (excluding D-loops) for a vole, guinea pig and squirrel are given in Table 2. There is evidence that the murid has the most divergent substitution process, this is a productive area for further research. The results estimating the Markov transition matrices indicate that differences in the mutational process on murids is one viable explanation for the unexpected position of the root (consistent also with evidence of in C/T composition shift within the outgroup, Phillips et al., 2001) and a shift in amino acid composition within murids, Waddell et al. 1999a). A change on the murid lineage of the amino acid sites that are free to vary is another possibility (this is a change in the covarion structure of the proteins - Penny et al., 2001). However, the test of Lockhart et al. (1998) gives no evidence for a change in covarion structure (results not shown). Nevertheless, a change has been suggested for cytochromes in primates (Grossman et al., 2001). A further way of testing whether the murid rooting is real is to constrain the rodents to be strictly monophyletic, and see whether the root now moves just outside the rodents. This would be its pika & vole 13/12/10, page 98
96 Chapter 3 Results 99 expected position if the root really did belong there. The result of such an experiment (constraining rodents to be monophyletic) using ML for DNA sequences (in PAUP*) is shown in Figure 4. The root now moves to quite a different place on the tree, onto the single Xenarthran (armadillo) plus Afrotheria. This is four steps on the tree away from the base of the rodents, and is one of the expected positions for the root based on previous analyses (i.e., it too reconsturcts the group Atlantogenata from Waddell et al. 1999b). A major shift in the root is expected if there really is a problematic substitution process in the three murid rodents and not in the four other rodents in the sample. Given the prior information of a change in the nucleotide composition in nuclear genes (Cortopassi and Wang, 1996; Holmquist and Filinski, 1994; Klaude et al., 1995; Op het Veld, et al., 1997; Vogel and Natarajan, 1995) and in mitochondria (Karlin and Mrázek, 1997) it would seem that misrooting on murids should be watched for in all types of sequence data. Discussion As reported here, with the addition of vole and pika mitochondrial genomes, the mtdna tree seems to be making more sense. In unrooted form it is showing strong congruence with both prior hypotheses (Waddell et al. 1999b) and recently expanded data sets (Madsen et al. 2001, Murphy et al. 2001). Although not tested directly, the basic (unrooted) placental tree from mtdna is expected to be near locally stable to sampling errors (i.e. the tree is expected to differ form the historical tree by one or two non-adjacent local interchanges). Given also the preliminary result using tensors (Table 2) and the major change in the position of the root when rodent monophyly is constrained, our working hypothesis is that the apparent rooting in murid rodents is an artefact from the change in DNA repair processes in murid rodents. This is in agreement with previous work such as that of Sullivan and Swofford (1997) and Waddell et al. (1999), suggesting that even within mammals the base compositional shifts are greater than expected due to sampling error and therefore a sign of non-stationary evolution which may well be distorting the trees. In this regard it is useful to note that the tests of Penny et al. (1999) and Waddell et al. (1999) are more powerful at detecting deviations of base or amino acid composition that previous tests such as those in PAUP*, and detection of significant shifts is one of the few warning signs we have of when such factors are in play. pika & vole 13/12/10, page 99
97 Chapter 3 Results 100 Given the above, there is now strong evidence of rodent monophyly, and also (apart from the problem of the tree shrew) for rodents joining with lagomorphs forming Glires based on mtdna data alone. Adding the pika and vole data has probably helped stabilize the tree, but the larger part of this result is by simply concentrating on the unrooted tree. Similarly, the addition of three primate mitochondrial genomes (Arnason et al., 2001) has broken up what had been the longest internal branch of the placental tree, and this to has hopefully also increased the stability of the tree. (Before those sequences were available there was a tendency for lagomorphs and/or elephant to move across to the long internal edge on the early primates, Waddell et al. 1999a) Although the vole has reduced the length of the edge leading to murid rodents, it is still the largest internal edge in the tree placental tree, and a prime target for further taxon sampling (e.g. Spalax or mole rats). The problem with the tree shrew shifting about might be due to unusual base composition or poor taxon sampling within tree shrews, the early primates and rodents, a lack of flying lemur, and a fairly long edge to tree shrew. This may be a long edge problem; if not long edges attract (Felsenstein 1978, Hendy and Penny 1989), then at least long edges increase the variance of position (Waddell et al., 1994). There is good agreement between the RNA and protein coding datasets. There is convergence of nuclear and mitochondrial data towards four basic groups of placentals Afrotheria, Xenarthra, Laurasiatheria and Supraprimates. However, the position of the root of the placental tree is still uncertain, and with the present taxon sampling of the mitochondrial dataset there is still a tendency for the root to joining with murid rodents, resulting in rodent paraphyly. Long branch attraction is a real problem, even within placentals and even with amino acid sequences (Waddell et al. 1999a). Although improved models will help, the short-term solution is probably additional mitochondrial genomes. Action on proposals to accelerate the rate of sequencing of mitochondrial genomes (Pollock et al., 2000) may see this situation rapidly change. However, we should remember that frequently, deep within taxonomic groups, we do not have the luxury of increased taxon sampling. Accordingly, results such as those in the present paper are both encouraging and sobering in regard to some of the outstanding problems in deep uncovering deep phylogenetic splits. If ~90 million years of placental evolution can see major errors, how well are we doing with bacterial genomes that diverged billions of years ago and show tremendously long duration unbranched lineages? There is always a tendency to say that the rat/mouse/vole sequences are wrong. But of course the data is correct barring a few sequencing errors, it is our analytical methods that are primarily wrong - they make erroneous assumptions about the mechanisms of evolution. In truth, our current models pika & vole 13/12/10, page 100
98 Chapter 3 Results 101 and methods are incomplete. Current models are based on a stochastic mechanism and with expected numbers of changes between nucleotides. There are many signals in sequences in addition to a historical (phylogenetic) signal and we need to consider them all (Penny et al., 1993). Other signals might be a nuisance with respect to phylogeny but could, for example, be very interesting for understanding changing protein 3D structure and function through time. In the biological world there is no reason to expect all the evolutionary changes to be free of convergences and parallelisms and allow us to easily reconstruct history. Work in the past has concentrated on changes in the rate of evolution, for example Felsenstein (1978), Hendy and Penny (1988). However, a simple rate change would imply that all values in the upper or lower halves of a Markov transition matrix increased (or decreased) in proportion. In retrospect, it is difficult to find a mechanism that would change all values in a transition matrix equally. There are up to 70 enzymes involved in DNA replication and repair, and they fit into a range of different categories. These include photolyases (repair of pyrimidine dimers); DNA repair methyl transferases (repair methylation and similar damage), base excision repair (removal of abnormal or damaged nucleotides), and mismatch repair - see reviews by Memisoglu and Samson (1996) and Yu et al (1999). Each of the major systems consists of a large group of enzymes, and it is not surprising if the error rates on all nucleotide transitions are not affected equally. We now refer to a change of process when there is a marked change in the rate of some nucleotide interconversions over others. Over 100 years after most orders of mammals were correctly recognised, the superordinal tree of mammals (including marsupials) is rapidly being resolved. Once a stable tree is found then many additional questions can be studied times of divergence, biogeography, rates of speciation, likely transitions between niches (such as terrestrial insectivore to omnivore), and detection of selection pressures. The major result here is to show that the mtdna data, at least in unrooted form, is congruent with the classification of Waddell et al. (1999a) which is now also well supported by the recent work of Madsen et al. (2001), and Murphy et al. (2001). This suggests that the simple rooting of the mtdna tree on murid rodents (or hedgehog) is incorrect (Waddell et al., 1999b). If it is, then the emerging placental tree locates small-generalised insectivores among all the major lineages (except for Xenarthrans). Parsimony then leads to the conclusion that this was the ancestral form, not just at the root of the tree but at the root of major groups such as the Laurasiatheria, Afrotheria, Supraprimates and the Xenarthra. This agrees with fossil indications of the ancestral form of the mammals generally (placentals and marsupials). It thus appears that the more derived body forms did pika & vole 13/12/10, page 101
99 Chapter 3 Results 102 not occur until after each of these major groups emerged. Just how early that was is uncertain, and a major topic of investigation. Acknowledgements We thank Michael Sorensen for the pika sample, Cheng Hsi-Chi of Taiwan Endemic Species Research Institute (TESRI) for the vole, Barbara Holland and Rissa Ota for the triple Markov analysis, Matt Phillips, David Archibald, and Mike Sorenson for discussions on mammalian evolution, and the New Zealand Marsden Fund for financial support. pika & vole 13/12/10, page 102
100 Chapter 3 Results 103 References Adachi, J., Hasegawa, M., Comput. Sci. Monogr. 28. MOLPHY: version 2.3: Programs for molecular phylogenetics based on maximum likelihood. Inst. Stat. Math. Tokyo. Arnason U., Gullberg, A., Schweizer Burguete, A., Janke, A., Molecular estimates of primate divergences and new hypotheses for primate dispersal and the origin of modern humans. Hereditas 133, Cao, Y, Okada, N., Hasegawa, M., Phylogenetic position of guinea pig revisited. Mol. Biol. Evol. 14, Cao, Y, Fujiwara, M., Nikaido, M., Okada, N., Hasegawa, M., Interordinal relationships and timescale of eutherian evolution as inferred from mitochondrial data. Gene 259, Chang, J.T., Full reconstruction of Markov models on evolutionary trees: identifiability and consistency. Math. Biosci.134, Cooper, A., Penny, D., Mass survival of birds across the Cretaceous/Tertiary boundary. Science 275, Cortopassi, G.A., Wang, E., There is substantial agreement among interspecies estimates of DNA repair activity. Mech. Ageing Devel. 91, D Erchia, A. M., Gissi, C., Pesole, G., Saccone, C., Arnason, U., The guinea-pig is not a rodent. Nature 381, Douady, D., Carels, N., Clay, O., Catzeflis, F., Bernardi, G., Diversity and phylogenetic implications of CsCl profiles from rodent DNAs. Mol. Phyl. Evol. 17, Felsenstein, J., Cases in which parsimony or compatibility methods will be positively misleading, Syst. Zool. 27, Graur, D., Hide, W. A., Li, W.-H., Is the guinea-pig a rodent? Nature 351, Grossman, L.I., Schmidt, T.R., Wildman, D.E., Goodman, M., Molecular Evolution of aerobic energy metabolism in primates. Mol. Phylog. Evol. 18, Hendy, M,D., Penny, D., A framework for the quantitative study of evolutionary trees. Syst. Zool. 38, Holmquist, G.P., Filinski, J., Organization of mutants along the genome: a prime determinant of genome evolution. Trends Ecol. Evol. 9, Huchon, D., Catzeflis, F.M., Douzery,E.J.P., Variance of molecular datings, evolution of rodents and the phylogenetic affinities between Ctenodactylidae and Hystricognathi. Proc. R. Soc. Lond. Ser. B 267, pika & vole 13/12/10, page 103
101 Chapter 3 Results 104 Huelsenbeck, J.P., Tree-length distribution skewness: an indicator of phylogenetic information. Syst. Zool. 40, Karlin, S., Mrázek, J., Compositional differences within and between eukaryotic genomes. Proc. Natl. Acad. Sci. USA 94, Kimura, M., The Neutral Theory of Molecular Evolution, Cambridge Univ. Press Klaude, M., Gedik, C.M., Collins, A.R., DNA damage and repair after low doses of UV-C radiation. Int. J. Radiat. Biol. 67, Kramerov, D., Vassetzky, N., Serdobova, I., The evolutionary position of dormice (Gliridae) in Rodentia determined by a novel short retroposon. Mol. Biol. Evol. 16, Lake, J., 1997 Phylogenetic inference: How much evolutionary history is knowable? Mol. Biol. Evol. 14, Lin, Y.-H., Penny, D., 2001 Implications for bat evolution from two new complete mitochondrial genomes. Mol. Biol. Evol. 18, Liu, F-G.R, M. Miyamoto, M., Phylogenetic assessment of molecular and morphological data for eutherian mammals. Syst. Biol. 48, Lockhart, P.J., Steel, M.A., Barbrook, A.C., Huson, D.H., Charleston, M.A., Howe, C.J., A covariotide model explains apparent phylogenetic structure of oxygenic photosynthetic lineages. Mol. Biol. Evol. 15, Lockhart, P. J., Larkum, A.W.D., Steel, M. A., Waddell, P. J., Penny, D., Evolution of chlorophyll and bacteriochlorophyll: the problem of invariant sites in sequence analysis. Proc. Natl. Acad. Sci. USA 93, Madsen, O., Scally, M., Douady, C.J., Kao, D.J., debry, R.W., Adkins, R., Amrine, H.M., Stanhope, M.J., de Jong, W.W., Springer, M.S., 2001 Molecules reveal parallel adaptive radiations in two major clades of placental mammals. Nature 409, Memisoglu, A., Samson, L., DNA repair functions in heterologous cells. Crit. Rev. Bioch. Mol. Biol. 31, Mouchaty, S.K., Catzeflis, F., Janke, A., Arnason, U., Molecular evidence of an African phiomorpha-south American caviomorpha clade and support for hystricognathi based on the complete mitochondrial genome of the cane rat (Thryonomys swinderianus). Mol. Phyl. Evol. 18, Murphy, W.J., Eizirik, E., Johnson, W.E., Zhang, Y.P., Ryder, O.A., O Brien, S. J., Molecular phylogenetics and the origins of placental mammals. Nature 409, pika & vole 13/12/10, page 104
102 Chapter 3 Results 105 Novacek, M.J., Wyss, A.R., 1986 Higher-level relationships of the recent eutherian orders morphological evidence. Cladistics 2, Op het Veld, C.W., van Hees-Stuivenberg, S., van Zeeland A.A., Jansen, J.G., 1997 Effect of nucleotides excision repair on hprt gene mutations in rodent cells exposed to DNA ethylating agents. Mutagenesis. 12, Penny, D., Hasegawa, M., Waddell, P.J., Hendy, M. D., Mammalian Evolution: Timing and implications from using the Logdeterminant transform for proteins of differing amino acid composition. Syst. Biol. 48, Penny, D., McComish, B.J., Charleston, M.A., Hendy, M.D., Mathematical elegance with biochemical realism: the covarion model of molecular evolution. J. Mol. Evol. (in press). Penny, D., Murray-McIntosh, R.P., Hendy, M.D., Estimating the times of divergence with a change in rate: the orangutan/african ape divergence. Mol. Biol. Evol. 15, Penny, D., Watson, E.E., Hickson, R.E., Lockhart, P.J., Some recent progress with methods for evolutionary trees. N.Z. J. Bot. 31, Phillipe, H., Rodent monophyly: pitfalls of molecular phylogenies. J. Mol. Evol. 45, Phillips, M. J., Lin, Y.-H., Harrison, G. L., Penny, D., Complete mitochondrial sequences for two marsupials, a bandicoot and a brushtail possum. Proc. Roy. Soc. London, Ser. B, 268, Pollock, D.D., Eisen, J.A., Doggett, N.A., Cummings, M.P., A case for evolutionary genomics and the comprehensive examination of sequence biodiversity. Mol. Biol. Evol. 17, Reyes, A., Pesole, G., Saccone, C., 1998 Complete mitochondrial DNA sequence of the fat dormouse, Glis glis: Further evidence of rodent paraphyly. Mol. Biol. Evol.. 15, Reyes, A., Gissi,C. Pesole, G., Catzeflis, F. M., Saccone, C., Where do rodents fit? Evidence from the complete mitochondrial genome of Sciurus vulgaris. Mol. Biol. Evol. 17, Schmitz, J., Ohme, M., Zischler H., The complete mitochondrial genome of Tupaia belangeri and the phylogenetic affiliation of Scandentia to other eutherian orders. Mol. Biol. Evol. 17, Shoshani, J., McKenna., M.C., Higher taxonomic relationships among extant mammals based on morphology, with selected comparisons of results from molecular data. Mol. Phylogen. Evol. 9, pika & vole 13/12/10, page 105
103 Chapter 3 Results 106 Stanhope, M.J., Smith, R.M., Waddell, G.V., Porter, A.C., Shivji, S.M., Goodman, M., Mammalian evolution and the interphotoreceptor retinoid binding protein (IRBP) gene: Convincing evidence for several superordinal clades. J. Mol. Evol. 43, Steel, M. A., Penny, D., Distributions of tree comparison metrics - some new results. Syst. Biol. 42, Sullivan, J., Swofford, D.L., Are guinea pigs rodents? The importance of adequate models in molecular phylogenetics. J. Mamm. Evol. 4, Swofford, D. L., PAUP*, Phylogenetic analysis using parsimony (*and other methods). Sinauer Associates, Sunderland MA. van Valen L.M.,1964. A possible origin for rabbits. Evolution 18, Vogel E.W., Natarajan, A.T., DNA repair damage and repair in somatic and germ cells in vivo. Mut. Res. 300, Waddell, P. J., Cao, Y., Hauf, J., Hasegawa, M., 1999a. Using novel phylogenetic methods to evaluate mammalian mtdna, including AA invariant sites-logdet plus site stripping, to detect internal conflicts in the data, with special reference to the position of hedgehog, armadillo, and elephant. Systematic Biology 48, Waddell, P. J., Okada, N., Hasegawa, M., 1999b. Toward resolving the interordinal relationships of placental mammals. Syst Biol 48,1-5. Waddell, P.J., H. Kishino, and R. Ota Rapid evaluation of the phylogenetic congruence of sequence data using likelihood ratio tests. Mol Biol Evol 17, Waddell, P.J., Penny, D., Hendy, M.D., Arnold, G., The sampling distributions and covariance matrix of phylogenetic spectra. Mol. Bio.Evol. 11, Wood A. E., What, if anything, is a rabbit? Evolution 11, Yu, Z., Chen, J., Ford, B.N., Brackley,M.E., Glickman, B.W., Human DNA repair systems: an overview. Environ. Molec. Mutag. 33, pika & vole 13/12/10, page 106
104 Chapter 3 Results 107 Table 1. Alternative trees for Figures 2 and RNA (1+2)+RNA AA ML MP NJ ML MP NJ ML MP NJ ML MP NJ Fig2 C C B A A A A A B Fig2 A A Fig For Figure 2 (the unrooted tree), alternative positions for tree shrew on different data sets and methods of analysis. (Figure 2 is the ML tree on amino acids.) A: Tree shrew joins to the rabbit/pika lineage, B: Tree shrew is basal on the Supraprimate lineage, C: Tree shrew joins Armadillo. For Figure 3 (the unconstrained rooted tree), the deepest branch for different data set and methods of analysis. 1. mouse/rat/vole 2. Tenrec 3. Afrotheria For both figures, 1+2: 1 st and 2 nd amino acids of 12 coding genes, AA: amino acids sequences, ML: Maximum Likelihood, MP: Maximum Parsimony, NJ: Neighbor joining (LogDet distances). pika & vole 13/12/10, page 107
105 Chapter 3 Results 108 Table 2. Estimated transition matrices from the root to three rodents Root to guinea pig Root to vole Root to squirrel A C G T A C G T A C G T A C G T Estimated composition of A, C, G and T at the root = , , , pika & vole 13/12/10, page 108
106 Chapter 3 Results Supraprimates 109 Xenarthra Afrotheria 12 Laurasiatheria Figure 1. Predicted relationship between four groupings of placentals based on nuclear data (Madsen et al., 2001; Murphy et al/ 2001; Waddell et al. 1999). In the present dataset there is 1 Xenarthran mt genome, 3 Afrotherians, 16 Supraprimates, and 12 Laurasiatherians. pika & vole 13/12/10, page 109
107 Chapter 3 Results 110 Figure 2. The unrooted tree for 32 placentals for the amino acid dataset, using ProtML, and with RELL bootstrap values shown. The four-way split predicted on nuclear data (Figure 1) is found on this tree. pika & vole 13/12/10, page 110

108 Chapter 3 Results 111 Figure 3. The tree of Figure 2 rooted with 4 marsupial and a monotreme sequences. There are no constraints on this tree and the root comes onto the murid rodent lineage. This has some similar properties to some of the marsupials (see Phillips et al., 2001). pika & vole 13/12/10, page 111
 then the root should now come directly outside the rodents (within Glires).")
109 Chapter 3 Results 112 Figure 4. The alternative tree to Figure 3 where the rodents are constrained to be strictly monophyletic. If the correct rooting was on the murid rodents (as in Figure 3) then the root should now come directly outside the rodents (within Glires). Instead the root moves to quite a different part of the tree (Xenarthrans), similar to the position rooting on nuclear or morphological data. This major shift in the position of the root is evidence against the root really being on the murid rodent lineage. pika & vole 13/12/10, page 112
110 Chapter 3 Results 113 Four new mitochondrial genomes, and the stability of evolutionary trees of mammals Yu-hsin Lin, Patricia A McLenachan, Alicia R Gore, Matthew J Phillips and David Penny Institute of Molecular BioSciences Massey University Palmerston North New Zealand Address for correspondence: Yu-Hsin Lin, Institute of Molecular BioSciences, Massey University, Palmerston North, New Zealand. y.lin@massey.ac.nz Keywords: bats, insectivores, mammal evolution, mitochondrial genomes, tree comparisons Laurasians, 13/12/10, page 113
111 Chapter 3 Results 114 Abstract We have sequenced four new mitochondrial genomes in order to improve the stability of the tree for placental mammals; they are two insectivores (a gymnure, Echinosorex gymnura and Formosan shrew Soriculus fumidus) a Formosan lesser horseshoe bat (Rhinolophus monoceros), and the New Zealand fur seal (Arctocephalus forsteri). All four are from within the Laurasiatheria grouping of eutherian mammals for which 26 taxa now have complete mitochondrial genomes available. A revision to the hedgehog sequence (Erinaceus europaeus) is also reported. In order to quantify the stability of trees from this data we begin by defining, based on nuclear sequences, a major 4-way split in Laurasiatherians. We compare this to that derived from the mitochondrial genomes (using protein coding and/or RNA (rrna and trna) datasets). The extremely high similarity of the mitochondrial and nuclear-derived trees allows a quantitative estimate of the stability of trees from independent datasets. Given this high stability, we consider specific issues such as whether megabats arise within microbats; the position of bats and core insectivores (lipotyphla) within eutheria; the position of hedgehog (and it relative gymnure) within eutheria. There is a strong tendency for these two taxa to join with the other core insectivores (mole and shrew) but there are still changes in the evolutionary process within placental mammals that are ignored by current tree programs. Based on our quantitative results, we expect the evolutionary tree for mammals to be resolved quickly. Laurasians, 13/12/10, page 114
112 Chapter 3 Results 115 Introduction The evolutionary tree of mammals is rapidly being resolved with important agreement between nuclear and mitochondrial datasets (for example see Madsen et al., 2001; Murphy et al. 2001; Mouchaty et al. 2000a; and Phillips et al. 2001). Restricting ourselves for the moment to eutherian (placental) mammals, recent work is tending to group them into four major groups, although until the root of the eutherian tree is unambiguous one group could be paraphyletic. The four groups are the: Xenarthrans (armadillos, sloths and anteaters); Afrotheria (including elephants, hyraxes, sea cows, tenrecs, aardvark, golden moles and elephant shrews); Supraprimates (primates, tree shrews, flying lemurs, rodents, and lagomorphs (see Lin et al. 2001)) and Laurasiatheria (Waddell et al. 1999) of the ungulates (including whales), carnivores (including pinnipeds), pangolins, perissodactyls, bats, and the core lipotyphlan insectivores (shrew, mole and hedgehog). Hedgehog is included in this group on nuclear data, but so far not on mitochondrial data. This Laurasian group, but without the bats and the mole and shrew (lipotyphlan insectivores), was first strongly supported by mitochondrial genomes (for example, Xu and Arnason 1996) and named Cetferungulates (cetaceans plus ferungulates). Pumo et al. (1998) reported that the bats, based on a complete mitochondrial genome, joined the mammalian tree just outside this group. Later the mole, also based on a complete mitochondrial genome, was shown to occur in a similar position (Mouchaty et al. 2000a). This combined group of Cetferungulates, bats and core insectivores is named Laurasiatheria (Waddell et al 1999). Our long-term goal is to get good estimates of the timing of divergence of the main eutherian lineages, particularly to estimate how many mammal lineages survived from the Cretaceous to the Tertiary (Cooper and Penny 1997; Hedges et al.1996; Penny et al. 1999; Eizirik et al., 2001). However, there are many potential sources of error in getting good estimates for early times of divergence (see Waddell and Penny, 1996). A reliable evolutionary tree will remove a significant source of error, and it is therefore especially important to measure the accuracy of evolutionary trees. The questions considered here are the position of hedgehog in relation to the mole and shrew, the relationships within the bats (whether megabats are derived from microbats) and then the relationship between the bats and core insectivores (Eulipotyphla). The position of hedgehog among eutherians has been problematic. Its mitochondrial genome was one of the earlier ones reported (Krettek et al. 1995) and in most analyses, the hedgehog appears as the first divergence within eutherians (for example, Krettek et al. 1995; Penny et al. 1999). In contrast, analysis of nuclear sequences placed the hedgehog in its more Laurasians, 13/12/10, page 115
113 Chapter 3 Results 116 traditional taxonomic position - within the core group of lipotyphlan insectivores, including shrew and mole (for example, Madsen et al 2001; Murphy et al. 2001). In particular, hedgehog was closer to shrew than to mole. It was recognized early that the hedgehog mitochondrial genome had an anomalous nucleotide composition, including being high in A+T content. However, even compensating for this with the LogDet (paralinear) transformation still had the hedgehog mitochondrial sequence as an outgroup to the remaining eutherian mammals. Given its unexpected positioning on mitochondrial genomes and its anomalous nucleotide composition, several authors have omitted the hedgehog from their analyses (for example, Reyes et al and Mouchaty et al. 2000b). In the present work we reconsider the problem of hedgehog and lipotyphlan insectivores by sequencing two additional mitochondrial genomes (a gymnure and a shrew), and by resequencing some problematic portions of the hedgehog mitochondrial genome. The gymnure (moon rat, or hairy hedgehog) is in the same family (Erinaceidae) as hedgehog, but in the other subfamily (Hylomyinae rather than Erinaceinae, McKenna and Bell 1997). If there is a long-branch attraction problem (see Hendy and Penny 1989) in relation to hedgehog, then a combination of mitochondrial genomes from a gymnure (in a related subfamily) and a shrew (in a related family) has a much improved chance of resolving the hedgehog position correctly. The reason for resequencing part of the hedgehog mitochondrial DNA was that we noted that the proteincoding alignment showed a number of regions where 5 to 12 consecutive amino acids had substitutions. From closer inspection of the DNA sequence at these positions we suspected that each of these anomalous sections were the result of either three single insertions, or an insertion with a later complementary deletion that re-established the reading frame. The reading frame was interrupted for nucleotides. M. Sorensen (pers. comm.) has also noted the same phenomenon. Such an interruption of reading frame obviously introduces errors into the dataset. However, these errors are expected to be random within each column of data. As evaluated by simulation studies (Charleston et al. 1994, pp ), random errors have little effect on the accuracy of recovering the correct tree, especially as compared to systematic errors. Nevertheless, it is highly desirable to eliminate all sources of errors, and so parts of the hedgehog were resequenced. In addition to the hedgehog/lipotyphlan insectivore question, there are uncertainties over the relationship both between the bats and the core insectivores, as well as between microbats and megabats. The question of the monophyly of bats seems well established (see Lin and Penny 2001) but it has recently been suggested (Hutcheon et al. 1998; Teeling et al. 2000) that megabats are derived from within microbats. In particular, megabats appeared closer to Rhinolophid (horseshoe) microbats. On this model megabats are strictly monophyletic and microbats paraphyletic. Mitochondrial genomes have not previously been available for Rhinolophid microbats (except 12S-16S rrna). The two microbat genomes already Laurasians, 13/12/10, page 116
114 Chapter 3 Results 117 available are the Jamaican fruit bat in the family Phyllostomidae (Pumo et al 1998); and New Zealand long-tailed bat in the family Vespertilionidae (Lin and Penny 2001). Finally, including taxa with good fossil records is important for good estimates of the timing of divergence of the main eutherian lineages. Fur seal will help as an important calibration point for timing when bear or panda mt-genome is available. With improved taxon sampling, and with the exception of the hedgehog that is being studied here, there is good agreement between trees from mitochondrial data sets and from nuclear data sets. However, in order to formalize this we require quantitative measures of the similarity of trees (Steel and Penny 1993). A standard criticism, for example Goldman et al. (2000) is that tests of significance for trees (such as the Kishino-Hasegawa test) are designed for evaluating predetermined hypotheses (trees). In contrast, virtually all phylogenetic studies do the opposite, they infer trees from the data as if no prior knowledge (hypotheses) was available, and then start testing the resulting hypotheses. Shimodaira et al. (2000) and Goldman et al. (2000) have discussed tests. Materials and Methods Samples of gymnure (Echinosorex gymnura) were provided by Adura Mohd Adnan, Malaysia. Cheng Hsi-Chi, Taiwan, supplied the Formosan shrew (Soriculus fumidus) and a Formosan lesser horseshoe bat (Rhinolophus monoceros). The New Zealand fur seal sample (Arctocephalus forsteri) was supplied by Padraig Duignan of the Massey Veterinary School, sample SS9771AF. The hedgehog was local, the population was originally introduced from England (Wodzicki 1950) and is the subspecies Erinaceus europaeus europaeus. DNA was extracted from muscle or liver using High Pure PCR Template Purification Preparation Kit (Roche). With all samples, mitochondrial DNA was amplified in fragments longer than 5 kb (in order to avoid amplifying nuclear copies) using the Expand Long template PCR kit (Roche). Long PCR DNA fragments were sequenced directly and also used as template for a second short range PCR 1~2kb. Sequencing reactions were done according to standard protocols and run on a 377 ABI Applied Biosystems DNA sequencer. Because we are sequencing several complete mt-dna genomes, we designed primers from conserved regions of the mt-dna genomes of mammals and birds, allowing 0-5 degenerate sites to maximize their usefulness for other species. We used the Fasta search in the GCG program (Wisconsin Package, version 10.0) to search our primer database for appropriate targets for primer walking. When none were available, new primers were designed using Oligo 4.03 (National Biosciences, Inc.). Sequences were checked and assembled using Sequencing Analysis and Sequence Navigator programs (ABI). Laurasians, 13/12/10, page 117
115 Chapter 3 Results 118 Three sets of sequences were used for analysis, 26 Laurasiatherians, 42 eutherians, and 47 mammals. Each larger data set included all taxa from the smaller data sets. Complete mammalian mt-dna sequences were obtained from Genbank for the following Laurasiatheria taxa: Jamaican fruit bat Artibeus jamaicensis [NC_002009]; Ryuku flying fox Pteropus dasymallus [NC_002612]; mole Talpa europaea [NC_002391]; hedgehog Erinaceus europaeus [NC_002080]; dog Canis familiaris [NC_002008]; cat Felis catus [NC_001700]; harbor seal Phoca vitulina [NC_001325]; gray seal Halichoerus grypus [NC_001602]; horse Equus caballus [NC_001640]; donkey Equus asinus [NC_001788]; white rhinoceros Ceratotherium simum [NC_001808]; Indian rhinoceros Rhinoceros unicornis [NC_001779]; cow Bos taurus [NC_001567]; sheep Ovis aries [NC_001941]; fin whale Balaenoptera physalus [NC_001321]; blue whale Balaenoptera musculus [NC_001601]; sperm whale Physeter catodon [NC_002503]; hippopotamus Hippopotamus amphibius [NC_000889]; pig Sus scrofa [NC_000845] and alpaca Lama pacos [NC_2504]. In addition, two sequences were available within the laboratory for bats, an Australian flying fox Pteropus scapulatus [NC_002619] and the NZ long tailed bat Chalinolobus tuberculatus, [NC_002626] (Lin and Penny 2001). Thus the four new genomes reported here give a total of 26 mitochondrial genomes of Laurasiatherian species (assuming in the interim that hedgehog fits within this group). For this Laurasian set we derived an expected (unrooted) tree from the most recently published nuclear data (Madsen et al., 2001; Murphy et al. 2001; Eizirik et al. 2001). Where nuclear sequences were not available (such as for gymnure) we used the accepted classification based on morphological characters. We predicted this tree from nuclear data would be extremely similar to the optimal tree from the slowest evolving character states of the mitochondrial data. In order to help identify the root of the Laurasian grouping, an expanded data set was made with a wide range of 16 other eutherians. These were mouse Mus musculus [NC_001569]; red squirrel Sciurus vulgaris [NC_002369]; guinea pig Cavia porcellus [NC_000884]; fat dormouse Myoxus glis [NC_001892]; cane rat Thryonomys swinderianus [NC_002658]; rabbit Oryctolagus cuniculus [NC_001913]; human Homo sapiens [NC_001807]; baboon Papio hamadryas [NC_001992]; whitefronted capuchin Cebus albifrons [NC_002763]; slow loris Nycticebus coucang [NC_002765]; aardvark Orycteropus afer [NC_002078]; elephant Loxodonta africana [NC_000934] tenrec Echinops telfairi [NC_002631]; and armadillo Dasypus novemcinctus [NC_001821]. In addition, two sequences were available within the laboratory, a pika Ochotona collaris [AF348080] and a vole Microtus kikuchii [AF348082] (Lin et al. 2001), giving a total of 42 mitochondrial genomes of eutherian mammals (26 Laurasians, 16 others). Additional sequences, such as other apes, including chimpanzee, gorilla, and orangutan, were not used because they are all close to the human sequence and do not help resolve the deeper eutherian divergences. The four mitochondrial genomes available for marsupials including the previously published sequences for opossum Didelphus virginiana [NC_001610] and wallaroo Macropus robustus [NC_001794], Laurasians, 13/12/10, page 118
116 Chapter 3 Results 119 together with two from within the laboratory (Phillips et al. 2001) a bandicoot Isoodon macrourus [NC_002746] and a brush-tailed possum Trichosurus vulpecula [AF357238]. The platypus Ornithorhynchus anatinus [NC_00089] was also used. These 5 taxa were combined with the 42 sequences in the eutherian data set to give the mammalian data set. In order to increase our ability to compare results quantitatively, we prepared four subsets for each of the Laurasiatheria, eutherian and mammalian data sets. The first contained RNA sequences (rrnas and trnas), the second the 1 st and 2 nd nucleotides from 12 protein genes coded on the same DNA strand, the third was a combined RNA/protein data set, and the fourth the protein data as amino acids. Thus we could compare results for 12 sets of data, four subsets for each of three data sets (Laurasiatheria, eutherian and mammalian). Sequences were aligned manually in Se-Al version 1.0 a1 ( Al/Se-Al.html). The rrna sequences are aligned with reference to the secondary structure ( in order to maximize homologous positions. All data sets are available from (http//imbs.massey.ac.nz/mugs.htm). PAUP* 4d65 (Swofford 1998) was used for all data sets. MOLPHY (Adachi and Hasegawa 1996) was used for a Maximum Likelihood analysis of amino acids sequences. Protein LogDet used the ProtDet program of Penny et al. (1999) and was used on the amino acids analysis. It is available via http//imbs.massey.ac.nz/mugs.htm). A triple Markov analysis (analyzing three sequences simultaneously, rather than pairs of sequences) was undertaken by the procedure of Lake (1997). This gives estimates of the transition matrices for each of the three lineages (Table 2) and used the Bootstrappers gambit program available from The smaller Laurasian dataset was analyzed first in order to obtain the unrooted tree for Laurasiatherians. Then the eutherian data set was analyzed both to identify the root of the Laurasian tree, and check whether hedgehog (and gymnure) stayed within the Laurasian group. Finally, the full mammalian data set was studied to check the rooting of the eutherian tree, and to detect whether adding the outgroup (marsupials plus platypus) led to any rearrangements within the eutherians (such as those that can arise from the long edges attract phenomenon, Hendy and Penny 1989). Results Our new mitochondrial genomes are available from GenBank, numbers AF (gymnure), AF (shrew), AF (rhinolophid bat), and AFxxxxx (fur seal). The sequences have the standard gene order of mammals, are 17,088, 17,488, 16,851 and 17,yyy nucleotides long for the gymnure, shrew, horseshoe bat, and fur seal respectively. In the control region, gymnure has a tandem repeat: cacgta; shrew has cacgtata; and hedgehog catacg. The similarity of the tandem repeat doesn t mean homology, Laurasians, 13/12/10, page 119
117 Chapter 3 Results 120 for example, New Zealand long-tailed bat and the little red flying fox also have catacg. The gymnure does show a low cytosine/thymine ratio (see Phillips et al. 2001), similar to hedgehog. Apart from this, the genomes do not show any unusual features. The new hedgehog sequences have the following GenBank numbers, yyyy-zzzz. They are for the complete NADH2 gene and are partial sequences for COIII and NADH4 genes; they confirm that the original sequence had some small insertions and deletions. The relevant sections are shown in Table 1. Each is named by its gene and is numbered from the start of that protein, for example, ND Overall, 636 amino acids are unaffected by the resequencing, and 46 amino acids are in the region affected by correcting the six indels. Of these 46, only 6 amino acids are conserved between the two hedgehog sequences and 40 amino acids are altered. However, the proposed indels result in all 46 amino acids conserved between the old and new hedgehog sequences. With the exception of ND2-318 (see Table 1), there is also high amino acid conservation among mammals for 5 of the 6 regions (as indicated by comparison with a distant outgroup, the marsupial Didelphis virginiana, Table 1). The C/T ratio is 0.62 for gymnure, 0.64 for hedgehog, and an average of 0.79 for other mammals. Thus the gymnure sequence has many of the unusual properties of the hedgehog composition, though we see below that it has not evolved as fast as the hedgehog. Current methods for inferring evolutionary trees generally assume the same process across the tree, that is, the process is stationary. We have already used a triple Markov analysis to present evidence that the murid rodents have a different mutational process to other rodents, and to most other placental mammals (Lin et al. 2001). This compares three sequences at a time by using a tensor (equivalent to a three-dimensional matrix). This has sufficient information to recover the 4x4 rate matrices to each of the taxa from the root. Results are shown for the non D-loop section of the complete mt genomes of gymnure, mole and shrew. The important point in the present context is that it demonstrates that there has been a change in the mutational process on the Gymnure lineage. Consequently, there has been a change in process on the gymnure/hedgehog lineage, and this goes outside the assumption of most methods of analysis. Consequently, extra care is required in interpreting any unexpected results. Before considering the tree for just the Laurasiatheria we will give our predictions (based on the trees from nuclear data of Madsen et al and Murphy et al. 2001) for the four deepest splits in Laurasiatheria. These are: the core insectivores (Eulipotyphla); bats; whales plus ungulates; and carnivores plus perissodactyls. The bats and eulipotyphla are expected to be adjacent on the unrooted tree (see Fig. 1). In the laurasiatherian data there are 4, 5, 8 and 9 taxa respectively in these groups. The chance of selecting a random tree getting all 26 taxa correctly into these groups, and in the arrangement shown in Fig. 1 is In general, if there are four subsets with a, b, c & d taxa, and there are Laurasians, 13/12/10, page 120
118 Chapter 3 Results 121 f(x) unrooted trees for any subset, then the probability of randomly selecting a tree with the four prespecified subsets is: [f(a+1).f(b+1).f(c+1).f(d+1)/3]/f(n) where n = a+b+c+d (to be included as an appendix). Figure 2 shows the maximum likelihood tree for the Laurasiatherian data set, and it has the basic arrangement (Fig. 1) as found in nuclear datasets. Even if we reduce the dataset by considering only a single megabat, equid, rhinoceros, seal, whale, and one from sheep and cow, the probability of randomly selecting the tree with 4, 4, 5 and 5 members in each subtree is only The result should not be over-interpreted as implying the relationship is in some sense correct (there could be another tree almost as good). The importance is in demonstrating that there is strong, and congruent, information in nuclear and mitochondrial data resulting in high confidence that the mammalian tree is resolving. We will see later that there are difficulties with specific mitochondrial genomes that current methods are not able to handle correctly, but finding high basic congruence is excellent, and shows the power of molecular approaches to studying evolution. Of the four new mitochondrial genomes, the position of the fur seal is quite straightforward and is considered first. The seals (Pinnipedia) have three extant families: Odobenidae (walruses), Otariidae (fur seals) and Phocidae (including gray seal and harbor seal). In all our results, the position of fur seal with respect to the gray seal and harbor seal is stable (Figs 2-5) and thus supports this traditional taxonomy of the group. The relationship between these three families is unknown (Lento et al., 1995) and a complete walrus mt-genome is now required. It is also desirable to have other members of the dog group of Carnivora (bears, pandas and ferrets/otters are considered to be more the most closely relative to seals than dogs) and this will then give an additional calibration point on the eutherian tree (Berta et al. 1989). The next sequence to be considered is the horseshoe (Rhinolophid) microbat. In the studies of Teeling et al. (2000), using mitochondrial 12S & 16S rrna and other nuclear genes, these bats are the sister group of megabats - resulting in megabats being monophyletic and microbats being paraphyletic. Our results support this hypothesis, though trees from the RNA data (and maximum parsimony on combined data) still give weak microbat monophyly. Figure 2 is the maximum likelihood tree on the combined RNA and protein-coding regions for the Laurasiatherian dataset. Results for the 11 other data sets are summarized in Table 3. Although the maximum likelihood on the combined data, and on amino acid sequences, give megabats as derived from microbats, it is still desirable to have another Rhinolophid bat and a distant megabat that should strengthen the conclusion. In trees with the Laurasiatheria dataset, our results support Eulipotyphla (shrews, mole and hedgehogs) monophyly. But monophyly is dependent on the rooting of the Laurasiatheria group, especially in relation to the position of hedgehog. Similarly, when only a single sequence was available for both bats and the core insectivores (the mole), these tended to form sister groups (for example, Mouchaty et al., 2000a). Laurasians, 13/12/10, page 121
119 Chapter 3 Results 122 However, as additional sequences of bats became available there was a tendency for the core insectivores to diverge first, then the bats, and finally the Cetferungulates (for example, Lin and Penny 2001). Thus both questions depend on the root of the Laurasiatherian tree and as a first step the dataset with 42 eutherians is used. The maximum likelihood tree on the combined RNA and protein coding genes uses 16 other placentals to root the Laurasiatherian tree (Figure 3). There are no surprises among the outgroup taxa. Armadillo and the Afrotherians (elephant, aardvark and tenrec) are united, as are Supraprimates (primates, rodents and lagomorphs). However, a striking feature on this tree is that the hedgehog and gymnure still form the eulipotyphla (with mole and shrew). This is the first time that hedgehog has come with mole on mitochondrial genomes, and the same result is found with all four subsets of the eutherian dataset. Traditionally, the order Lipotyphla includes two suborders, Soricomorpha (including: mole in the family Talpidae and shrew in the family Soricidae) and Erinaceomorpha (including hedgehog and gymnure, both in the family Erinacedae) (Butler, 1988; MacPhee and Novacek, 1993). However recent publications, mainly from nuclear genes, placed moles as sister taxa to both shrew and hedgehog (Murphy et al., 2001; Eizirik et al., 2001). Our results were ambiguous in their relationship, Soricomorpha can be monophyletic or paraphyletic in different data sets and analysis methods (see Table 3). However, because the hedgehog and gymnure have such an anomalous nucleotide composition, any detailed result with them should be treated with caution until better methods of analysis, that incorporate the features of these seqeunces, are available. Using different data sets and different methods of analysis, Eulipotyphla is deepest in the Laurasian group followed by Chiroptera (Table 3) and with high bootstrap support (91% in amino acid ML). Thus the single long-branch of a mole and a bat in Mouchaty et al. (2000a) may have been a consequence of longbranch attraction. However, from recent studies of nuclear genes, the relative positions of Lipotyphla and Chiroptera can still vary slightly within Laurasiatheria (Madsen et al., 2001; Murphy et al. 2001; Eizirik et al. 2001). What we have found is that as additional bat and insectivore sequences are added, the eulipotyphla diverge first, rather than forming a sister group with bats. Given that a major feature of our results is that additional taxa are reducing the long-branch attraction problem (Hendy and Penny 1989), the conclusion that Eulipotyphla diverge first is our best estimate at present. However, it is desirable to combine all the data sets, mitochondrial and nuclear. The question of the root of the eutherian tree is still not adequately resolved (see Madsen et al. 2001, and Murphy et al. 2001). Adding the five marsupial plus platypus outgroup should help narrow down the position of the root. However, adding the outgroup to the ingroup tree is the most difficult part of a study to get correct simply because the outgroup (by definition) is furthest away, and any slight changes in the evolutionary process will be magnified relative to the ingroup. This effect is often exaggerated because usually only a single outgroup sequence is used (here we use five). Indeed we do find a major Laurasians, 13/12/10, page 122
120 Chapter 3 Results 123 rearrangement in the eutherian tree when the five outgroup taxa are added (Fig 4). The gymnure/hedgehog pair moves seven steps on the tree in Figure 3 to join the murid rodents, and simultaneously become the deepest branch in the eutherians. This relationship is suspicious because of the abnormal base frequency of gymnure/hedgehog and unusual sequence evolution of murid rodents (Lin et al. 2001). Incorporate marsupials as outgroup to placentals, Eulipotyphla became polyphyletic and hedgehog/gymnure become the first branches to the rest of placentals (Fig 4). This is in contrast to morphological and molecular (nuclear genes) studies (Butler, 1988; Murphy et al. 2001; Madsen et al. 2001; Eizirik et al. 2001). When we constrained the tree for Eulipotyphla monophyly, the tree inferred is consistent with tree from Laurasian group with the root sitting between Eulipotyphla and the rest of Laurasia (Fig 5). Using Kishino-Hasegawa test (KH-test) for ML trees, the data did not support (P in different models) the tree without constraint is better than the constrained one. In NJ using HKY85+I+Γ model with 48% of invariant sites removed (estimated via ML) and α value in 0.2~1.0, the tree inferred is similar to figure 5, and showed Eulipotyphla monophyly. Discussion. An important overall conclusion is based on comparisons of trees from different data sets, nuclear and mitochondrial (and for mitochondrial, RNA and protein coding). As the number of taxa in the data set increases there is better and better agreement between trees from these independent data sets. The conclusions about mammalian relationships are reinforced by the similarity of the trees from nuclear and mitochondrial data sets, and between RNA and protein coding regions of mitochondria. As such, recent progress has come from the experimental side by collecting additional data, not from the more theoretical side of improving models to use mechanisms that are more realistic and robust. There are two important and related qualifications to this conclusion; there are genuine changes in the mutational processes underlying molecular evolution, and there are inadequacies of the mechanisms assumed by models of evolution. There are at least two interesting examples within eutherians where there has been a change in mutational mechanism, namely among the murid rodents and within hedgehogs and its relatives (including gymnure). With the murid rodents there is abundant evidence, from studies of DNA repair in relation to cancer, that DNA repair in murids is not as efficient as in humans (see discussion in Lin et al. 2001). There has been considerable interest in changes in rates of evolution, and methods developed to estimate times of divergence (for example, Kishino et al. 2001). There has been less progress on testing that assumptions about the mutational process are indeed accurate. Laurasians, 13/12/10, page 123
121 Chapter 3 Results 124 We find it helpful to distinguish between a change in the rate of evolution (when all mutations increase or decrease by a similar proportion), and a change in process. In this latter scenario there may be acceleration (deceleration) in just some mutations between nucleotides thus leading to changes in nucleotide and dinucleotide frequencies (see for example, Karlin and Mrázek. 1997). There is a strong tendency to blame the data if a change in process leads to an incorrect tree. This assumes that the methods for inferring trees are correct, and that the data is wrong. We take the opposite view - the data is correct and the methods of analysis are inadequate. It is the responsibility of theoretical biologists to develop robust methods that accurately reflect the mutational processes in evolution. They must be able to first detect, and then adjust, for a change in process. The triple Markov analysis is a useful first step in detecting changes from analyzing the DNA sequences directly (prior to tree-building). The results should allow those interested in DNA repair systems to identify appropriate organisms for finding changes to DNA repair enzymes, thus helping understand better the processes of molecular evolution. In general, there are many signals in DNA sequences, from phylogeny (historical signal), multiple changes, changes in mutation processes, effects of including constant sites, change in functional constraints on the gene product, positive selection for function, and so forth (Penny et al. 1993). It is generally assumed that the signal from shared history (phylogeny) is the largest one, but there is certainly no evolutionary reason to assume this. Organisms don t evolve in order to allow their history to be recovered, there are other processes occurring that also need to be dissected out and analyzed. To return to the data. Updating the hedgehog sequence is useful, but by itself the new sequence does not lead to any changes in the tree. As mentioned earlier, this is as expected because the errors from single base deletions would lead to random, not systematic, errors. From similar experience of problems with aligning them it is likely that there still are significant errors in other mitochondrial genomes that were sequenced early. In our experience rat and Xenopus need some resequencing. The new Rana sequence [NC_002805] is consistent with there being a few significant errors in the very early Xenopus mt genome, especially in the RNA genes. It is not surprising that the earliest mitochondrial genomes had some errors simply because there were no close relatives for comparison. We still find that, during alignment, we detect an occasional sequencing error in our own results simply because there are now far more genomes available for comparison. It was far more difficult for the genomes sequenced earliest. Returning to the Laurasiatheria, the composition of the groups as a whole seems relatively stable. Two groups missing for mitochondrial data are the pangolin and the insectivore Solenodon. Pangolins are close to carnivores on nuclear data (Madsen et al. 2001; Murphy et al. 2001), and there is high general agreement between nuclear and mitochondrial DNA on the main features of the tree. Thus tt is expected that pangolin will be within the group when a mitochondrial genome is available. Another potential problem is Solenodon for which there is very little sequence data available. Given the history of splitting Laurasians, 13/12/10, page 124
122 Chapter 3 Results 125 the traditional Insectivora into many different groups, it is highly desirable to confirm whether Solenodon is within the core insectivores (Eulipotyphla). Although we are emphasizing the high agreement of the trees between data sets, there is certainly local uncertainty in the eutherian tree. We define an evolutionary tree to be locally stable when any changes are limited to rearrangements around single internal edges (branches) of the tree (Cooper and Penny 1997). The relationship between bats and core insectivores is such an example whether Eulipotyphla are the first divergence, or whether they form a sister group to bats. With more sequences becoming available the pig appears one step deeper ion the tree than alpaca, but even if this changes it is still a local rearrangement in our terminology. The relative positions of sperm whale, other toothed whales, and baleen whales is also a local rearrangement, so although the change is relatively small with Laurasiatheria, it does generate intense interest! To conclude, we would reiterate the point that obtaining more data for mammalian groups has given the major gain in understanding eutherian evolution. Our results, especially in regard to changes in the mutational process, do illustrate the need for a similar gain in understanding the models of evolution. But it has been improvements in the data set, rather than more elaborate computer programs, that has led to our gain in understanding. It is certainly expected that as we go deeper into the tree of life that improvements in models will be required, and have a good tree for eutherians should enable models to be refined further. Acknowledgments We thank Dr. Adura Mohd Adnan (Malaysia) and Abby Harrison for the gymnure sample; Cheng Hsi- Chi of Taiwan Endemic Species Research Institute for the shrew and rhinolophid bat tissue samples, and Padraig Duignan of the Massey University Veterinary School for the sample of the New Zealand fur seal. The New Zealand Marsden Fund supported this work. Laurasians, 13/12/10, page 125
123 Chapter 3 Results 126 Appendix. The numbers of evolutionary trees without specifying subtrees. There are b(n) = (2n-5)!! possible binary evolutionary trees on n taxa, where the double factorial notation is multiplying by every second number. Thus (2n-5)!! = (2n-5) x (2n-7) x (2n-9) 5 x 3 x 1; and 0!! = 1!! = 1. Suppose T is a phylogenetic tree on the set S of n taxa. If we remove the subtree T', of 2k-3 contiguous internal edges of T (together with their incident vertices), we create k subtrees T1, T2,..., Tk, rooted by their connector to T', and whose label sets partition S. We define P = {T1, T2,..., Tk} as a partition of T. We find that there are b(k)b(n 1 +1)b(n 2 +1)...b(n k +1) evolutionary trees on S which form the same partition P. This can be seen as follows. There are b(n j ) trees with the same label set as T j, and it has 2n j -3 edges, on which we can choose to add a root, hence there are b(n j +1) rooted trees with the same label set. Further the roots can be connected together by an internal subtree of k leaves in b(k) ways. Thus for example, if n = 26, k = 4, with n1 = 4, n2 = 5, n3 = 8 and n4 = 9, there are b(4)b(5)b(6)b(9)b(10) = 3x15x105x10395x = 6.6x However as there are b(26) = 1.2x10 30 trees on 26 taxa, the probability of getting this partition is 1.8x Laurasians, 13/12/10, page 126
124 Chapter 3 Results 127 References ADACHI, J., and M. HASEGAWA MOLPHY. Computer program published by the authors. Tokyo. ARNASON, U., A. GULLBERG, S. GRETARSDOTTIR, B. URSING, and A. JANKE The mitochondrial genome of the sperm whale and a new molecular reference for estimating eutherian divergence dates. J Mol Evol 50: ARNASON, U., A. GULLBERG, A. SCHWEIZER BURGUETE, and A. JANKE Molecular estimates of primate divergences and new hypotheses for primate dispersal and the origin of modern humans. Hereditas 133: BERTA, A., C. E. RAY, and A.R. WYSS Skeleton of the oldest known Pinniped, Enarliarctos mealsi. Science 244: BUTLER, P.M Phylogeny of the Insectivores. In: The phylogeny and classification of the Tetrapods, Vol 2. Mammals, ed. M.J. Benton, Oxford: Clarendon Press, CHARLESTON M Factors affecting the performance of phylogenetic methods. PhD thesis, Massey University, Palmerston North. COOPER, A., and D. PENNY Mass survival of birds across the Cretaceous/Tertiary boundary. Science 275: EIZIRIK, E., W.J. MURPHY, and S.J. O'BRIEN Molecular dating and biogeography of the early placental mammal radiation. J Hered. 92: GOLDMAN, N., J. P. ANDERSON, and A. G. ROGRIGO Likelihood based tests of topologies in phylogenies. Syst. Biol. 49: HENDY, M. D., and D. PENNY A framework for the quantitative study of evolutionary trees. Syst Zool 38: HEDGES, S. B., P. H. PARKER, C. G. SIBLEY, and S. KUMAR Continental breakup and the ordinal diversification of birds and mammals. Nature 381: HUTCHEON J. M., J. A. KIRSCH and J. D. PETTIGREW Base-compositional biases and the bat problem III. The questions of microchiropteran monophyly. Philos Trans R Soc Lond B 353: KARLIN, S., and J. MRÁZEK Compositional differences within and between eukaryotic genomes. Proc. Natl Acad. Sci. USA 94: KISHINO, H., J. THORNE, and W.J. BRUNO Performance of a divergence time estimation method under a probabilistic model of rate estimation. Mol. Biol. Evol. 18: KRETTEK A., A. GULLBERG, and U. ARNASON Sequence analysis of the complete mitochondrial DNA molecule of the hedgehog, Erinaceus europeaus, and the phylogenetic position of Eulipotyphla. J Mol. Evol. 41: Laurasians, 13/12/10, page 127
125 Chapter 3 Results 128 LAKE, J Phylogenetic inference: How much evolutionary history is knowable? Mol. Biol. Evol. 14: LENTO, G. M., R. E. HICKSON, G. K. CHAMBERS, and D. PENNY Use of spectral analysis to test hypotheses on the origin of pinnipeds. Mol. Biol. Evol. 12: LIN, Y-H, and D. PENNY Implications for bat evolution from two new complete mitochondrial genomes. Mol Biol Evol 18: LIN, Y-H, P.J. WADDELL and D. PENNY Pika and vole mitochondrial genomes support both rodent monophyly and glires. Gene (in preparation). MADSEN, O., M. SCALLY, C.J. DOUADY, D.J. KAO, R.W. DEBRY, R. ADKINS, H.M. AMRINE, M.J. STANHOPE, W.W. DE JONG, and M.S. SPRINGER Molecules reveal parallel adaptive radiations in two major clades of placental mammals. Nature 409: MACPHEE, R.D.E., and M.J. NOVACEK Definition and Relationships of Lipotyphla. In: Mammal phylogeny, ed. F.S. Szalay, M.J. Novacek, M.C. McKenna, New York: Springer-Verlag, MCKENNA, M. C., and S. K. BELL The classification of mammals: above the species level. (Columbia Univ. Press. New York). MOUCHATY, S. K., A. GULLBERG, A. JANKE, and U. ARNASON The phylogenetic position of the Talpidae within eutheria based on analysis of complete mitochondrial sequences. Mol Biol Evol 17: MOUCHATY, S. K., A. GULLBERG, A. JANKE, and U. ARNASON. 2000a. Phylogenetic position of the tenrecs (Mammalia: Tenrecidae) of Madagascar based on analysis of the complete mitochondrial genome sequence of Echinops telfairi. Zool. Scripta 29: MURPHY, W.J., E. EIZIRIK, W.E. JOHNSON, Y.P. ZHANG, O.A. RYDER, and S. J. O BRIEN Molecular phylogenetics and the origins of placental mammals. Nature 409: OTA, R., P. J. WADDELL, M. HASEGAWA, H. SHIMODAIRA, and H. KISHINO Appropriate likelihood ratio tests and marginal distributions for evolutionary tree models with constraints on parameters. Mol. Biol. Evol. 17: PENNY, D., L. R. FOULDS and M. D. HENDY Testing the theory of evolution by comparing phylogenetic trees constructed from five different protein sequences. Nature 297: PENNY, D., M. HASEGAWA, P. J. WADDELL and M. D. HENDY Mammalian Evolution: Timing and implications from using the LogDeterminant transform for proteins of differing amino acid composition. Syst Biol 48: PENNY, D., E. E WATSON, R. E. HICKSON, and P. J. LOCKHART Some recent progress with methods for evolutionary trees. N Z J Bot. 31: PHILLIPS, M. J., Y.-H. LIN, G. L. HARRISON and D. PENNY Mitochondrial genomes of a bandicoot and a brush-tail possum confirm the monophyly of australidelphian marsupials. Proc. Roy. Soc. Lond, Ser B 268: Laurasians, 13/12/10, page 128
126 Chapter 3 Results 129 PUMO, D. E., P. S. FINAMORE, W. R. FRANEK, C. J. PHILLIPS, S. TARZAMI, and D. BALZARANO Complete mitochondrial genome of a neotropical fruit bat, Artibeus jamaicensis, and a new hypothesis of the relationships of bats to other eutherian mammals. J Mol Evol 47: REYES, A. C. GISSI, G. PESOLE, F. M. CATZEFLIS, and C. SACCONE Where do rodents fit? Evidence from the complete mitochondrial genome of Sciurus vulgaris. Mol. Biol. Evol 17: SPRINGER M.J., R.W. DEBREY, C. DOUADY, H.M. AMRINE, O. MADSEN, W.W. DE JONG and M.J. STANHOPE Mitochondrial versus nuclear gene sequences in deep-level mammalian phylogeny reconstruction. Mol. Biol. Evol. 18: STEEL, M. A., and D. PENNY Distributions of tree comparison metrics - some new results. Syst. Biol. 42: SWOFFORD, D. L PAUP*, Phylogenetic analysis using parsimony (*and other methods). Sinauer Associates Sunderland, MA. TEELING, E. C., M. SCALLY, D. J. KAO, M. L. ROMAGNOLI, M. S. SPRINGER and M. J. STANHOPE Molecular evidence regarding the origin of echolocation and flight in bats. Nature 403: WADDELL, P. J., N. OKADA, and M. HASEGAWA Toward resolving the interordinal relationships of placental mammals. Syst Biol 48:1-5. WADDELL, P. J. and D. PENNY Evolutionary trees of apes and humans from DNA sequences. pp53-73 in "Handbook of Human Symbolic Evolution" (ed. A. Lock, and C. R. Peters) Clarendon Press, Oxford. WODZICKI, K. A Introduced mammals of New Zealand. Department of Scientific and Industrial Research, Wellington. XU, X., and U. ARNASON The complete mitochondrial DNA sequence of the great Indian rhinoceros, Rhinoceros unicornis, and the phylogenetic relationship among Carnivora, Perissodactyla and Artiodactyla (+Cetacea). Mol. Biol. Evol. 13: Laurasians, 13/12/10, page 129
127 Chapter 3 Results 130 Table 1. Differences between the old and new hedgehog sequences. ND2-108 translated old GACTCCTTTTCACCATATGACTCCCCT DSFSPYDS 8 2 new G-CTCCTTTTCAC-ATATGACTT-CCT APFHMWL- Didelphus APFHFWV- ND2-255 old new CCCACTAACTGGGTTTTTTACCTAA-TGAATAGTGG-C PTNWVFYLMNSG 11 4 C-CACTAACTGGATTT-TTACCTAAATGAATAGTGGCC PLTGFLPKWMVA Didelphus PLTGFMPKWLIL ND2-304 old TTTTCCATCAATAAACA-T FSINKH 5 1 new TT-CCCATCAATAAACAAT FPSMNN Didelphus FPSINN ND2-318 old AA-TCAAATA-ATATAC-CTA NQMMY-L new AAATCAAATAAATACCCCCTA KSNKYPL Didelphus note 1. COIII-118 old C-CGCAGGAATTAAACCACTTAACCCACTTGAAGG PQELNHLTHLK 8 2 new CCCGCAGGAATTAAACCTCTTAACCCACTTGAA-G PAGIKPLNPLE Didelphus PTGIHPLNPLE ND4-336 old GAA-GCACTCATAGCCGCACCT EALMAAP 6 1 new GAACGCACTCATAGCCGCA-CT ERTHSRT Didelphus ERIHSRT In column one, old refers to the sequence reported in NC_002080; new is from the present work. Column two has the name and location of the sequence within the gene, and then the old and the new sequence. Column three is the translated amino acid sequence; for comparison the Didelphus amino acid is shown to illustrate the improved amino acid conservation from the updated sequence. The 4 th column indicates the reduction in amino acid differences between the old and new hedgehog sequences as compared with Didelphus. Note 1, the ND2-318 region has low conservation with Didelphus and thus the amino acid sequence is not shown. Laurasians, 13/12/10, page 130
128 Chapter 3 Results 131 Table 2. Estimated transition matrices from the root to three insectivore Root to gymnure Root to shrew Root to mole A C G T A C G T A C G T A C G T Note, this is preliminary data only, waiting checking against two programs (the bootstrappers gambit, and one of our own using MatLab) Laurasians, 13/12/10, page 131
129 Chapter 3 Results 132 Table 3. Comparative results by data set and method of analysis. 1+2 RNA (1+2)+RNA amino acids ML MP NJ ML MP NJ ML MP NJ ML MP NJ Lau Ins-Mon* c c b a a b c a b a a b R+Mbat Eut Ins-Mon A a b b a A C A A A R+Mbat Mam Ins-Mon B B B C b C B B B B B B R+Mbat Data set: Lau = 26 Laurasians (Fig 1), Eut = 42 Eutherians (placentals) (Fig 2), Mam = 47 Mammals (Fig 3,4) Ins-Mon: Insectivora (Eulipotyphla) monophyly. R+Mbat Rhinolophorus bat and megabat are sister taxa ML: Maximum Likelihood, HKY85+I model. MP: Maximum Parsimony NJ: Neighbor joining, LogDet+Invariant sites model *Lipotyphla monophyly is dependent on the rooting of the tree. If the root is, for example, between hedgehog/gymnure and mole/shrew, then lipotyphla becomes paraphyletic. a: (((hedgehog, gymnure), shrew), mole) b: ((hedgehog, gymnure), (shrew, mole)) c: (((hedgehog, gymnure), mole),shrew)) A: hedgehog/gymnure join mouse/vole branch B: hedgehog/gymnure are the deepest branch (after marsupials) C: hedgehog/gymnure are only one step from shrew/mole. Laurasians, 13/12/10, page 132
130 Chapter 3 Results 133 Figure 1, Predicted relationship between four groupings of Laurasiatherians. In the present dataset there are 5 bat mt genomes, 4 eulipotyphla, 9 carnivores and perissodactyls, and 8 whales plus ungulates. bats whales + ungulates eulipotyphla 9 carnivores perissodactyls Laurasians, 13/12/10, page 133
131 Chapter 3 Results 134 Figure 2. The unrooted maximum likelihood tree for 26 Laurasiatherian taxa; combined RNA and 1+2 sites of protein coding genes and using HKY85 model with invariant sites estimated. The relationships predicted in Figure 1 are found in this tree. Shrew M ole Hedgehog Gymnure RBat FlyingFox RyFlyFox FruitBat LongT ailba Horse Donkey WhiteRhino IndianRhin Cat Dog FurSeal HarbSeal Gray Seal Pig A lpaca Cow Sheep Hippo SpermWhale FinWhale 0.1 BlueWhale Laurasians, 13/12/10, page 134
132 Chapter 3 Results 135 Figure 3 The unrooted maximum likelihood tree for 42 eutherians; combined RNA and 1+2 sites of protein coding genes. The 26 Laurasian mammals are rooted with the core lipotyphlan insectivores on one side, and bats plus cetferungulates on the other. The hedgehog and gymnure form the Eulipotyphla with mole and shrew. The horseshoe (Rhinolophid) microbat is a sister group to the megabats (flying foxes). This ingroup (Laurasiatherian) tree should be stable when the marsupial/platypus outgroup is added (see Figs 4 and 5). 0.1 Armadillo Elephant Aardvark Tenrec Mole Shrew Hedgehog Gymnure RBat FlyingFox RyFlyFox FruitBat LongTailBat Horse Donkey WhiteRhino IndianRhino Cat Dog FurSeal HarbSeal GraySeal Pig Alpaca Cow Sheep Hippo SpermWhale FinWhale BlueWhale Rabbit pika Squirrel Dormouse GuineaPig CaneRat Mouse Vole Loris Cebus Baboon Human Laurasians, 13/12/10, page 135
133 Chapter 3 Results 136 Figure 4. Overall mammalian tree with eutherians rooted by the four marsupials plus platypus. Hedgehog plus gymnure move considerably within eutherians, separating from mole and shrew to join to the mouse/vole group. Adding the outgroup (marsupials) thus causes major rearrangements within the ingroup tree. Hedgehog and gymnure shift 7 steps along the tree in Fig 3 to become adjacent to the vole/mouse. This rearrangement of the ingroup is characteristic of the classical long-branch attraction reported in Hendy and Penny (1989) where the outgroup in the 5-taxon equal-rate example lead to a rearrangement within the ingroup tree. The effect of constraining the hedgehog/gymnure is shown in Fig. 5. HarbSeal GraySeal FurSeal Dog Cat Horse Donkey WhiteRhino IndianRhino FinWhale BlueWhale SpermWhale Hippo Cow Sheep Alpaca Pig FlyingFox 0.1 Wallaroo Possum Bandicoot Opposum Platypus RyFlyFox RBat FruitBat LongTailBat Mole Shrew Aardvark Tenrec Elephant Armadillo Baboon Human Cebus Loris Rabbit pika Squirrel Dormouse GuineaPig CaneRat Mouse Vole Hedgehog Gymnure Laurasians, 13/12/10, page 136
134 Chapter 3 Results 137 Figure 5. The tree with hedgehog/gymnure/mole/shrew constrained to stay together. The eutherian root now separates the Xenarthran (armadillo) and the three Afrotherians from the Laurasiatherians and Supraprimates. HarbSeal GraySeal FurSeal Dog Cat Horse Donkey WhiteRhino IndianRhino FinWhale BlueWhale SpermWhale Hippo Cow Sheep Alpaca Pig FlyingFox 0.1 Wallaro Possum Bandicoot Opposum Platypus RyFlyFox RBat FruitBat LongTailBat Mole Shrew Hedgehog Gymnure GuineaPig CaneRat Mouse Vole Squirrel Dormouse Rabbit pika Baboon Human Cebus Loris Elephant Aardvar k Armadillo Tenrec Laurasians, 13/12/10, page 137
135 Chapter 4 Discussion 138 Chapter 4 Discussion 4.1 Is our strategy: long PCR short PCR sequencing successful? The long-range PCR technique is becoming more popular for the sequencing of whole mt-dnas because it needs only a small amount of total genomic DNA and thus avoids the tissue and effort traditionally required to purify mt-dna (Hwang et al., 2001). Generally, our strategy for sequencing complete mitochondrial genomes was successful, but due to the high heterogeneity in the control region however, PCR amplification followed by cloning and sequencing is a more practical strategy to avoid ambiguous base reading or messy sequences. Some studies reporting complete mt-dna sequences have emphasized the use of natural clones of mt-dna rather than PCR-amplified DNA (Xu et al., 1996; Xu and Arnason, 1997). This implies that, for sequencing, PCR fragments are somewhat inferior to natural clones. Sequence from PCR fragments was compared to sequence from cloned fragments and the sequences were found to be more than 99.6% identical (Sorenson et al., 1999). In every polymerase chain reaction, mistakes can be incorporated into the reaction but the frequency is very low. For the long-range PCR fragments (Taq + Pwo) and short-range PCR fragments (Taq only) the error rate is and respectively (Roche, PCR Application Manual). To prevent incorporating too many errors by PCR, I always try to avoid too many PCR reactions before sequencing, (normally, one long-range PCR followed by one short-range PCR and then sequencing). The 0.4% difference errors found by Sorenson et al (1999), may be indicative of errors occurring in different parts of the procedure, for example, reading errors in the sequencing gel or the electropherograms. Cloning and multiplication in bacteria can incorporate wrong base pairs also. Using a cloning method does not guarantee that all the restricted fragments are able to be cloned into E. Coli. In this situation, the missing fragments are PCR amplified and cloned again (for example, Ursing and Arnason, 1998; Pumo et al., 1998).
136 Chapter 4 Discussion 139 The bottleneck for our method, in both time and money, is the availability of suitable primers. Making universal primers across all the mammals is a good strategy but, in reality, it is very hard to find regions sufficiently conserved enough, and long enough (more than 20 bases) that satisfy most of the criteria for primer design (see section 2.3). Sorenson et al., (1999) designed a set of 86 universal primers which are useful for most of the avian mitochondrial genome. In my research, although most primers were designed to be useful for other mammals, it was still necessary to design new primers to complete a new genome. For example, although over 200 primers plus 100 bird primers were available, an extra 10 primers were needed to complete the shrew mitochondrial genome. Nevertheless, the strategy of starting with long-range PCR is very successful. 4.2 Data alignment and database manipulation As mentioned in section 2.5, data alignment can be a problem for phylogeny. For this study, alignment of protein coding genes was not a problem because most of the sites are conserved. For RNA genes, the use of secondary structure to compare the possible loops and stems positions helped the alignment (Springer and Douzery, 1996). A significant part of rrna sequences were unable to be aligned unambiguously so they were removed from the analysis. The conserved alignment of protein coding genes can also help to find any mistakes in our sequences and in sequences downloaded from GenBank. There are many kinds of databases designed for different purposes. Two major data bases routinely used are GenBank ( and EMBL ( As the flood of sequence data increases, the searching and manipulation of the database is more and more important. The number of complete mammalian mitochondrial genomes available was 20 when I started this thesis three years ago; it is now more than 55 (including the 8 genomes I have done). Possible errors in the sequence data should be taken into account when we use these data for analysis. Annotation mistakes in the start and stop position of a gene can be easily found from alignment. Most of the mistakes are a few bases missing/extra from their correct positions and can be corrected easily. Some mistakes come from sequencing itself and can only be guessed from the alignment. Frameshift(s) in amino acid coding
137 Chapter 4 Discussion 140 sequences usually indicate incorrect sequence data. This can come from laboratory work, for example sequence reading errors. If the sequences are correct, they may be from nuclear copies or non-functional heterogeneity in the mitochondrion. Potential mistakes in RNA genes are not easily detected so cannot be corrected. Anyway, there is only one way to confidently correct the mistakes that is, by resequencing the doubtful regions (for example, the hedgehog complete genome in Lin et al., 2001a). These sequencing mistakes may not affect the tree inference but will increase the confidence interval of the tree. 4.3 General conclusions from this study It has become clear that phylogeny based on single genes lacks reliability and resolution for deep branches in the mammalian tree (Penny et al., 1982; Cao et al., 1998). With longer sequences (for example, complete mitochondrial DNA) and additional taxa for all extant mammalian orders, the tree is becoming stable and consistent. This thesis makes a further contribution to the resolution of mammalian relationships as outlined below: A. Bat monophyly: In our analysis, the order of bats (Chiroptera) is a monophyletic group (Lin and Penny, 2001). This implies the similarity of the retinal brain track between megabats and primates (Pettigrew, 1986) must be convergent evolution B. Microbat paraphyly: Our results generally support Rhinolophus bat (a microbat) as a sister taxa to megabats but there are still some cautions (Lin et al., 2001a). The complete mitochondrial genome for another microbat (New Zealand short-tailed bat) is being sequenced in our laboratory. It is hoped that this will help resolve the relationships among microbats and the position of Rhinolophus bat is expected to be settled in the mammalian mitochondrial tree. C. Chiroptera and Eulipotyphla are not sister groups: The claim of a sister relationship between Chiroptera and Eulipotyphla was based on a single taxon for both groups (fruit bat and mole - Mouchaty et al., 2000). With our two bats included in the analysis, this relationship becomes unstable (Lin and Penny, 2001). When an additional megabat (Nikaido et al., 2000), our other microbat (a
138 Chapter 4 Discussion 141 Rhinolophus bat) and two eulipotyphlans (a shrew and a gymnure) were included, the Chiroptera / Eulipotyphla sister relationship disappeared and Eulipotyphla sit deepest in the Laurasiatherian group followed by Chiroptera. This supports the Scrotifera hypothesis of Waddell et al., (1999). D. Eulipotyphla is a monophyletic group: In this thesis, trees from within the Laurasiatherian group support Eulipotyphla as a monophyletic group (though Solenodon is not represented). On the other hand, the tree rooted with marsupials and a monotreme supports both Eulipotyphla monophyly and polyphyly (Lin, et al. 2001a, Fig 4 and 5). For the reason explained below, the polyphyletic tree is less reliable. The polyphyletic tree was not simply rooting the placental tree on the hedgehog/gymnure branch, rather it has a major rearrangement compared to the unrooted tree. This polyphyletic tree is also contradicts trees from nuclear genes and morphological data. Considering the abnormal base frequency of hedgehog/gymnure, it is reasonable to assume that they are attracted to the outgroups. On the other hand, the support for Eulipotyphla monophyly should come from real evolutionary signals. E. Rodent monophyly and Glires: Our results support Rodentia as a monophyletic group (Lin et al., 2001b). Most of the claim of Rodentian paraphyly has been based on a small sample size and considered only the rooted tree (for example, Reyes, et al. 2000). With the inclusion of extra rodent taxa (cane rat and vole) and lagmorpha taxa (pika) and by careful examination of the difference between the unrooted tree and the rooted tree, support for rodent monophyly becomes stronger. The support of Glires is dependent on the monophyly of rodents when the rodents are a monphyletic group, Glires are supported (Lin, et al. 2001b). This is reenforced when complete mt-dna from recently sequenced primates (a loris, a cebus, a macaque and a tarsier) were incorporated in the data set because Lagmorpha were tending to join to the primates. F. Four clades in Eutheria: Using my data, in a rooted tree with Eulipotyphla monophyly, the same four groups appear as those derived from nuclear genes (Fig 1.1 B and Lin, et al. 2001a, Fig 5), though the single long branch of Xenarthra (armadillo) tends to join the Afrotheria. Trees which have hedgehog/gymnure and
139 Chapter 4 Discussion 142 murid rodent as the deepest branches were considered unreliable as discussed earlier. 4.4 How reliable is the tree from mt-genome? A. Taxa selection Choosing particular taxa for an analysis can change the tree inferred. For example, Philippe (1997) reanalyzed the data of D'Erchia et al., (1996) with an additional 3 taxa in the data set. The resulting tree showed rodent monophyly, contrary to D Erchia et al. s claim of rodent paraphyly. From the previous experiences, I conclude the following principles for choosing taxa in this study (Lin et al. 2001a and 2001b): a) including all the available taxa for the group we are studying, analyze the phylogenetic relationship within this group. b) add representive taxa from other placental groups but exclude very closely related taxa because they cannot help to resolve the deeper divergences. c) add marsupial and monotreme outgroups to root the eutherian tree. Study their phylogenetic relationship, the rooting of placental mammals and compare to the unrooted trees. B. Consensus between nuclear trees and mitochondrial trees of mammals. The agreement of four principal clades of placental mammals between this study and other groups from nuclear gene phylogeny (Madsen et al., 2001; Murphy et al., 2001; Eizirik et al., 2001) provides strong support for this tree. Although some ordinal relationships in the mammalian tree are still ambiguous, they are just local rearrangements. Where the root joins these four groups is still not clear, it could be either at the base of Afrotheria or Xenarthra or in between [Afrotheria, Xenarthra] and [Laurasiatheria, Supraprimates]. With more data expected to be included in the data set, the rooting of the mammalian trees should become clearer and the resolution in the mammalian tree will increase a lot. C. Long branch attraction problem. From the phylogenetic tree of this thesis and other studies, (for example Eizirik et al., 2001) the mammalian tree had shorter internal branches and longer external branches. This topology of long and short branches is prone to a standard long
140 Chapter 4 Discussion 143 branch attraction problem and this is especially obvious in the rooted tree. Some early studies (for example Krettek et al., 1995; D'Erchia et al., 1996) are clearly misplaced because of the long branch attraction problem. Our approach of choosing appropriate taxa to break up the possible misplaced long branches has been mostly successful and some traditional disagreements have been resolved by this study. For example, the argument of rodent monophyly/paraphyly in recently published papers (Reyes et al., 2000) suggested that long branch attraction between murid rodents and the outgroup could not be responsible for the existence of rodent paraphyly in their analysis because murid rodents do not have a high evolutionary rate. However, when vole/pika and other new mammalian mitochondrial genomes sequences were included, rodent monophyly and a sister relationship of rodents and lagomorphs (Glires, see section 1.4.3) are well supported (Lin, et al. 2001b). This strongly suggests that long branch attraction existed between murid rodents and outgroups in the previous study. The observation that rodents did not have a fast rate of evolution is inconsistent with other studies which have found that murid rodents do have a fast rate (see section 1.8.4). Even if the evolutionary rate in murid rodents did not accelerate, undetected rate differences or change in some mutations can exist and cause problems (Lin, et al. 2001b). Another example is that the mole and bat sister relationship can also be derived from long branch attraction. By including the shrew, the gymnure and 3 more bats in the analysis (Lin, et al. 2001a), Eulipotyphla and Chiroptera are separated by only one step. From the experience in this study, it is better to make an unrooted tree first and compare this to a rooted tree in a later stage. If the rooted tree has a major rearrangement compared to the unrooted counterpart, we should not automatically accept the rooted tree, because there may be a long branch attraction problem causing this rearrangement. Eizirik et al. (2001) also noted that the bootstrap support in their mammalian unrooted tree was higher compared to a rooted tree. This implied an unstable rooting position, which decreased the bootstrap support for the rooted tree. In this thesis, the final rooted tree has a major rearrangement compared to unrooted tree. When the ingroups most likely to be affected by long branch attraction are constrained, the resultant rooted tree topology is similar to that
141 Chapter 4 Discussion 144 of the unrooted tree. In addition, the constrained rooted tree is statistically undifferentiated from the optimal rooted tree in ML value. The claims of previously studies (Reyes, et al. 2000, for example) of rodent paraphyly in their rooted tree is therefore dubious. 4.5 Are the trees inferred consistent with palaeontological and biogeographic evidence? Higher mammalian relationships inferred from morphological data by different researchers often showed a lack of resolution and sometimes contradicted each other (Benton, 1988). Studies based on molecular analyses brought forward a lot of new hypotheses, for example, Afrotheria, rodent paraphyly, and Laurasiatheria and supported some hypotheses from morphological studies, for example, Marsupionta, and Glires. Some of the hypotheses are still supported when new taxa are included in the analysis. However, some are inconsistent when additional taxa are included. Careful examination of all evidences (molecular, morphological, and paleontological) allows a more consistent phylogeny to be produced. The geographical barrier is one main factor in speciation. The diversification of mammalian orders has coped with many geographical changes. At the time the first mammals appear (210 Mya), continents were sutured together into a single supercontinent known as Pangaea. At the end of the Triassic and the beginning of Jurassic period, Pangaea split into Laurasia in the north and Gondwana in the south. During the Cretaceous, Laurasia and Gondwana underwent further fission, creating isolated landmasses (Fig 4.1). This pattern of continental fragmentation doubtlessly led to the divergence of different lineages of mammals. Herbivores, large carnivores, large anteaters, and omnivores appear to have developed independently on different continents (Fig 4.2). Because most fossils are looked for and found in the northern hemisphere, it was taken for granted that modern orders of mammals diversified on the Laurasian continent. In most of the recent molecular phylogenies (including this thesis), the deepest branches are those leading to the southern hemisphere clades - Xenarthra (armidallo, in South America) and Afrotheria (elephant/aardvark/tenrec, in Africa).

142 Chapter 4 Discussion 145 Fig 4.2 Geological time scales and the transition of continents.
Molecules consolidate the placental mammal tree.
 Molecules consolidate the placental mammal tree. The morphological concensus mammal tree Two decades of molecular phylogeny Rooting the placental mammal tree Parallel adaptative radiations among placental
Molecular evidence for multiple origins of Insectivora and for a new order of endemic African insectivore mammals
 Project Report Molecular evidence for multiple origins of Insectivora and for a new order of endemic African insectivore mammals By Shubhra Gupta CBS 598 Phylogenetic Biology and Analysis Life Science
C3020 Molecular Evolution. Exercises #3: Phylogenetics
 C3020 Molecular Evolution Exercises #3: Phylogenetics Consider the following sequences for five taxa 1-5 and the known outgroup O, which has the ancestral states (note that sequence 3 has changed from
8/23/2014. Phylogeny and the Tree of Life
 Phylogeny and the Tree of Life Chapter 26 Objectives Explain the following characteristics of the Linnaean system of classification: a. binomial nomenclature b. hierarchical classification List the major
Chapter 26 Phylogeny and the Tree of Life
 Chapter 26 Phylogeny and the Tree of Life Biologists estimate that there are about 5 to 100 million species of organisms living on Earth today. Evidence from morphological, biochemical, and gene sequence
Lecture 11 Friday, October 21, 2011
 Lecture 11 Friday, October 21, 2011 Phylogenetic tree (phylogeny) Darwin and classification: In the Origin, Darwin said that descent from a common ancestral species could explain why the Linnaean system
UoN, CAS, DBSC BIOL102 lecture notes by: Dr. Mustafa A. Mansi. The Phylogenetic Systematics (Phylogeny and Systematics)
") - Phylogeny? - Systematics? The Phylogenetic Systematics (Phylogeny and Systematics) - Phylogenetic systematics? Connection between phylogeny and classification. - Phylogenetic systematics informs the
- Phylogeny? - Systematics? The Phylogenetic Systematics (Phylogeny and Systematics) - Phylogenetic systematics? Connection between phylogeny and classification. - Phylogenetic systematics informs the
Phylogeny 9/8/2014. Evolutionary Relationships. Data Supporting Phylogeny. Chapter 26
 Phylogeny Chapter 26 Taxonomy Taxonomy: ordered division of organisms into categories based on a set of characteristics used to assess similarities and differences Carolus Linnaeus developed binomial nomenclature,
Reconstructing the history of lineages
 Reconstructing the history of lineages Class outline Systematics Phylogenetic systematics Phylogenetic trees and maps Class outline Definitions Systematics Phylogenetic systematics/cladistics Systematics
Chapter 16: Reconstructing and Using Phylogenies
 Chapter Review 1. Use the phylogenetic tree shown at the right to complete the following. a. Explain how many clades are indicated: Three: (1) chimpanzee/human, (2) chimpanzee/ human/gorilla, and (3)chimpanzee/human/
Chapter 26: Phylogeny and the Tree of Life Phylogenies Show Evolutionary Relationships
 Chapter 26: Phylogeny and the Tree of Life You Must Know The taxonomic categories and how they indicate relatedness. How systematics is used to develop phylogenetic trees. How to construct a phylogenetic
Phylogenetic Analysis
 Phylogenetic Analysis Aristotle Through classification, one might discover the essence and purpose of species. Nelson & Platnick (1981) Systematics and Biogeography Carl Linnaeus Swedish botanist (1700s)
How should we organize the diversity of animal life?
 How should we organize the diversity of animal life? The difference between Taxonomy Linneaus, and Cladistics Darwin What are phylogenies? How do we read them? How do we estimate them? Classification (Taxonomy)
CHAPTER 26 PHYLOGENY AND THE TREE OF LIFE Connecting Classification to Phylogeny
 CHAPTER 26 PHYLOGENY AND THE TREE OF LIFE Connecting Classification to Phylogeny To trace phylogeny or the evolutionary history of life, biologists use evidence from paleontology, molecular data, comparative
CHAPTERS 24-25: Evidence for Evolution and Phylogeny
 CHAPTERS 24-25: Evidence for Evolution and Phylogeny 1. For each of the following, indicate how it is used as evidence of evolution by natural selection or shown as an evolutionary trend: a. Paleontology
Phylogenetic Analysis
 Phylogenetic Analysis Aristotle Through classification, one might discover the essence and purpose of species. Nelson & Platnick (1981) Systematics and Biogeography Carl Linnaeus Swedish botanist (1700s)
Phylogenetic Analysis
 Phylogenetic Analysis Aristotle Through classification, one might discover the essence and purpose of species. Nelson & Platnick (1981) Systematics and Biogeography Carl Linnaeus Swedish botanist (1700s)
Phylogeny is the evolutionary history of a group of organisms. Based on the idea that organisms are related by evolution
 Bio 1M: Phylogeny and the history of life 1 Phylogeny S25.1; Bioskill 11 (2ndEd S27.1; Bioskills 3) Bioskills are in the back of your book Phylogeny is the evolutionary history of a group of organisms
Lecture V Phylogeny and Systematics Dr. Kopeny
 Delivered 1/30 and 2/1 Lecture V Phylogeny and Systematics Dr. Kopeny Lecture V How to Determine Evolutionary Relationships: Concepts in Phylogeny and Systematics Textbook Reading: pp 425-433, 435-437
PHYLOGENY AND SYSTEMATICS
 AP BIOLOGY EVOLUTION/HEREDITY UNIT Unit 1 Part 11 Chapter 26 Activity #15 NAME DATE PERIOD PHYLOGENY AND SYSTEMATICS PHYLOGENY Evolutionary history of species or group of related species SYSTEMATICS Study
PHYLOGENY & THE TREE OF LIFE
 PHYLOGENY & THE TREE OF LIFE PREFACE In this powerpoint we learn how biologists distinguish and categorize the millions of species on earth. Early we looked at the process of evolution here we look at
Classification and Phylogeny
 Classification and Phylogeny The diversity of life is great. To communicate about it, there must be a scheme for organization. There are many species that would be difficult to organize without a scheme
Classification, Phylogeny yand Evolutionary History
 Classification, Phylogeny yand Evolutionary History The diversity of life is great. To communicate about it, there must be a scheme for organization. There are many species that would be difficult to organize
Classification and Phylogeny
 Classification and Phylogeny The diversity it of life is great. To communicate about it, there must be a scheme for organization. There are many species that would be difficult to organize without a scheme
Chapter 26: Phylogeny and the Tree of Life
 Chapter 26: Phylogeny and the Tree of Life 1. Key Concepts Pertaining to Phylogeny 2. Determining Phylogenies 3. Evolutionary History Revealed in Genomes 1. Key Concepts Pertaining to Phylogeny PHYLOGENY
Multidimensional Vector Space Representation for Convergent Evolution and Molecular Phylogeny
 MBE Advance Access published November 17, 2004 Multidimensional Vector Space Representation for Convergent Evolution and Molecular Phylogeny Yasuhiro Kitazoe*, Hirohisa Kishino, Takahisa Okabayashi*, Teruaki
PDF hosted at the Radboud Repository of the Radboud University Nijmegen
 PDF hosted at the Radboud Repository of the Radboud University Nijmegen The following full text is a publisher's version. For additional information about this publication click this link. http://hdl.handle.net/2066/19216
Macroevolution Part I: Phylogenies
 Macroevolution Part I: Phylogenies Taxonomy Classification originated with Carolus Linnaeus in the 18 th century. Based on structural (outward and inward) similarities Hierarchal scheme, the largest most
SCIENTIFIC EVIDENCE TO SUPPORT THE THEORY OF EVOLUTION. Using Anatomy, Embryology, Biochemistry, and Paleontology
 SCIENTIFIC EVIDENCE TO SUPPORT THE THEORY OF EVOLUTION Using Anatomy, Embryology, Biochemistry, and Paleontology Scientific Fields Different fields of science have contributed evidence for the theory of
Dr. Amira A. AL-Hosary
 Phylogenetic analysis Amira A. AL-Hosary PhD of infectious diseases Department of Animal Medicine (Infectious Diseases) Faculty of Veterinary Medicine Assiut University-Egypt Phylogenetic Basics: Biological
Mammal Phylogeny: Placentals READ ONLINE
 Mammal Phylogeny: Placentals READ ONLINE If searched for the ebook Mammal Phylogeny: Placentals in pdf format, then you've come to the faithful site. We furnish the utter option of this ebook in doc, PDF,
Phylogeny and systematics. Why are these disciplines important in evolutionary biology and how are they related to each other?
 Phylogeny and systematics Why are these disciplines important in evolutionary biology and how are they related to each other? Phylogeny and systematics Phylogeny: the evolutionary history of a species
Introduction to characters and parsimony analysis
 Introduction to characters and parsimony analysis Genetic Relationships Genetic relationships exist between individuals within populations These include ancestordescendent relationships and more indirect
RNA-based Phylogenetic Methods: Application to Mammalian Mitochondrial RNA Sequences.
 RNA-based Phylogenetic Methods: Application to Mammalian Mitochondrial RNA Sequences. Cendrine Hudelot 1, Vivek Gowri-Shankar 2, Howsun Jow 2, Magnus Rattray 2 and Paul G. Higgs 3 1 School of Biological
Chapters 25 and 26. Searching for Homology. Phylogeny
 Chapters 25 and 26 The Origin of Life as we know it. Phylogeny traces evolutionary history of taxa Systematics- analyzes relationships (modern and past) of organisms Figure 25.1 A gallery of fossils The
Name: Class: Date: ID: A
 Class: _ Date: _ Ch 17 Practice test 1. A segment of DNA that stores genetic information is called a(n) a. amino acid. b. gene. c. protein. d. intron. 2. In which of the following processes does change
Warm-Up- Review Natural Selection and Reproduction for quiz today!!!! Notes on Evidence of Evolution Work on Vocabulary and Lab
 Date: Agenda Warm-Up- Review Natural Selection and Reproduction for quiz today!!!! Notes on Evidence of Evolution Work on Vocabulary and Lab Ask questions based on 5.1 and 5.2 Quiz on 5.1 and 5.2 How
1/17/2012. Class Aves. Avian Systematics. Avian Systematics. Subclass Sauriurae
 Systematics deals with evolutionary relationships among organisms. Allied with classification (or taxonomy). All birds are classified within the single Class Aves 2 Subclasses 4 Infraclasses Class Aves
Outline. Classification of Living Things
 Outline Classification of Living Things Chapter 20 Mader: Biology 8th Ed. Taxonomy Binomial System Species Identification Classification Categories Phylogenetic Trees Tracing Phylogeny Cladistic Systematics
Amira A. AL-Hosary PhD of infectious diseases Department of Animal Medicine (Infectious Diseases) Faculty of Veterinary Medicine Assiut
 Faculty of Veterinary Medicine Assiut") Amira A. AL-Hosary PhD of infectious diseases Department of Animal Medicine (Infectious Diseases) Faculty of Veterinary Medicine Assiut University-Egypt Phylogenetic analysis Phylogenetic Basics: Biological
Amira A. AL-Hosary PhD of infectious diseases Department of Animal Medicine (Infectious Diseases) Faculty of Veterinary Medicine Assiut University-Egypt Phylogenetic analysis Phylogenetic Basics: Biological
Chapter 19. History of Life on Earth
 Chapter 19 History of Life on Earth Adapted from Holt Biology 2008 Chapter 19 Section 3: Evolution of Life Key Vocabulary Terms Adapted from Holt Biology 2008 Cyanobacteria Photosynthetic prokaryotes Adapted
AP Biology. Cladistics
 Cladistics Kingdom Summary Review slide Review slide Classification Old 5 Kingdom system Eukaryote Monera, Protists, Plants, Fungi, Animals New 3 Domain system reflects a greater understanding of evolution
Name. Ecology & Evolutionary Biology 2245/2245W Exam 2 1 March 2014
 Name 1 Ecology & Evolutionary Biology 2245/2245W Exam 2 1 March 2014 1. Use the following matrix of nucleotide sequence data and the corresponding tree to answer questions a. through h. below. (16 points)
Belfield, Dublin, Ireland
 This article was downloaded by:[university of California Riverside] On: 27 September 2007 Access Details: [subscription number 768495051] Publisher: Taylor & Francis Informa Ltd Registered in England and
Bio 1M: The evolution of apes. 1 Example. 2 Patterns of evolution. Similarities and differences. History
 Bio 1M: The evolution of apes 1 Example Humans are an example of a biological species that has evolved Possibly of interest, since many of your friends are probably humans Humans seem unique: How do they
Evidence of Evolution by Natural Selection. Dodo bird
 Evidence of Evolution by Natural Selection Dodo bird 2007-2008 Evidence supporting evolution Fossil record transition species Anatomical record homologous & vestigial structures embryology & development
Phylogenies & Classifying species (AKA Cladistics & Taxonomy) What are phylogenies & cladograms? How do we read them? How do we estimate them?
 What are phylogenies & cladograms? How do we read them? How do we estimate them?") Phylogenies & Classifying species (AKA Cladistics & Taxonomy) What are phylogenies & cladograms? How do we read them? How do we estimate them? Carolus Linneaus:Systema Naturae (1735) Swedish botanist &
Phylogenies & Classifying species (AKA Cladistics & Taxonomy) What are phylogenies & cladograms? How do we read them? How do we estimate them? Carolus Linneaus:Systema Naturae (1735) Swedish botanist &
Chapter 19: Taxonomy, Systematics, and Phylogeny
 Chapter 19: Taxonomy, Systematics, and Phylogeny AP Curriculum Alignment Chapter 19 expands on the topics of phylogenies and cladograms, which are important to Big Idea 1. In order for students to understand
Organizing Life s Diversity
 17 Organizing Life s Diversity section 2 Modern Classification Classification systems have changed over time as information has increased. What You ll Learn species concepts methods to reveal phylogeny
Integrating Fossils into Phylogenies. Throughout the 20th century, the relationship between paleontology and evolutionary biology has been strained.
 IB 200B Principals of Phylogenetic Systematics Spring 2011 Integrating Fossils into Phylogenies Throughout the 20th century, the relationship between paleontology and evolutionary biology has been strained.
Phylogeny & Systematics
 Phylogeny & Systematics Phylogeny & Systematics An unexpected family tree. What are the evolutionary relationships among a human, a mushroom, and a tulip? Molecular systematics has revealed that despite
AP Biology. Evolution is "so overwhelmingly established that it has become irrational to call it a theory." Evidence of Evolution by Natural Selection
 Evidence of Evolution by Natural Selection Evolution is "so overwhelmingly established that it has become irrational to call it a theory." -- Ernst Mayr What Evolution Is 2001 Professor Emeritus, Evolutionary
Bio 1B Lecture Outline (please print and bring along) Fall, 2007
 Fall, 2007") Bio 1B Lecture Outline (please print and bring along) Fall, 2007 B.D. Mishler, Dept. of Integrative Biology 2-6810, bmishler@berkeley.edu Evolution lecture #5 -- Molecular genetics and molecular evolution
Bio 1B Lecture Outline (please print and bring along) Fall, 2007 B.D. Mishler, Dept. of Integrative Biology 2-6810, bmishler@berkeley.edu Evolution lecture #5 -- Molecular genetics and molecular evolution
Chapter 22: Descent with Modification 1. BRIEFLY summarize the main points that Darwin made in The Origin of Species.
 AP Biology Chapter Packet 7- Evolution Name Chapter 22: Descent with Modification 1. BRIEFLY summarize the main points that Darwin made in The Origin of Species. 2. Define the following terms: a. Natural
METHODS FOR DETERMINING PHYLOGENY. In Chapter 11, we discovered that classifying organisms into groups was, and still is, a difficult task.
 Chapter 12 (Strikberger) Molecular Phylogenies and Evolution METHODS FOR DETERMINING PHYLOGENY In Chapter 11, we discovered that classifying organisms into groups was, and still is, a difficult task. Modern
Cladistics and Bioinformatics Questions 2013
 AP Biology Name Cladistics and Bioinformatics Questions 2013 1. The following table shows the percentage similarity in sequences of nucleotides from a homologous gene derived from five different species
Reconstructing Evolutionary Trees. Chapter 14
 Reconstructing Evolutionary Trees Chapter 14 Phylogenetic trees The evolutionary history of a group of species = phylogeny The problem: Evolutionary histories can never truly be known. Once again, we are
Evidence for Evolution
 Evidence for Evolution 1. 2. 3. 4. 5. Paleontology Comparative Anatomy Embryology Comparative Biochemistry Geographical Distribution How old is everything? The History of Earth as a Clock Station 1: Paleontology
THE EVIDENCE FOR EVOLUTION
 Unit 37 THE EVIDENCE FOR EVOLUTION LEARNING OBJECTIVES 1. Understand the meaning of the term evolution. 2. Learn about fossil evidence including how fossils are formed. 3. Learn how comparative anatomy
Since Darwin s work, every scientific test has supported Darwin s basic ideas about evolution
 Guided Reading Answers Since Darwin s work, every scientific test has supported Darwin s basic ideas about evolution Biogeography Biogeography is the study of where organisms live now, and where they and
Chapter 26 Phylogeny and the Tree of Life
 Chapter 26 Phylogeny and the Tree of Life Chapter focus Shifting from the process of how evolution works to the pattern evolution produces over time. Phylogeny Phylon = tribe, geny = genesis or origin
Origin of an idea about origins
 Origin of an idea about origins Biological evolution is the process of change during the course of time because of the alteration of the genotype and the transfer of these altered genes to the next generation.
Using phylogenetics to estimate species divergence times... Basics and basic issues for Bayesian inference of divergence times (plus some digression)
") Using phylogenetics to estimate species divergence times... More accurately... Basics and basic issues for Bayesian inference of divergence times (plus some digression) "A comparison of the structures
Using phylogenetics to estimate species divergence times... More accurately... Basics and basic issues for Bayesian inference of divergence times (plus some digression) "A comparison of the structures
From then till now the Cenozoic
 From then till now the Cenozoic Not just a steady increase in diversity over time... Earth s history helped shape the evolution of vertebrates, especially mammals. Positions of the continents affected
Evidence of Evolution. Lesson Overview. Lesson Overview Evidence of Evolution
 Lesson Overview Lesson Overview 16.4 THINK ABOUT IT Scientists in some fields, including geology, physics, paleontology, chemistry, and embryology, did not have the technology or understanding to test
Integrative Biology 200 "PRINCIPLES OF PHYLOGENETICS" Spring 2018 University of California, Berkeley
 Integrative Biology 200 "PRINCIPLES OF PHYLOGENETICS" Spring 2018 University of California, Berkeley B.D. Mishler Feb. 14, 2018. Phylogenetic trees VI: Dating in the 21st century: clocks, & calibrations;
Lesson 1 Syllabus Reference
 Lesson 1 Syllabus Reference Outcomes A student Explains how biological understanding has advanced through scientific discoveries, technological developments and the needs of society. Content The theory
BIOLOGY 435 MAMMALOGY
 BIOLOGY 435 MAMMALOGY FALL 2012 Jay Bogiatto, M.S., Faculty Meeting: Lecture (T 3-5p), Lab (R 2-5P) in Holt Hall 235 Office/Hours: Holt Hall 211 / M. 3-5P and by Appt. Email: rbogiatto@csuchico.edu COURSE
Sources of Evidence of Evolution
 Sources of Evidence of Evolution In The Origin of Species, Darwin assembled a group of facts that had previously seemed unrelated. Darwin s ideas were developed, for the most part, by his observations
Biology 211 (2) Week 1 KEY!
 Week 1 KEY!") Biology 211 (2) Week 1 KEY Chapter 1 KEY FIGURES: 1.2, 1.3, 1.4, 1.5, 1.6, 1.7 VOCABULARY: Adaptation: a trait that increases the fitness Cells: a developed, system bound with a thin outer layer made of
Biology 211 (2) Week 1 KEY Chapter 1 KEY FIGURES: 1.2, 1.3, 1.4, 1.5, 1.6, 1.7 VOCABULARY: Adaptation: a trait that increases the fitness Cells: a developed, system bound with a thin outer layer made of
31/10/2012. Human Evolution. Cytochrome c DNA tree
 Human Evolution Cytochrome c DNA tree 1 Human Evolution! Primate phylogeny! Primates branched off other mammalian lineages ~65 mya (mya = million years ago) Two types of monkeys within lineage 1. New World
Integrative Biology 200A "PRINCIPLES OF PHYLOGENETICS" Spring 2012 University of California, Berkeley
 Integrative Biology 200A "PRINCIPLES OF PHYLOGENETICS" Spring 2012 University of California, Berkeley B.D. Mishler Feb. 7, 2012. Morphological data IV -- ontogeny & structure of plants The last frontier
Many of the slides that I ll use have been borrowed from Dr. Paul Lewis, Dr. Joe Felsenstein. Thanks!
 Many of the slides that I ll use have been borrowed from Dr. Paul Lewis, Dr. Joe Felsenstein. Thanks! Paul has many great tools for teaching phylogenetics at his web site: http://hydrodictyon.eeb.uconn.edu/people/plewis
USING BLAST TO IDENTIFY PROTEINS THAT ARE EVOLUTIONARILY RELATED ACROSS SPECIES
 USING BLAST TO IDENTIFY PROTEINS THAT ARE EVOLUTIONARILY RELATED ACROSS SPECIES HOW CAN BIOINFORMATICS BE USED AS A TOOL TO DETERMINE EVOLUTIONARY RELATIONSHPS AND TO BETTER UNDERSTAND PROTEIN HERITAGE?
Molecular sequence data are increasingly used in mammalian
 Protein sequence signatures support the African clade of mammals Marjon A. M. van Dijk*, Ole Madsen*, François Catzeflis, Michael J. Stanhope, Wilfried W. de Jong*, and Mark Pagel *Department of Biochemistry,
Biology 1B Evolution Lecture 2 (February 26, 2010) Natural Selection, Phylogenies
 Natural Selection, Phylogenies") 1 Natural Selection (Darwin-Wallace): There are three conditions for natural selection: 1. Variation: Individuals within a population have different characteristics/traits (or phenotypes). 2. Inheritance:
1 Natural Selection (Darwin-Wallace): There are three conditions for natural selection: 1. Variation: Individuals within a population have different characteristics/traits (or phenotypes). 2. Inheritance:
Evidence for Evolution by Natural Selection Regents Biology
 Evidence for Evolution by Natural Selection Objective: Determine the different types of evidence for proving evolution Evidence supporting evolution Fossil record shows change over time Comparative Anatomy
Evolution Problem Drill 09: The Tree of Life
 Evolution Problem Drill 09: The Tree of Life Question No. 1 of 10 Question 1. The age of the Earth is estimated to be about 4.0 to 4.5 billion years old. All of the following methods may be used to estimate
Phylogeny & Systematics: The Tree of Life
 Phylogeny & Systematics: The Tree of Life An unexpected family tree. What are the evolutionary relationships among a human, a mushroom, and a tulip? Molecular systematics has revealed that despite appearances
Anatomy of a tree. clade is group of organisms with a shared ancestor. a monophyletic group shares a single common ancestor = tapirs-rhinos-horses
 Anatomy of a tree outgroup: an early branching relative of the interest groups sister taxa: taxa derived from the same recent ancestor polytomy: >2 taxa emerge from a node Anatomy of a tree clade is group
B. Phylogeny and Systematics:
 Tracing Phylogeny A. Fossils: Some fossils form as is weathered and eroded from the land and carried by rivers to seas and where the particles settle to the bottom. Deposits pile up and the older sediments
Homework Assignment, Evolutionary Systems Biology, Spring Homework Part I: Phylogenetics:
 Homework Assignment, Evolutionary Systems Biology, Spring 2009. Homework Part I: Phylogenetics: Introduction. The objective of this assignment is to understand the basics of phylogenetic relationships
Chapter Study Guide Section 17-1 The Fossil Record (pages )
") Name Class Date Chapter Study Guide Section 17-1 The Fossil Record (pages 417-422) Key Concepts What is the fossil record? What information do relative dating and radioactive dating provide about fossils?
Name Class Date Chapter Study Guide Section 17-1 The Fossil Record (pages 417-422) Key Concepts What is the fossil record? What information do relative dating and radioactive dating provide about fossils?
Theory a well supported testable explanation of phenomenon occurring in the natural world.
 Evolution Theory of Evolution Theory a well supported testable explanation of phenomenon occurring in the natural world. Evolution the process by which modern organisms changed over time from ancient common
Evidence of Evolution
 Evidence of Evolution There is a gigantic body of evidence supporting evolution. Six major areas of study contribute to that body of evidence: 1. The Fossil Record 2. Comparative Anatomy 3. Comparative
POPULATION GENETICS Winter 2005 Lecture 17 Molecular phylogenetics
 POPULATION GENETICS Winter 2005 Lecture 17 Molecular phylogenetics - in deriving a phylogeny our goal is simply to reconstruct the historical relationships between a group of taxa. - before we review the
Congruent Mammalian Trees from Mitochondrial and Nuclear Genes Using Bayesian Methods
 Congruent Mammalian Trees from Mitochondrial and Nuclear Genes Using Bayesian Methods Aurelio Reyes,* Carmela Gissi, Francois Catzeflis,à Eviatar Nevo, Graziano Pesole, and Cecilia Saccone *Sezione di
Lecture 6 Phylogenetic Inference
 Lecture 6 Phylogenetic Inference From Darwin s notebook in 1837 Charles Darwin Willi Hennig From The Origin in 1859 Cladistics Phylogenetic inference Willi Hennig, Cladistics 1. Clade, Monophyletic group,
Evidence of Evolution by Natural Selection. Evidence supporting evolution. Fossil record. Fossil record. Anatomical record.
 Evidence of Evolution by Natural Selection Dodo bird Evidence supporting evolution Fossil record transition species Anatomical record homologous & vestigial structures embryology & development Molecular
The Tempo of Macroevolution: Patterns of Diversification and Extinction
 The Tempo of Macroevolution: Patterns of Diversification and Extinction During the semester we have been consider various aspects parameters associated with biodiversity. Current usage stems from 1980's
Chapter 26. Phylogeny and the Tree of Life. Lecture Presentations by Nicole Tunbridge and Kathleen Fitzpatrick Pearson Education, Inc.
 Chapter 26 Phylogeny and the Tree of Life Lecture Presentations by Nicole Tunbridge and Kathleen Fitzpatrick Investigating the Tree of Life Phylogeny is the evolutionary history of a species or group of
Mechanisms of Evolution Darwinian Evolution
 Mechanisms of Evolution Darwinian Evolution Descent with modification by means of natural selection All life has descended from a common ancestor The mechanism of modification is natural selection Concept
Biology 2. Lecture Material. For. Macroevolution. Systematics
 Biology 2 Macroevolution & Systematics 1 Biology 2 Lecture Material For Macroevolution & Systematics Biology 2 Macroevolution & Systematics 2 Microevolution: Biological Species: Two Patterns of Evolutionary
Unit 9: Evolution Guided Reading Questions (80 pts total)
") Name: AP Biology Biology, Campbell and Reece, 7th Edition Adapted from chapter reading guides originally created by Lynn Miriello Unit 9: Evolution Guided Reading Questions (80 pts total) Chapter 22 Descent
Name: AP Biology Biology, Campbell and Reece, 7th Edition Adapted from chapter reading guides originally created by Lynn Miriello Unit 9: Evolution Guided Reading Questions (80 pts total) Chapter 22 Descent
Evidence for Evolution
 Evidence for Evolution Evolution Biological evolution is descent with modification. It is important to remember that: Humans did not evolve from chimpanzees. Humans and chimpanzees are evolutionary cousins
Evidence of Common Ancestry Stations
 Stations Scientists have long wondered where organisms came from and how they evolved. One of the main sources of evidence for the evolution of organisms comes from the fossil record. Thousands of layers
Why is Darwin s Theory of Evolution by Natural Selection controversial? Or is it?
 Why is Darwin s Theory of Evolution by Natural Selection controversial? Or is it? Why is Darwin s Theory of Evolution by Natural Selection controversial? Why is Darwin s Theory of Evolution by Natural
AP Biology Notes Outline Enduring Understanding 1.B. Big Idea 1: The process of evolution drives the diversity and unity of life.
 AP Biology Notes Outline Enduring Understanding 1.B Big Idea 1: The process of evolution drives the diversity and unity of life. Enduring Understanding 1.B: Organisms are linked by lines of descent from
Microbial Taxonomy and the Evolution of Diversity
 19 Microbial Taxonomy and the Evolution of Diversity Copyright McGraw-Hill Global Education Holdings, LLC. Permission required for reproduction or display. 1 Taxonomy Introduction to Microbial Taxonomy
Bio94 Discussion Activity week 3: Chapter 27 Phylogenies and the History of Life
 Bio94 Discussion Activity week 3: Chapter 27 Phylogenies and the History of Life 1. Constructing a phylogenetic tree using a cladistic approach Construct a phylogenetic tree using the following table: