Biological Knowledge Discovery Through Mining Multiple Sources of High-Throughput Data
|
|
|
- Rosaline Gilbert
- 6 years ago
- Views:
Transcription
1 University of Tennessee, Knoxville Trace: Tennessee Research and Creative Exchange Doctoral Dissertations Graduate School Biological Knowledge Discovery Through Mining Multiple Sources of High-Throughput Data Yu Chen University of Tennessee - Knoxville Recommended Citation Chen, Yu, "Biological Knowledge Discovery Through Mining Multiple Sources of High-Throughput Data. " PhD diss., University of Tennessee, This Dissertation is brought to you for free and open access by the Graduate School at Trace: Tennessee Research and Creative Exchange. It has been accepted for inclusion in Doctoral Dissertations by an authorized administrator of Trace: Tennessee Research and Creative Exchange. For more information, please contact trace@utk.edu.
2 To the Graduate Council: I am submitting herewith a dissertation written by Yu Chen entitled "Biological Knowledge Discovery Through Mining Multiple Sources of High-Throughput Data." I have examined the final electronic copy of this dissertation for form and content and recommend that it be accepted in partial fulfillment of the requirements for the degree of Doctor of Philosophy, with a major in Philosophy. We have read this dissertation and recommend its acceptance: Jeff Becker, Loren Hauser, Elizabeth Howell, Ying Xu (Original signatures are on file with official student records.) Dong Xu, Major Professor Accepted for the Council: Dixie L. Thompson Vice Provost and Dean of the Graduate School
3 To the Graduate Council: I am submitting herewith a dissertation written by Yu Chen entitled Biological Knowledge Discovery through Mining Multiple Sources of High-Throughput Data. I have examined the final electronic copy of this dissertation for form and content and recommend that it be accepted in partial fulfillment of the requirements for the degree of Doctor of Philosophy, with a major in Life Sciences. Dong Xu Major Professor We have read this dissertation and recommend its acceptance: Jeff Becker Loren Hauser Elizabeth Howell Ying Xu Accepted for the Council: Anne Mayhew Vice Chancellor and Dean of Graduate Studies (Original signatures are on file with official student records)
4 Biological Knowledge Discovery through Mining Multiple Sources of High-Throughput Data A Dissertation Presented for the Doctor of Philosophy Degree The University of Tennessee, Knoxville Yu Chen August 2004
5 Acknowledgements I would like to thank my parents and the rest of the family. Without their support and encouragement, I would not enjoy so much my study. I would like to thank my major advisor, Dr. Dong Xu, for his valuable mentoring. It is a great experience of studying and working under his guidance. And I indeed learn a lot from him in work and in life. I would like to thank my other advisors, Dr. Jeff Becker, Dr. Ying Xu, Dr. Loren Hauser and Dr. Liz Howell for willing to serve on my advisor committee and for their valuable guidance and discussions. Many thanks to Dr. Becker for his patient listening and guidance, whenever I approached him with my difficulties. I wish to thank Dr. Ying Xu and Dr. Loren Hauser for the help given to me when we were at Oak Ridge National Laboratory, Tennessee. I wish to thank Dr. Gary Stacy for the valuable guidance and help given to me during my lab rotations and at Columbia, MO. I wish to thank Kay Gardner and Gaynelle Russell for their help. I would like to thank UT-ORNL Graduate School of Genome Science and Technology for providing me the training opportunity. I wish to thank members of Digital Biology Laboratory, Computer Science Department, University of Missouri- Columbia for the help and discussion. I wish to thank Trupti Joshi, as it has been a pleasure working with her. I wish to thank members of Protein Informatics Group, Life Sciences Division, Oak Ridge National Laboratory for the help and discussions. I would like to acknowledge that part of the financial support for my dissertation work came from the Department of Energy's Genomes to Life program ( under the project, Carbon Sequestration in Synechococcus Sp.: From Molecular Machines to Hierarchical Modeling ( and a research contract with Ceres Inc., Malibu, CA. Finally, I would like to take this opportunity to extend my gratitude and regards to all my teachers. I would like to thank all my friends. iii
6 Abstract As we are moving into the post-genomic era, various high-throughput experimental techniques have been developed to characterize biological systems at the genome scale. The high-throughput data are becoming fundamentally important resources to shed new insights on system-level understanding of the organization and dynamics of molecules (e.g. genes and proteins), relationships between them, interaction cascades, pathways, modules and various networks (i.e. regulation, co-expression and metabolism). This dissertation focuses on developing computational tools to facilitate the process of translating the ever-growing volumes of high-throughput data into significant biological knowledge on protein functions, pathways and modules. Although high-throughput data provide a global picture of biological systems about the underlying mechanisms, the details are often noisy. Integration of heterogeneous data that characterize cellular systems from different aspects (i.e. gene expression and proteinprotein interactions) can lead to the comprehensive and coherent discoveries of biological insights. We developed a Bayesian probability framework to predict function for unannotated proteins in yeast through integrating protein binary interaction data, protein complex data and microarray gene expression data. We also extended the computational framework to infer biological pathway in an automated and systematical fashion. Besides bottom-up approaches moving from protein functions to pathways, we also applied top-down approaches to model cellular networks, that is, we started from the architecture of a cellular network to identify functional modules. We applied the k-core algorithm to decompose protein interaction and microarray gene co-expression networks, which provides strong support for modularity principles of networks structure and function. Dynamic functional modules and protein complexes have been identified by clustering the network constructed from multiple sources of high-throughput data, shedding insights into understanding the organization and dynamics of a living cell. We also proposed a consensus approach to model biological pathway by combining different computational tools and integrating multiple sources of high-throughput data. In the future, with the explosion in the quantity and diversity of high-throughput data, it is iv
7 vital to develop methodologies and innovative tools in bioinformatics to model biological systems and explore biological knowledge in an iterative fashion. v
8 Table of Contents Chapter page 1. Bioinformatics in the Post-Genomic Era Introduction High-Throughput Data in Genomics and Proteomics Protein Function Prediction Biological Pathway Inference Biological Network Analysis: Architectural Features and Evolutional Origins About This Dissertation Computational Analysis of Protein Interaction Data and Microarray Gene Expression Data Introduction Data Sources Assessment of Protein-Protein Interaction Data False Negatives and False Positives Overlap and Complementation Analysis of Protein-Protein Interaction Data Reliability Relationship between Protein-Protein Interaction Data and Other Biological Data Subcellular Localization Function Catalogue K-core Application in Detection of Biological Modules Connectivity Distribution K-core Algorithm.. 40 vi
9 2.5.3 Core Decomposition towards Understanding of Biological Network Future work Genome-Scale Function Prediction for Unannotated Proteins in Yeast Saccharomyces cerevisiae through Integrating Multiple Sources of High- Throughput Data Introduction Data Sources Methods Measurement of Protein Function Similarity Identification of Putative Orthologs Using Reciprocal Search Calculation of Bayesian Probabilities Protein Function Prediction Local Prediction Global Prediction Results Discussion Biological Pathway Inference and Biological Interaction Network Clustering Using Multiple-Source High-Throughput Data Introduction Data Sources Biological Pathways Inference Construction of Functional Linkage Graph Pathway Identification Using Dijkstra s Algorithm Case Study of MAPK Signal Transduction Pathway in Yeast Case Study of PLD Signal Transduction Pathway in Arabidopsis vii
10 Identification of Functional Modules through Clustering Biological Network Markov Cluster Algorithm Clustering Biological Network for Module Identification Discussion and Future Work A Computational Study on the Signal Transduction Pathway for Amino Acid and Peptide Transport in Yeast: Bridging the Gap between Highthroughput Data and Traditional Biology Introduction Methods Pathway Construction from High-Throughput Data Transcriptional Factor Binding Motif Identification Gene Expression Data and Clustering Results Construction of a Signal Transduction Pathway for Amino Acid and Peptide Transport Transcriptional Factor Binding Site Analysis Gene Expression Data Cluster Analysis Discussion Summary 126 References Appendix. 146 Vita 149 viii
11 List of Tables Table Page 1. The coverage comparison between protein-protein interaction data generated from yeast two-hybrid array (Uetz et al. 2000) and protein complex mass spectrometry identification method (Ho et al. 2001) The observed number and expected number of the protein-protein pairs belonging to the same or different subcellular localizations Yeast protein function categories retrieved from MIPS The 13 core derived from protein interaction data The 22-core derived from microarray data Number of unannotated genes with function predictions with respect to prediction confidence probabilities and index level genes whose predicted functions are with reliability score >= 0.9 and GO index level >= The prediction methods and the number of proteins with predicted functions The comparison of prediction results from five methods GO Indices of proteins in Figure The test MAPK pathways in yeast The putative genes involved in phospholipase D signaling transduction pathway in Arabidopsis The GO indices of proteins in cluster 4, the small nucleolar ribonucleoprotein complex. 100 ix
12 14. Transcription factors involved in the regulation of amino acid transport or amino acid synthesis The protein functions and subcellular localization information of the proteins in the constructed signal transduction pathways The number of transcriptional factor binding motifs found in the regulatory regions of amino acid and peptide transporters. 117 x
13 List of Figures Figure Page 1. The view of bioinformatics in the post-genomic era Three Cmd1p related protein complexes identified by mass spectrometry The distribution of protein-protein interactions whose partners have the same subcellular localizations The distribution of protein-protein interactions vs. function category Illustration of a graph with N = 5 nodes and n = 4 edges presenting simplified protein-protein interaction network , 2, 3 cores Identification of putative ortholog between S. cerevisiae and A. thaliana using reciprocal search A: Probabilities of pairs sharing the same levels of GO indices against Pearson correlation coefficient of microarray gene expression profiles. B: Normalized ratio for the percentage of gene pairs sharing the same levels of GO indices (p(s M r )), against the percentage of pairs sharing the same function for random pairs (p(s)) versus Pearson correlation coefficient of microarray gene expression profiles A: Probabilities of gene pairs at the same localization sharing the same levels of GO INDICES against Pearson correlation coefficient of microarray gene expression profiles. B. Comparison of probabilities of sharing the same function calculated from the gene pairs with the same localization (red lines) and from all the gene pairs without localization information considered (green lines).. 57 xi
14 10. Functional relationship in yeast protein-protein interaction data The probabilities of sharing the same function for interaction pairs that are coevolved (line with square), interaction pairs that are not co-evolved (line with up triangle) and overall interaction pairs (line with cross) Illustration of prediction method Illustration of protein function prediction from interaction network Illustration of global method for function prediction using simulated annealing technique Percentage of proteins in testing data whose functions can be successfully predicted versus the Reliability Score, with an interval of Sensitivity-specificity plot on the test set for the three prediction methods The distribution of proteins with predicted functions among function categories Global function prediction for yeast ORF YBR100W Prediction of protein interactions in Arabidopsis based on homolog hits in operon Coding high-throughput biological data into a functional linkage graph A working model of lipid second messenger signaling pathway in plant The refined architecture of the PLD related signaling transduction pathway in Arabidopsis The flow chart of network clustering Examples of the categories of discovered functional modules xii
15 25. The interaction graph of functional module: small nucleolar ribonucleoprotein complex A part of the model of regulation pathways of amino acid and peptide transporters built from the literature Our constructed model for the signal transduction pathway of amino acid and peptide transporters, where the different grayscale indicate different pathways Results from the clustering of microarray data from yeast cells grown under conditions of amino acid starvation and nitrogen depletion xiii
16 Chapter 1: Bioinformatics in the Post-Genomic Era 1.1 Introduction Bioinformatics is an emerging interdisciplinary field involving many areas, including information technology, biology, statistics, mathematics, and physics. Bioinformatics has been playing an increasingly important role in biology since the 1990 s. However, until now there is no standard definition of bioinformatics. One definition found at is as follows: The study of the application of computer and statistical techniques to the management of biological information. In genome projects, bioinformatics includes the development of methods to search databases quickly, to analyze DNA sequence information, and to predict protein sequence and structure from DNA sequence data. In fact, bioinformatics has a bigger scope than this definition. The availability of different types of highthroughput data has much expanded the role of bioinformatics from analyzing sequence information to extracting knowledge on functions and pathways, which involve various cellular processes of higher order, using more complicated data with more sophisticated data mining methods. Figure 1 shows an overall picture of bioinformatics in the postgenomic era. Biological data are no longer limited to isolated elements such as gene (genome), mrna (transcriptome), and protein (proteome). More extensive data include interactome and metabolome that describe the dynamic and global nature of biological systems. The repertoire of different types of data will continue to grow as new highthroughput technologies are developed. 1
17 Figure 1: The view of bioinformatics in the post-genomic era Bioinformatics plays an indispensable role in deciphering various experimental data. First, with more and more data accumulating, the databases must be appropriately stored and documented. Visualization tools are often needed to display and navigate the large data set. It is indisputable that publicly available databanks play a fundamental role in managing the data for the biological research community. Second, high-throughput data are very complicated: they are high dimensional and at large scale, usually at the genome scale. Due to heterogeneous nature of high-throughput data containing false positives and false negatives, advanced data modeling techniques and robust statistics are required in dealing with data-quality control, such as reliability assessment and validation. Third, although biological knowledge underlies multiple-source highthroughput data, deriving biological knowledge is very challenging given the complexity of biological system and the quality of high-throughput data. Innovative computational models and tools are in high demand to discover biological knowledge through an integrated analysis of high-throughput data from multiple sources such as genome 2
18 sequence data, gene-expression data, and protein-protein interaction data. Adaptability, evolution, redundancy, robustness, and emergence are all contributing to the complexities of biological systems. Complicated dynamic patterns of interactions and connections also account for the complexity and often only sophisticated bioinformatics analyses can uncover such patterns. Significant advances have been made on the computational techniques in analyzing complicated high-throughput data, and much useful biological knowledge has been derived using these data. In the future, it will probably be a routine in biological sciences to make systematic predictions and hypotheses based on bioinformatics analyses of the existing biological data first, and then to validate and extend the predictions and hypotheses through targeted new experiments. Such an approach can save tremendous amount of effort in experiments for biological discovery and is revolutionizing biological research. In this chapter, we will first give an overview of high-throughput data. Then we will introduce computational methods for protein function prediction and biological pathway inference. The last section is about computational analysis of biological networks, in particular, the architectural features and evolutionary origins. 1.2 High-Throughput Data in Genomics and Proteomics Since the early 1980 s the advent of DNA sequencing technologies has led an exponential growth in biological sequence data. As of May 2004, there have been 155 bacterial, 18 archaeal and 9 eukaryotic genome sequences completed with annotation, while the sequencing of more genomes is in progress (National Center for Biotechnology Information, 2004). A whole genomic sequence provides the information about all the proteins in the genome, i.e., the so-called proteome (Boguski and McIntosh, 2003). 3
19 Genomic sequences have drastically altered the landscape of biological research by opening a new avenue to study biological systems at large scales and paving the way for generating other high-throughput biological data. Genomic sequences provide a roadmap to measure molecular networks and their components at multiple levels including mrna transcript abundance, protein-protein interactions, protein-dna interactions and protein localization, post translational modifications, etc. Due to the availability of highthroughput measurement technologies, systems-biology studies became feasible to understand biological systems from sequence-level information to higher-level functions, which would involve various cellular processes. In this section, we will introduce various types of high-throughput data such as gene expression microarray data, proteinprotein interaction data, protein complex data, and growth rate data. Microarray gene expression data Microarray technology is a powerful tool to simultaneously measure expression of thousands of genes across the whole cells or tissues under different experimental conditions or over a time course (Howbrook et al. 2003). The multi-step, data-intensive nature of this technology has created an unprecedented informatics and analytical challenge (Anderle et al. 2003). A typical microarray experiment begins with good experimental design. After carrying out the biological experiment, the samples, such as tissues from patients or cells from in vitro cultures, are collected. Their RNAs are then extracted and labeled with different fluorescent dyes, and co-hybridized to a microarray. The hybridized microarray is scanned to acquire the fluorescent images. Image analysis is then performed to obtain the raw signal data for every spot. Poor quality data are filtered out and the remaining high quality data are normalized. Finally depending on the aim of 4
20 the study, one can infer statistical significance of differential expression, perform various exploratory data analyses, cluster or classify samples and carry out pathway analysis (Bono and Okazaki 2002, Conway et al. 2003). Physical interaction between two proteins Physical protein-protein interactions represent the functional proteomics data called interactome and different experimental methods may generate different types of protein-protein interactions, including binary interaction data and complex interaction data. Technologies such as yeast two hybrid, protein chip and phage display are used to detect the binary or pair-wise interactions. Yeast two-hybrid system has been the most widely used method for detecting protein-protein interactions, since its original description in 1989 (Fields and Song, 1989). Initially it was designed as a test to identify an interaction between two known proteins, and then it was rapidly developed as a screening assay to find partners for a protein in the high-throughput mode (Chien et al. 1991). The yeast two-hybrid technique carries out two fusions: a bait protein fused to the DNA-binding domain of a transcription factor and potential interacting partners fused to a transcriptional activation domain. An interaction between the bait and an interacting partner (prey) results in the formation of a functional transcription factor that induces the expression of a specific reporter gene, thereby, allowing such interactions to be detected. It should be noted that this approach forces the protein-protein interaction between the bait and prey to occur in nuclei, and some errors of measuring protein interactions may result from this restriction. Many protein-protein interaction data have been generated using two-hybrid system. In a proteome-wide study on yeast by Uetz et al. (2000), two designed 5
21 experiments were used, i.e., one with a low-throughput protein array and one with a highthroughput array. In the low-throughput array, 192 bait proteins were tested against a completed set of about 6000 prey proteins, a total of 281 binary interactions were identified. The high-throughput approach used the complete set of ~6000 yeast proteins as baits against the completed set of ~6000 prey proteins. This second approach identified 692 interacting protein pairs involving 817 unique proteins as either bait or prey proteins. An independent, large-scale study by Ito et al. (2001) was also conducted for the whole yeast proteome. This study detected 3278 proteins involved in 4589 putative proteinprotein interactions. The techniques of yeast two-hybrid mapping are now being applied to metazoan model systems. In the first comprehensive analysis of a metazoan interaction network (Giot et al. 2003), some 10,000 individual proteins from fruit fly were screened for twohybrid interactions, yielding ~20,000 candidate interactions, ~5000 of which were judged to be of high quality on the basis of local connectivity criteria. A large-scale protein interaction network was also mapped in C. elegans from high-throughput yeast two hybrid screens, where about 5500 interactions have been identified (Li et al. 2003). Protein complex data A typical approach to identify proteins in a protein complex is done by the separation of various proteins of an extract by gel electrophoresis followed by protein identification using mass spectrometric analysis of the protein gel spot. High throughput protein identification is achieved by MALDI (automated matrix-assisted laser desorption/ionization), which can provide a list of masses of the fragmented peptides 6
22 from proteins. Matching this list against a list of pre-calculated peptide masses from an appropriate protein sequence database can characterize the isolated proteins. Recently, Gavin et al. (2002) and Ho et al. (2002) took a new approach to screen protein-protein interaction in the proteome-wide scale. This method is particularly effective for identifying protein complexes that contain three or more components. First, the authors attached amino acid tags to hundreds of proteins, thus, creating bait proteins. Then they encoded these proteins into yeast cells, allowing the modified proteins to be expressed in the cells and to form physiological complexes with other proteins. Then, by using the tag, each bait protein was pulled out, and usually it fished out the entire complex. The proteins extracted with the tagged bait were identified using the MALDI method. This approach for characterization of protein complexes in a large scale was named TAP (tandem affinity purification). Notably, using the tags may perturb some protein interactions and result in errors. By using TAP, Gavin et al. have identified 1440 distinct proteins within 232 multiprotein complexes in yeast after processing 1739 genes as baits. 91% of these complexes contain at least one protein of unknown function. Ho et al. reported another application example for yeast using the same general approach, which they termed HMS-PCI (highthroughput mass spectrometric protein complex identification). Ho et al. constructed an initial set of 725 bait proteins, from which they identified 3617 associated proteins, covering about 25% of the yeast proteome. Genetic interaction data In addition to physical protein-protein interaction data, the genetic protein-protein interaction data in a large scale are also available now. In budding yeast Saccharomyces 7
23 cerevisiae, the observation that less than ~20% of the genes are essential for viability illustrates the capacity of genetic interaction network to buffer against genetic perturbation (Tong et al. 2001). Therefore, synthetic lethality can be used to identify the genetic interaction, where two single mutations that cause no evident phenotype individually are lethal in combination. Two genes form a genetic interaction if the combination of two mutations causes cell death. The large-scale identification of synthetic lethal interactions in budding yeast was carried out by screening 132 different query genes with the complete set of ~4700 viable yeast gene deletion mutants (Tong et al. 2004). A genetic interaction network containing ~1000 genes and 4000 interactions was mapped. Growth rate of gene deletion mutants It is now possible to comprehensively screen for any phenotype of interest that is caused by loss of individual gene function, either by direct gene disruption or by RNA interference (RNAi), in whole organisms or cultured cells. In the yeast S. cerevisiae each of the ~6000 possible individual gene deletion strains has been characterized (Giaever et al. 2002). The growth rates of gene deletion mutants in yeast were measured in the genome-scale, where 4706 homozygous diploid deletion strains that are viable were monitored in parallel in 9 different medium conditions (Steinmetz et al. 2002). The data were deposited in the public database at In the nematode worm, RNAi knockdown phenotypes have been assessed for over 85% of the 19,500 predicted genes, of which ~10% result in overt phenotypes (Kamath et al. 2003). 8
24 1.3 Protein Function Prediction An immediate challenge in the post-genomic era is to assign an appropriate biological function to each protein encoded by the genome. There are different types of the functional annotation. A particular gene product can be characterized with respect to its molecular function at the biochemical level (e.g. cyclase or kinase, whose annotation is often more related to sequence similarity and protein structure) or the biological process which it contributes to (e.g. pyrimidine metabolism or signal transduction, which is often revealed in the high-throughput data of protein interaction and gene-expression profiles). For many genes identified in a typical genome, their functions are not known. For example, only one-third of all 6200 predicted yeast genes were functionally characterized by genetic or biochemical techniques at the time when the completed sequence of yeast first became available in 1996 (Goffeau et al. 1996). Even considering the additional 600 genes that could be identified based on homologs of known functions in other organisms, it left about 3500 genes with unknown functions (Kumar and Snyder 2001). At this time, there are still about 2800 genes with unknown function. Many computational approaches for protein function assignments have been developed. The classical approach to infer function is based on sequence similarity, using sequence alignment tools such as FASTA and PSI-BLAST. In the human genome, about 60% of the predicted proteins were functionally annotated using this sequence-comparison method (Venter, et al. 2001). With an increasing number of completed genomes becoming available for comparative studies, new computational methods of protein function prediction (such as gene context (Huynen et al. 2000), Rosetta-Stone method (Marcotte et al. 1999), 9
25 phylogenetic profiling method (Pellegrini et al. 1999) have been developed. The underlying hypothesis of these methods is that proteins evolving in a correlated fashion are functionally linked, i.e., belonging to the same physical complex, sharing the same pathway, or performing as an enzyme and its regulator. Gene context represents the positional association of genes, such as operon in prokaryotic genomes, which can be used to detect the functional association of proteins. The Rosetta-Stone method is applied to find two proteins A and B in one organism that are expressed as one fused protein in some other species. Because proteins A and B typically have no significant sequence similarity, this type of functional linkage may not be detected by a simple homology search. Phylogenetic profiling describes the pattern of presence or absence of a particular protein across a set of genomes, and uses such information to predict protein function. When functioning, proteins rarely act in an isolated manner. Functionally related proteins often interact with each other. Hence, one possible approach to elucidate the function of an unknown protein is to investigate the functions of its interacting proteins. For this purpose, one can use the protein-protein interaction information to assign putative function for a hypothetical protein based on the guilt by association rule. For example, if protein X (uncharacterized) is found to interact with proteins Y and Z, and both Y and Z are components of a DNA transcription processing machinery, then it is likely that protein X would also be involved in this process, perhaps being part of the complex containing Y and Z. Using the above approach, high-throughput protein-protein interaction data can provide a good coverage for many novel proteins whose functions cannot be assigned based on sequence comparison. Schwikowski et al. (2000) collected 2709 published protein-protein interactions in yeast S. cerevisiae and clustered them 10
26 based on their cellular roles and subcellular localizations annotated in the Yeast Proteome Database (YPD at They compiled a list of about 370 proteins with unknown functions that interact with at least one protein with known function. Among 29 of them, each has two or more interacting partners with the common function. To assign protein function by using protein-protein interaction data in a more systematic and rigorous way, a mathematical model based on the Markov random fields has been developed (Deng et al. 2002, 2003, Letovsky and Kasif 2003). The MAGIC (Multisource Association of Genes by Integration of Clusters) approach to combine heterogeneous data for function assignment has been applied in yeast by Troyanskaya et al. (2003). 1.4 Biological Pathway Inference The study of biological pathways is important and challenging. A biological pathway can be regarded as a system of proteins that work together. For example, a pathway could include a chain of protein interactions for signaling, from protein A to protein B, from protein B to protein C, and so on. A biological pathway can be a signal transduction pathway, metabolic pathway or gene regulation pathway. Biological pathways are complex and synergistic systems. There are rich interaction networks among the constituents and these interactions often have nonlinear characteristics. Some interactions are transient, which are induced in response to a specific cellular event. Traditional biological pathways studies have been conducted in ad hoc manner and on a small scale. High-throughput biological data provide us a unique opportunity to construct biological pathways in silico. Thus, systematically and automatically characterizing 11
27 biological pathways at the genome scale using available high-throughput data is one of the most important and challenging tasks in the post genomic era. To increase our understanding of cellular processes from genomic information, pathway databases such as KEGG (Kanehisa 1996), EcoCyc (Karp 1999), and Kinase pathway database (Koike et al. 2003) have been created based on the accumulated experimental evidences and human annotations. In those databases, the complex cellular properties such as metabolism, signal transduction and gene regulation are stored as the corresponding networks of interacting molecules and they are represented in computerized forms often as graphical pathway diagrams. The data and knowledge accumulated over many years in traditional biology are often well organized in those databases, at least for metabolic pathways. With the availability of the sequences of entire genomes, an ontology for the comprehensive representation of cellular events can be defined that enables the integration of fragmented or incomplete pathway information and supports manipulation and incorporation of the stored data. Based on this ontology, Patika (Pathway Analysis Tool for Integration and Knowledge Acquisition) (Demir et al. 2002) was developed to visualize and manipulate networks of cellular events. This tool featured automated pathway layout, functional computation support, advanced querying and a user-friendly graphical interface. Grosu P. et al. (2002) have developed a tool to visualize geneexpression data on metabolic pathways and to evaluate which metabolic pathways were most affected by transcriptional changes in whole-genome expression experiments. Using the Fisher Exact Test, the method scored biochemical pathways according to the probability that genes in a pathway would be significantly altered in a given experiment 12
28 by chance alone. Based on protein-interaction maps generated from large-scale twohybrid screens and expression profiles from DNA microarrays, Steffen et al. (2002) developed a computational approach for generating static models of signal transduction networks. It was shown that MAP Kinase signaling networks in Saccharomyces cerevisiae were accurately reconstructed. Based on the view of gene systems as a logical network of nodes that influence each other's expression levels, researchers have attempted to construct a precise gene regulation network from the expression data generated by microarray technique, which reveals the dynamic nature of gene expression profile of a living system. Towards the aim to infer causal connections between genes, i.e. which gene is regulating which other gene and how, several approaches, from discrete Boolean networks to continuous linear and non-linear models, were developed. A Boolean network consists of n nodes, each representing a gene, which can either be repressed or expressed (the node has state 0 or 1, respectively) (Akutsu et al. 1999, Liang et al. 1998). The dynamics of the network is determined by a list of n (Boolean) functions, each receiving inputs from k specified nodes. Every node has its own specific mathematical function, which can determine its next state from the current states of all the input nodes. Chen et al. (1999), following the work of Reinitz and Sharp (1995), modeled genetic networks as a set of nonlinear differential equations. Their approaches search for parameters that indicate the rates of change of a certain gene s expression with discrete time steps. Imoto et al. (2002) proposed a method for constructing gene-regulation networks from gene-expression data using Bayesian networks, where the nonparametric regression was used to capture nonlinear relationships between genes. Furthermore, Dynamic Bayesian networks 13
29 (DBNs) were applied to infer gene networks from time series microarray data (Kim et al. 2003). 1.5 Biological Network Analysis: Architectural Features and Evolutional Origins Biological interactions at many different levels from molecular interactions to the relationship of organisms in a population or ecosystem can be modeled as networks. In the interaction network, a set of nodes are defined to represent metabolites, genes or gene products and a set of directed or undirected edges are defined to represent interactions among them. Various types of interaction networks such as metabolic networks, transcriptional control networks, signal transduction networks emerge from the complex and dynamic interactions formed by thousands of molecules in a living cell. A key issue of postgenomic biology is to map out, understand and model the topological and dynamic features of the various networks that control the behavior of the cell. The development of high-throughput technologies allows for simultaneous identification and characterization of the status of a cell s components at system levels such as when and how these molecules interact each other. Masses of high-throughput data were generated, which provides an overview of the topological feature of biological organization and helps to understand the design principles of biological networks. Inherent in various interaction networks is the knowledge of the design principles, which are behind the complexity of living cells and organisms. An important task for bioinformatics is to discover and understand these design principles. Towards this end, recent analyses on global topological features of interaction networks may have some 14
30 relevance. Complex networks can be modeled as random networks or scale-free networks. Based on the classical random network theory introduced by Erdos and Renyi (1960), each pair of nodes in the network is connected randomly. Thus, it leads to a statistically homogeneous network where most nodes have the same number of links <k> in average despite the fundamental randomness of the model. The probability of finding a highly connected node decays exponentially (P (k) e -k for k > <k>). On the other hand, empirical studies on the structure of the world-wide Web (Huberman and Adamic 1999), social networks (Wasseman and Faust 1994), business networks (Wasseman and Faust 1994) showed that these systems belong to scale-free networks, for which P (k) follows a power-law ( P (k) k -λ ). Scale-free networks are extremely heterogeneous, where a few highly connected nodes play a central role in mediating interactions among numerous less connected nodes. Several recent publications indicate that protein protein interactions in diverse eukaryotic species have the features of a scale-free network (Jeong et al. 2001, Giot et al. 2003, Li et al. 2003). Further examples of scale-free organization at the biomolecular level include genetic regulatory networks (Agrawal 2002), protein domain interaction network (Wuchty 2001), and metabolic networks (Jeong et al. 2000). Heterogeneities in the scale-free network are the inevitable consequence of selforganization due to two ingredients of the network development: growth and preferential attachment: (1) networks expand continuously by the addition of new vertices, and (2) new vertices attach preferentially to sites that are already well connected (Barabasi and Albert 1999). Such a property is also thought to be the characterization of the evolution of biological systems, that is, the mechanism of growth and aggregation of different constituents may result in complex modules in organisms (Barabasi and Oltvai 2004). In 15
31 general, the module refers to a group of physically or functionally linked molecules (nodes) that work together to achieve a distinct function (Bray 2003). The function and structure of network modules are profoundly shaped by constraints of evolution, since modern organisms have an unbroken chain of ancestors retrieving back to the origin of life. The design principles of the underlying function and structure indicate that modules are robust and flexible (Barkai and Leibler 1997, Li et al. 2004). A module is insensitive to many environmental and genetic perturbations and it can also be modified over many generations to alter the function of a module in such a way that allows the organism to adapt to new challenges. Furthermore, biology and advanced engineering yield remarkable similarities in the higher-level organization, where the robustness and fragility features of complex systems are both shared and necessary (Csete and Doyle 2002). Biological networks are abstract representations of biological systems, which capture many of essential characteristics of biological systems. The most basic feature of any network is its architecture, which places boundaries on how it acts and how it has been formed. It is therefore an attractive notion that by taking a top-down view starting from network s architecture to organism-specific modules and molecules, we will gain a better perspective of how biological networks function. Several methods have recently been introduced to identify a set of biologically relevant functional modules in metabolic pathways (Ravasz et al. 2002) and protein networks (Rives and Galitski 2003). The automated and systematic identification of the groups of molecules of various sizes that carry out the specific cellular functions is a key issue in network biology, and we will witness much process in the near future. 16
32 1.6 About This Dissertation As we are moving into the post genome-sequencing era, various high-throughput experimental techniques have been developed to characterize biological systems at the genome scale. The high-throughput data are becoming fundamentally important resources for discovering new biological knowledge in life sciences. Unlike the traditional approaches, which generally study a gene/protein in isolation (i.e., one at a time) based on a specific hypothesis, the newly developed high-throughput techniques provide a global view of all the genes in a genome in a relatively fast and cost-effective manner. Thus, a principle challenge in life science is to understand the organization and functional dynamics of biological systems. To address this challenge, the central theme of this dissertation is to discover biological knowledge on protein function, pathway and module through mining multiple sources of high-throughput data. Although high-throughput heterogeneous data provide a global picture of biological systems about the underlying mechanisms, the details are often noisy; hence the integration of data from assays that characterize cellular systems from different aspects (i.e. gene expression and protein-protein interactions) can lead to the comprehensive and coherent discoveries of biological insights. In this dissertation, we developed a Bayesian probability framework to predict function for unannotated proteins in yeast through integrating protein binary interaction data, protein complex data and microarray data. We also extended the computational framework to infer biological pathways in an automated and systematic fashion. Besides the bottom-up approaches moving from protein function to pathway, we also applied top-down approaches to model the cellular network, that is, we started from the architecture of cellular network to identify the functional modules. 17
33 It is recognized that thousands of components of a living cell are dynamically interconnected, so that the cell s fundamental properties are encoded into dynamic and complex intracellular networks such as protein interaction network, regulatory or coexpression network and metabolic network. To understand the organization and dynamic nature of networks, it is possible to treat substructures of networks as functional units that perform identified tasks, because cellular processes are often determined by functional modules such as interaction cascades, molecular complexes and signaling pathways (Hartwell et al. 1999). In our studies, the k-core decomposition of protein interaction networks and microarray gene co-expression networks provides strong support for modularity principles of networks structure and function. Dynamic functional modules and protein complexes have been identified by clustering the network constructed from multiple sources of high-throughput data, shedding insights into understanding the organization and dynamics of a living cell. Nevertheless, it is clear that we need a range of computational tools to gleaning biological insights from various types of data. In this dissertation, we also proposed a consensus approach to model biological pathways by combining different computational tools and integrating multiple sources of high-throughput data. In the future, we expect to see an explosion in the quantity and diversity of high-throughput data. It is vital to develop methodologies and innovative tools in bioinformatics that allow researchers to explore different computational models and rapidly apply them to diverse data sets. The remaining part of the dissertation is organized as follows. In Chapter 2 we use computational methods to access protein-protein interaction data and apply the K-core 18
34 algorithm to analyze protein-protein interaction data and microarray gene expression data. Chapter 3 describes the Bayesian probability approach developed for protein function prediction in yeast through integrating multiple sources of high-throughput data. In Chapter 4 we extend the developed computational framework to infer biological pathway and applied network clustering to identify functional modules. In Chapter 5 we demonstrate how a consensus approach was used to model amino acid and dipeptide transporter regulation pathway in yeast. Chapter 6 is the summary of this dissertation. 19
35 Chapter 2: Computational Analysis of Protein Interaction Data and Microarray Gene Expression Data 2.1 Introduction High-throughput data are generated from technology-driven experiments, which provide rich information with the ever-increasing volume. However, the information explosion does not mean biological knowledge explosion. Translating high-throughput data into significant biological knowledge about the underlying mechanisms is challenging. Information-rich high-throughput data are heterogeneous in nature, with high dimension, noisy and incomplete, and may contain outliers that are misleading false positives and false negatives. For example, the yeast two-hybrid assay may not detect some protein-protein interactions involving post-translational modifications while mass spectrometry may fail to uncover transient or weak interactions. Another example is the statistical relationship of expression profiles between genes related by function, which may be lost due to measurement errors in microarray experiments. Therefore, using a single source of high-throughput data may not provide accurate biological information and knowledge. Only through an intelligent information integration or fusion of multiple sources of high-throughput data, can biological hypotheses be formulated with increased levels of confidence. For this purpose, we developed a computational framework to discover biological knowledge through integrating multiple sources of high-throughput data. To perform the data integration, it is a crucial step to understand the prior knowledge about high-throughput data such as the biological principles that couple with high-throughput measurement techniques. Moreover, we need to know the prior baseline 20
36 information about data quality and confidence. We have used computational and statistical methods to measure data quality and confidence in this chapter. Cellular networks are organized and function in a modular fashion. Conceptually, modules refer to groups of genes or proteins that perform a discrete function (Hartwell et al. 1999). The concept of modularity assumes that cellular functionality can be partitioned into a collection of modules. Each module is a discrete entity of several elementary components and performs an identifiable specific task, separable from the functions of other modules (Hartwell et al. 1999, Hasty et al. 2001, Shen-Orr et al. 2002). Spatially and chemically isolated molecular machines or protein complexes (such as ribosomes and flagella) are prominent examples of such functional units. Systematic high-throughput data (e.g. protein interaction, gene expression profile) acquisition provides an opportunity to unravel the organization and characterization of these modules. Proteins interact with preferred partners to form a biological module serving a specific biological process. Clustering transcript expression profiles can be used to infer system-level function by identifying the gene components of a module. An obstacle to elucidating the modular structure of interaction network is the lack of a precise definition of what constitutes a module in the context. To address this challenge, we used a concept in graph theory, K-core, to mathematically represent the modularity of network and applied it to detect the functional modules from protein interaction data and microarray data. The key idea of our analysis is to identify highly connected subgraphs that have more interactions within themselves and fewer with the rest of graphs. Our results provide strong support for the network modularity principles proposed by Hartwell et al. (1999) 21
37 2.2. Data Sources Protein-protein binary interaction data A protein-protein interaction network can be viewed as a weighted non-directed graph, Gp (D) = (Vp, Ep). The vertex set Vp = {d i d i D} and the edge set Ep = {(d i, d j ) for d i, d j D and i j}. Each vertex represents a protein and each edge represents a measured interaction between the two connected proteins. The protein-protein interaction data generated from yeast two-hybrid assay are published in the papers of Uetz et al. (2000) and Ito et al. (2001). There are a total of 5075 unique interactions among 3567 proteins. We combined the yeast two-hybrid data with the protein-protein interaction data in the MIPS database ( In total, 6516 unique binary interactions among 3989 proteins were used in this study. Protein complexes A protein complex is typically identified by enrichment of all complexes in a cell extract using a chromatographic technique that captures one protein and its associated proteins, and the proteins in the complex are identified by subsequent mass spectrometric identification. The protein complexes data are obtained from Gavin et al. (2002) and Ho et al. (2002). The former used TAP (tandem affinity purification), while the latter used HMS-PCI (high-throughput mass spectrometric protein complex identification) for protein complex identification. Since in the protein complex it is unclear which proteins are in physical contacts with direct interactions, constructing a specific interaction network to include all complexes in a cell extract is not a straightforward task. To simplify the issue, we assume a complete connected graph for the complex, without 22
38 specifying the interaction intensity of each edge, i.e., we assigned binary interactions between any two proteins participating in a complex. Thus in general, if there are n proteins in a protein complex, we add n*(n-1)/2 binary interactions. This yields 49,313 edges to the interaction network. Microarray gene expression data Analysis of microarray gene expression data is currently one of the most active research areas in genomics. Clustering gene expression measurements effectively organizes data into statistically similar groups (clusters) and efficiently represents statistically similar data in each group. The data clustering process is solely statistics based and thus involves only unsupervised learning that does not require any prior domain knowledge. The statistical data organization/representation by clusters/cluster-centers can be used for categorizing or characterizing new measurements in biological processes. The geneexpress profiles of microarray data were from Gasch et al. (2000), which included 174 experimental conditions for all the genes in yeast. A Pearson correlation coefficient was calculated for each possible gene pairs to quantify the correlation between them. Thus, an interaction network measure by gene expression correlation can be constructed, where a node represents a gene and an edge between two nodes represents one interaction given that the correlation coefficient is greater than a threshold value Assessment of Protein-Protein Interaction Data Protein-protein interactions are at the heart of biological activities (Rudert et al. 2000, Eisenberg et al. 2000). They play a critical role in most cellular processes and form the basis of biological mechanisms such as DNA replication and transcription, enzymemediated metabolism, signal transduction, and cell cycle control (Wang 2003, Kone 23
39 2000). Protein-protein interactions give the information about the biological context in which an individual protein plays its cellular role. Knowing the interactions that an uncharacterized protein has can provide a clue about its biological function. To fully understand a biological machinery of a cell or a biological pathway, it is also essential to know how the involved proteins directly interact with each other. A general strategy for high-throughput experimental technologies in detecting protein-protein interactions is to be selective enough to minimize the report of false interactions yet sensitive enough to maximize the detection of all biologically true interactions. However, currently this goal is far from being achieved. In fact, one major issue with the high-throughput protein-protein interaction data is the high error rate, compared with the data generated from traditional low-throughput methods. To use highthroughput protein-protein interaction data for biological inference effectively, it is essential to evaluate the coverage and reliability of the data. In this section, we will discuss the origin of errors and provide examples to show the characteristics of the errors. We will also address how to assess the reliability of protein-protein interaction data using computational methods False Negatives and False Positives The difference between actual biological protein-protein interactions and measured protein-protein interactions may arise from at least three factors. (1) The dynamic nature of protein interaction map. Protein expressions and interaction patterns are changing under different biological conditions. Proteins interact with one another with a wide-range of affinities and time scales. Consequently, detection of such interactions is often at the margin of observation and each measurement of protein-protein interactions 24
40 can only capture a snapshot of the dynamic protein interaction map under a specific condition. (2) The limitation of the technologies. As we know, any high-throughput protein-protein interaction technology creates a substantial disruption of normal cellular function, which can make the protein interaction pattern deviate from the one under the native biological condition. For example, mass spectrometry might fail to uncover transient or weak interactions while yeast two-hybrid assay might not detect interactions that are dependent on post-translational modifications (PTMs) or interactions having the multi-body effects. The multi-body effects mean that the interaction between two proteins depends on the presence of the other components in the complex, since the two proteins alone cannot form a stable complex. (3) The errors during the measurement. In this case, the technology is capable of identifying an interaction correctly. But due to operation problems during the experiment, the interaction is not identified correctly. These three factors make the protein-protein interaction maps different with the use of different technologies and in different labs using the same technology. Here we focus on the second and the third factors, i.e., errors caused by the technology drawbacks and measurements, including both false negatives and false positives. False negatives are the biological interactions that are not detected by the experiments. For example, in yeast two-hybrid assay, which relies on the transcriptional activation of the reporter gene, the incorrect folding, inappropriate subcellular localization, and absence of certain necessary PTMs can cause the false negatives. For protein complex mass spectrometry identification methods, it is also likely to generate the false negatives. For example, it may not detect some transient interactions and it may miss some complexes that are not presented under the given experimental conditions. 25
41 Moreover, the loosely associated components in a complex may be washed off during the purification process. False positives are generated by experiments that are not true biological interactions. In two-hybrid assay, false positives arise when the expression of the reporter gene occurs under conditions that are not dependent on bait/prey protein-protein interactions. For example, bait proteins may activate the transcription of reporter genes above a threshold by themselves in the actual physiological conditions. Two-hybrid assay can also produce some non-specific interactions that are not biologically relevant, especially between proteins normally existing in different subcellular location or different tissues. Large-scale protein complex identification approaches can also generate false positives. When the bait protein is used to fish out the entire complex components, some other unrelated proteins (e.g., proteins in different compartments of a cell) may attach with the complex and be pulled out together. Even within a true complex, it is challenging to distinguish the true binary interactions between the component proteins. If we assign binary interactions between all proteins in a complex, it can generate false positives Overlap and Complementation Analysis of Protein-Protein Interaction Data Up to date, there are 6516 publicly available binary interactions identified from yeast two-hybrid experiments in high-throughput assays or low-throughput assays. In addition, 49,094 binary interactions can be assigned for the protein complexes identified by TAP (tandem affinity purification) and HMS-PCI (high-throughput mass spectrometric protein complex identification) methods, assuming any two components in a protein complex interact with each other. However, our analysis shows that strikingly 26
42 few interactions (55 interactions) are commonly represented in yeast two-hybrid, HAP and HMS-PCI. There are only 1920 interactions supported by at least two out of the three technologies. Unexpectedly, not only the data produced by different technologies do not overlap significantly, the data produced at different labs using the same technology differ substantially. For yeast two-hybrid data, only 141 interactions were common in both data sets from Uetz et al. and Ito et al. Interestingly, neither of those two studies identified more than 15% of previous published interactions (Xenarios et al. 2002), suggesting that coverage of protein interaction map is very sparse and the map in a simple organism like yeast may be more complex than expected. The approaches taken by Gavin et al. and Ho. et al. are clearly powerful, but they also have limitations. Both groups found a significant number of false-positive interactions with failure to identify many known associations. Gavin et al. estimated that the probability of detecting the same protein in two different purifications from the same entry point is about 70% by purifying 13 large complexes at least twice. We also studied the overlap and coverage using the datasets from Uetz et al. (yeast two-hybrid) and Ho et al. (mass spectrometric protein complex identification) and compared the binary interactions involved (see Table 1). We found that the percentage of the common interactions detected by both yeast two-hybrid assay and mass spectrometric protein complex identification is only 4.4% of overall interactions detected by yeast twohybrid assay and mass spectrometric protein complex. In fact, not only the coverage of different techniques is different, the protein-protein interaction data generated by each technique have unique characteristics. 27
43 Table 1: the coverage comparison between protein-protein interaction data generated from yeast two-hybrid array (Uetz et al. 2000) and protein complex mass spectrometry identification method (Ho et al. 2001). The known interactions come from 2301 annotated binary protein-protein interactions maintained at MIPS (Mewes et al. 2000), which we used as reference dataset. Experimental method Baits having interaction Identified interactions Known interactions Yeast two-hybrid assay (4.5%) Protein complexes mass spectrometry identification (4.5%) Mering et al. (2002) comparatively assessed the high-throughput protein-protein data generated from different sources in yeast such as yeast two-hybrid assay, mass spectrometry of purified complexes, correlated mrna expression, genetic interactions, and in silico predictions through genome analysis. They found that data generated from different methods have different distributions with respect to functional categories of interacting proteins, thus indicating that those methods have specific biases. The lack of overlap between datasets demonstrates that the current data is far from saturating, which suggests that different high-throughput technologies may complement each other. Therefore, the combination of protein-protein interaction data from different resources will substantially expand the coverage of protein-protein interaction network. The described systematic protein-protein interaction assay methods clearly show that single screens rarely capture all proteins capable of interacting with the given bait. In the yeast two-hybrid array, even multiple screens with different two-hybrid variants usually produce only partial overlaps. Thus, to identify as many true interactions as 28
44 possible, different assay technologies are needed to complement each other. To illustrate the complementarily between the two-hybrid and mass spectrometry methods, we considers two examples. The first example is the interactions with Rrn10p (YBL025W), RNA polymerase Ι-specific transcription initiation factor. In Ho et al. s dataset there was no detected protein complexes when using Rrn10p as the bait protein. Yeast two-hybrid assay detected the interaction between Rrn10p and Rrn9p, which was also validated by experiments. RRN10 mrna abundance is 0.7 copy per cell based on the genome-wide analysis of mrna abundance in yeast while the average number is 2.8 copies per cell (Holstege et al. 1998). Thus, it is likely that the protein complex may not be formed due to the low abundance of the bait protein. It is also possible that this pair of proteins has only a transient interaction rather than forming a stable complex. On the other hand, yeast two hybrid is independent of the protein concentration level and capable of detecting the transient and weak interactions. A converse example is Cmd1p, a small ubiquitous Ca 2+ -binding protein regulating a wide variety of proteins and processes in all eukaryotes (Cyert, 2001). For this protein, yeast two hybrid cannot detect the interactions while mass spectrometry using different baits can discover several complementary protein complexes (see Fig. 2). In response to a Ca 2+ signal, Cmd1p binds Ca 2+ and consequently undergoes a conformational change that allows it to bind and activate a host of target proteins. Probably due to the absence of native physiological condition, yeast two-hybrid assay cannot detect such a proteinprotein interaction. 29
45 Figure 2: Three Cmd1p related protein complexes identified by mass spectrometry. The annotated Cmd1p interacting partners, shown in dark color, come from known experimental results reviewed previously (Cyert et al 2001) Reliability Currently there is no systematic statistical method developed to assess the confidence level of an interaction accurately. However, several heuristic approaches have been used for this purpose. These methods can provide some side evidence for an interaction, and as a result, increase the confidence level of interactions measured from high-throughput techniques. Reliability of a reported interaction is increased by the observations of the same interaction using different methods. For example, if an interaction is detected by two distinct experiments, the joint observations enhance the confidence level for this particular interaction. Large-scale two-hybrid screens can identify some classes of systematic false positives using multiple, independent screen under standardized 30
46 conditions. For example, some false positives related to particular proteins tend to appear repeatedly in screens with unrelated baits. In a yeast study (Ito et al. 2001), if prey proteins are selected with more than three unrelated bait proteins from a pool of 100 bait proteins, they will be discarded. The array screens by Uetz et al. used reproducibility to estimate the reliability by testing each individual two-hybrid pair twice in a highly standardized and parallel fashion. False positives are often generated by mutations in the baits, prey plasmids, or reporter genes. When screens are done in duplicate, such mutations are unlikely to occur simultaneously. Literature is a valuable resource to validate the protein-protein interaction generated by high-throughput techniques. The idea is that if two protein names appear in the same article, they have a better chance to interact with each other than random. Such information about interacting proteins, albeit unreliable, can validate protein-protein interactions or at least provide clues for judging an interaction. Based on the literature mining method, a recent work created gene-to-gene co-citation network for 13,712 named human genes from analyzing over 10 million MEDLINE records (Jenssen et al. 2001). Computational approaches can also be used to assess the reliability of the observations of high-throughput protein-protein interactions. To verify protein-protein interaction data, Deane et al. (2002) developed two methods, i.e., expression profile reliability index and paralogous verification method (PVM). By comparing gene expression profiles of the proteins involved in an interaction, expression profile reliability index estimates the likelihood of the interaction to be biologically meaningful. The idea is that proteins with higher correlated expression pattern are more likely to interact with 31
47 each other. Paralogous verification method is based on the observation that if two proteins are paralogs, the proteins that they interact with tend to be paralogs as well. PVM evaluated 8000 pairwise protein interactions in yeast and 3003 interactions were confidently identified. 2.4 Relationship between Protein-Protein Interaction Data and Other Biological Data Inherent in the growing collections of protein function and subcellular localization data, protein structure, gene expression data and protein-protein interaction data is the internal relationships between different aspects of the same set of genes/functions. These relationships provide a basis for cross-validating the data and offering more information than what a single source of data can achieve. For example, the protein functional role and subcellular localization information can be used to validate protein-protein interaction data. Given relatively low reliability of these computational relationships, one can use them to increase the confidence of a protein-protein interaction, but it is hard to reject a protein-protein interaction just because its pattern deviates from the general relationships. The correlation study between protein-protein interaction and gene expression can be used to formulate more meaningful biological hypotheses by improving hypotheses generated from either approach individually. Protein structure provides rich information about how proteins interact with each other at the atomic details. Therefore, the integration analysis of biological data from different sources offers a deepened knowledge exploration for understanding cellular mechanisms. In this 32
48 section, we will discuss the relationship between protein-protein interaction data and other types of data, including subcellular location and function category Subcellular Localization The subcellular distribution of proteins within a proteome is useful and important to a global understanding of the molecular mechanisms of a cell. Protein localization can be seen as an indicator of its function. Localization data can be used as a means of evaluating protein information inferred from other resources. Furthermore, the subcellular localization of a protein often reveals its activity mechanism. In a physical protein-protein interaction, the two proteins involved should be localized at the same subcellular compartment. If an interaction between two proteins that are known to have the same subcellular localization, the confidence level for the interaction increases. Therefore, the study of relationship between protein-protein interactions and the partners subcellular localizations can provide an evaluation method for validating protein-protein interaction data generated from high-throughput experiments. On the other hand, a protein may have several subcellular localizations. For example, a translocalization of NK-κB can move the protein from cytoplasm to nuclei (Shimohashi et al. 2000). In this case, we can find pairs of interacting proteins have different subcellular localizations, when the alternative subcellular localizations of the proteins are not recorded in the database. We assembled 2301 annotated binary protein-protein interactions maintained at MIPS, a manually curated database and took them as the trusted true interactions. We also derived protein subcellular localization information from MIPS (Mewes et al. 2000). In yeast 2358 ORFs have known subcellular localizations, among which 169 ORFs can 33
49 be localized in more than one subcellular compartment. For all 2301 interactions, the localizations of both partners in each interaction are known. We found that there are 2124 interactions (92%) whose partners have the same subcellular localizations. The data set is biased towards particular cellular localizations of interacting proteins (Fig 3), for example, the number of interactions involving plasma membrane proteins is very small, showing the technological limitation in detecting such interactions. Table 2 shows a comparison between the observed number of protein-protein interaction pairs for a given combination of subcellular localizations and the expected number calculated from random distribution of proteins involved in a particular compartment. Based on the assumption that two proteins involved in an interaction have independent probability distribution of subcellular localization, the expected number of interactions between proteins in X subcellular localization and proteins in Y subcellular localization, PI(X, Y), is calculated: PI(X, Y) = N P X P y (1) where N is the total number of interactions, P X is the probability of proteins belonging to X subcellular localization and Py is the probability of proteins belonging to Y subcellular localization. P X and P Y are calculated from 2358 yeast ORFs with known subcellular localizations. Clearly the observed number of protein-protein interactions belonging to the same subcellular localization is much greater than expected. Conversely the observed number of protein-protein interactions belonging to different subcellular localizations is much less than expected, except for the interactions between nuclear proteins and proteins in cell organisms such as ER, golgi, transport vesicles, peroxisome, endosome, vacuole, microsomes, and lipid particles. 34
50 Figure 3: The distribution of protein-protein interactions whose partners have the same subcellular localizations. The abbreviations of localizations are: N--nucleus; P-- cytoplasm; K--cytoskeleton; M--plasma membrane; T--mitochondria, O--cell organelles (ER, golgi, transport vesicles, peroxisome, endosome, vacuole, microsomes, and lipid particles). 35
51 Table 2: The observed number and expected number of the protein-protein pairs belonging to the same or different subcellular localizations. Ob. means the observed number and Pr. means the expected number calculated from the probability distribution of proteins belonging to a specific subcellular localization. The notations for subcellular localization are: N--nucleus; P--cytoplasm; K--cytoskeleton; M--plasma membrane; T-- mitochondria, and O-- cell organelles (ER, golgi, transport vesicles, peroxisome, endosome, vacuole, microsomes, and lipid particles). Sub. K M N O P T Loc. Ob. Pr. Ob. Pr. Ob. Pr. Ob. Pr. Ob. Pr. Ob. Pr. K M N O P T
52 This may be because proteins can move between the two compartments (protein translocalization), and some nuclear proteins require modification and sorting in those cell organisms Function Catalogue A protein interaction is often associated with a particular biological pathway. Hence, it is not surprising to see a pair of interacting proteins to have the same cellular role. To further assess the relationship between the cellular roles of a pair of interacting proteins, we used 3936 yeast ORFs cellular functions that have been hierarchically classified at MIPS. We clustered those cellular functions into 11 broad functional categories using the same classification method proposed by Mering et al. (2002) as shown in Table 3. For 2301 well-annotated protein-protein interactions at MIPS, each ORF can be assigned into a known function category and both proteins participating in an interaction belong to the same function category for all the cases. It is likely that any interaction involving two proteins of different cellular roles was removed from this data set since the interaction is considered unreliable. Figure 4 showed the distribution of protein-protein interactions for different function categories, indicating that the distribution is biased. However, the biased distribution may be caused by the small size of dataset, which is far from saturating currently. 2.5 K-core Application in Detection of Biological Modules Connectivity Distribution In the graph view of interaction network, each node represents one protein and each edge represents one interaction. Practically, graphs are usually represented as a set of dots. 37
53 Figure 4: The distribution of protein-protein interactions vs. function category. 38
54 Table 3: Yeast protein function categories retrieved from MIPS. Category A B C D E F G M O P T Description Transport and sensing Transcription control Cellular fate/organization Genome maintenance Energy metabolism Protein fate (folding, modification, and destination) Amino acid metabolism All the other metabolism categories Cellular transport and transport control Protein synthesis Transcription 39
55 Figure 5. Illustration of a graph with N = 5 nodes and n = 4 edges presenting a simplified protein-protein interaction network. The set of nodes is V= {1, 2, 3, 4, 5} representing proteins and the edge set is E = {{1, 2}, {1, 5}, {2, 3}, {2, 5}} representing interactions. Each corresponding to a node. Two of these dots are joined by a line if the corresponding nodes are connected by an edge (Figure 5). Not all nodes in a network have the same number of edges (node degree). The spread of node degree is characterized by a distribution function P(k), which gives the probability for a node to have k edges. A network is connected if, for any pair of nodes, there exists a path between them (where a path is a list of directly connected nodes). If there are two nodes that do not have a path between them, the network is partially connected, or not fully connected K-core Algorithm Biological molecular interactions often form a heterogeneous network with a certain substructures where the proteins are densely connected to each other. In the interaction graph, a k-core is a subgraph, which forms a cohesive and stable interaction network. The 40
 induced by the set W is a k-core or a core of order k iff ν W: deg H (ν) k and H k is the maximum subgraph with this property.")
56 notion of a core was introduced by Seidman in 1983 (Seidman 1983). A subgraph H k = (W, L W) induced by the set W is a k-core or a core of order k iff ν W: deg H (ν) k and H k is the maximum subgraph with this property. An example of core decomposition of a given graph is illustrated in Figure 6. In this graph there are 3 cores with order 1, 2, and 3. Cores have the following properties: 1. The cores are nested: i < j H j H i. 2. Any k-core contains at least k+1 vertices. 3. Vertices in different k-cores cannot be adjacent. 4. A graph is a tree if no 2-cores. Figure 6: 1, 2, 3 cores. Green: 1-core; blue: 2-cores; red: 3 cores. 41
57 The algorithm for determining the cores hierarchy is based on the following property: If from a given graph G (D) = (V, E), we recursively delete all vertices, and edges incident with them, of degree less than k, the remaining graph is a k-core. The algorithm of core decomposition CoreD(V, E) is as follows: CoreD(V, E) compute the degree of vertices V order the set of vertices V in increasing order of the degree for each v V in the order do core[v] degree[v] for each u Neighbors(v) do if degree[u] > degree[v] then degree[u] degree[u] -1 reorder V accordingly The time complexity of finding a k-core in a graph is O(mn) where m is the number of edges and n is the number of nodes Core Decomposition towards Understanding of Biological Networks We applied the k-core algorithm to decompose protein-protein physical binary interaction data and microarray data into a series of cores. For protein interaction data, there are 6516 interactions among 3989 proteins. In microarray gene expression correlation network, there have 2087 interactions among 576 genes where the cutoff value of correlation coefficient is 0.9. In the interaction network, a k-core is a highly interconnected cluster of proteins or genes where each component has at least k direct links with other components. To explore biological roles played by k-cores, we examined the function annotation of members of cores based on SGD at A k-core should have a consistent function representing 42
58 an existed functional module. In some cases, a core is a functional machinery of biological process. For example, Table 4 is 13-core derived from protein physical binary interaction data. It is SAGA (Spt-Ada-Gcn5-acetyltransferase), a large multi-protein complex that possesses histone acetyltransferase involved in the regulation of transcription. Table 5 is the 22-core derived from microarray data, the ribosome. The detail information of cores derived from protein interaction data and microarray data were listed at and each ORF was linked to SGD database. The decomposition of a network by K-cores provides the strong evidence for the network modularity principle introduced by Hartwell et al. (1999). It also shows the hierarchical modular organization of cellular networks (Holme et al. 2003, Ravasz et al. 2002) since K-cores have the nested structure. The K-core algorithm is an effective mathematical formulation to detect the modular structure of biological networks, that is, the identification of highly connected subgraphs that have more interactions within themselves and fewer with the rest of the graph. The K-core algorithm exactly meets the proposed properties of modules: a set of nodes within a module that have strong interactions with each other and do not have significant interactions with nodes outside the module. Moreover, the K-core algorithm models the organization of biological networks in hierarchical or "nested" fashion. Just like in engineering, the behavior of a system at the higher (i.e., larger space scale or longer time scale) level is included in the system at lower space/time scales that have the broader properties. 43
59 Table 4: The 13 core derived from protein interaction data. ORF Name Function YBR081C SPT7 Subunit of the SAGA transcriptional regulatory complex YGR252W GCN5 catalytic subunit of SAGA histone acetyltransferase complex YBR198C TAF5 Subunit (90 kda) SAGA complex YGL112C TAF6 Subunit (60 kda) of SAGA complex YDR145W TAF12 Subunit (61/68 kda) of SAGA complex YDR167W TAF10 Subunit (145 kda) of SAGA complex YLR055C SPT8 Subunit of the SAGA transcriptional regulatory complex YDR392W SPT3 Subunit of the SAGA and SAGA-like transcriptional regulatory complexes YMR236W TAF9 Subunit (17 kda) of SAGA complex YDR448W ADA2 transcription factor, member of SAGA YPL254W HFI1 adaptor protein required for structural integrity of the SAGA complex YOL148C SPT20 Subunit of the SAGA transcriptional regulatory complex YDR176W NGG1 Involved in glucose repression of GAL4p-regulated transcription YHR099W TRA1 RA1 is the homolog of the human protein TRRAP which we have isolated as an essential cofactor of c-myc. 44
60 Table 5: The 22-core derived from microarray data. ORF ID Gene Function Name YLR048W RPS0B Protein component of the small (40S) ribosomal subunit YJL190C RPS22A Protein component of the small (40S) ribosomal subunit YJL177W RPL17B Protein component of the small (60S) ribosomal subunit YBR048W RPS11B Protein component of the small (40S) ribosomal subunit YGR034W RPL26B Protein component of the large (60S) ribosomal subunit YDR417C Hypothetical ORF YBR191W RPL21A Protein component of the large (60S) ribosomal subunit YLR388W RPS29A Protein component of the small (40S) ribosomal subunit YER102W RPS8B Protein component of the small (40S) ribosomal subunit YGR148C RPL24B Ribosomal protein L30 of the large (60S) ribosomal subunit YLL045C RPL8B Ribosomal protein L4 of the large (60S) ribosomal subunit YBL087C RPL23A Protein component of the large (60S) ribosomal subunit YER117W RPL23B Protein component of the large (60S) ribosomal subunit YPL220W RPL1A N-terminally acetylated protein component of the large (60S) ribosomal subunit YBR189W RPS9B Protein component of the small (40S) ribosomal subunit YIL018W RPL2B Protein component of the large (60S) ribosomal subunit YPL142C Hypothetical ORF YGL076C RPL7A Protein component of the large (60S) ribosomal subunit YJR123W RPS5 Protein component of the small (40S) ribosomal subunit YKL006W RPL14A N-terminally acetylated protein component of the large (60S) ribosomal subunit YOR369C RPS12 Protein component of the small (40S) ribosomal subunit YEL054C RPL12A Protein component of the large (60S) ribosomal subunit YHL033C RPL8A Ribosomal protein L4 of the large (60S) ribosomal subunit YHR203C RPS4B Protein component of the small (40S) ribosomal subunit YGL147C RPL9A Protein component of the large (60S) ribosomal subunit YPL090C RPS6A Protein component of the small (40S) ribosomal subunit 45
61 2.5.4 Future Work In the microarray gene co-expression network, the genes in a K-core are likely to be co-regulated at the level of transcription in response to environmental conditions. To better understand the underlying regulation mechanism of cellular networks, we will search for over-represented motifs from known transcription factors in the promoters of the genes in each core. The hypergeometric distribution will be used to calculate the significance of observing the number of upstream regions with a motif present in a core given the number of upstream regions in the whole genome with that motif. The Poisson distribution will also be used to model the probability of occurrence of a given cis-acting element sequence in the promoter region of a gene as follows: f ( x) e x! x λ λ = (2) where x is the occurrence of the motif in a given gene (X = 0, 1, 2, 3 ), and λ is the mean occurrence of the motif per gene in the whole dataset. 46
62 Chapter 3: Genome-Scale Function Prediction for Unannotated Proteins in Yeast Saccharomyces cerevisiae through Integrating Multiple Sources of High-Throughput Data 3.1 Introduction An immediate challenge of the post-genomic era is to assign biological functions to all the proteins encoded in the genomes by developing effective and automated methods. As we introduced in section 1.2, many computational methods have been developed to predict functions for unanotated proteins using genomic sequence data or other available high-throughput data. However, it should be noted that most of methods used only one single type of high-throughput data. Clearly, different types of high-throughput data indicate different aspects of the internal relationships between the same set of genes. Each type of high-throughput data has its strengths and weaknesses in revealing certain relationships as discussed in Chapter 2. Therefore, different types of high-throughput data complement each other and a combination of them offer more information than what a single source can achieve. We believe integrated analyses that combine information from various sources of high-throughput data provide a promising approach for protein function prediction. One major challenge for integrating various types of high-throughput data is that the errors in the high-throughput data have not been handled well and the rich information contained in high-throughput data has not been fully utilized given the complexity and the quality of high-throughput data. A possible solution for this problem is Bayesian probabilistic model (Winkler 1972), which could lead to a coherent function 47
63 prediction and reduce the effect of noise, as it combines information from diverse data sources within a common probabilistic framework and naturally weighs each information source according to the conditional probability relationship among information sources. Another major limitation of current function prediction methods based on majority rule assignment (Schwikowski et al. 2000) is that the global properties of interaction network are underutilized since current methods often do not take into account the links among proteins of unknown functions. Recently to address this challenge, Vazquez et al. (2003) proposed a global method to assign protein functions based on protein interaction network by minimizing the number of protein interactions among different functional categories. To further overcome these limitations, we developed a computational framework for systematic protein function annotation at the genome scale. Our current study focuses on yeast Saccharomyces cerevisiae, where rich high-throughput data are available. Comparing with current methods, our method is distinctive in the following aspects: (1) Hypothetical proteins can be assigned to various function categories of GO biological process with probabilities. This is in contrast to many other prediction methods where proteins were predicted as yes or no without confidence assessment to a limited number of function categories (e.g., MIPS (Mewes et al. 2002), which is less detailed than GO). (2) We quantitatively measured functional dependencies underlying each type of highthroughput data (protein binary interactions, protein complexes, and microarray gene expression profiles) and coded them into functional linkage graph, where each node represents one protein and Bayesian probabilities were calculated to represent the function similarity for each edge between two proteins. We also integrated evolutionary 48
64 information and protein subcellular localization information into function annotation. (3) We developed a global function prediction method based on a Boltzmann machine for function annotation of hypothetical proteins with integration of functional linkage evidences from different types of high-throughput data. We may predict the function of a hypothetical gene, even if none of its neighbors in the network has known function. The function assignment of hypothetical proteins is conducted in an iterative fashion till the system is consistent. Our method is robust for combining and propagating information systematically across the entire network based on the global optimization of the network configuration Data Sources Protein-protein binary interaction data See the description in section 2.2. Protein complexes The protein complexes data were obtained from Gavin et al. (2002) and Ho et al. (2002). In the protein complexes, although it is unclear which proteins are in physical contact, the protein complex data contain rich information about functional relationships among involved proteins. For simplicity, we assigned binary interactions between any two proteins participating in a complex. Thus in general, if there are n proteins in a protein complex, we add n*(n-1)/2 binary interactions. This yields 49,313 edges to the interaction network. 49
65 Microarray gene expression data The gene-expression profiles of microarray data were from Gasch et al. (2000), which included 174 experimental conditions for all the genes in yeast. For each experiment if there was a missing point, we substituted its gene expression ratio to the reference state with the average ratio of all the ORFs under that specific experimental condition. A Pearson correlation coefficient was calculated for each possible ORF pairs to quantify the correlation between the gene pairs. Subcellular localization data We used the genome-scale protein subcellular localization data experimentally obtained from GFP (green fluorescent protein)-tagged yeast strain (Huh et al, 2003) proteins were assigned into 22 distinct subcellular localization categories. The data are available at Genomic sequences We downloaded the genomic sequence and the protein annotation data of five species at public databases, including budding yeast S. cerevisiae ( Arabidopsis thaliana ( Drosophila melanogaster ( and Caenorhabditis elegans ( 3.3 Methods Measurement of Protein Function Similarity A particular gene product can be characterized with different types of function, including molecular function at the biochemical level (e.g. cyclase or kinase, whose annotation is often more related to sequence similarity and protein structure) and the biological process 50
66 at the cellular level (e.g. pyrimidine metabolism or signal transduction, which is often revealed in the high-throughput data of protein interaction and gene expression profiles). In our study, function annotation of protein is defined by GO (Gene Ontology) biological process (The Gene Ontology Consortium, 2000). The GO biological process ontology is available at It has a hierarchical structure with multiple inheritances. Another functional classification is MIPS, which has a coarse hierarchical functional classification scheme, compared to GO. Having looked at both the functional classification systems, GO functional annotation appears to be a more systematic, detailed and robust classification in comparison to MIPS. Therefore, we used GO biological process classification, as of November 2003, to assign function to unannotated proteins in our study. After acquiring the biological process functional annotation for the known proteins along with their GO Identification (ID), we generated a numerical GO INDEX, which represents the hierarchical structure of the classification. The more detailed level of the GO INDEX, the more specific function assigned to a protein. The following shows an example of GO INDEX hierarchy, with the numbers on the left giving the GO INDICES and the numbers in the brackets indicating the GO IDs: 2 cellular process (GO: ) 2-1 cell communication (GO: ) signal transduction (GO: ) cell surface receptor linked signal transduction (GO: ) G-protein coupled receptor protein signaling pathway (GO: ) signal transduction during conjugation with cellular fusion (GO: ) In SGD data ( each yeast protein has been annotated with one or more GO biological process IDs yeast proteins in total have been assigned GO INDICES. We calculated protein function similarity by comparing the level of 51
67 similarity that the two proteins share in terms of their GO INDICES. For example, if both ORF1 and ORF2 have annotated functions, assume ORF1 has a function represented by GO INDEX and ORF2 has a function represented by GO INDEX When compared with each other for the level of matching GO INDEX, they match with each other through 2-1-8, i.e., INDEX level 1 (2), INDEX level 2 (2-1) and INDEX level 3 (2-1-8). In general, the function similarity between proteins X and Y is defined by the maximum number of index levels from the top shared by X and Y. In this example, the function similarity between ORF1 and ORF2 is 3. The smaller the value of function similarity, the broader functional category shared by the two proteins Identification of Putative Orthologs Using Reciprocal Search An all-against-all FASTA search was conducted for the whole set of S. cerevisiae protein sequences to identify the putative orthologs in fission yeast, Arabidopsis thaliana, Drosophila melanogaster and Caenorhabditis elegans. A subclass of putative orthologs are defined as reciprocal best hits with two additional strict criteria: (1) FASTA (Pearson 1998) expectation value is less than and (2) the FASTA alignable region between two proteins is longer than 80% of the protein length in yeast S. cerevisiae. We illustrate the reciprocal process using the following example (see Figure 7). To identify the orthologs in Arabidopsis thaliana we first queried one ORF i in budding yeast S. cerevisiae against all open reading frames (ORFs) predicted to be protein coding genes in A. thaliana to yield the set of hits {W}. Then we queried the ORF j of A. thaliana against all ORFs in budding yeast S. cerevisiae to yield the set of hits {Y}. 52

68 Figure 7. Identification of putative orthologs between S. cerevisiae and A. thaliana using reciprocal search. P: E-value of FASTA query. S: sequence identity. Finally the protein pair {ORF i, ORF j} were considered to be putative orthologs only if i is the member {Y} with the lowest expectation value and j is the member of {W} with the lowest expectation value Calculation of Bayesian Probabilities We calculated probabilities for two genes to share the same function based on different types of high-throughput data, i.e, microarray data, protein binary interaction data and protein complex data. Given two genes are correlated in gene expression with Pearson correlation coefficient r in microarray data (M r ), the posterior probability that two genes have the same function, p(s M r ), is computed using the Bayes formulas: p(s M r ) = p( Mr S) p( S) pm ( ) r (3) where S represents the event that two genes have the same function at a given level of GO INDEX, p(m r S) is the conditional (a priori) probability that two genes are correlated 53
69 in their expression profile with correlation coefficient r, given that two genes have the same function. The probability p(s) is the probability of proteins whose functions are similar at the given level of GO INDEX by chance. The probabilities p(m r S) and p(s) are computed based on a set of proteins whose functions have been annotated in GO biological process. The probability p(mr) is the frequency of gene expression correlated with coefficient r over all gene pairs in yeast, which is calculated from the genome-wide gene expression profiles. To quantify the gene function relationship among the correlated gene expression pairs, we calculated the probabilities of such gene expression correlated pairs sharing the same function at each GO INDEX level. Results show a higher probability of sharing the same function for broad functional categories (the high-order GO INDEX levels) or highly correlated genes in expression profiles (Figure 8A). Figure 8B shows the presence of information in highly correlated gene-expression pairs for their gene functional relationship in comparison to random pairs. Based on Figures 8, we decided to consider pairs with gene expression profile correlation coefficient 0.7 for function predictions, as other pairs have little information for function prediction. The estimated probabilities of sharing the same function corresponding to gene pairs with r 0.7 were smoothed by using a monotone regression function (the pool-adjacent-violators algorithm, Haerdle, 1992) for function prediction of hypothetical proteins. 54
70 Figure 8. A: Probabilities of pairs sharing the same levels of GO indices against Pearson correlation coefficient of microarray gene expression profiles. B: Normalized ratio for the percentage of gene pairs sharing the same levels of GO indices (p(s M r )), against the percentage of pairs sharing the same function for random pairs (p(s)) versus Pearson correlation coefficient of microarray gene expression profiles. Pearson correlation coefficient ranges from 1 to 1. 55
71 We also integrated protein subcellular information into probability calculations of microarray data. As shown in Figure 9, two genes with correlated gene expression profiles are more likely to have the same function if they share the same cellular compartment. For protein binary interaction (B), the probability that two proteins have the same function, p(s M), is computed as: p(s B) = p( B S) p( S) p( B) ( 4 ) where S represents the event that two proteins have the same function at a given GO INDEX level. p(b S) is the probability for two proteins to have a protein binary interaction when they share the same function. The prior probability p(s) is the relative frequency of proteins whose functions are similar. The probabilities of p(b S) and p(s) are computed based on the set of proteins whose functions have been annotated in the GO biological process. The probability p(b) is the relative frequency of two proteins having a known binary interaction over all possible pairs in yeast, which is estimated from the known protein interaction data set. Similarly, given two proteins are in the same complex interaction, i.e., have a complex interaction (C), we can estimate the probability of two proteins having the same function p(s C) as: p(s C) = p( C S) p( S) p( C) (5) where S represents the event that two proteins have the same function at a given GO INDEX level. p(c S) is the probability for two proteins to be in the same complex given that they share the same function. 56
72 Figure 9. A: Probabilities of gene pairs at the same localization sharing the same levels of GO INDICES against Pearson correlation coefficient of microarray gene expression profiles. B. Comparison of probabilities of sharing the same function calculated from the gene pairs with the same localization (red lines) and from all the gene pairs without localization information considered (green lines). 57
73 The probability p(c) is the relative frequency of proteins having complex interaction over all protein pairs in yeast. The prior probability p(s) is the relative frequency of proteins whose functions are similar. The calculation of p(c S) and p(s) is based on the set of proteins whose functions have been annotated in the GO biological process. The analysis result of the protein-protein interaction data is shown in Figure 10. The plots for protein binary interaction and complex interaction data, show a drop of probabilities of sharing the same function with an increase in the GO INDEX level, as seen in Figure 10A. A higher probability to share less specific, broader functional categories as represented by lower GO INDEX levels is observed. Comparison of our results with similar analysis on random pairs, shows a normalized ratio of protein-protein interaction pairs against the random pairs for sharing the same GO INDEX level (as seen in Figure 10B). Since the value is highly biased above 1, particularly for more specific function categories, there clearly exists a relationship between the protein-protein interaction data and similarity in function. Such relationships can be utilized to make function predictions, especially for more specific functions with higher GO INDEX levels. It is assumed that if the protein interaction pairs are evolutionally conserved, they are more likely to share the same function since protein interaction might put constraints on sequence divergence (Teichmann, 2002). We added the evolution information into the probability calculations for interacting proteins to share the same function based on sequence comparison. 58
74 Figure 10. Functional relationship in yeast protein-protein interaction data. The horizontal axis in both plots shows the GO INDEX levels that two proteins share. (A) The probability of interacting proteins sharing the same levels of GO INDICES. (B) The normalized ratio of (A) compared with random pairs. 59
75 For each protein in S. cerevisiae its putative orthologs in other 3 distantly related species (Arabidopsis thaliana, Drosophila melanogaster and Caenorhabditis elegans) were identified using reciprocal searching method as described in section Thus, protein interaction data can be classified into two subsets: (1) For each interacting pair {Pi, Pj}, both proteins i and j have orthologs in at least one organism out of the 3 species; (2) the remaining data. For each subset we calculated its Bayesian probability (Figure 11). The interaction pairs in subset (1) can be considered as co-evolved and they indeed have higher probabilities of sharing the same function as showed in Figure Protein Function Prediction Local Prediction In the local prediction of a hypothetical protein using its immediate neighbors in the network graph, we follow the idea of guilt by association, i.e., if an interaction partner of the studied hypothetical protein X has a known function, X may share the same function, with a probability underlying the high-throughput data between X and its partner. We identify the possible interactors for X in each high-throughput data type (protein binary interaction, protein complex interaction and microarray gene expression with correlation coefficient r 0.7). We assign functions to the unannotated proteins on the basis of common functions identified among the annotated interaction partners using the probabilities described in section 3.2. A protein can belong to one or more functional classes, depending upon its interaction partners and their functions. For example, in Figure 12, protein X is a hypothetical protein. Proteins A, B and C that interact with X have known functions. 60
76 Figure 11: The probabilities of sharing the same function for interaction pairs that are coevolved (line with square), interaction pairs that are not co-evolved (line with up triangle) and overall interaction pairs (line with cross). The red lines are for protein binary interaction data and green lines are for protein complex interaction data. 61
77 Figure 12: Illustration of prediction method. Protein X is a hypothetic protein. Protein A, B and C are all the only proteins with known functions that have interaction with protein X. The interactions could be correlation in gene expression (M), protein binary interaction (B) or protein complex interaction (C). With the assumption that F i, i = 1, 2,, n, represents a collection of all the functions that proteins A, B and C have, a likelihood score function for protein X to have function F i, G(F i X), is defined as: G(F i X ) = 1- (1- P^(S l M))*(1- P^(S l B))* (1- P^(S l C)) (6) where S l represents the event that two proteins have the same function, F i, whose GO INDEX sharing l levels, l = 1, 2,, 12. Given F i, P^(S l M), P^(S l B) and P^(S l C) are calculated based on probabilities of interaction pairs to have the same function for gene expression correlation coefficient 0.7 (M), protein binary interaction (B) and protein complex interaction (C), respectively. In each type of high-throughput data, one hypothetical protein might have multiple interaction partners with function F i. Suppose that there are n M, n B, and n C interaction 62
78 partners with function F i in the three types of high throughput data, respectively. P^(S l M), P^(S l B), and P^(S l C) in equation (6) are calculated as: P^(S l M) = 1 - [1-P j (S l M)], j = 1, 2,.n M. (7) P^(S l B) = 1 - [1-P j (S l B)], j = 1, 2,.n B. (8) P^(S l C) = 1 - [1-P j (S l C)], j = 1, 2,.n C. (9) P j (S l M), P j (S l B), and P j (S l C) were estimated probabilities retrieved from the probability curves calculated in section 3.2. We also defined he likelihood score as Reliability Score for each function, F i : Reliability Score = 1- (1- P^(S l M))*(1- P^(S l B))* (1- P^(S l C)) (10) The final predictions are sorted based on the Reliability Score for each predicted GO INDEX. The Reliability Score represents the probability for the hypothetical protein to have a function F i, assuming all the evidences from the high-throughput data are independent and only applicable to immediate neighbors in the network Global Prediction The major limitation of the local prediction method is that it only uses the information of immediate neighbors in a graph to predict a protein s function. In some cases, the uncharacterized proteins may not have any interacting partners with known function annotation and its function cannot be predicted based on the local prediction method (Figure 13). Therefore, the global properties of the graph are underutilized since this analysis does not include the links among proteins of unknown function. In Figure 13 proteins 1, 2, 3 and 4 are annotated proteins and proteins 5, 6, 7 and 8 have unknown functions. If we only use the local prediction method, the function of proteins 3 and 4 can be predicted but the function of proteins 1 and 2 cannot since all the neighbors of proteins 63
79 Figure 13: Illustration of protein function prediction from interaction network. Proteins 1, 2, 3 and 4 are hypothetical proteins. Proteins 5, 6, 7 and 8 are annotated proteins with known functions. 1 and 2 are hypothetical proteins. Moreover, the contributions of function assignment for protein 4 is not only from the neighbor proteins 7 and 8 whose functions are already known, but also from protein 1 when its functions is predicted through the following information propagation: proteins 5 and 6 protein 3 protein 2 protein 1. So the functional annotation of uncharacterized proteins should not only be decided by their direct neighbors but also controlled by the global configuration of the interaction network. Based on such global optimization strategies, we developed a new approach for predicting protein function. We used the Boltzmann machine to characterize the global stochastic behaviors of the network. A protein can be assigned to multiple functional classes, each with a certain probability. We consider a physical system with a set of states, α, each of which an energy, H α. In thermal equilibrium, given a temperature T, each of the possible states α occurs with probability: 64
80 P α = 1 Hα / KBT e Z (11) where the normalizing factor Z = α e H α / KBT and K B is the Boltzmann s constant. This is called the Boltzmann-Gibbs distribution. It is usually derived from the very general assumptions about microscopic dynamics. It is also applied to stochastic network. In an undirected graphical model with binary-valued nodes, each node (protein) i in the network has only one state value Z (1 or 0). For the state at time t node i (Z t,i ) has probability of Z = 1 as P(Z t, i = 1 Z t-1, j i ) and is given as a sigmoid-function of the inputs from all the other nodes at time t-1: P(Z t, i = 1 Z t-1, j i ) = 1+ 1 WZ j i ij t 1, j i e β (12) where β is a parameter corresponding to the annealing temperature and W ij is the weight of the edge connecting proteins i and j in the interaction graph. W ij is calculated according to equation (4) by combing the evidence from gene expression correlation coefficient 0.7 (M), protein binary interaction (B) and protein complex interaction (C): (13) W ij = δgf ( i, jt, 1) = δ(1 (1 PS ( M))(1 PS ( B))(1 PS ( C))) Fk k l l l Fk where S k represents the event that two proteins i and j have the same function F k (k = 1, 2,, n), whose GO INDEX has l levels, l = 1, 2,,12. G(F K i, j, t) is the reliability score for proteins i and j sharing the same function F k at time t-1. P(S l M), P(S l B) and P(S l C) were estimated probabilities retrieved from the probability curves calculated in section 3.2. δ is the modifying weight: 65
81 To achieve the global optimization, we conducted simulated annealing technique as the following process (Figure 14): we set the initial state of all unannotated proteins (nodes) randomly to be 0 or 1, the state of any annotated protein is always 1; starting with a high temperature, pick a node i and compute its value µ i, then update its state according to the probability µ i, till all the nodes in the network reach equilibrium. With gradually cooling down, the system might resettle in a global optimization of network configuration if the sum of weights associated to hypothetical proteins reaches the maximum value. 3.5 Results We have implemented the three methods for predicting the functions of hypothetic proteins as described above, i.e., (1) local prediction without integrating evolution and localization information; (2) local prediction with integrating evolution and localization information; and (3) global prediction with integrating evolution and localization information. We evaluated the performance of the three methods using all annotated proteins in yeast. The performance of our prediction methods was evaluated using two different methods: function prediction accuracy at the level of protein and sensitivity and specificity of prediction at the level of function. We first measured the performance of our methods at the level of proteins, i.e., a correct prediction for a protein means that at least one predicted function is the same as a known function for the protein). 66
82 Figure 14: Illustration of global method for function prediction using simulated annealing technique. (A) A given interaction network where proteins (1 to 5) are function known and proteins (6 to 11) are unannotated proteins. (B) In the initial state, the states of all hypothetical proteins (nodes) are randomly selected to be 0 or 1 and the state of any annotated protein is always 1. State 1 means that protein is annotated and state 0 means that protein s function is unknown. (C) Starting with a high temperature, for each node i we compute its value µ i, then update its state. This, proteins 6, 7, 8, 11 can be assigned function. (D) With temperature going down, we calculate again the value µ i of each node i and update its state. All unannotated proteins can be assigned function finally. The system might resettle in a global optimization of network configuration 67
83 Figure 14 Continued 68

84 For validation, we divided the 4044 annotated proteins with known GO INDICES into two sets randomly, i.e., 75% for the training set and 25% for the test set. All a priori probabilities were calculated from the training set and used for function prediction in the test set. Figure 15 shows the percentage of proteins whose functions can be predicted accurately. We found that the localization and evolution information improved the prediction. The global method has the best performance since it utilizes the maximal available information. Moreover, 84% proteins of the test set can be predicted using the local prediction method while 87% proteins of the test set can be predicted using the global method since the global method can assign functions to proteins which only have hypothetical interaction partners. The remaining 13% proteins functions cannot be predicted since they do not connect to any protein with known function in the current available high-throughput data. Figure 15: Percentage of proteins in testing data whose functions can be successfully predicted versus the Reliability Score, with an interval of
85 We further used sensitivity and specificity to measure the performance of our methods at the level of functions (one protein can have multiple functions) using ten-fold cross validation. We labeled all 4044 annotated proteins with known GO INDICES into fold 1 to 10. Each time, we pick one fold as the test dataset and the other nine folds were used as training data to calculate prior probabilities. We estimate the sensitivity to determine the success rate of the method and specificity to assess the confidence in the predictions. For a given set of proteins K, let n i be the number of the known functions for protein P i. Let m i be the number of functions predicted for the protein P i by the method. Let k i be the number of predicted functions that are correct (the same as the known function). Thus sensitivity (SN) and specificity (SP) are defined as: SN k K 1 i = (14) K 1 ni SP k K 1 i = (15) K 1 mi Figure 16 shows the sensitivity versus specificity of the method with Reliability score cutoff from 0.1 to 0.9. It showed that the localization and evolution information can improve the sensitivity as shown above but the sensitivity-specificity curve remains almost the same as the one without the localization and evolution information. The global prediction shows significantly better sensitivity-specificity plot than local predictions. In our method, the highest specificity can only reach 70%. Some false positives generated in our method might be caused by the independence assumption of different sources of high-throughput data although it was suggested that the information from different highthroughput data are conditionally uncorrelated (Jansen et al. 2003). On the other hand, the predicted functions from our method could be true and they have not been determined by experiments yet, thus, they are not included in GO annotation. 70
86 Figure 16: Sensitivity-specificity plot on the test set for the three prediction methods. Using all the 4044 annotated proteins with known GO INDICES as the training set, we are able to assign functions to 1802 out of the 2280 unannotated proteins in yeast at different level of functions (different levels of GO INDICES). The detail prediction results can be queried at The number of hypothetical genes with function predictions with respect to the specificity and Index levels can be found in Table 6. Using our method, we not only assign general functional categories to unannotated protein but also assign the specific functions to unannotated proteins. For example, Table 7 shows 14 genes whose predicted functions are with reliability score >= 0.9 and GO index level >= unannotated proteins were assigned functions with reliability score >= 0.9 and GO index level >= 7. The MS Excel file of 104 proteins can be downloaded at In our study, 593 unannotated proteins can be assigned functions with reliability score >= 0.9 and GO index level >= 5. 71
87 Table 6. Number of unannotated genes with function predictions with respect to prediction confidence probabilities and index levels. Reliability Score INDEX
88 Table 7: 14 genes whose predicted functions are with reliability score >= 0.9 and GO index level >= 8. Numbers in parentheses denote the reliability score. ORF ID Predicted GO Biological Process Index with Reliability Score YDR091C (0.9) Ribosome biogenesis: processing of 20s pre-rrna (0.9) rrna processing: processing of 20s pre-rrna YDR365C (0.97) Ribosome biogenesis: processing of 20s pre-rrna (0.92) rrna processing: 35s primary transcript processing YDR496C (0.97) Ribosome biogenesis: 35s primary transcript processing YGR145W (0.99) Ribosome biogenesis: processing of 20s pre-rrna YHR033W (0.94) Ubiquitin-dependent protein catanolism YJL069C (0.97) Ribosome biogenesis: processing of 20s pre-rrna YKR060W (0.96) rrna processing: processing of 20s pre-rrna YLR196W (0.97) Ribosome biogenesis: processing of 20s pre-rrna YLR409C (0.99) rrna processing: processing of 20s pre-rrna YMR116C (0.96) rrna processing: processing of 20s pre-rrna YMR290C (0.98) Ribosome biogenesis: 35s primary transcript processing YNL132W (0.99) Ribosome biogenesis: processing of 20s pre-rrna YNL175C (0.92) Ribosome biogenesis: processing of 20s pre-rrna YNR054C (0.92) Ribosome biogenesis: 35s primary transcript processing (0.93) Ribosome biogenesis: 35s primary transcript processing (0.99) Ribosome biogenesis: 35s primary transcript processing (0.93) rrna processing: processing of 20s pre-rrna (0.96) Ribosome biogenesis: 35s primary transcript processing (0.97) rrna processing: processing of 20s pre-rrna (0.99) Ribosome biogenesis: 35s primary transcript processing (0.92) Ribosome biogenesis: 35s primary transcript processing (0.92) Ribosome biogenesis: 35s primary transcript processing (0.94) Ribosome biogenesis: 35s primary transcript processing (0.96) Ribosome biogenesis: 35s primary transcript processing (0.92) Ubiquitin-dependent protein catanolism 73
89 Figure 17 is the diagram of the distribution of those 593 assigned proteins among the major functional categories. 3.6 Discussion Systematic and automated prediction of gene function using high-throughput data represents a major challenge in the post genomic era. To address this challenge, we developed a systematic method to assign function in an automated fashion using integrated computational analysis of yeast high-throughput data including yeast binary interaction, protein complexes and gene expression microarray data, together with the GO biological process functional annotation. The main contribution of our work is to provide a framework of integrating heterogeneous biological information for genomescale protein function prediction. In addition, we combine protein subcellular localization and evolution information into function prediction. Our methods assign functions for unannotated proteins at the genome scale. To our knowledge, our method covers more hypothetical proteins for functional predictions than any other methods published before (see Table 8). From 29 proteins listed in Table 1 in the paper of Schwikowski et al. (2000) that have two or more interacting proteins, we randomly choose five unannotated proteins that are not annotated till now to compare the prediction results of those five methods: Schwikowski et al., Deng et al., Letovsky and Kasif, Troyanskaya et al., and our method (see Table 9). One improvement of our method is that we can assign unannotated proteins into deeper levels of biological processes while the other methods make protein function prediction using functional categories defined in YPD ( or MIPS ( databases. 74

90 Figure 17: The distribution of proteins with predicted functions among function categories. 1: cell growth; 2: cell organization and biogenesis; 3: biosynthesis; 4: protein metabolism; 5: carbohydrate metabolism; 6: nucleic acid metabolism; 7: regulation of metabolism; 8: response to DNA damage. The percentage denotes the ration of the number of protein belonging to one functional category and the number of unannotated proteins. One unannotated protein can belong to more than one functional category. 75
91 Table 8: The prediction methods and the number of proteins with predicted functions. Some of the increased performance of our method may be due to the different size of dataset used in different studies, but we believe it does not account for the major improvement of our method. The major contribution is that our method integrated multiple sources of data and utilized maximal information by combining and propagating information systematically across the entire network based on the global optimization. Prediction methods Number of unannotated proteins with predicted function Our method 1802 Schwikowski et al. (2000) 364 Deng et al. (2002) 422 Letovsky and Kasif (2003) 320 Troyanskaya et al. (2003) No information Vazquez et al. (2003)
92 Table 9: The comparison of prediction results from five methods. Schwikowski et al. (2000) a Deng et al. (2002) b Letovsky and Kasif (2003) c Vazquez et al. (2003) d YMR322C YDR100W YLR449W YLR128W YER079W Cell stress (3/3) Vesicular transport (2/2) Membrane fusion (2/2) Other metabolism (0.78) Cell stress (0.63) pyridoxine metabolism (0.1) Thiamin biosynthesis (0.2) Biosynthesis of vitamins, cofactors, and 3 prosthetic groups (100) (0.93) Pyridoxine metabolism (0.92) Our Vitamin biosynthesis: method e thiamin biosynthesis (0.91) Protein ubiquitination Small molecule transport (0.99) Membrane fusion (0.17) Intracellular protein transport (0.8) Vesicle-mediated transport (0.9) Vacuolar and lysosomal organization (43) 3 Vacuolar transport (35) Vesicular transport (Golgi network, etc.) (22) (0.68) Protein metabolism (0.56) Intracellular transport: nucleocytoplasmic transport (0.54) retrograde ( Golgi to ER) transport Protein synthesis (2/3) No prediction Cell polarity (2/4) No prediction Signal transduction(2/2) Cell polarity (0.49) Signal tranduction (0.48) Small molecule transport (0.25) No prediction No prediction No prediction No prediction (0.95) processing of 27S pre-rrna cell cycle check point proteins (94) organization of cytoskeleton (5) proteasome (1) (0.65) cytokinesis (0.65) Cell growth: bud growth (0.93) ribosomenucleus export (0.6) Cellular process: bud growth cell growth (20) budding, cell polarity and 2 filament formation (20) cytokinesis (20) (0.98) protein-lipolyation (0.89) protein-vaculor targeting (0.86) negative regulation of gluconeogensis a Prediction results for only proteins with two or more interactions interaction partners of known function. Numbers in parentheses denote number of neighbors with the given function/number of interaction partners with known functions. Predictions form protein interactions are classified according to YPD annotation categories of cellular role. b Data are from cellular role prediction results available at Number in the parenthesis denotes the probability of a protein belonging to the functional category. There are 44 categories of cellular roles 77
93 used in prediction. c Predictions are from using GO terms as function labels. Number in parenthesis denotes the probability of function assignment. d The data are functional classification of unannotated proteins using functional categories obtained from MIPS. The number in the second column is the prediction reliability degree ranging from 1 to 11. The larger of the degree, the more reliable of the prediction. The number in parenthesis shows the percentage of occurrence of the corresponding function in 100 runs of prediction algorithm. e Predictions are from our method with the GO biological process INDEX and its reliability score(the number in the parenthesis). 78
94 Moreover, using our global prediction method we can assign functions for the proteins whose interacting partners are all unannotated proteins with unknown function. For example, in Figure 18, all interacting partners of YBR100W are function unknown. In Table 10 we given GO annotations of function known interaction partners of unannotated proteins: YBR099C, YNL092W and YOR291C. It should be noted that YBR099C, YNL092W and YOR291C still have function-unknown interaction partners that are not listed in Table 10. When their functions have been predicted, the information can be propagated to improve the function prediction of YBR099C, YNL092W and YOR291C, even YBR100W through the iterative procedure of our global prediction method. Finally, using our method, YBR100W was assigned function as nucleic acid metabolism (reliability score 0.8) and as function as response to DNA damage (reliability score 0.8). Our predictions can provide biologists with hypotheses to study and design specific experiments to validate the predicted functions using tools such as mutagenesis. Such combination of computational methods and experiments may discover biological functions for hypothetical proteins much more efficiently than traditional approaches. 79
 with reliability score 0.")
95 Figure 18: Global function prediction for yeast ORF YBR100W. All interacting partners of YBR100W are function unknown. Through global prediction method, it was assigned functions i.e. GO Index (nucleic acid metabolism) with reliability score 0.8; GO index (response to DNA damage) with reliability score
96 Table 10: GO Indices of proteins in Figure 18. A: annotated proteins. P: Predicted functions for unannotated proteins. The number in the parenthesis denotes the reliability score. ORF ID Name A/P GO Index GO biological process annotation YER133W GLC7 A S primary transcript processing Response to heat YJR063W RPA12 A Glycogen metabolism S primary transcript processing ACA1 A Transcription initiation from Pol II promoter YER045C Transcription initiation from Pol II promoter YHR055C CUP1 A Response to copper ion YJR091C JSN1 A Deadenylation-dependent decapping mrna catabolism, deadenylation-dependent YDR148C KGD2 A Tricarboxylic acid cycle oxoglutarate metabolism YDR259C YAP6 A Positive regulation of transcription from Pol II promoter Positive regulation of transcription from Pol II promoter YDR123C INO2 A Positive regulation of transcription from Pol II promoter YDR082W STN1 A Telomere capping YDL200C MGT1 A DNA dealkylation YBR099C P (0.96) DNA ligation (0.96) Transcription (0.96) Transcription, DNA-dependent YNL092W P (0.88) rrna processing (0.85) Double-strand break repair via homologous recombination YIL024C P (0.93) Nucleic acid metabolism (0.82) Double-strand break repair YOR391C P (0.98) DNA dealkylation (0.89) Transcription from Pol II promoter 81
97 Chapter 4: Biological Pathway Inference and Biological Interaction Network Clustering Using Multiple-Source High-Throughput Data 4.1 Introduction In this chapter we extended the framework developed in chapter 3 to infer biological pathway and to identify functional modules by clustering biological networks. Using Bayesian probability approach described in chapter 3, we quantitatively measured functional dependencies underlying each type of high-throughput data such as protein binary interactions, protein complexes, and microarray gene expression profiles. Thus, we can code different types of high-throughput data into a functional-linkage graph where the node represents a protein and the edge represents the functional similarity or closeness of two proteins. It is recognized that biological systems are functionally organized in different networks that are defined by types of interactions, such as metabolic or signaling pathway and protein interaction cascade, regulatory or coexpression network. Therefore, the constructed functional-linkage graph provides rich information on the organization and dynamic nature of cellular network mechanisms. Based on the defined functional-linkage network, we applied computational methods to derive partial biological pathways and identify functional modules in the systematical and automated fashion. The study of biological pathways is important and challenging since biological pathways are complex and synergistic systems. Traditional biological pathways studies have been conducted in ad hoc manner and on a small scale. High-throughput biological data provide us a unique opportunity to construct biological pathways in silico. For 82
98 example, the protein-protein interactions can often provide the backbones for biological pathways. In our pathway inference method, the inputs of the method are the upstream starting protein (e.g., a sensor of a signal) and the downstream terminal protein (e.g., a transcriptional factor that induces genes to respond the signal) in a signal transduction pathway; the output of the method is the protein interaction chain between the two proteins for the signal transduction. The protein interaction cascade pathway of the signal transduction is predicted as the shortest path identified from the graph of the interaction network using the Dijkstra s algorithm. We will present case study results of pathway inference in yeast and Arabidopsis. Recently, biological networks are investigated in terms of modularity by treating substructure of complex networks as functional units (Hartwell et al. 1999, Jeong et al. 2000, Tanay et al. 2004). A functional module is defined to be a group of genes or their products that are related by one or more physical or genetic interactions, e.g. coregulation, co-expression or in the same protein complex, a metabolic or signaling pathway or of a cellular aggregate (e.g. chaperone, ribosome, protein transport facilitator, etc.). Modules can be understood as a separated substructure of a network or a pathway (Rives and Galitski 2003), e.g. the complex of fatty acid synthetase is a module of protein machinery. The idea of functional modules provides an effective approach to understand and model cellular network systematically. To obtain more reliable module information than using one distinct data set, we clustered the constructed functional-linkage graph to detect putative functional modules. The outcome of our analysis is a set of functional modules, defined as clusters of the graph. We also integrated GO biological process 83
99 annotation data to validate the modular abstraction of the organization of a complex network Data Sources Arabidopsis microarray data We analyzed the proprietary microarray data for Arabidopsis produced at Ceres, Inc. and calculated Pearson correlation between 6500 Arabidopsis genes with known GO annotations pairs have a correlation coefficient above 0.9. Arabidopsis putative protein interactions based on operon structure Since no genome-scale of experimental protein-protein interaction data in Arabidopsis is available, we predicted putative protein-protein interaction in Arabidopsis based on the operon structure identified in bacterial genomes. Proteins with conserved genetic neighborhood in bacteria, i.e., a group of genes arranged in tandem in one genome and also appeared in a similar fashion in related genomes, tend to interact with each other to form functional complexes (Zheng et al. 2002). Operons represent one such conserved gene context. Identification of operons or conserved gene contexts can provide clues about functional coupling conveyed through evolution. We acquired 122 completed bacterial genome sequences from NCBI ( and utilized them to retrieve bacterial operons. For one bacterial genome, the gene set {Gene i i = 1 m} is defined as one operon, if the internal length of non-coding sequence between gene i and gene i+1, is 50 bps. The Arabidopsis genome sequence was acquired for TAIR ( Protein i and j in Arabidopsis were then queried against the operon database using FASTA (Pearson WR 1998) with cutoff value of 1e-10. Let X and Y be the hits of proteins i and j respectively. 84

100 If X and Y belong to the same operon and they are not the same protein, proteins i and j are inferred as a pair of putative interactions in Arabidopsis (Figure19). The number of putative protein-protein interactions identified from operons is 122, Biological Pathways Inference We have developed a computational framework to characterize biological pathway using lipid second messenger signaling pathway in Arabidopsis as an example. Given a known gene involved in the studied biological pathway, we identified its neighbors in the functional linkage graph and then used Dijkstra s algorithm (Comen et al. 1989) to construct the final topology of pathway. Figure 19. Prediction of protein interactions in Arabidopsis based on homolog hits in operon. Proteins i and j in Arabidopsis are queried against the operon database giving ortholog hits X and Y respectively. 85
101 Construction of Functional Linkage Graph For yeast protein binary interaction data, protein complex data and microarray data, we calculated the Bayesian probabilities: P(S B), P(S C) and P(S M) for proteins to share the same GO index as described in Chapter 3. Thus, the high-throughput data are encoded into a graph of functional linkage network: G = <V, E>, where the vertices V of the graph are connected through the edges E, as illustrated in Figure 20. Each vertex represents a protein. The weight of an edge reflects the functional similarity between the connected proteins i and j. The weight of W ij is calculated as: 12 Wij = log(1 (1 Pk ( S M))(1 Pk ( S B))(1 Pk ( S C))) (16) k where k is the GO biological process Index similarity level according the definition in chapter is the maximum level of GO biological process index. P k (S M), P k (S C) and P k (S B) are available from the probability table calculated in Chapter 3. The smaller value of W ij, the more functional similarity of proteins i and j Pathway Identification Using Dijkstra s Algorithm. Given two termini, the protein interaction cascade pathway in vivo is predicted as the shortest path identified from the graph of the interaction network by using the Dijkstra s algorithm (Cormen et al. 1998). We defined the interaction network as a weighted nondirected graph G(D) = (V, E). The vertex set V= { d i d i D } and the edge set E = { ( d i, d j ) for d i, d j D and i j }. Each edge {u, v} E has a weight that represents the length w(u, v) > 0, for the edge between u and v. We used the Dijkstra s algorithm to identify the shortest path between any two vertices in a graph. 86

102 Figure 20. Coding high-throughput biological data into a functional linkage graph. In this graph, given vertex d, we can identify its neighbors: e, f and k. Moreover, out of the multiple paths from protein a to protein e, the shortest path is a-b-f-d-e, which can be identified by the Dijkstra s algorithm. 87
103 The basic idea of the algorithm is to maintain a set S of vertices whose weights of the shortest paths from the source have already been determined, and then repeatedly select the vertex u V-S which directly connect to a vertex in S. Insert u into S and update the weights of the shortest paths. The algorithm itself is: DIJKSTRA(G, W, S) Initialize_single_source(G, S) S 0 Q V[G] while Q 0 do u Extract-Min (Q) S S {u} for each vertex u Adj[u] do Relax( u, v, w) We implemented a priority queue of vertices to achieve O[nlog(n)+m] time complexity, where n is the number of vertices and m is the number of edges Case Study of MAPK Signal Transduction Pathway in Yeast MAP (Mitogen Activated Protein) kinases control many cellular events from complex programs, such as embryogenesis, cell differentiation, cell proliferation, and cell death, to short-term changes required for homeostasis and acute hormonal responses (Lewis et al. 1998). MAP signal pathway plays an important role to transduce "mitogenic signals" from the cell membrane to the nucleus. MAP kinase cascades include MAPK (MAP kinases), MAPKK (MAPK kinases) and MAPKKK (MAPKK kinases). In yeast, MAPK signal transduction pathways are well studied and the detail information is available at KEGG database at // The automated and systematic identification of a pathway is very challenging because in an interaction network there are a number of possible paths connecting two given 88
104 terminals. Moreover, the identified pathway should be the most meaningful in the biological context. To simplify the assessment of our approach, we picked up 11 threeelement paths from the KEGG MAPK database (see Table 11). In fact, these paths are the only existing paths whose protein interaction cascades are captured in current available high-throughput data. For each test path, we used the Dijkstra s algorithm to identify the whole path given two input proteins: one is the starting protein and the other is the terminal protein. The predicted path is the shortest path between two given nodes in the interaction graph. If the predicted path matches the test path with the same components and the same orientation, we got one correct prediction. We correctly identified 10 out of 11 pathways (Table 11). Table 11: The test MAPK pathways in yeast. Number Test Path Correct Identification 1 YIL046W--YJL187C-- YPR119W Yes 2 YIL147C--YDL235C-- YLR006C No 3 YLR362W--YDL159W--YBL016W Yes 4 YDL159W--YBL016W--YDR480W Yes 5 YDL159W--YBL016W--YPL049C Yes 6 YLR362W--YJL128C--YLR113W Yes 7 YLR006C--YNR031C--YJL128C Yes 8 YNR031C--YJL128C--YLR113W Yes 9 YLR362W--YDL159W--YGR040W Yes 10 YDL159W--YGR040W--YPL049C Yes 11 DL159W--YGR040W--YDR480W Yes 89
105 Case Study of PLD Signal Transduction Pathway in Arabidopsis We have applied our methods to predict the signaling pathway of lipid as a second messenger in Arabidopsis. Evidence is accumulating that phosphatidic acid is a second messenger in plants (Laxalt and Munnik 2002) (Figure 21). This pathway was experimentally verified but each individual pathway elements has not been fully characterized yet. In Arabidopsis phospholipase D (PLD) is known to be involved in this pathway. However, we did not identify the gene of PA kinase, which is known to be involved in the pathway in other species. Moreover, we do not know what other genes are involved in this signaling transduction pathway and how the intracellular biological processes are triggered. Based on microarray data and predicted protein interactions, high-throughput data are coded into a graph of functional linkage network as illustrated in Figure 19. Based on the fact that the gene of PLD was identified as AT3G05630 in Arabidopsis, we obtained the possible pathway components by identifying its neighbors in the functional linkage graph. Table 12 lists the six genes identified to be in this pathway. After identifying the components of a pathway, we refined the architecture of the pathway. Starting from the completed graph of involved genes in a pathway, we pruned the graph by removing the unnecessary edges, which can be identified by the Dijkstra s algorithm. In a completed graph, for n vertices, there are n*(n-1)/2 edges. Given any two vertices, the edge between them will be removed if the distance of this edge is larger than the distance of shortest path between those two vertices identified by the Dijkstra s algorithm. This architecture refining process is achieved by the algorithm OPTIMIZATION (G). 90
106 Table 12: The putative genes involved in phospholipase D signaling transduction pathway in Arabidopsis. AT2G36770 AT4G12430 AT4G13190 AT4G37560 AT4G39890 glycosyltransferase family, contains Pfam profile: PF00201 UDPglucoronosyl and UDP-glucosyl trehalose-6-phosphate phosphatase, similar to trehalose-6-phosphate phosphatase (AtTPPB) protein kinase family, similar to serine/threonine kinase BNK1 formamidase - like protein, formamidase Ras family GTP-binding protein Figure 21. A working model of lipid second messenger signaling pathway in plant. OPTIMIZATION (G) for each edge {u, v} E L{u, v} DIJKSTRA(G, W, S) If L{u, v} < W{u, v} W{u, v} NULL Figure 22 is the refined architecture of this pathway. We can see that this path begins with AT4G39890, a G protein and ends with AT4G13190, a protein kinase, which could trigger the intracellular responses. 91
107 Figure 22. The refined architecture of the PLD related signaling transduction pathway in Arabidopsis. 4.4 Identification of Functional Modules through Clustering Biological Network Cluster analysis is an effective methodology for the extraction of functional modules from biological interaction networks. Clustering can be defined as the grouping of objects based on sharing of measurable and discrete properties. Based on the functional similarity information in the network obtained from multiple sources of highthroughput data, we applied the Markov cluster (MCL) algorithm to identify functional modules Markov Cluster Algorithm Markov cluster (MCL) algorithm is a clustering algorithm for graphs based on simulation of flow expansion and flow contraction in graphs (Dongen 2000). MCL is different from the classical clustering methods such as K-Means clustering, hierarchical clustering, Support Vector Machine (SVM) etc. (Everitt, 1993). In such classical 92
108 methods, the entities are represented by vectors of numerical scores (vector model). The (dis)similarity between two elements is in this case defined in terms of a measure on the difference between the vectors that are associated with the elements. In the setting of graphs, the relationship between two elements is of the kind 'share a property or not' (graph model). In graph clustering, the goal is to find a clustering of nodes of a graph such that there are few edges in between different clusters, and many edges within each cluster on its own. In the vector model, the (dis)similarities between elements are immediately available and are dependent on geometric features such as geometric mean, separating hyperplanes, etc. The notion of a cluster is closely related to the density of the distribution of the vectors over the vector space. Clusters should induce regions of the vector space where the density is relatively high, and they should generally be separated by regions of the vector space where the density is relatively low. On the other hand, a graph is nothing more than a set of nodes with a notion of connectivity attached to it. Clusters cannot be measured in terms of the location of the nodes, they can only be measured in terms of the incidence relation defined on the Cartesian product of the node set. The basic idea underlying the MCL algorithm and process is that dense regions in graphs correspond with regions where the number of k-length paths is relatively large. Random walks of length k have higher probability for paths with beginning and ending in the same dense region than for other paths. This is especially true if one looks at the subset of all random walks departing from a specific node. If this node is situated in a dense region, random walks departing from it will in general have a tendency to stay in the same region. The MCL algorithm simulates random walks within a graph by an 93
109 iterative procedure of two operators called expansion and inflation. The expansion step corresponds with normal matrix multiplication. It takes the power of a stochastic matrix using the normal matrix product (i.e. matrix squaring). Inflation corresponds with taking the Hadamard power of a matrix. It is a contraction step. Thus, via expansion, nodes are able to see new neighbors; via inflation, favored neighbors are further promoted, and less favored neighbors are further demoted. Eventually, iterating expansion and inflation results in the separation of the graph into different segments and the collection of resulting segments is simply interpreted as clusters. MCL algorithm is available at with additional detail information. In a biological network, members of a module have more functional similarity or linkage to each other than to proteins in other modules (Hartwell et al. 1999, Rives and Galitski 2003). Due to this principle of modules, the flow within a module is strong, i.e. a random walk starting at any given protein in the module is more likely to linger within this module than to cross to another module. Flow between modules will be weaker than flow within a module as there are relatively few (if any) paths that cross two distinct functional modules. These properties of functional modules make them ideally suited to the MCL algorithm. The iterative process of inflation and expansion will remove this weak flow across modules, and promote the stronger flow within modules. Functional modules hidden in the network will be visible as the detected clusters through this bootstrapping procedure Clustering Biological Network for Module Identification We applied MCL algorithm to cluster the biological network to identify functional modules. Figure 23 is a flow chart about how this process works. The functional linkage 94
110 graph (Figure 23A) is constructed from protein binary interaction data, protein complex data and microarray data as described in section Figure 23B is the weighted matrix used as the input for clustering where each column of the matrix represents a given protein, and each entry in a column S ij represents a similarity between this protein i and another protein j. Its value is calculated as: S ij = 1/W ij (17) where W ij is the weight of edge as described in section This matrix is supplied to the MCL algorithm. The MCL algorithm uses iterative rounds of expansion and inflation (explained earlier) to promote flow through the graph where it is strong, and remove flow where it is weak. This process terminates when equilibrium has been reached, i.e. further rounds of expansion and inflation leave the matrix unaltered. Figure 23: The flow chart of network clustering. (A) An example of protein functional linkage graph for six proteins (A-F). (B) The weighted matrix as the input of MCL clustering. (C) Identification of functional modules. 95
111 3990 interactions were selected as the confident interactions for clustering if they satisfied the following criteria; (1) the interaction is overlapped between protein binary interaction and protein complex interaction; or (2) gene expression profile correlation coefficient is >= 0.9. Overall 86 clusters were identified and each cluster had at least four components. To explore the biological roles of clusters, we analyzed the available functional annotation of yeast genes. We found that genes belonging to the same cluster have a consistent biological functional annotation indicating the modularity of cellular networks. Figure 24 presents examples of functional modules: (A) AP-1 adaptor complex (Yeung et al. 1999); (B) the transcription regulation with the involvement of signal transduction consisting of transient interactions; (C) a combined type of functional module consisting of complex and transient interactions. A protein complex is a molecular machine where several protein components bind each other at the same place and time (e.g., ribosome, histones, polymerases, etc.). On the contrary, a dynamic functional module consists of a few proteins that control or perform a particular cellular function through interactions between themselves. These proteins do not necessarily interact at the same time and place, or form a macromolecular complex. Our method successfully discovers both complexes and dynamic modules but does not distinguish between the two types of module. Figure 24C shows a combined type of functional module consisting of protein complexes and dynamic modules. Gene products of YPR037C, YLR321C, YCR052W and YMR091C are members of the complex with the capacity to remodel the structure of chromatin, termed RSC (Carins et al. 1996). 96
112 Figure 24: Examples of the categories of discovered functional modules. (A) AP-1 adaptor complex that links clathrin to the membrane surface of a vesicle. The five proteins are different chains or subunits of the complex. (B) A dynamic functional module in term of a signal transduction cascade that includes a transcriptional activator, a protein phosphatase, a vaculolar sorting protein and two unannotated proteins. (C) The combined type of functional module with protein RSC complex and transient interactions. In the figure, red represents the unannotated proteins and green represents annotated proteins. The patterns of lines represent different interaction types: solid line represents protein interaction and dotted line represents co-expression. The detail information of genes in each module is available at (A comes from cluster 42, B comes from cluster 48 and C comes from cluster 36.) 97
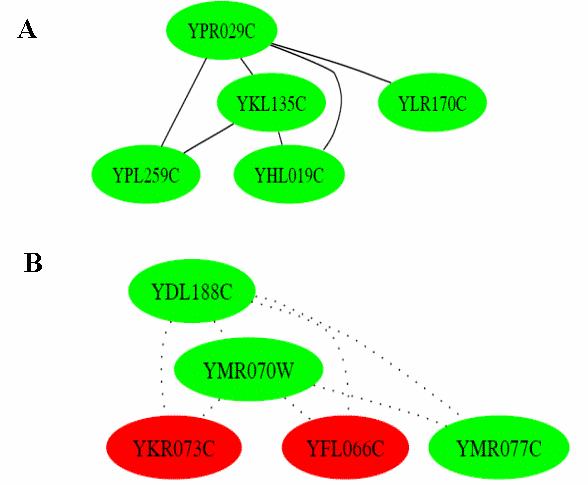
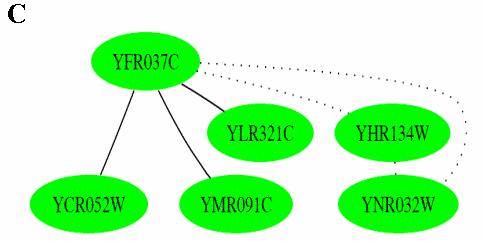
113 98
114 This complex catalyzes the transfer of a histone octamer from a nucleosome core particle to naked DNA, involving many essential cellular processes. The protein of YNR032W is serine/threonine protein phosphatase, forming a transient interaction with YFR037C. This module is detected by integrating protein interactions data and microarray co-expression data since one single type of high-throughput does not suffice to identify this kind of modules. These different categories of modules provide a relatively good coverage of biological process in various kinds of responses to the environment. It also indicates the power of data integration in order to further characterize the nature of cellular network. As described in section 3.3.1, we used GO biological process to define protein function and assigned GO biological process index to annotated proteins in yeast. Thus, to examine function consistence of modules, we analyzed the GO biological process indices of proteins in one identified cluster. Table 13 is the GO indices of proteins in cluster 4. This cluster is the small nucleolar ribonucleoprotein complex (Dragon et al. 2002). Our analysis added three unannotated proteins to this cluster, ORFs: YLR409C, YJL069C and YKR060W (Figure 25) In Figure 24B, there also have two unannotated ORFs:YKR083C and YFL066C. Among 86 identified modules, there are 43 modules that contain unannotated proteins. Thus, identification of functional modules also provides a methodology to assign functions for hypothetical proteins. The function assignment is based on the information extracted from cellular interaction network and helps to understand protein function at the dynamic and systematical level. 99
115 Table 13: The GO indices of proteins in cluster 4, the small nucleolar ribonucleoprotein complex. A denotes annotated protein. P denotes the predicted function for unannotated proteins using the method developed in Chapter 3. The number in the parenthesis denotes the reliability score. Gene ID Name A/P GO Index 1 GO Index 2 YLR197W SIK1 A YLR129W DIP2 A YPL126W NAN1 A YPL129W TAF14 A YOL041C NOP12 A YJL109C UTP10 A YDR449C UTP6 A YER082C UTP7 A YMR093W UTP15 A YPL217C BMS1 A YGL171W ROK1 A YDL213C NOP6 A YKL099C UTP11 A YHR196W UTP9 A YKR060W P (0.98) (0.98) YJL069C P (0.89) (0.89) YLR409C P (0.98) (0.98) 100
116 Figure 25: The interaction graph of functional module: small nucleolar ribonucleoprotein complex. There are three unannotated ORFs: YLR409C, YJL069C and YKR060W. The edge represents protein-protein interaction. 101
117 In Table 13, we also list the predicted functions for unannotated proteins: YLR409C, YJL069C and YKR060W using the developed method in Chapter 3. We can see that the predicted functions are consistent well with the functional annotations of other components in this cluster. This proves the validation of our clustering method. It also shows the same nature of methodology for function prediction method developed in Chapter 3 and network clustering method developed in this chapter. The fundamental principle of both methods is to characterize the functional dependencies underlying multiple sources of high-throughput data. The consistency of two aspects (bottom-up approach and top-down approach) can be tackled to annotate protein function systematically and dynamically. The detail information of each identified module are available at as follows: (1) the assignment of GO biological process indices of each gene; (2) the linkage of each gene with SGD ( (3) the unannotated proteins of each module; (4) the graph of interaction network Discussion and Future Work The important advantage of our computational analysis is that we identified functional modules by integrating protein interactions and co-expressions that occur at different times and places. We demonstrated the presence of highly connected clusters of proteins in a biological network and supported the suggested modular architecture of biological networks (Hartwell et al. 1999). The complex cellular network is dissected into a set of units of function and organization, shedding insights into understanding the organization and dynamics of a living cell. 102
118 To indicate the statistical robustness of our methodology and explore the regulatory mechanisms of functional modules, future works are needed in the following two areas: (1) Estimates of the statistical significance of an identified module. For a module containing n proteins and m interactions, the random graphs will be generated to calculate the probability of such module. Thus, a P value can be calculated to validate the significance. (2) Cellular processes are regulated by transcription factors in large extent. The transcriptional networks were shown to be composed of a small set of network motifs whose limited patterns of interactions that recur in the cellular network significantly more often than in randomized networks (Milo et al. 2002, Shen-Orr et al. 2002). The convergent evolution that is seen in the transcription-regulatory network of diverse species towards the same motif types further indicate that motifs are indeed of direct biological relevance (Conant and Wagner 2003, Hinman et al. 2003). To analyze module motifs, we will screen the promoters of each module's gene set for over-represented DNA regulatory motifs. For each motif we will calculate the P value using hypergeometric probability of independence between the set of genes with the motif and the set of module genes. 103
119 Chapter 5: A Computational Study on the Signal Transduction Pathway for Amino Acid and Peptide Transport in Yeast: Bridging the Gap between High-throughput Data and Traditional Biology 5.1. Introduction The study of signal transduction pathways has an ever-increasing importance in biology in identifying essential elements and fundamental interaction mechanisms that enable cells to respond to their environment. Previous efforts have focused on discovery of genes/proteins responsible for a specific phenomenon and their functions. These studies have typically been conducted in some ad hoc manner and one gene at a time. The results, although accurate, are often only pieces of local information. It usually takes years of laboratory work before it is sufficient to put all the pieces together for a global model of a signal transduction pathway. On the other hand, the ever-increasing flow of high-throughput biological data, such as genome sequences, gene expression data, and protein-protein interaction data, are now publicly available. The massive volume of data is becoming the foundation for new biological discoveries, useful for providing valuable global information and generating hypotheses about gene functions and functional mechanisms. Signal transduction network has been modeled by the combination of protein-protein interaction data and gene expression data (Steffen et al 2002). However, when compared with the data generated in experiments designed to study a particular pathway, high-throughput data are generally noisy, containing many false positives and false negatives. A major challenge for bioinformatics is to integrate noisy highthroughput data with detailed studies from traditional biology, especially knowledge from 104
120 the literature, for constructing signal transduction pathway models. To address this challenge, we have developed a consensus computational framework of modeling biological pathway by combining various data mining techniques and tools and integrating high-throughput data and traditional biology data, which can efficiently utilize the maximal information while reducing the effect of noise. A major feature of our approach is to integrate various types of experimental data and computational tools for signal transduction pathway construction, since a single type of data, such as gene expression data, often does not provide sufficient information for full and accurate characterization of pathways. We have employed a consensus approach, where we apply a variety of data and methods to model a pathway in a global and comprehensive manner: (1) clustering analysis of genome-wide gene expression data to identify co-expressed genes, which might be in the same transcriptional pathway; (2) motif pattern analysis of regulatory sequences to generate a candidate list of co-regulated genes, some of which are possibly co-regulated by certain transcription factors with known binding motifs; (3) protein-protein interaction data to provide information about physical interactions among proteins, which allows the construction of a pathway at the cellular level through the integration of individual local biochemical steps; (4) protein sequences to predict the protein s function; and (5) subcellular localization to evaluate the predicted pathways from the protein-protein interaction map. We have applied this consensus approach to study the signal transduction pathway for amino acid and peptide transport in Saccharomyces cerevisiae. This pathway is essential for yeast cells to respond rapidly and adapt to changing nutritional conditions. A prerequisite for generating a proper physiological response is the ability to sense the 105
121 extracellular nutrient environment and to regulate gene expression through signal transduction pathways. As shown in Figure 26, previous genetic and biochemical experimental studies have shown that the Ssy1p-Ptr3p-Ssy5p (SPS) amino acid sensor system is required for amino acid-induced transcription of amino acid transporter genes (e.g., AGP1, BAP2, TAT1, TAT2) (Iraqui et al 1999) and the di/tri-peptide transporter, Ptr2p (De Boer et al 1998). A functional SPS sensor is also required for the regulation of GAP1, a nitrogen-regulated general amino acid transporter gene (Klasson et al 1999). Experimental evidence has also suggested that PTR2 expression is suppressed by the binding of Cup9p (a transcriptional repressor). This regulation is mediated by the ubiquitination of Cup9p by the Ptr1p-Ubc2p complex (Turner et al 2000), where Ptr1p is also named Ubr1p. Other components (not included in Figure 26) shown to be involved in the signal transduction pathway include the SCF Grr1 ubiquitin-ligase complex (Bernard and André 2001), and the transcription factor Uga35p/Dal81p (Bernard and André 2001). Furthermore, transcription factors required for SPS-controlled amino acid transporters include TUP1 and LEU3 (Nielsen et al 2001), and a genetic screen recently identified six additional components (Asi1p, Asi2p, Asi3p, Gsp5p, Bul1p, and Bro1p) involved the SPS sensor-mediated regulation of amino acid uptake (Forsberg et al 2001). Finally, it was recently demonstrated that a signal from the SPS complex might be mediated by direct proteolytic processing of Stp1p and Stp2p that transactivate SPS-sensor target genes (Andréasson et al 2002). It is obvious that the SPS sensor system is quite complex, and individual amino acid or peptide transporters may not be regulated in the same manner. Other unidentified proteins may be involved in the pathway and this pathway may be interrelated with other signal transduction pathways. 106
122 Figure 26: A part of the model of regulation pathways of amino acid and peptide transporters built from the literature. Extracellular amino acids ( ) are sensed by Ssy1p. The signal is mediated by Ptr3p and Ssy5p, and subsequently regulates the transcription of peptide and amino acid transporters. In this study, we will present a global model of the signal transduction pathway for amino acid and peptide transport in yeast based on the integration of high-throughput data analyses and traditional experimental data. Using various high-throughput data to form a graph, we first constructed possible paths for signal transduction from the SPS amino acid sensor to transcription factors that are related to amino acid/peptide transport using the Dijkstra s algorithm (Cormen 1989) in an automated fashion. Retrieved literature information together with protein functional annotation and subcellular location prediction provided additional data to fill gaps for the pathway construction and to select the most probable pathway. Our gene expression data analysis and sequence analyses of 107
123 regulatory regions supported the constructed signal transduction pathway model. We believe that the developed computational framework could be applicable to studies of other biological pathways, and it could assist the full characterization of a biological pathway. 5.2 Methods Pathway Construction from High-Throughput Data The detailed method and its assessment for automated construction of a signal transduction pathway are described in Chapter Transcriptional Factor Binding Motif Identification Yeast cells respond to environmental changes by regulating the expression of specific genes throughout the genome. This dynamic expression is mediated by transcription factors. We collected a set of transcription factors from the literature (see Table 14), which are known to control the expression of transporter genes or amino acid biosynthesis genes. The complete yeast genome sequence was downloaded from NCBI ( The upstream 600 base pairs (bp) regulatory region sequence from the translation start site was used for the transcriptional binding motif search (Cho et al 1998; Spellman et al 1998). If the interval distance between two ORFs was shorter than 600 bp, we took the interval sequence as the regulatory region. An exact string match method was used to search the transcriptional factor binding sites in the regulatory region sequence. 108
124 Table 14: Transcription factors involved in the regulation of amino acid transport or amino acid synthesis. Name Function Consensus binding site motif A nuclear protein with zinc finger GCCGN2-7CGGC or domains; plays an essential role in CGGCN2-7CGGC induction of amino acid transporter gene BAP2 Stp1p (Jorgensen et al 1997) Abf1p (De Boer et al 2000) Leu3p (Noel et al 1998) Gcn4p (Natarajan et al 2001) Gln3p, Dal80p, Gat1p (Coffman et al, 1996, 1997, Merwe et al 2001) Cup9p (Hauser et al 2001, Lee et al 2002). Dal81p (Iraqui et al, 1999, Garcia et al 2000) Stp2p (De Boer et al 2000, Lee et al 2002) Rtg3p (Rothermel et al, Komeili et al, 2000, Crespo et al, 2002, Zinc finger transcription factor of the Zn (2)-Cys (6) binuclear cluster domain type acting as an activator or as a repressor Regulates genes involved in branched chain amino acid biosynthesis BZIP transcriptional activator of amino acid biosynthetic gene in multiple pathways Regulation of NCR (nitrogen catabolite repression) regulated genes, GATA factors Transcription repressor A transcription factor of the Cys6-Zn2 family participating in nitrogen induction pathway Protein with considerable similarity to Stp1p involved in the induction of transporter expression Basic helix-loop-helix/leucine zipper protein transcription factors in yeast RTCRBYHNNNACG Where R: A or G Y: C or T; B: G or C or T CGGRACCGG Where R: A or G TGACTC or GAGTCA UAS NTR core sequence: GAT (A/T)AG TTTKYTKTTYNYTTKTY WTTKTTTTTYTTTTTNT TTGACGTKRTT GGTCAC 109
125 5.2.3 Gene Expression Data and Clustering The microarray data used in this paper was from Gasch et al (2000). The data set explored the transcriptional response to amino acid starvation and nitrogen depletion. We used the program EXCAVATOR ( for clustering analysis of gene-expression microarray data (Xu et al 2002). This program is based on a new framework for representing gene expression data, i.e., the minimum spanning tree in graph theory. Through this data representation, an expression dataclustering problem is reduced to a tree-partitioning problem without losing essential information for the purpose of clustering. EXCAVATOR then applies an algorithm that mathematically guarantees to find globally optimal clustering efficiently for a general objective function. 5.3 Results This section presents the results of three categories of studies: construction of signal transduction pathway, regulatory region analysis, and gene expression analysis for differentially expressed genes in amino acid and peptide transport. To construct the signal transduction pathway, we used literature information to set corner stones, i.e., the amino acid sensor SPS as one end of the pathway and related transcription factors at the other end. Then we used large-scale data to connect the two ends by the Dijkstra s algorithm, and as a result, identified the protein-interaction chains in the pathway. A manual process was used to assess and refine path based on additional literature information. Regulatory region analysis and gene expression analysis were used to study the downstream of the pathway model by showing how the selected transcription factors controlled the amino 110
126 acid transporters and how cross-talk between the amino acid transport pathway and other related pathways are achieved Construction of A Signal Transduction Pathway for Amino Acid and Peptide Transport Based on the approach illustrated above, we constructed the following signal transduction pathways regulating the expression of genes for amino acid and peptide transport (see Figure 27): (1) Pathways between the amino acid sensor SPS and the related transcription factors for amino acid and peptide transport are: Ptr3p-YPL158C-Jsn1p-Csn1p-Stp1p; Ptr3p-YPL158C-Jsn1p-Cdc28p-Clb3-Sho1p-Gln3p; Ptr3p-YPL158C-Jsn1p-Vma22p-Dal80p. Ptr3p-YPL158C-Jsn1p-Fyv7p-Gat1p. (2) Pathways between the amino acid sensor SPS and energy metabolism and glucose metabolism are: Ptr3p-Aut10p-Mailp-Rtg3p; Ssy5p-Tup1p-Ssn6p-Mig1p. (3) Ubiquitin related pathways induced by: Ptr3p-YPL158C-Jsn1p-Cdc28p-Cln2p-Cdc53p-SCF Rrr1 ; Ptr3p-YPL158C-Jsn1p-Cdc28p-Ubp15p. (4) The feedback pathways are: Dipeptide-Ptr1p-Ubc2p-Cup9p-Ptr2p; Dipeptide-Ptr1p-Ubp15p 111
 represent protein-protein interactions are identified by various experimental techniques.")
127 Figure 27: Our constructed model for the signal transduction pathway of amino acid and peptide transporters, where the different grayscale indicate different pathways. The different line patterns (,, and ) represent protein-protein interactions are identified by various experimental techniques. For example, [1] the interaction between Ptr3p and Aut10p (Geprgakopoulos et al. 2001) and [2] the interaction between Ptr3p and YPL158C (Narita 2002) are from low-throughput yeast two-hybrid experiments. The high-throughput yeast two-hybrid data are from Ito et al 2001, Tong et al 2002 and Uetz et al 2000, and high-throughput protein complex data are from Gavin et al 2002 and Ho et al The ovals represent transcription factors and the boxes represent intermediate proteins between the SPS sensor and transcription factors. 112
128 Dipeptide-Ptr1p-Ubc2p-Ubc4p-Pre1p-Rpn6p-Gcn4p. Table 15 shows the information of functions and subcellular localizations of related proteins in the above pathways, which was used to validate those pathways. The selection of transcription factors involved in the signal transduction pathways is confirmed by literature information. Stp1p regulates the amino acid transporter BAP2 and BAP3 when the environment is rich in amino acids in S. cerevisiae (Nielsen et al 2001). Yeast cells also regulate amino acid transport based on the availability of nitrogen by a mechanism called nitrogen catabolite repression (NCR) (Coffman et al 1996). Many nitrogen catabolic genes, in addition to the general amino acid transporter GAP1, are transcriptionally induced in the presence of preferred nitrogen sources such as glutamine, asparagines and ammonia and depressed by the poor nitrogen sources like proline. Gln3p, Gat1p and Dal80p have been identified to participate in the NCR at the transcription level where Gln3p and Gat1p is a positive factor and Dal80p is a negative one. NCR regulation requires the UAS NTR, which is both necessary and sufficient for NCR regulation. In section we identified the amino acid transporter genes whose regulatory regions contained Stp1p and/or UAS NTR binding sites. The signal transduction pathways from SPS to transcription factors showed that multiple pathways regulate the expression levels of amino acid transporter genes by sensing environmental nutrient conditions. That is, when the environment is rich with amino acid, the specific amino acid transporters such as Bap2p, Bap3p and Tat1p, the broad-specificity amino acid transporter Agp1p and the peptide transporter Ptr2p will be induced; the general amino acid transporters, such as Gap1p, will be induced when the medium contains a poor nitrogen source. 113
129 Table 15: The protein functions and subcellular localization information of the proteins in the constructed signal transduction pathways. Gene name ORF ID Protein function Protein subcellular localization TUP1 YCR084C glucose repression regulatory protein nucleus SSN6 YBR112C general repressor of transcription nucleus MIG1 YGL035C transcription factor for glucose repression nucleus AUT10 YFR021W involved in amino acid signaling pathways cytoplasm MAI1 YPL100W similarity to YFR021W 70% nucleus RTG3 YBL103C transcription factor regulates CIT2 nucleus YPL158C YPL158C Unknown 48% nucleus 26% cytoplasm CDC28 YBR160W cyclin-dependent protein kinase cytoplasm, nucleus CLB3 YDL155W cyclin-dependent protein kinase regulator cytoplasm SHO1 YER118C involved in stress signal transduction 34% plasma membrane pathway 22% nucleus JSN1 YJR091C mrna binding, control transcript-specific 65% nucleus rates of degradation VMA22 YHR060W protein complex assembly 78 % nucleus CNS1 YBR155W weak similarity to STI1p 65 % nucleus PTR1 YGR184C ubiquitin protein ligase cytoplasm UBC2 YGL058W ubiquitin conjugating enzyme nucleus UBC4 YBR082C ubiquitin conjugating enzyme cytoplasm PRE1 YER012W 20S proteasome subunit nucleus RPN6 YDL097C regulatory particle of the proteasome nucleus FYV7 YLR068W function unknown 82.6% nuclear UBP15 YMR304W ubiquitin-specific protease cytoplasm CLN2 YPL256C Cyclin-dependent protein kinase cytoplasm CDC53 YDL132W ubiquitin protein ligase nuclear 114
130 Ubiquitin-mediated proteolysis is now widely recognized as an important regulatory process in eukaryotes. It is reported that ubiquitin and SCF Grr1 complex are involved in the signaling transduction pathway activated by external amino acids (Bernard and Andre 2001). Based on the protein-protein interaction data we found the pathways: Ptr3p-YPL158C-Jsn1p-Cdc28p-Cln2p-Cdc53p-SCF Grr1 ; Ptr3p-YPL158C-Jsn1p-Cdc28p-Ubp15p. The results support that SCF Grr1 and/or other ubiquitin system proteins were involved in the external amino acid signaling pathway. However, their precise roles remain to be determined. An interesting feature of PTR2 expression is that it is regulated by two different ubiquitin ligases: extracellular amino acid induction pathway (SCF Grr1 complex) and intracellular peptide induction pathway (Ptr1p/Cup9p). The positive feedback pathway of dipepide-ptr1p-ubc2p-cup9p-ptr2p was constructed based on experimental data (Turner et al 2000). Imported peptides bind to Ptr1p and accelerate the Ptr1pdependent degradation of Cup9p (repressor of Ptr2p), further activating PTR2 and increasing the cell s capacity to import peptides. Interestingly, we also constructed a pathway, dipeptide-ptr1p-ubc2p-ubc4p-pre1p-rpn6p-gcn4p, where Gcn4p is an activator of amino acid biosynthesis. This suggests a negative control for amino acid synthesis from peptide import. This is not surprising, since when the peptides are imported from environment, the cell would not need to synthesize amino acids. Hence, the activity of amino acid synthesis should be reduced by sufficient peptide supply. The signal transduction pathways between SPS and energy metabolism and glucose metabolism were also detected: Ptr3p-Aut10p-Mailp-Rtg3p, where Rtg3p is a transcription factor for energy metabolism (Sekito et al. 2000), and Ssy5p-Tup1p-Ssn6p- 115
131 Mig1p, where Mig1p is a transcription factor for glucose metabolism, (Shankar et al. 1996). The latter was characterized by early studies (Shankar et al. 1996). Amino acid transport requires energy, and that is probably why it couples to energy metabolism. The cross-talk between the glucose metabolism and the amino acid transport was also suggested by experimental evidence (Nartita 2002). The map in Figure 27 consists of new pathways that were not characterized by previous experiments yet and previously known pathways such as Ssy5p-Tup1p-Ssn6p- Mig1p (Shankar et al. 1996) and dipeptide-ptr1p-ubc2p-cup9p-ptr2p (Turner et al. 2000). In Figure 27 the experimental techniques used to identify each protein-protein interaction were also displayed Transcriptional Factor Binding Site Analysis In yeast, there are 19 amino acid transporters and one di/tri-peptide transporter. The 600 bp upstream region of each gene was searched to find the binding sites for the transcription factors in Table 16. The binding motifs of 11 transcription factors listed in Table 16 were retrieved from the literature. We found that in general, Stp1p binding site and UAS NTR binding site are not over-represented in the promoter region of the same amino acid transporter gene except AGP1. The Stp1p binding site was represented in the promoters of the specific amino acid transporter genes such as BAP2, BAP3, and TAT1. It is interesting to note that none of the amino acids transported by those transporters contain nitrogen atoms in their side chains, i.e., these transporters cannot facilitate nitrogen entry into yeast. For the general amino acid transporters, i.e., GAP1, AGP2 and AGP3, no Stp1p binding motif was found. However, AGP1 has 2 Stp1p binding sites and 3 UAS NTR binding sites in the regulatory region. 116
132 Table 16: The number of transcription factor binding motifs found in the regulatory regions of amino acid and peptide transporters. Gene Function STP1 ABF1 LEU3 GCN4 UAS NTR CUP9 Name GAP1 general amino acid permease 8 AGP2 general amino acid permease 2 with broad substrate specificity AGP3 general amino acid permease with broad substrate specificity BAP2 Leu/Val/Ile permease BAP3 valine transporter 2 TAT1 valine and tyrosine permease 4 1 TAT2 tryptophan permease AGP1 broad-specificity amino acid permease GNP1 glutamine permease CAN1 arginine permease 2 2 HIP1 histidine permease 4 LYP1 lysine permease PUT4 proline permease ALP1 basic amino acid permease DIP5 dicarboxylic amino acid 2 permease HNM1 choline transporter 1 2 SAM3 S-adenosyl Methionine 1 permease MMP1 S-Methyl Methionine permease 1 PTR2 peptide transporter
133 In contrast, GAP1 regulatory region contains 8 UAS NTR binding sites. UAS NTR is the consensus sequence for GATA-type transcriptional factors Gln3p, Gat1p/Nil2p, and Dal80p. GATA factor gene expression is highly regulated by the GATA factors themselves in an interdependent manner: DAL80 expression is Gln3p and Gat1p dependent and Dal80p regulated; GAT1 expression is largely Gln3p independent and Dal80p regulated (Coffman et al 1997). Gene expression depends on recognition of specific promoter sequences by transcriptional regulatory proteins and was controlled by the transcriptional regulatory network. The different transcription factors are triggered by the same or different signal transduction pathways. This result from transcription factor binding site analysis is consistent with the constructed amino acid transporter gene regulation pathways, i.e., Stp1p and Dal80p was in the signal transduction pathway in response to the rich amino acids in the environment; Gln3p, Dal80p and Gat1p were involved in the signal transduction pathways induced by poor nitrogen source Gene Expression Data Cluster Analysis To further understand the signal transduction and transcription, we selected the ORFs whose expression level changed by more than 2.5 fold from yeast microarray data in response to amino acid starvation and nitrogen depletion (Gasch et al 2000), then clustered them using EXCAVATOR (Figure 28). Two clusters, 2 and 9, were not only co-expressed but were probably also co-regulated based on the common regulatory binding motifs in the upstream regions of the genes in the same cluster. Moreover, the genes in cluster 2 or 9 have a similar function. All genes of cluster 2 are related to amino acid biosynthesis and have binding sites for the transcription factors Leu3p and Gcn4p. 118

134 Figure 28: Results from the clustering of microarray data from yeast cells grown under conditions of amino acid starvation and nitrogen depletion. 303 differentially expressed genes in total were clustered into 9 clusters by EXACAVTOR. The genes in clusters 2 and 9 were not only co-expressed but also co-regulated. In cluster 2, the genes were related to amino acid synthesis; the genes in cluster 9 were amino acid transporters. The graphs on the left and center show the gene expression, where green color indicates down regulation and red color indicates up regulation. The graphs on the right show the binding sites matched with the consensus sequence of transcription factors (Stp1p, Leu3p and Gcn4p) at the upstream regions of the genes in clusters 2 and
Bioinformatics 2. Yeast two hybrid. Proteomics. Proteomics
 GENOME Bioinformatics 2 Proteomics protein-gene PROTEOME protein-protein METABOLISM Slide from http://www.nd.edu/~networks/ Citrate Cycle Bio-chemical reactions What is it? Proteomics Reveal protein Protein
Proteomics. Yeast two hybrid. Proteomics - PAGE techniques. Data obtained. What is it?
 Proteomics What is it? Reveal protein interactions Protein profiling in a sample Yeast two hybrid screening High throughput 2D PAGE Automatic analysis of 2D Page Yeast two hybrid Use two mating strains
Genome-Scale Gene Function Prediction Using Multiple Sources of High-Throughput Data in Yeast Saccharomyces cerevisiae ABSTRACT
 OMICS A Journal of Integrative Biology Volume 8, Number 4, 2004 Mary Ann Liebert, Inc. Genome-Scale Gene Function Prediction Using Multiple Sources of High-Throughput Data in Yeast Saccharomyces cerevisiae
Cellular Function Prediction for Hypothetical Proteins Using High-Throughput Data
 University of Tennessee, Knoxville Trace: Tennessee Research and Creative Exchange Masters Theses Graduate School 8-2003 Cellular Function Prediction for Hypothetical Proteins Using High-Throughput Data
Introduction to Bioinformatics
 CSCI8980: Applied Machine Learning in Computational Biology Introduction to Bioinformatics Rui Kuang Department of Computer Science and Engineering University of Minnesota kuang@cs.umn.edu History of Bioinformatics
Computational methods for predicting protein-protein interactions
 Computational methods for predicting protein-protein interactions Tomi Peltola T-61.6070 Special course in bioinformatics I 3.4.2008 Outline Biological background Protein-protein interactions Computational
networks in molecular biology Wolfgang Huber
 networks in molecular biology Wolfgang Huber networks in molecular biology Regulatory networks: components = gene products interactions = regulation of transcription, translation, phosphorylation... Metabolic
Systems biology and biological networks
 Systems Biology Workshop Systems biology and biological networks Center for Biological Sequence Analysis Networks in electronics Radio kindly provided by Lazebnik, Cancer Cell, 2002 Systems Biology Workshop,
Network Biology: Understanding the cell s functional organization. Albert-László Barabási Zoltán N. Oltvai
 Network Biology: Understanding the cell s functional organization Albert-László Barabási Zoltán N. Oltvai Outline: Evolutionary origin of scale-free networks Motifs, modules and hierarchical networks Network
Types of biological networks. I. Intra-cellurar networks
 Types of biological networks I. Intra-cellurar networks 1 Some intra-cellular networks: 1. Metabolic networks 2. Transcriptional regulation networks 3. Cell signalling networks 4. Protein-protein interaction
Computational Analyses of High-Throughput Protein-Protein Interaction Data
 Current Protein and Peptide Science, 2003, 4, 159-181 159 Computational Analyses of High-Throughput Protein-Protein Interaction Data Yu Chen 1, 2 and Dong Xu 1, 2 * 1 Protein Informatics Group, Life Sciences
Cell biology traditionally identifies proteins based on their individual actions as catalysts, signaling
 Lethality and centrality in protein networks Cell biology traditionally identifies proteins based on their individual actions as catalysts, signaling molecules, or building blocks of cells and microorganisms.
Evidence for dynamically organized modularity in the yeast protein-protein interaction network
 Evidence for dynamically organized modularity in the yeast protein-protein interaction network Sari Bombino Helsinki 27.3.2007 UNIVERSITY OF HELSINKI Department of Computer Science Seminar on Computational
Predicting Protein Functions and Domain Interactions from Protein Interactions
 Predicting Protein Functions and Domain Interactions from Protein Interactions Fengzhu Sun, PhD Center for Computational and Experimental Genomics University of Southern California Outline High-throughput
Computational approaches for functional genomics
 Computational approaches for functional genomics Kalin Vetsigian October 31, 2001 The rapidly increasing number of completely sequenced genomes have stimulated the development of new methods for finding
Frequent Pattern Finding in Integrated Biological Networks
 University of Tennessee, Knoxville Trace: Tennessee Research and Creative Exchange Doctoral Dissertations Graduate School 5-2005 Frequent Pattern Finding in Integrated Biological Networks Xinxia Peng University
Bioinformatics. Dept. of Computational Biology & Bioinformatics
 Bioinformatics Dept. of Computational Biology & Bioinformatics 3 Bioinformatics - play with sequences & structures Dept. of Computational Biology & Bioinformatics 4 ORGANIZATION OF LIFE ROLE OF BIOINFORMATICS
Tiffany Samaroo MB&B 452a December 8, Take Home Final. Topic 1
 Tiffany Samaroo MB&B 452a December 8, 2003 Take Home Final Topic 1 Prior to 1970, protein and DNA sequence alignment was limited to visual comparison. This was a very tedious process; even proteins with
Written Exam 15 December Course name: Introduction to Systems Biology Course no
 Technical University of Denmark Written Exam 15 December 2008 Course name: Introduction to Systems Biology Course no. 27041 Aids allowed: Open book exam Provide your answers and calculations on separate
An introduction to SYSTEMS BIOLOGY
 An introduction to SYSTEMS BIOLOGY Paolo Tieri CNR Consiglio Nazionale delle Ricerche, Rome, Italy 10 February 2015 Universidade Federal de Minas Gerais, Belo Horizonte, Brasil Course outline Day 1: intro
Lecture Notes for Fall Network Modeling. Ernest Fraenkel
 Lecture Notes for 20.320 Fall 2012 Network Modeling Ernest Fraenkel In this lecture we will explore ways in which network models can help us to understand better biological data. We will explore how networks
The geneticist s questions
 The geneticist s questions a) What is consequence of reduced gene function? 1) gene knockout (deletion, RNAi) b) What is the consequence of increased gene function? 2) gene overexpression c) What does
Comparative Network Analysis
 Comparative Network Analysis BMI/CS 776 www.biostat.wisc.edu/bmi776/ Spring 2016 Anthony Gitter gitter@biostat.wisc.edu These slides, excluding third-party material, are licensed under CC BY-NC 4.0 by
Biological Networks. Gavin Conant 163B ASRC
 Biological Networks Gavin Conant 163B ASRC conantg@missouri.edu 882-2931 Types of Network Regulatory Protein-interaction Metabolic Signaling Co-expressing General principle Relationship between genes Gene/protein/enzyme
Cellular Biophysics SS Prof. Manfred Radmacher
 SS 20007 Manfred Radmacher Ch. 12 Systems Biology Let's recall chemotaxis in Dictiostelium synthesis of camp excretion of camp external camp gradient detection cell polarity cell migration 2 Single cells
Biological Networks: Comparison, Conservation, and Evolution via Relative Description Length By: Tamir Tuller & Benny Chor
 Biological Networks:,, and via Relative Description Length By: Tamir Tuller & Benny Chor Presented by: Noga Grebla Content of the presentation Presenting the goals of the research Reviewing basic terms
Computational Genomics. Systems biology. Putting it together: Data integration using graphical models
 02-710 Computational Genomics Systems biology Putting it together: Data integration using graphical models High throughput data So far in this class we discussed several different types of high throughput
Cellular function prediction and biological pathway discovery in Arabidopsis thaliana using microarray data
 Int. J. Bioinformatics Research and Applications, Vol. 1, No. 3, 2006 335 Cellular function prediction and biological pathway discovery in Arabidopsis thaliana using microarray data Trupti Joshi Digital
Understanding Science Through the Lens of Computation. Richard M. Karp Nov. 3, 2007
 Understanding Science Through the Lens of Computation Richard M. Karp Nov. 3, 2007 The Computational Lens Exposes the computational nature of natural processes and provides a language for their description.
Computational Biology: Basics & Interesting Problems
 Computational Biology: Basics & Interesting Problems Summary Sources of information Biological concepts: structure & terminology Sequencing Gene finding Protein structure prediction Sources of information
Map of AP-Aligned Bio-Rad Kits with Learning Objectives
 Map of AP-Aligned Bio-Rad Kits with Learning Objectives Cover more than one AP Biology Big Idea with these AP-aligned Bio-Rad kits. Big Idea 1 Big Idea 2 Big Idea 3 Big Idea 4 ThINQ! pglo Transformation
Supplementary online material
 Supplementary online material A probabilistic functional network of yeast genes Insuk Lee, Shailesh V. Date, Alex T. Adai & Edward M. Marcotte DATA SETS Saccharomyces cerevisiae genome This study is based
CISC 636 Computational Biology & Bioinformatics (Fall 2016)
") CISC 636 Computational Biology & Bioinformatics (Fall 2016) Predicting Protein-Protein Interactions CISC636, F16, Lec22, Liao 1 Background Proteins do not function as isolated entities. Protein-Protein
CISC 636 Computational Biology & Bioinformatics (Fall 2016) Predicting Protein-Protein Interactions CISC636, F16, Lec22, Liao 1 Background Proteins do not function as isolated entities. Protein-Protein
Genome Annotation. Bioinformatics and Computational Biology. Genome sequencing Assembly. Gene prediction. Protein targeting.
 Genome Annotation Bioinformatics and Computational Biology Genome Annotation Frank Oliver Glöckner 1 Genome Analysis Roadmap Genome sequencing Assembly Gene prediction Protein targeting trna prediction
Big Idea 1: The process of evolution drives the diversity and unity of life.
 Big Idea 1: The process of evolution drives the diversity and unity of life. understanding 1.A: Change in the genetic makeup of a population over time is evolution. 1.A.1: Natural selection is a major
Supplementary Information
 Supplementary Information For the article"comparable system-level organization of Archaea and ukaryotes" by J. Podani, Z. N. Oltvai, H. Jeong, B. Tombor, A.-L. Barabási, and. Szathmáry (reference numbers
AP Curriculum Framework with Learning Objectives
 Big Ideas Big Idea 1: The process of evolution drives the diversity and unity of life. AP Curriculum Framework with Learning Objectives Understanding 1.A: Change in the genetic makeup of a population over
Computational Systems Biology
 Computational Systems Biology Vasant Honavar Artificial Intelligence Research Laboratory Bioinformatics and Computational Biology Graduate Program Center for Computational Intelligence, Learning, & Discovery
86 Part 4 SUMMARY INTRODUCTION
 86 Part 4 Chapter # AN INTEGRATION OF THE DESCRIPTIONS OF GENE NETWORKS AND THEIR MODELS PRESENTED IN SIGMOID (CELLERATOR) AND GENENET Podkolodny N.L. *1, 2, Podkolodnaya N.N. 1, Miginsky D.S. 1, Poplavsky
Computational Structural Bioinformatics
 Computational Structural Bioinformatics ECS129 Instructor: Patrice Koehl http://koehllab.genomecenter.ucdavis.edu/teaching/ecs129 koehl@cs.ucdavis.edu Learning curve Math / CS Biology/ Chemistry Pre-requisite
Valley Central School District 944 State Route 17K Montgomery, NY Telephone Number: (845) ext Fax Number: (845)
 ext Fax Number: (845)") Valley Central School District 944 State Route 17K Montgomery, NY 12549 Telephone Number: (845)457-2400 ext. 18121 Fax Number: (845)457-4254 Advance Placement Biology Presented to the Board of Education
Valley Central School District 944 State Route 17K Montgomery, NY 12549 Telephone Number: (845)457-2400 ext. 18121 Fax Number: (845)457-4254 Advance Placement Biology Presented to the Board of Education
A A A A B B1
 LEARNING OBJECTIVES FOR EACH BIG IDEA WITH ASSOCIATED SCIENCE PRACTICES AND ESSENTIAL KNOWLEDGE Learning Objectives will be the target for AP Biology exam questions Learning Objectives Sci Prac Es Knowl
Erzsébet Ravasz Advisor: Albert-László Barabási
 Hierarchical Networks Erzsébet Ravasz Advisor: Albert-László Barabási Introduction to networks How to model complex networks? Clustering and hierarchy Hierarchical organization of cellular metabolism The
Lecture 10: May 19, High-Throughput technologies for measuring proteinprotein
 Analysis of Gene Expression Data Spring Semester, 2005 Lecture 10: May 19, 2005 Lecturer: Roded Sharan Scribe: Daniela Raijman and Igor Ulitsky 10.1 Protein Interaction Networks In the past we have discussed
Towards Detecting Protein Complexes from Protein Interaction Data
 Towards Detecting Protein Complexes from Protein Interaction Data Pengjun Pei 1 and Aidong Zhang 1 Department of Computer Science and Engineering State University of New York at Buffalo Buffalo NY 14260,
Lecture 4: Yeast as a model organism for functional and evolutionary genomics. Part II
 Lecture 4: Yeast as a model organism for functional and evolutionary genomics Part II A brief review What have we discussed: Yeast genome in a glance Gene expression can tell us about yeast functions Transcriptional
Computational methods for the analysis of bacterial gene regulation Brouwer, Rutger Wubbe Willem
 University of Groningen Computational methods for the analysis of bacterial gene regulation Brouwer, Rutger Wubbe Willem IMPORTANT NOTE: You are advised to consult the publisher's version (publisher's
Genomics and bioinformatics summary. Finding genes -- computer searches
 Genomics and bioinformatics summary 1. Gene finding: computer searches, cdnas, ESTs, 2. Microarrays 3. Use BLAST to find homologous sequences 4. Multiple sequence alignments (MSAs) 5. Trees quantify sequence
Enduring understanding 1.A: Change in the genetic makeup of a population over time is evolution.
 The AP Biology course is designed to enable you to develop advanced inquiry and reasoning skills, such as designing a plan for collecting data, analyzing data, applying mathematical routines, and connecting
Integrative Protein Function Transfer using Factor Graphs and Heterogeneous Data Sources
 Integrative Protein Function Transfer using Factor Graphs and Heterogeneous Data Sources Antonina Mitrofanova New York University antonina@cs.nyu.edu Vladimir Pavlovic Rutgers University vladimir@cs.rutgers.edu
Graph Alignment and Biological Networks
 Graph Alignment and Biological Networks Johannes Berg http://www.uni-koeln.de/ berg Institute for Theoretical Physics University of Cologne Germany p.1/12 Networks in molecular biology New large-scale
hsnim: Hyper Scalable Network Inference Machine for Scale-Free Protein-Protein Interaction Networks Inference
 CS 229 Project Report (TR# MSB2010) Submitted 12/10/2010 hsnim: Hyper Scalable Network Inference Machine for Scale-Free Protein-Protein Interaction Networks Inference Muhammad Shoaib Sehgal Computer Science
Networks & pathways. Hedi Peterson MTAT Bioinformatics
 Networks & pathways Hedi Peterson (peterson@quretec.com) MTAT.03.239 Bioinformatics 03.11.2010 Networks are graphs Nodes Edges Edges Directed, undirected, weighted Nodes Genes Proteins Metabolites Enzymes
Analysis of Biological Networks: Network Robustness and Evolution
 Analysis of Biological Networks: Network Robustness and Evolution Lecturer: Roded Sharan Scribers: Sasha Medvedovsky and Eitan Hirsh Lecture 14, February 2, 2006 1 Introduction The chapter is divided into
CSCE555 Bioinformatics. Protein Function Annotation
 CSCE555 Bioinformatics Protein Function Annotation Why we need to do function annotation? Fig from: Network-based prediction of protein function. Molecular Systems Biology 3:88. 2007 What s function? The
2 Genome evolution: gene fusion versus gene fission
 2 Genome evolution: gene fusion versus gene fission Berend Snel, Peer Bork and Martijn A. Huynen Trends in Genetics 16 (2000) 9-11 13 Chapter 2 Introduction With the advent of complete genome sequencing,
STRING: Protein association networks. Lars Juhl Jensen
 STRING: Protein association networks Lars Juhl Jensen interaction networks association networks guilt by association protein networks STRING 9.6 million proteins common foundation Exercise 1 Go to http://string-db.org/
BMD645. Integration of Omics
 BMD645 Integration of Omics Shu-Jen Chen, Chang Gung University Dec. 11, 2009 1 Traditional Biology vs. Systems Biology Traditional biology : Single genes or proteins Systems biology: Simultaneously study
Introduction to Bioinformatics
 Systems biology Introduction to Bioinformatics Systems biology: modeling biological p Study of whole biological systems p Wholeness : Organization of dynamic interactions Different behaviour of the individual
Comparison of Protein-Protein Interaction Confidence Assignment Schemes
 Comparison of Protein-Protein Interaction Confidence Assignment Schemes Silpa Suthram 1, Tomer Shlomi 2, Eytan Ruppin 2, Roded Sharan 2, and Trey Ideker 1 1 Department of Bioengineering, University of
AP Biology Curriculum Framework
 AP Biology Curriculum Framework This chart correlates the College Board s Advanced Placement Biology Curriculum Framework to the corresponding chapters and Key Concept numbers in Campbell BIOLOGY IN FOCUS,
Campbell Biology AP Edition 11 th Edition, 2018
 A Correlation and Narrative Summary of Campbell Biology AP Edition 11 th Edition, 2018 To the AP Biology Curriculum Framework AP is a trademark registered and/or owned by the College Board, which was not
Bioinformatics Chapter 1. Introduction
 Bioinformatics Chapter 1. Introduction Outline! Biological Data in Digital Symbol Sequences! Genomes Diversity, Size, and Structure! Proteins and Proteomes! On the Information Content of Biological Sequences!
GLOBEX Bioinformatics (Summer 2015) Genetic networks and gene expression data
 Genetic networks and gene expression data") GLOBEX Bioinformatics (Summer 2015) Genetic networks and gene expression data 1 Gene Networks Definition: A gene network is a set of molecular components, such as genes and proteins, and interactions between
GLOBEX Bioinformatics (Summer 2015) Genetic networks and gene expression data 1 Gene Networks Definition: A gene network is a set of molecular components, such as genes and proteins, and interactions between
Robust Community Detection Methods with Resolution Parameter for Complex Detection in Protein Protein Interaction Networks
 Robust Community Detection Methods with Resolution Parameter for Complex Detection in Protein Protein Interaction Networks Twan van Laarhoven and Elena Marchiori Institute for Computing and Information
Self Similar (Scale Free, Power Law) Networks (I)
 Networks (I)") Self Similar (Scale Free, Power Law) Networks (I) E6083: lecture 4 Prof. Predrag R. Jelenković Dept. of Electrical Engineering Columbia University, NY 10027, USA {predrag}@ee.columbia.edu February 7, 2007
Self Similar (Scale Free, Power Law) Networks (I) E6083: lecture 4 Prof. Predrag R. Jelenković Dept. of Electrical Engineering Columbia University, NY 10027, USA {predrag}@ee.columbia.edu February 7, 2007
Preface. Contributors
 CONTENTS Foreword Preface Contributors PART I INTRODUCTION 1 1 Networks in Biology 3 Björn H. Junker 1.1 Introduction 3 1.2 Biology 101 4 1.2.1 Biochemistry and Molecular Biology 4 1.2.2 Cell Biology 6
Integrative Protein Function Transfer using Factor Graphs and Heterogeneous Data Sources
 Integrative Protein Function Transfer using Factor Graphs and Heterogeneous Data Sources Antonina Mitrofanova New York University antonina@cs.nyu.edu Vladimir Pavlovic Rutgers University vladimir@cs.rutgers.edu
Biological Concepts and Information Technology (Systems Biology)
") Biological Concepts and Information Technology (Systems Biology) Janaina de Andréa Dernowsek Postdoctoral at Center for Information Technology Renato Archer Janaina.dernowsek@cti.gov.br Division of 3D
Biological Concepts and Information Technology (Systems Biology) Janaina de Andréa Dernowsek Postdoctoral at Center for Information Technology Renato Archer Janaina.dernowsek@cti.gov.br Division of 3D
BioControl - Week 6, Lecture 1
 BioControl - Week 6, Lecture 1 Goals of this lecture Large metabolic networks organization Design principles for small genetic modules - Rules based on gene demand - Rules based on error minimization Suggested
11/24/13. Science, then, and now. Computational Structural Bioinformatics. Learning curve. ECS129 Instructor: Patrice Koehl
 Computational Structural Bioinformatics ECS129 Instructor: Patrice Koehl http://www.cs.ucdavis.edu/~koehl/teaching/ecs129/index.html koehl@cs.ucdavis.edu Learning curve Math / CS Biology/ Chemistry Pre-requisite
Proteomics. 2 nd semester, Department of Biotechnology and Bioinformatics Laboratory of Nano-Biotechnology and Artificial Bioengineering
 Proteomics 2 nd semester, 2013 1 Text book Principles of Proteomics by R. M. Twyman, BIOS Scientific Publications Other Reference books 1) Proteomics by C. David O Connor and B. David Hames, Scion Publishing
Integration of functional genomics data
 Integration of functional genomics data Laboratoire Bordelais de Recherche en Informatique (UMR) Centre de Bioinformatique de Bordeaux (Plateforme) Rennes Oct. 2006 1 Observations and motivations Genomics
AP Biology Essential Knowledge Cards BIG IDEA 1
 AP Biology Essential Knowledge Cards BIG IDEA 1 Essential knowledge 1.A.1: Natural selection is a major mechanism of evolution. Essential knowledge 1.A.4: Biological evolution is supported by scientific
Measuring TF-DNA interactions
 Measuring TF-DNA interactions How is Biological Complexity Achieved? Mediated by Transcription Factors (TFs) 2 Regulation of Gene Expression by Transcription Factors TF trans-acting factors TF TF TF TF
Bio 1B Lecture Outline (please print and bring along) Fall, 2007
 Fall, 2007") Bio 1B Lecture Outline (please print and bring along) Fall, 2007 B.D. Mishler, Dept. of Integrative Biology 2-6810, bmishler@berkeley.edu Evolution lecture #5 -- Molecular genetics and molecular evolution
Bio 1B Lecture Outline (please print and bring along) Fall, 2007 B.D. Mishler, Dept. of Integrative Biology 2-6810, bmishler@berkeley.edu Evolution lecture #5 -- Molecular genetics and molecular evolution
Clustering and Network
 Clustering and Network Jing-Dong Jackie Han jdhan@picb.ac.cn http://www.picb.ac.cn/~jdhan Copy Right: Jing-Dong Jackie Han What is clustering? A way of grouping together data samples that are similar in
Basic modeling approaches for biological systems. Mahesh Bule
 Basic modeling approaches for biological systems Mahesh Bule The hierarchy of life from atoms to living organisms Modeling biological processes often requires accounting for action and feedback involving
Introduction to Biology
 Introduction to Biology Course Description Introduction to Biology is an introductory course in the biological sciences. Topics included are biological macromolecules, cell biology and metabolism, DNA
Introduction to Bioinformatics. Shifra Ben-Dor Irit Orr
 Introduction to Bioinformatics Shifra Ben-Dor Irit Orr Lecture Outline: Technical Course Items Introduction to Bioinformatics Introduction to Databases This week and next week What is bioinformatics? A
Essential knowledge 1.A.2: Natural selection
 Appendix C AP Biology Concepts at a Glance Big Idea 1: The process of evolution drives the diversity and unity of life. Enduring understanding 1.A: Change in the genetic makeup of a population over time
SYSTEMS BIOLOGY 1: NETWORKS
 SYSTEMS BIOLOGY 1: NETWORKS SYSTEMS BIOLOGY Starting around 2000 a number of biologists started adopting the term systems biology for an approach to biology that emphasized the systems-character of biology:
METABOLIC PATHWAY PREDICTION/ALIGNMENT
 COMPUTATIONAL SYSTEMIC BIOLOGY METABOLIC PATHWAY PREDICTION/ALIGNMENT Hofestaedt R*, Chen M Bioinformatics / Medical Informatics, Technische Fakultaet, Universitaet Bielefeld Postfach 10 01 31, D-33501
Physical network models and multi-source data integration
 Physical network models and multi-source data integration Chen-Hsiang Yeang MIT AI Lab Cambridge, MA 02139 chyeang@ai.mit.edu Tommi Jaakkola MIT AI Lab Cambridge, MA 02139 tommi@ai.mit.edu September 30,
The architecture of complexity: the structure and dynamics of complex networks.
 SMR.1656-36 School and Workshop on Structure and Function of Complex Networks 16-28 May 2005 ------------------------------------------------------------------------------------------------------------------------
Major questions of evolutionary genetics. Experimental tools of evolutionary genetics. Theoretical population genetics.
 Evolutionary Genetics (for Encyclopedia of Biodiversity) Sergey Gavrilets Departments of Ecology and Evolutionary Biology and Mathematics, University of Tennessee, Knoxville, TN 37996-6 USA Evolutionary
Graph Theory Approaches to Protein Interaction Data Analysis
 Graph Theory Approaches to Protein Interaction Data Analysis Nataša Pržulj September 8, 2003 Contents 1 Introduction 2 1.1 Graph Theoretic Terminology................................. 3 1.2 Biological
 1 of 13 8/11/2014 10:32 AM Units: Teacher: APBiology, CORE Course: APBiology Year: 2012-13 Chemistry of Life Chapters 1-4 Big Idea 1, 2 & 4 Change in the genetic population over time is feedback mechanisms
USING BLAST TO IDENTIFY PROTEINS THAT ARE EVOLUTIONARILY RELATED ACROSS SPECIES
 USING BLAST TO IDENTIFY PROTEINS THAT ARE EVOLUTIONARILY RELATED ACROSS SPECIES HOW CAN BIOINFORMATICS BE USED AS A TOOL TO DETERMINE EVOLUTIONARY RELATIONSHPS AND TO BETTER UNDERSTAND PROTEIN HERITAGE?
Proteomics Systems Biology
 Dr. Sanjeeva Srivastava IIT Bombay Proteomics Systems Biology IIT Bombay 2 1 DNA Genomics RNA Transcriptomics Global Cellular Protein Proteomics Global Cellular Metabolite Metabolomics Global Cellular
Dr. Amira A. AL-Hosary
 Phylogenetic analysis Amira A. AL-Hosary PhD of infectious diseases Department of Animal Medicine (Infectious Diseases) Faculty of Veterinary Medicine Assiut University-Egypt Phylogenetic Basics: Biological
10-810: Advanced Algorithms and Models for Computational Biology. microrna and Whole Genome Comparison
 10-810: Advanced Algorithms and Models for Computational Biology microrna and Whole Genome Comparison Central Dogma: 90s Transcription factors DNA transcription mrna translation Proteins Central Dogma:
An Efficient Algorithm for Protein-Protein Interaction Network Analysis to Discover Overlapping Functional Modules
 An Efficient Algorithm for Protein-Protein Interaction Network Analysis to Discover Overlapping Functional Modules Ying Liu 1 Department of Computer Science, Mathematics and Science, College of Professional
Related Courses He who asks is a fool for five minutes, but he who does not ask remains a fool forever.
 CSE 527 Computational Biology http://www.cs.washington.edu/527 Lecture 1: Overview & Bio Review Autumn 2004 Larry Ruzzo Related Courses He who asks is a fool for five minutes, but he who does not ask remains
Identifying Signaling Pathways
 These slides, excluding third-party material, are licensed under CC BY-NC 4.0 by Anthony Gitter, Mark Craven, Colin Dewey Identifying Signaling Pathways BMI/CS 776 www.biostat.wisc.edu/bmi776/ Spring 2018
Protein-protein interaction networks Prof. Peter Csermely
 Protein-Protein Interaction Networks 1 Department of Medical Chemistry Semmelweis University, Budapest, Hungary www.linkgroup.hu csermely@eok.sote.hu Advantages of multi-disciplinarity Networks have general
Lecture 4: Transcription networks basic concepts
 Lecture 4: Transcription networks basic concepts - Activators and repressors - Input functions; Logic input functions; Multidimensional input functions - Dynamics and response time 2.1 Introduction The
Introduction Biology before Systems Biology: Reductionism Reduce the study from the whole organism to inner most details like protein or the DNA.
 Systems Biology-Models and Approaches Introduction Biology before Systems Biology: Reductionism Reduce the study from the whole organism to inner most details like protein or the DNA. Taxonomy Study external
Gene Network Science Diagrammatic Cell Language and Visual Cell
 Gene Network Science Diagrammatic Cell Language and Visual Cell Mr. Tan Chee Meng Scientific Programmer, System Biology Group, Bioinformatics Institute Overview Introduction Why? Challenges Diagrammatic
Lecture 8: Temporal programs and the global structure of transcription networks. Chap 5 of Alon. 5.1 Introduction
 Lecture 8: Temporal programs and the global structure of transcription networks Chap 5 of Alon 5. Introduction We will see in this chapter that sensory transcription networks are largely made of just four