Tree size and relative clade age influence estimation of speciation rate shifts
|
|
|
- Emery Barrett
- 6 years ago
- Views:
Transcription
1 Tree size and relative clade age influence estimation of speciation rate shifts Ullasa Kodandaramaiah Corresp., 1, Gopal Murali 1 1 IISER-TVM Centre for Research and Education in Ecology and Evolution (ICREEE), School of Biology, Indian Institute of Science Education and Research Thiruvananthapuram, Thiruvananthapuram, India Corresponding Author: Ullasa Kodandaramaiah address: ullasa@iisertvm.ac.in The development of methods to estimate rates of speciation and extinction from timecalibrated phylogenies has revolutionized evolutionary biology by allowing researchers to correlate diversification rate shifts with causal ecological factors. We use rigorous simulations to evaluate the statistical performance of three widely used modelling approaches - BiSSE, BAMM and MEDUSA - in relation to detection of speciation rates shifts. We simulated sets of trees with each tree having a single increase in speciation rate. We varied the location of shifts, the degree of increase in speciation rate and the total age of the tree. We then used BiSSE, BAMM and MEDUSA to estimate rate shifts. For BiSSE, we assigned different character states for the lineages with different simulated speciation rates. We show that all methods are better at detecting rate shifts when the change in speciation rate is higher, but had high Type II errors (non-detection of rate shifts). While the algorithms more accurately identified rate shifts close to the root of the tree, both perform poorly when the rate shift occurred more recently. All methods performed better with increase in the overall number of tips and the number of tips in the clade with rate shift, both of which are correlated with tree age and speciation rate asymmetry. We discuss the implications of this study for the use and development of methods for hypothesis testing based on diversification rate shifts.
2 1 2 Tree size and relative clade age influence estimatinn nf speciatinn rate shifts Ullasa Kodandaramaiah 1, Gopal Murali IISER-TVM Centre for Research and Education in Ecology and Evolution (ICREEE), School of Biology, Indian Institute of Science Education and Research Thiruvananthapuram, Kerala, India. 5 1 These authors contributed equally IISER-TVM Centre for Research and Education in Ecology and Evolution (ICREEE), School of Biology, Indian Institute of Science Education and Research Thiruvananthapuram, Maruthamala P.O., Vithura, Thiruvananthapuram, India ) Ullasa Kodandaramaiah address: ullasa@iisertvm.ac.in
3 Abstract The development of methods to estimate rates of speciation and extinction from time-calibrated phylogenies has revolutionized evolutionary biology by allowing researchers to correlate diversification rate shifts with causal ecological factors. We use rigorous simulations to evaluate the statistical performance of three widely used modelling approaches - BiSSE, BAMM and MEDUSA - in relation to detection of speciation rates shifts. We simulated sets of trees with each tree having a single increase in speciation rate. We varied the location of shifts, the degree of increase in speciation rate and the total age of the tree. We then used BiSSE, BAMM and MEDUSA to estimate rate shifts. For BiSSE, we assigned different character states for the lineages with different simulated speciation rates. We show that all methods are better at detecting rate shifts when the change in speciation rate is higher, but had high Type II errors (non-detection of rate shifts). While the algorithms more accurately identified rate shifts close to the root of the tree, both perform poorly when the rate shift occurred more recently. All methods performed better with increase in the overall number of tips and the number of tips in the clade with rate shift, both of which are correlated with tree age and speciation rate asymmetry. We discuss the implications of this study for the use and development of methods for hypothesis testing based on diversification rate shifts.
4 Intrnductinn Much as the advent of phylogenetics (Hennig, 1965) led to a spectacular revolution in evolutionary biology, the arrival of mathematical methods to estimate divergence times from molecular phylogenies has offered unprecedented novel insights into macroevolutionary patterns and processes. More recently, a seminal innovation has been the development of tools to estimate rates of speciation and extinction from time-calibrated phylogenies (Nee, May & Harvey, 1994). Until such methods became available, our understanding of macroevolutionary patterns and processes of diversification (net result of speciation minus extinction) largely relied on the fossil record, which is incomplete for most taxa (Benton, Wills & Hitchin, 2000; Quental & Marshall, 2010) and virtually non-existent for many soft-bodied life forms (Donoghue & Purnell, 2009) However, the possibility of using phylogenies of extant taxa to shed light on macroevolutionary history is appealing, and there has been a phenomenal interest in applying such methods to understand fundamental questions such as how the mode and tempo of diversification have been influenced by trait evolution (especially key innovations, e.g. Hunter & Jernvall, 1995; Hodges & Arnold, 1995; Sahoo et al., 2017), biogeography (e.g. Kozak, Weisrock & Larson, 2006; Wahlberg et al., 2009; Dunn et al., 2009), climate change (e.g. Jansson & Davies, 2008; Dunn et al., 2009; Ezard et al., 2011), etc. Analyses testing the effect of a trait or trait variant on diversification hitherto relied on comparisons of species richness of sister clades (e.g. Mitter, Farrell & Wiegmann, 1988; Zeh, Zeh & Smith, 1989). The method cannot distinguish between speciation and extinction, is prone to Type II error (non-detection of significant differences), and it is not straightforward to utilize information from clades with mixed character states (Maddison, Midford & Otto, 2007). The most recent analytical models estimate rates of speciation and extinction both across time and lineages, which form the basis for hypothesis testing. These estimates are based on information about clade age and species richness (e.g. Paradis, 2012), as well as from topology and branch lengths (Maddison, Midford & Otto, 2007; Alfaro et al., 2009; Rabosky, 2014). Thus, these models allow inferences of speciation and extinction rate differences associated with lineages, traits, time or diversity (Laurent, Robinson-Rechavi & Salamin, 2015). The BiSSE (Binary State Speciation and Extinction; Maddison, Midford & Otto, 2007) modelling approach has been especially popular for hypothesis testing because it estimates speciation and extinction rates associated with character states, i.e state-dependent diversification rates. While BiSSE only models binary discrete character states (for example presence or absence of a trait; two states a trait), extensions of BiSSE can handle other types of data. For instance MuSSE (Multiple SSE; (FitzJohn, 2012) can deal with multiple discrete character states, while QuaSSE (Quantitative SSE; FitzJohn, 2010) allows testing the effect of quantitative traits. GeoSSE (Geographic SSE; Goldberg, Lancaster & Ree, 2011) tests region-dependent diversification, while BiSSE-ness (BiSSE-node enhanced state shift; Magnuson-Ford & Otto, 2012) and Cladogenetic SSE (ClaSSE; Goldberg & Igić, 2012) integrate cladogenetic and anagenetic trait evolution. BiSSE and its derivatives have been employed for hypothesis testing in a wide range of taxa and evolutionary scenarios. All above models are typically used by researchers to test how
5 a change in character state has led to a shift in the rates of extinction or speciation. Beaulieu & O Meara (2016) proposed the HiSSE (Hidden States SSE) model, which attempts to identify unmeasured ( hidden ) factors impacting diversification rates of a known trait or character state. In contrast to the BiSSE family of models, character-independent diversification models attempt to identify the number and location of rate shifts in speciation and extinction across the tree, without a priori information on character states. Once the locations of rate shifts are found, the researcher can test for associations with traits of interest. BAMM (Bayesian Analysis of Macroevolutionary Mixtures; Rabosky, 2014) is the most widely used of these models. MEDUSA (Modeling Evolutionary Diversification Using Stepwise Akaike Information Criterion; Alfaro et al., 2009), is another popular modelling framework to estimate rate shifts. The MEDUSA algorithm incrementally assigns rate shifts to all possible branches of the tree, and uses stepwise AIC (Akaike Information Criterion) to determine the number and location(s) of rate shifts that best fit the data. As in the case of BAMM, rate shifts estimations are agnostic of character states of lineages. Although BiSSE, BAMM and MEDUSA have been immensely popular, researchers have only recently begun critically evaluating their performance within a statistical framework. For instance, May & Moore (2016) used extensive simulations to understand the statistical behaviour of MEDUSA, and showed that the algorithm is prone to a very high rate of false inferences of rate shifts (ca. 30% on average), and that the estimated diversification parameters were biased. The probability of rate shift detection in MEDUSA depends on the number of terminals in the tree (Laurent, Robinson-Rechavi & Salamin, 2015). BiSSE has been shown to be severely affected by tree size (number of terminals) (Davis, Midford & Maddison, 2013; Gamisch, 2016) and tip-ratio bias (i.e. ratio of terminals with one character state versus another). Moore and colleagues (Moore et al., 2016) showed that the accuracy of BAMM is strongly affected by the priors specified, and that the of estimates of diversification rate parameters are unreliable. Using empirical datasets, Rabosky & Goldberg (2015) found that the BiSSE is prone to high Type I error rates, wherein diversification-neutral traits are often found to be significantly associated with speciation rate. Surprisingly, such false associations appear to also be detected for traits with weak phylogenetic signal (Rabosky & Goldberg, 2015). Unsurprisingly, estimation of extinction rates from extant taxa appears to be particularly error prone - many authors have argued that the current analytical methods are not reliable for this purpose (Rabosky, 2010; Laurent, Robinson- Rechavi & Salamin, 2015; May & Moore, 2016, but see Stadler, 2013; Beaulieu & O Meara, 2016). In this study, we use rigorous simulations to evaluate the statistical performance of BiSSE, BAMM & MEDUSA in relation to detection of speciation rates shifts. We varied the location of shifts, the degree of increase in speciation rate and overall tree age. We show that all methods perform poorly under some conditions, and we provide recommendations to users and developers of such methods.
6 Materials and Methnds p1) Simulation of phylogenetic tree with single diversification rate shift p1a) General procedure The basic workflow of the simulation process is outlined in Figure 1. To obtain a phylogeny with a single shift in speciation rate, we first simulated two trees - a basetree and a subtree wherein the subtree had a greater speciation rate (λ 1 ) compared to that of the basetree (λ 0 ) - and then replaced a basetree clade with the subtree. A subtree of a given age (S age ) was grafted onto the basetree following pruning of a randomly chosen basetree clade with approximately the same age (S age ±0.65) (Figure 1), using a custom written function (available nn Figshare). Details of the subtree and basetree simulations are described in the next section. The relative age of the subtree in relation to the overall tree was varied by varying the age of the subtree. This procedure was followed to generate a large number of composite trees (20000) with different relative subtree ages, overall tree (basetree) ages and relative speciation rate (speciation rate asymmetry) (Table 1). p1b) Tree simulation We used the forward algorithm in R (R Development Core Team, 2016) package TESS (Höhna, May & Moore, 2015) to simulate trees. The package implements tree simulation based on a global, time-dependent birth-death process conditioned either on number tips or age of the tree (Höhna, May & Moore, 2015). Since simulation of branching process conditioned on number of tips can lead to bias in the diversification rate (Hartmann, Wong, and Stadler 2010), we simulated phylogenies by conditioning on age using the function tess.sim.age, which simulates trees given the age (basetree age B age & S age ) and diversification rate parameters (speciation rate-λ and extinction rate-µ). As this method produces trees with varying tip numbers, we simulated 1000 trees each time and used the function tess.ntaxa.expected from the same package to select the best tree out of the 1000 trees. This was done by comparing the expected number of tips for every 1 unit time with the simulated tree using a correlation test. The tree with the maximum correlation coefficient was chosen as the best tree. We also corroborated the results using a backward simulation procedure using the Treesim package (Stadler, 2011) (Supplemental Figure S1). p1c) Systematic simulation of composite trees with diversification rates shifts of varying subtree age We first adopted values of B age of 25 units and λ 0 (speciation rate of basetree) of 0.27, and varied speciation rate asymmetry (λ 1 /λ 0 ) by altering subtree speciation rate (λ 1 ), while keeping extinction rates constant across both). Thus, there was no rate shift when the speciation rate asymmetry was 1, and higher values indicate a greater degree of speciation rate increase in the subtree. We simulated 100 composite trees each for λ 1 /λ 0 ratios from 1.1 to 2 with an interval of 0.1. This was repeated for a S age ranging from 20-60% of basetree age (Table 1). Simulated trees were subsequently used for the diversification analysis.
7 To check the robustness of the inferences with respect to B age and λ 0 we also conducted the simulations as outlined above for (Bage=25, λ0=0.22;;bage=15; λ0=0.27) with λ 1 /λ 0 ratios ranging from 1.1 to 2.5. p2) Estimation of diversification rate parameters and power of modelling approaches We used BiSSE, BAMM and MEDUSA to estimate diversification rate parameters (λ 0, µ 0, λ 1 and µ 1 ) of the simulated composite trees and detect rate shifts. The probability of detection of a rate shift, i.e. power, for a given combination of Bage, S age, λ 1 and λ 0 was calculated as the proportion of trees in which a significant rate shift was detected. p2a) BiSSE We assigned a character to be present only in the subtree. This was automated in the algorithm based on the different tip labels assigned to the subtree after the tree simulation process. Therefore, diversification rate estimates of the BiSSE model will reflect the actual speciation and extinction rate estimates of the subtree (i.e. λ 1 and µ 1 ) and basetree pλ 0 and µ 0 ). We then compared the unrestricted full model (λ 1 λ 0 ; µ 0 µ 1 ; q01 q10) to a model with restricted speciation rates (λ 1 =λ 0 ) using likelihood ratio tests (LRT). If LRT P<0.05, the rate shift was considered to have been detected, while the rate shift was not considered detected if P p2b) BAMM We performed BAMM analyses with the default parameter settings using the control file available from the BAMM website ( accessed: May 2016). We ran the MCMC analysis for 2 million iterations and checked for convergence using ESS metrics (>200) for a sample trees for each subtree age category. The bammdata object was generated using the geteventdata function from the BAMMtools package after discarding the first 10% of samples as burnin. The bammdata object was then used to calculate the diversification rates. We estimated speciation and extinction rates for the subtree (λ 1 and µ 1 ) as an average rate of the clade using the function getcladerates in the BAMMtools package (Rabosky et al., 2014). We estimated λ 0 and µ 0 using the same function by specifying the common ancestor node of composite tree, but excluding the rates of the subtree. If BAMM reported >0 rate shifts, a significant rate shift in the subtree was considered to have been detected.. p2c) MEDUSA We performed MEDUSA analyses using the function medusa available from the geiger package (Harmon et al., 2007) in R. We specified the model of tree evolution to be a Yule process as the model did not converge for mixed or pure birth-death process. Hence, the diversification rate parameters λ 0, λ 1, µ 0, µ 1 were not estimated by MEDUSA. A significant rate shift in the subtree was considered to have been detected if MEDUSA identified at least one rate shift.
8 Results Rate shifts in a large proportion of simulated trees were not detected under certain conditions. The power (measured as the proportion of trees in which a significant shift was correctly detected) of all three methods was affected by speciation rate asymmetry (ratio of speciation rate of the basetree to that of the subtree) (Figure 2), relative subtree age (ratio of subtree age to basetree age) (Figure 2), overall age of the tree (Figure 2) and tip number (Figures 3 & 4). Effect of speciation rate asymmetry Power increased with increasing asymmetry. For BiSSE, the critical speciation rate ratio at which power reached 95% varied from 1.5 (λ , basetree age 25 and relative subtree age 60%; Figure 2B) to >2.5 (e.g. λ , basetree age 15 and relative subtree age 20%; Figure 2C). The corresponding range for BAMM was 1.6 (λ , basetree age 25 and relative subtree age 60%; Figure 2E) to >2.5 (e.g λ , basetree age 25 and relative subtree age 20%; Figure 2D), and that for MEDUSA was 1.4 (λ , basetree age 25 and relative subtree age 20%; Figure 2H) to 2.5 (λ , basetree age 15 and relative subtree age 20%; Figure 2I). Effect of relative subtree age For all combinations of relative speciation rate and root (=basetree) age, power increased as the subtree age increased, i.e. when the rate shift occurred earlier in time (Figure 2). For e.g., power was always greater for 60% relative subtree age (pink curve in Figure 2) compared to 50% (blue curve). Effect of overall tree age All three methods had greater power when the root age was 25 units compared to when it was 15 units (Figure 2, comparison of columns 1 & 2). Effect of number of tips In the analyses with the pooled dataset of all trees for a given method, power was positively correlated with the number of subtree tips as well as overall tree tips (Figures 3 & 4). Estimates of diversification rates Figure 5 depicts the diversification rate estimate error as ratios of estimated and actual diversification rates (speciation minus extinction) for BiSSE and BAMM for the different simulated scenarios. A ratio of 1 indicates no error, while greater deviance from 1 indicates greater error. For both BiSSE and BAMM, error tended to decrease with increasing relative subtree age, as well as with speciation rate asymmetry. BAMM had a stronger tendency to underestimate diversification rates compared to BiSSE. Supplemental Figures S2-5 depict simulated diversification values (dotted red lines) against values estimated by the analyses. 212 Discussinn
9 Previous studies have identified shortcomings specific to particular modelling approaches for estimation of rate shifts in phylogenies (Rabosky, 2010; Davis, Midford & Maddison, 2013; Laurent, Robinson-Rechavi & Salamin, 2015; Rabosky & Goldberg, 2015; Gamisch, 2016; Moore et al., 2016; May & Moore, 2016). We simulated large sets of trees varying in specific attributes, and analyzed these trees using three widely used modelling approaches. We are therefore able to assess the relative performance of the three methods, and identify problems that are common to these methods. Specifically, we simulated an evolutionary scenario where speciation and extinction rates remained constant throughout the tree (basetree), apart from an increase in speciation rate at a single node (subtree). We find that the power of the analytical method to detect the rate shifts was strongly influenced by rate asymmetry, relative subtree age and root age, all three of which are related to the number of tips (clade size). All three methods performed poorly in terms of estimation of speciation (Supplemental Figure S2,S3) and extinction rates (Supplemental Figure S4,S5) but there was a tendency for reduced error with increasing subtree size and speciation rate asymmetry (Figure 5) Effect of speciation rate asymmetry: Not surprisingly, power increased as the speciation rate asymmetry increased. All methods performed poorly when the subtree speciation rate increased by 50% or lesser relative to the basetree. However, even when the asymmetry was as high as 2.5, a significant proportion of rate shifts were undetected by all methods (Type II error, red curves in Figure 1). Interestingly, no method exhibited Type I error, i.e identification of non-existent rate shifts (rate asymmetry of 1) as significant rate shifts. This is in contrast to other studies (e.g. Rabosky & Goldberg, 2015) which reported high Type I error rates. The lack of Type I error in our study may be because we incorporated a simplistic evolutionary scenario with a single rate shift. Effect of relative subtree age: Rate shifts occurring in younger clades were difficult to detect. For instance, when the subtree age was 20% of the base tree age (red curves in Figure 2), MEDUSA and BAMM rarely detected the rate shifts, even when the rate asymmetry was 2. BiSSE performed marginally better, with power tending to reach 100% above a rate asymmetry of 2 (Figure 2B) or 2.5 (Figures 2A,C). Relative subtree age directly affects both the number of subtree tips and overall number of tree tips. We later discuss the possible effects of tip number in more detail. Effect of overall tree age: Across all methods, power increased as root age increased from 15 to 25 (Comparison of columns 2 & 3 in Figure 2). Given other parameters being the same, older trees will have a greater overall number of tips compared to younger trees. Furthermore, relative subtree age and rate asymmetry are both correlated with subtree tip number, which is in turn correlated with overall tip number. Effect of number of tips:
10 Taking together results from all simulated datasets, power is positively correlated with the number of subtree tips (Figure 3) as well as with overall tree tips (Figure 4). Davis and colleagues (Davis, Midford & Maddison, 2013) and Gamisch (2016) showed that BiSSE analyses on trees with very few taxa (overall tree size) are prone to high Type II error. They simulated complex evolutionary scenarios with multiple increases and decreases in diversification parameters at random points across the tree, and only assessed the effect of overall tree size. Laurent and colleagues (Laurent, Robinson-Rechavi & Salamin, 2015) showed that MEDUSA also performs better when the number of tree tips increases. They inferred that there was no effect of overall tree size because diversification shifts in lineages of the same size were as likely to be detected in small or larger trees (their Figure 3b). Thus, subtree size could be more important than overall tree size. However, in our simulations variation in overall tree size is because of variation in subtree tree size. The three parameters - relative subtree age, overall tree size and subtree size - are all correlated with each other, and therefore their individual effects cannot be easily disentangled. It is possible that the effects of tree size reported in the above studies are related to differences in other parameters that were not explicitly varied in simulations Our analyses show that the performance of BAMM is very similar to that of BiSSE and MEDUSA. Intriguingly, there was a strong correlation between BAMM estimated subtree and basetree speciation rates when the speciation rate asymmetry and relative subtree ages were low (Supplemental Figure S3), a pattern that was not found in the case of BiSSE. We are unable to explain this correlation, but note that this correlation disappeared as power increased, suggesting that the correlation is an artefact. All methods performed well when there is strong rate asymmetry and when the phylogeny being analyzed is large. However, the effects of tip number (both subtree and overall tree), and associated parameters such as relative subtree age, may be the most serious and universal issues for modelling approaches, and development of future methods should focus attention on rectifying these. In practice, a user intending to analyze diversification rate shifts only has information about overall tree size, and not the subtree size or relative subtree age. We provide the following recommendations when analyzing diversification rate shifts Recommendations: We extend the recommendations of Davis and colleagues (Davis, Midford & Maddison) to BAMM and MEDUSA. Users should be extremely cautious when using BiSSE, BAMM or MEDUSA on small phylogenies and should avoid using small, incomplete phylogenies to test hypotheses of rate shifts. When testing hypotheses of change in speciation rates, we recommend that users explore results from multiple datasets, such that the relative age of the clade of interest with respect to the entire tree varies. In analyses of trait-dependent diversification rates, we also encourage readers to report results from traditional sister-group species richness comparisons such as the richness Yule test (Paradis, 2012), and recently developed non-parametric tests such as FiSSE (Rabosky & Goldberg, 2017).
11 Single versus multiple trait transitions Trait-dependent methods such as BiSSE may perhaps perform better with multiple trait transitions over the tree. Further simulation is needed to ascertain how the number of transitions affects the power of trait-dependent methods. However, no method tested here is designed to be employed exclusively when there are multiple rate shifts. Therefore, inferences drawn here should be widely applicable. Cnnclusinns Assessment of diversification parameters and rates shifts is rapidly becoming a standard procedure in studies involving molecular phylogenies. There is a strong demand for analytical tools that detect rate shifts with low Type I and II errors. Although many studies have reported glaring flaws with state-of-the-art modelling approaches, the number of studies employing them continues to increase. More studies are needed to understand the statistical performance of these methods, under what scenarios the results are reliable and when they should be interpreted with caution. Empirical datasets offer limited capabilities to rigorously test the statistical performance of such analytical tools. Simulation studies provide an alternative where individual parameters can be manipulated to illuminate the scenarios or parameter combinations that constitute serious challenges, and to aid development of methods to alleviate these problems. Estimation of extinction rates appears to be particularly prone to error. Although simple simulations such as ours are important steps, future simulation work should concentrate on mimicking more complex evolutionary scenarios, for e.g. with combinations of extinctions and speciation rates shifts. Data availability Data files and codes supporting the article can be accessed from Figshare via Acknnwledgments The authors thank Ranjit Kumar Sahoo for initial discussions. 312 References Alfaro ME., Santini F., Brock C., Alamillo H., Dornburg A., Rabosky DL., Carnevale G., Harmon LJ Nine exceptional radiations plus high turnover explain species diversity in jawed vertebrates. Proceedings of the National Academy of Sciences 106: Beaulieu JM., O Meara BC Detecting hidden diversification shifts in models of traitdependent speciation and extinction. Systematic biology 65: Benton MJ., Wills MA., Hitchin R Quality of the fossil record through time. Nature 403: DOI: / Davis MP., Midford PE., Maddison W Exploring power and parameter estimation of the BiSSE method for analyzing species diversification. BMC Evolutionary Biology 13:38. Donoghue PCJ., Purnell MA Distinguishing heat from light in debate over controversial fossils. BioEssays: News and Reviews in Molecular, Cellular and Developmental Biology 31: DOI: /bies
12 Dunn RR., Agosti D., Andersen AN., Arnan X., Bruhl CA., Cerdá X., Ellison AM., Fisher BL., Fitzpatrick MC., Gibb H., Gotelli NJ., Gove AD., Guenard B., Janda M., Kaspari M., Laurent EJ., Lessard J-P., Longino JT., Majer JD., Menke SB., McGlynn TP., Parr CL., Philpott SM., Pfeiffer M., Retana J., Suarez AV., Vasconcelos HL., Weiser MD., Sanders NJ Climatic drivers of hemispheric asymmetry in global patterns of ant species richness. Ecology Letters 12: DOI: /j x. Ezard TH., Aze T., Pearson PN., Purvis A Interplay between changing climate and species ecology drives macroevolutionary dynamics. Science 332: FitzJohn RG Quantitative Traits and Diversification. Systematic Biology 59: DOI: /sysbio/syq053. FitzJohn RG Diversitree: comparative phylogenetic analyses of diversification in R. Methods in Ecology and Evolution 3: Gamisch A Notes on the statistical power of the binary state speciation and extinction (BiSSE) model. Evolutionary bioinformatics online 12:165. Goldberg EE., Igić B Tempo and mode in plant breeding system evolution. Evolution 66: Goldberg EE., Lancaster LT., Ree RH Phylogenetic inference of reciprocal effects between geographic range evolution and diversification. Systematic Biology 60: Harmon LJ., Weir JT., Brock CD., Glor RE., Challenger W GEIGER: investigating evolutionary radiations. Bioinformatics 24: Hennig W Phylogenetic systematics. Annual Review of Entomology 10: Hodges SA., Arnold ML Spurring plant diversification: are floral nectar spurs a key innovation? Proc. R. Soc. Lond. B 262: DOI: /rspb Höhna S., May MR., Moore BR TESS: an R package for efficiently simulating phylogenetic trees and performing Bayesian inference of lineage diversification rates. Bioinformatics 32: Hunter JP., Jernvall J The hypocone as a key innovation in mammalian evolution. Proceedings of the National Academy of Sciences of the United States of America 92: Jansson R., Davies TJ Global variation in diversification rates of flowering plants: energy vs. climate change. Ecology Letters 11: DOI: /j x. Kozak KH., Weisrock DW., Larson A Rapid lineage accumulation in a non-adaptive radiation: phylogenetic analysis of diversification rates in eastern North American woodland salamanders (Plethodontidae: Plethodon). Proceedings of the Royal Society of London B: Biological Sciences 273: DOI: /rspb Laurent S., Robinson-Rechavi M., Salamin N Detecting patterns of species diversification in the presence of both rate shifts and mass extinctions. BMC evolutionary biology 15:157. Maddison WP., Midford PE., Otto SP Estimating a binary character s effect on speciation and extinction. Systematic biology 56: Magnuson-Ford K., Otto SP Linking the investigations of character evolution and species diversification. The American Naturalist 180: DOI: / May MR., Moore BR How Well Can We Detect Lineage-Specific Diversification-Rate Shifts? A Simulation Study of Sequential AIC Methods. Systematic Biology:syw026. DOI: /sysbio/syw026. Mitter C., Farrell B., Wiegmann B The phylogenetic study of adaptive zones: has phytophagy promoted insect diversification? The American Naturalist 132:
13 Moore BR., Höhna S., May MR., Rannala B., Huelsenbeck JP Critically evaluating the theory and performance of Bayesian analysis of macroevolutionary mixtures. Proceedings of the National Academy of Sciences 113: Nee S., May RM., Harvey PH The reconstructed evolutionary process. Phil. Trans. R. Soc. Lond. B 344: DOI: /rstb Paradis E Shift in Diversification in Sister-Clade Comparisons: A More Powerful Test. Evolution 66: DOI: /j x. Quental TB., Marshall CR Diversity dynamics: molecular phylogenies need the fossil record. Trends in Ecology & Evolution 25: DOI: /j.tree Rabosky DL Extinction rates should not be estimated from molecular phylogenies. Evolution 64: Rabosky DL Automatic detection of key innovations, rate shifts, and diversity-dependence on phylogenetic trees. PloS one 9:e Rabosky DL., Goldberg EE Model inadequacy and mistaken inferences of trait-dependent speciation. Systematic Biology 64: Rabosky DL., Goldberg EE FiSSE: A simple nonparametric test for the effects of a binary character on lineage diversification rates. Evolution 71: Rabosky DL., Grundler M., Anderson C., Shi JJ., Brown JW., Huang H., Larson JG BAMMtools: an R package for the analysis of evolutionary dynamics on phylogenetic trees. Methods in Ecology and Evolution 5: R_Development_Core_Team R: A Language and Environment for Statistical Computing. Austria. Sahoo RK., Warren AD., Collins SC., Kodandaramaiah U Hostplant change and paleoclimatic events explain diversification shifts in skipper butterflies (Family: Hesperiidae). BMC Evolutionary Biology 17:174. DOI: /s x. Stadler T Simulating trees with a fixed number of extant species. Systematic Biology 60: Stadler T How can we improve accuracy of macroevolutionary rate estimates? Systematic biology 62: Wahlberg N., Leneveu J., Kodandaramaiah U., Peña C., Nylin S., Freitas AVL., Brower AVZ Nymphalid butterflies diversify following near demise at the Cretaceous/Tertiary boundary. Proceedings of the Royal Society B: Biological Sciences 276: Zeh DW., Zeh JA., Smith RL Ovipositors, amnions and eggshell architecture in the diversification of terrestrial arthropods. The Quarterly Review of Biology 64:
14 Figure 1 Flowchart of simulation process
15 Table 1(on next page) Values of variables used in the simulation
16 Variables Variable names Values Basetreesage B age 25sors15 Subtreesage S age 20,30,40,50,60s%sofsbabetreesage Basetreesspeciations rate Subtreesspeciations rate λ 0 λ sors ,s0.29,0.32,s0.35,0.37,0.40,0.43,s0.45, 0.48,0.51,0.54,0.56,0.59,0.62 Speciationsrates asymmetry Basetreesextinctions rate λ 1ss /sλ µ Subtreesextinctionsrate µ
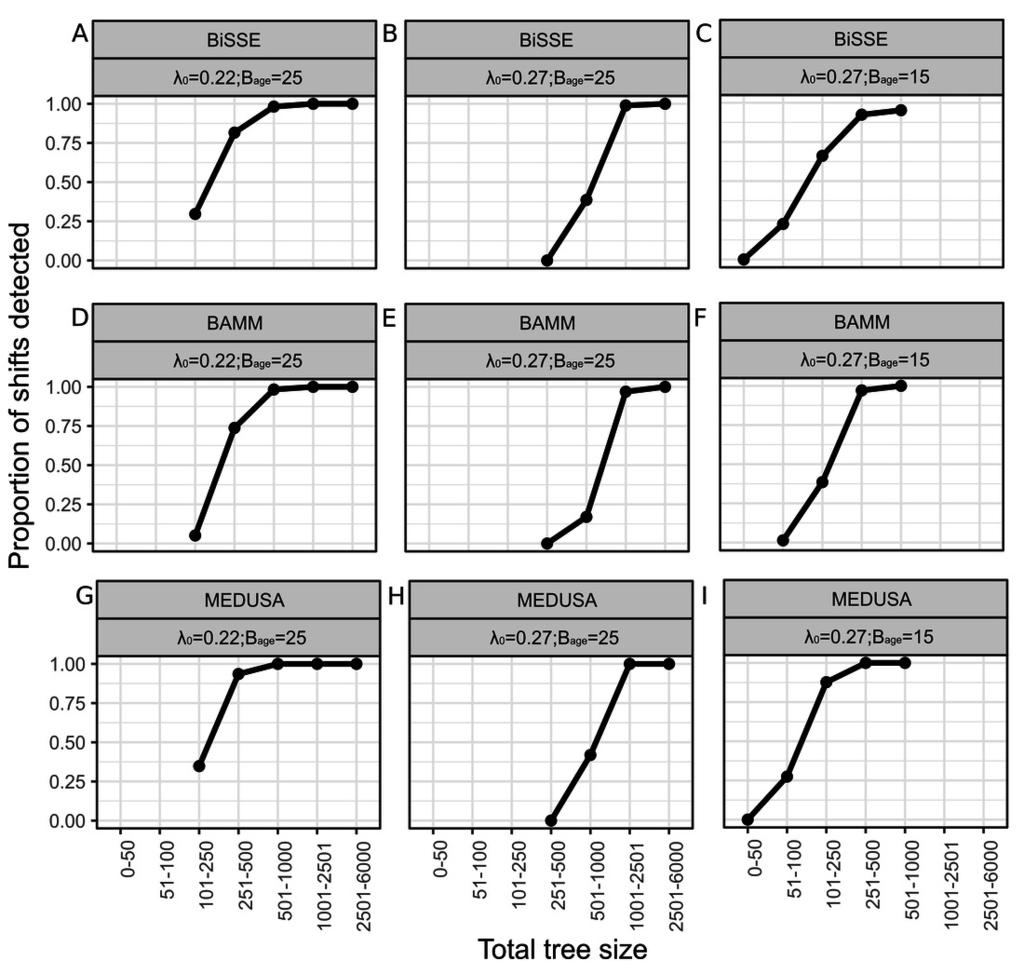
17 Figure 2 Power of BiSSE, BAMM and MEDUSA in detecting simulated rate shifts Power, measured as the proportion of shifts detected, for BiSSE (A, B & C), BAMM (D, E & F) and MEDUSA (G, H and I). X axes values are the simulated speciation rate asymmetry values. The first column (A, D and G) represents simulated scenarios of λ and basetree age 25 units, the second column (B, E and H) represents λ and basetree age 25 units, while the third column (C, F and I) represents λ and basetree age 15 units.

18
19 Figure 3 Relationship between power and subtree size Relationship between power, measured as the proportion of shifts detected, and subtree size for BiSSE (A, B & C), BAMM (D, E & F) and MEDUSA (G, H and I) analyses. Each plot represents values for a given combination of basetree and λ 0 conditions, and calculated by summing up the results of all analyses for this combination (i.e. all subtree ages and λ 1 /λ 0 ratios). The first column (A, D and G) represents simulated scenarios of λ and basetree age 25 units, the second column (B, E and H) represents λ and basetree age 25 units, while the third column (C, F and I) represents λ and basetree age 15 units.

20
21 Figure 4 Relationship between power and overall tree size Relationship between power, measured as the proportion of shifts detected, and overall tree size for BiSSE (A, B & C), BAMM (D, E & F) and MEDUSA (G, H and I) analyses. Each plot represents values for a given combination of basetree and λ 0 conditions, and calculated by summing up the results of all analyses for this combination (i.e. all subtree ages and λ 1 /λ 0 ratios). The first column (A, D and G) represents simulated scenarios of λ and basetree age 25 units, the second column (B, E and H) represents λ and basetree age 25 units, while the third column (C, F and I) represents λ and basetree age 15 units.
22
 and BAMM (D, E & F) analyses. A ratio of 1 indicates no error, while greater deviance from 1 indicates greater error.")
23 Figure 5 Error in estimation of diversification rates Diversification rate estimate error, measured as the ratio of estimated and actual diversification rates (speciation minus extinction) for BiSSE (A, B & C) and BAMM (D, E & F) analyses. A ratio of 1 indicates no error, while greater deviance from 1 indicates greater error. X axes values are the simulated speciation rate asymmetry values and Y value represents relative subtree age. The first column (A and D) represents simulated scenarios of λ and basetree age 25 units, the second column (B and E) represents λ and basetree age 25 units, while the third column (C and F) represents λ and basetree age 15 units.
FiSSE: A simple nonparametric test for the effects of a binary character on lineage diversification rates
 ORIGINAL ARTICLE doi:0./evo.3227 FiSSE: A simple nonparametric test for the effects of a binary character on lineage diversification rates Daniel L. Rabosky,2, and Emma E. Goldberg 3, Department of Ecology
Greater host breadth still not associated with increased diversification rate in the Nymphalidae A response to Janz et al.
 doi:10.1111/evo.12914 Greater host breadth still not associated with increased diversification rate in the Nymphalidae A response to Janz et al. Christopher A. Hamm 1,2 and James A. Fordyce 3 1 Department
Supplementary Figure 1: Distribution of carnivore species within the Jetz et al. phylogeny. The phylogeny presented here was randomly sampled from
 Supplementary Figure 1: Distribution of carnivore species within the Jetz et al. phylogeny. The phylogeny presented here was randomly sampled from the 1 trees from the collection using the Ericson backbone.
Model Inadequacy and Mistaken Inferences of Trait-Dependent Speciation
 1 Model Inadequacy and Mistaken Inferences of Trait-Dependent Speciation Daniel L. Rabosky 1* and Emma E. Goldberg 2* 1 Museum of Zoology and Department of Ecology and Evolutionary Biology, University
Model Inadequacy and Mistaken Inferences of Trait-Dependent Speciation
 Syst. Biol. 64(2):340 355, 2015 The Author(s) 2015. Published by Oxford University Press, on behalf of the Society of Systematic Biologists. All rights reserved. For Permissions, please email: journals.permissions@oup.com
Does convergent evolution always result from different lineages experiencing similar
 Different evolutionary dynamics led to the convergence of clinging performance in lizard toepads Sarin Tiatragula 1 *, Gopal Murali 2 *, James T. Stroud 3 1 Department of Biological Sciences, Auburn University,
BAMMtools: an R package for the analysis of evolutionary dynamics on phylogenetic trees
 Methods in Ecology and Evolution 2, 5, 71 77 doi: 1.1111/241-21X.12199 APPLICATION BAMMtools: an R package for the analysis of evolutionary dynamics on phylogenetic trees Daniel L. Rabosky*, Michael Grundler,
Phylogenetic comparative methods, CEB Spring 2010 [Revised April 22, 2010]
![Phylogenetic comparative methods, CEB Spring 2010 [Revised April 22, 2010]](/thumbs/93/112416870.jpg "Phylogenetic comparative methods, CEB Spring 2010 [Revised April 22, 2010]") Phylogenetic comparative methods, CEB 35300 Spring 2010 [Revised April 22, 2010] Instructors: Andrew Hipp, Herbarium Curator, Morton Arboretum. ahipp@mortonarb.org; 630-725-2094 Rick Ree, Associate Curator,
Phylogenetic comparative methods, CEB 35300 Spring 2010 [Revised April 22, 2010] Instructors: Andrew Hipp, Herbarium Curator, Morton Arboretum. ahipp@mortonarb.org; 630-725-2094 Rick Ree, Associate Curator,
Dr. Amira A. AL-Hosary
 Phylogenetic analysis Amira A. AL-Hosary PhD of infectious diseases Department of Animal Medicine (Infectious Diseases) Faculty of Veterinary Medicine Assiut University-Egypt Phylogenetic Basics: Biological
Amira A. AL-Hosary PhD of infectious diseases Department of Animal Medicine (Infectious Diseases) Faculty of Veterinary Medicine Assiut
 Faculty of Veterinary Medicine Assiut") Amira A. AL-Hosary PhD of infectious diseases Department of Animal Medicine (Infectious Diseases) Faculty of Veterinary Medicine Assiut University-Egypt Phylogenetic analysis Phylogenetic Basics: Biological
Amira A. AL-Hosary PhD of infectious diseases Department of Animal Medicine (Infectious Diseases) Faculty of Veterinary Medicine Assiut University-Egypt Phylogenetic analysis Phylogenetic Basics: Biological
arxiv: v1 [q-bio.pe] 22 Apr 2014 Sacha S.J. Laurent 12, Marc Robinson-Rechavi 12, and Nicolas Salamin 12
![arxiv: v1 [q-bio.pe] 22 Apr 2014 Sacha S.J. Laurent 12, Marc Robinson-Rechavi 12, and Nicolas Salamin 12](/thumbs/79/79272132.jpg "arxiv: v1 [q-bio.pe] 22 Apr 2014 Sacha S.J. Laurent 12, Marc Robinson-Rechavi 12, and Nicolas Salamin 12") Version dated: April 23, 2014 Are we able to detect mass extinction events using phylogenies? arxiv:1404.5441v1 [q-bio.pe] 22 Apr 2014 Sacha S.J. Laurent 12, Marc Robinson-Rechavi 12, and Nicolas Salamin
Version dated: April 23, 2014 Are we able to detect mass extinction events using phylogenies? arxiv:1404.5441v1 [q-bio.pe] 22 Apr 2014 Sacha S.J. Laurent 12, Marc Robinson-Rechavi 12, and Nicolas Salamin
The Tempo of Macroevolution: Patterns of Diversification and Extinction
 The Tempo of Macroevolution: Patterns of Diversification and Extinction During the semester we have been consider various aspects parameters associated with biodiversity. Current usage stems from 1980's
Phylogenetic approaches for studying diversification
 Ecology Letters, (2014) doi: 10.1111/ele.12251 REVIEW AND SYNTHESIS Phylogenetic approaches for studying diversification Helene Morlon* Center for Applied Mathematics, Ecole Polytechnique, Palaiseau, Essonne,
PRINCIPLES OF PHYLOGENETICS: ECOLOGY AND EVOLUTION
 "PRINCIPLES OF PHYLOGENETICS: ECOLOGY AND EVOLUTION" Integrative Biology 200 Spring 2018 University of California, Berkeley D. Ackerly April 2, 2018 Lineage diversification Reading: Morlon, H. (2014).
Non-independence in Statistical Tests for Discrete Cross-species Data
 J. theor. Biol. (1997) 188, 507514 Non-independence in Statistical Tests for Discrete Cross-species Data ALAN GRAFEN* AND MARK RIDLEY * St. John s College, Oxford OX1 3JP, and the Department of Zoology,
Comparing the rates of speciation and extinction between phylogenetic trees
 Received: 29 November 2017 Revised: 21 February 2018 Accepted: 8 March 2018 DOI: 10.1002/ece3.4030 ORIGINAL RESEARCH Comparing the rates of speciation and extinction between phylogenetic trees Liam J.
Integrating Fossils into Phylogenies. Throughout the 20th century, the relationship between paleontology and evolutionary biology has been strained.
 IB 200B Principals of Phylogenetic Systematics Spring 2011 Integrating Fossils into Phylogenies Throughout the 20th century, the relationship between paleontology and evolutionary biology has been strained.
Estimating a Binary Character s Effect on Speciation and Extinction
 Syst. Biol. 56(5):701 710, 2007 Copyright c Society of Systematic Biologists ISSN: 1063-5157 print / 1076-836X online DOI: 10.1080/10635150701607033 Estimating a Binary Character s Effect on Speciation
Reconstructing the history of lineages
 Reconstructing the history of lineages Class outline Systematics Phylogenetic systematics Phylogenetic trees and maps Class outline Definitions Systematics Phylogenetic systematics/cladistics Systematics
Rapid evolution of the cerebellum in humans and other great apes
 Rapid evolution of the cerebellum in humans and other great apes Article Accepted Version Barton, R. A. and Venditti, C. (2014) Rapid evolution of the cerebellum in humans and other great apes. Current
Phylogeny-Based Analyses of Evolution with a Paleo-Focus Part 2. Diversification of Lineages (Mar 02, 2012 David W. Bapst
 Phylogeny-Based Analyses of Evolution with a Paleo-Focus Part 2. Diversification of Lineages (Mar 02, 2012 David W. Bapst Recommended Reading: Nee, S. 2006. Birth-Death Models in Macroevolution. Annual
ASYMMETRIES IN PHYLOGENETIC DIVERSIFICATION AND CHARACTER CHANGE CAN BE UNTANGLED
 doi:1.1111/j.1558-5646.27.252.x ASYMMETRIES IN PHYLOGENETIC DIVERSIFICATION AND CHARACTER CHANGE CAN BE UNTANGLED Emmanuel Paradis Institut de Recherche pour le Développement, UR175 CAVIAR, GAMET BP 595,
POSITIVE CORRELATION BETWEEN DIVERSIFICATION RATES AND PHENOTYPIC EVOLVABILITY CAN MIMIC PUNCTUATED EQUILIBRIUM ON MOLECULAR PHYLOGENIES
 doi:10.1111/j.1558-5646.2012.01631.x POSITIVE CORRELATION BETWEEN DIVERSIFICATION RATES AND PHENOTYPIC EVOLVABILITY CAN MIMIC PUNCTUATED EQUILIBRIUM ON MOLECULAR PHYLOGENIES Daniel L. Rabosky 1,2,3 1 Department
Estimating Trait-Dependent Speciation and Extinction Rates from Incompletely Resolved Phylogenies
 Syst. Biol. 58(6):595 611, 2009 c The Author(s) 2009. Published by Oxford University Press, on behalf of the Society of Systematic Biologists. All rights reserved. For Permissions, please email: journals.permissions@oxfordjournals.org
Integrative Biology 200 "PRINCIPLES OF PHYLOGENETICS" Spring 2018 University of California, Berkeley
 Integrative Biology 200 "PRINCIPLES OF PHYLOGENETICS" Spring 2018 University of California, Berkeley B.D. Mishler Feb. 14, 2018. Phylogenetic trees VI: Dating in the 21st century: clocks, & calibrations;
Postal address: Ruthven Museums Building, Museum of Zoology, University of Michigan, Ann Arbor,
 1 RH: RATE-SHIFT MODELS IN MACROEVOLUTION Is BAMM flawed? Theoretical and practical concerns in the analysis of multi-rate diversification models Daniel L. Rabosky 1,*, Jonathan S. Mitchell 1, and Jonathan
EXTINCTION RATES SHOULD NOT BE ESTIMATED FROM MOLECULAR PHYLOGENIES
 ORIGINAL ARTICLE doi:10.1111/j.1558-5646.2009.00926.x EXTINCTION RATES SHOULD NOT BE ESTIMATED FROM MOLECULAR PHYLOGENIES Daniel L. Rabosky 1,2,3,4 1 Department of Ecology and Evolutionary Biology, Cornell
"PRINCIPLES OF PHYLOGENETICS: ECOLOGY AND EVOLUTION" Integrative Biology 200B Spring 2011 University of California, Berkeley
 "PRINCIPLES OF PHYLOGENETICS: ECOLOGY AND EVOLUTION" Integrative Biology 200B Spring 2011 University of California, Berkeley B.D. Mishler Feb. 1, 2011. Qualitative character evolution (cont.) - comparing
Estimating Age-Dependent Extinction: Contrasting Evidence from Fossils and Phylogenies
 Syst. Biol. 0(0):1 17, 2017 The Author(s) 2017. Published by Oxford University Press, on behalf of the Society of Systematic Biologists. This is an Open Access article distributed under the terms of the
APPENDIX S1: DESCRIPTION OF THE ESTIMATION OF THE VARIANCES OF OUR MAXIMUM LIKELIHOOD ESTIMATORS
 APPENDIX S1: DESCRIPTION OF THE ESTIMATION OF THE VARIANCES OF OUR MAXIMUM LIKELIHOOD ESTIMATORS For large n, the negative inverse of the second derivative of the likelihood function at the optimum can
Markov chain Monte-Carlo to estimate speciation and extinction rates: making use of the forest hidden behind the (phylogenetic) tree
 tree") Markov chain Monte-Carlo to estimate speciation and extinction rates: making use of the forest hidden behind the (phylogenetic) tree Nicolas Salamin Department of Ecology and Evolution University of Lausanne
Markov chain Monte-Carlo to estimate speciation and extinction rates: making use of the forest hidden behind the (phylogenetic) tree Nicolas Salamin Department of Ecology and Evolution University of Lausanne
Biome evolution and biogeographical change through time
 thesis abstract Biome evolution and biogeographical change through time Christine D. Bacon ISSN 1948-6596 Department of Biological and Environmental Sciences, University of Gothenburg, Gothenburg, Sweden;
Systematics - Bio 615
 Bayesian Phylogenetic Inference 1. Introduction, history 2. Advantages over ML 3. Bayes Rule 4. The Priors 5. Marginal vs Joint estimation 6. MCMC Derek S. Sikes University of Alaska 7. Posteriors vs Bootstrap
A Rough Guide to CladeAge
 A Rough Guide to CladeAge Setting fossil calibrations in BEAST 2 Michael Matschiner Remco Bouckaert michaelmatschiner@mac.com remco@cs.auckland.ac.nz January 17, 2014 Contents 1 Introduction 1 1.1 Windows...............................
Inferring the Dynamics of Diversification: A Coalescent Approach
 Inferring the Dynamics of Diversification: A Coalescent Approach Hélène Morlon 1 *, Matthew D. Potts 2, Joshua B. Plotkin 1 * 1 Department of Biology, University of Pennsylvania, Philadelphia, Pennsylvania,
Concepts and Methods in Molecular Divergence Time Estimation
 Concepts and Methods in Molecular Divergence Time Estimation 26 November 2012 Prashant P. Sharma American Museum of Natural History Overview 1. Why do we date trees? 2. The molecular clock 3. Local clocks
EVOLUTION INTERNATIONAL JOURNAL OF ORGANIC EVOLUTION
 EVOLUTION INTERNATIONAL JOURNAL OF ORGANIC EVOLUTION PUBLISHED BY THE SOCIETY FOR THE STUDY OF EVOLUTION Vol. 59 February 2005 No. 2 Evolution, 59(2), 2005, pp. 257 265 DETECTING THE HISTORICAL SIGNATURE
MOTMOT: models of trait macroevolution on trees
 Methods in Ecology and Evolution 2012, 3, 145 151 doi: 10.1111/j.2041-210X.2011.00132.x APPLICATION MOTMOT: models of trait macroevolution on trees Gavin H. Thomas 1 * and Robert P. Freckleton 2 1 School
Evolutionary models with ecological interactions. By: Magnus Clarke
 Evolutionary models with ecological interactions By: Magnus Clarke A thesis submitted in partial fulfilment of the requirements for the degree of Doctor of Philosophy The University of Sheffield Faculty
A Bayesian approach for detecting the impact of mass-extinction events on molecular phylogenies when rates of lineage diversification may vary
 Methods in Ecology and Evolution 16, 7, 947 99 doi: 1.1111/41-1X.163 A Bayesian approach for detecting the impact of mass-extinction events on molecular phylogenies when rates of lineage diversification
paleotree: an R package for paleontological and phylogenetic analyses of evolution
 Methods in Ecology and Evolution 2012, 3, 803 807 doi: 10.1111/j.2041-210X.2012.00223.x APPLICATION paleotree: an R package for paleontological and phylogenetic analyses of evolution David W. Bapst* Department
Some of these slides have been borrowed from Dr. Paul Lewis, Dr. Joe Felsenstein. Thanks!
 Some of these slides have been borrowed from Dr. Paul Lewis, Dr. Joe Felsenstein. Thanks! Paul has many great tools for teaching phylogenetics at his web site: http://hydrodictyon.eeb.uconn.edu/people/plewis
Quantitative Traits and Diversification
 Syst. Biol. 59(6):619 633, 2010 c The Author(s) 2010. Published by Oxford University Press, on behalf of the Society of Systematic Biologists. All rights reserved. For Permissions, please email: journals.permissions@oxfordjournals.org
Package OUwie. August 29, 2013
 Package OUwie August 29, 2013 Version 1.34 Date 2013-5-21 Title Analysis of evolutionary rates in an OU framework Author Jeremy M. Beaulieu , Brian O Meara Maintainer
Estimating a Binary Character's Effect on Speciation and Extinction
 Syst. Biol. 56(5)701-710, 2007 Copyright Society of Systematic Biologists ISSN: 1063-5157 print / 1076-836X online LX)1:10.1080/10635150701607033 Estimating a Binary Character's Effect on Speciation and
University of Groningen
 University of Groningen Can clade age alone explain the relationship between body size and diversity? Etienne, Rampal S.; de Visser, Sara N.; Janzen, Thijs; Olsen, Jeanine L.; Olff, Han; Rosindell, James
Using the Birth-Death Process to Infer Changes in the Pattern of Lineage Gain and Loss. Nathaniel Malachi Hallinan
 Using the Birth-Death Process to Infer Changes in the Pattern of Lineage Gain and Loss by Nathaniel Malachi Hallinan A dissertation submitted in partial satisfaction of the requirements for the degree
Plant of the Day Isoetes andicola
 Plant of the Day Isoetes andicola Endemic to central and southern Peru Found in scattered populations above 4000 m Restricted to the edges of bogs and lakes Leaves lack stomata and so CO 2 is obtained,
Bayesian Inference using Markov Chain Monte Carlo in Phylogenetic Studies
 Bayesian Inference using Markov Chain Monte Carlo in Phylogenetic Studies 1 What is phylogeny? Essay written for the course in Markov Chains 2004 Torbjörn Karfunkel Phylogeny is the evolutionary development
3 Hours 18 / 06 / 2012 EXAMS OFFICE USE ONLY University of the Witwatersrand, Johannesburg Course or topic No(s) ANAT 4000
 ANAT 4000") 3 Hours 18 / 06 / 2012 EXAMS OFFICE USE ONLY University of the Witwatersrand, Johannesburg Course or topic No(s) ANAT 4000 Course or topic name(s) Paper Number & title HUMAN BIOLOGY HONOURS: PAPER 1 Examination
3 Hours 18 / 06 / 2012 EXAMS OFFICE USE ONLY University of the Witwatersrand, Johannesburg Course or topic No(s) ANAT 4000 Course or topic name(s) Paper Number & title HUMAN BIOLOGY HONOURS: PAPER 1 Examination
POPULATION GENETICS Winter 2005 Lecture 17 Molecular phylogenetics
 POPULATION GENETICS Winter 2005 Lecture 17 Molecular phylogenetics - in deriving a phylogeny our goal is simply to reconstruct the historical relationships between a group of taxa. - before we review the
AP Biology. Cladistics
 Cladistics Kingdom Summary Review slide Review slide Classification Old 5 Kingdom system Eukaryote Monera, Protists, Plants, Fungi, Animals New 3 Domain system reflects a greater understanding of evolution
Appendix from L. J. Revell, On the Analysis of Evolutionary Change along Single Branches in a Phylogeny
 008 by The University of Chicago. All rights reserved.doi: 10.1086/588078 Appendix from L. J. Revell, On the Analysis of Evolutionary Change along Single Branches in a Phylogeny (Am. Nat., vol. 17, no.
Using phylogenetics to estimate species divergence times... Basics and basic issues for Bayesian inference of divergence times (plus some digression)
") Using phylogenetics to estimate species divergence times... More accurately... Basics and basic issues for Bayesian inference of divergence times (plus some digression) "A comparison of the structures
Using phylogenetics to estimate species divergence times... More accurately... Basics and basic issues for Bayesian inference of divergence times (plus some digression) "A comparison of the structures
Lecture V Phylogeny and Systematics Dr. Kopeny
 Delivered 1/30 and 2/1 Lecture V Phylogeny and Systematics Dr. Kopeny Lecture V How to Determine Evolutionary Relationships: Concepts in Phylogeny and Systematics Textbook Reading: pp 425-433, 435-437
Trees of Unusual Size: Biased Inference of Early Bursts from Large Molecular Phylogenies
 Trees of Unusual Size: Biased Inference of Early Bursts from Large Molecular Phylogenies Matthew W. Pennell 1,2,3 *, Brice A. J. Sarver 1,2,3, Luke J. Harmon 1,2,3 1 Institute for Bioinformatics and Evolutionary
Ecological Limits on Clade Diversification in Higher Taxa
 vol. 173, no. 5 the american naturalist may 2009 Ecological Limits on Clade Diversification in Higher Taxa Daniel L. Rabosky * Department of Ecology and Evolutionary Biology, Cornell University, Ithaca,
The Effects of Flower Color Transitions on Diversification Rates in Morning Glories (Ipomoea subg. Quamoclit, Convolvulaceae)
") University of Nebraska - Lincoln DigitalCommons@University of Nebraska - Lincoln Faculty Publications in the Biological Sciences Papers in the Biological Sciences 2010 The Effects of Flower Color Transitions
University of Nebraska - Lincoln DigitalCommons@University of Nebraska - Lincoln Faculty Publications in the Biological Sciences Papers in the Biological Sciences 2010 The Effects of Flower Color Transitions
Reconstruire le passé biologique modèles, méthodes, performances, limites
 Reconstruire le passé biologique modèles, méthodes, performances, limites Olivier Gascuel Centre de Bioinformatique, Biostatistique et Biologie Intégrative C3BI USR 3756 Institut Pasteur & CNRS Reconstruire
Testing the time-for-speciation effect in the assembly of regional biotas
 Methods in Ecology and Evolution 2012, 3, 224 233 Testing the time-for-speciation effect in the assembly of regional biotas Daniel L. Rabosky doi: 10.1111/j.2041-210X.2011.00166.x Department of Integrative
An integrative view of phylogenetic comparative methods: connections to population genetics, community ecology, and paleobiology
 Ann. N.Y. Acad. Sci. ISSN 0077-8923 ANNALS OF THE NEW YORK ACADEMY OF SCIENCES Issue: The Year in Evolutionary Biology An integrative view of phylogenetic comparative methods: connections to population
Zhongyi Xiao. Correlation. In probability theory and statistics, correlation indicates the
 Character Correlation Zhongyi Xiao Correlation In probability theory and statistics, correlation indicates the strength and direction of a linear relationship between two random variables. In general statistical
"PRINCIPLES OF PHYLOGENETICS: ECOLOGY AND EVOLUTION" Integrative Biology 200 Spring 2018 University of California, Berkeley
 "PRINCIPLES OF PHYLOGENETICS: ECOLOGY AND EVOLUTION" Integrative Biology 200 Spring 2018 University of California, Berkeley D.D. Ackerly Feb. 26, 2018 Maximum Likelihood Principles, and Applications to
ORIGINAL ARTICLE. Roland Jansson, 1,2 Genoveva Rodríguez-Castañeda, 1 and Larisa E. Harding 1
 ORIGINAL ARTICLE doi:10.1111/evo.12089 WHAT CAN MULTIPLE PHYLOGENIES SAY ABOUT THE LATITUDINAL DIVERSITY GRADIENT? A NEW LOOK AT THE TROPICAL CONSERVATISM, OUT OF THE TROPICS, AND DIVERSIFICATION RATE
Faster Speciation and Reduced Extinction in the Tropics Contribute to the Mammalian Latitudinal Diversity Gradient
 Faster Speciation and Reduced Extinction in the Tropics Contribute to the Mammalian Latitudinal Diversity Gradient Jonathan Rolland 1,2 *, Fabien L. Condamine 1, Frederic Jiguet 2,Hélène Morlon 1 * 1 CNRS,
Bayesian Phylogenetic Estimation of Clade Ages Supports Trans-Atlantic Dispersal of Cichlid Fishes
 Syst. Biol. 66(1):3 22, 2017 The Author(s) 2016. Published by Oxford University Press, on behalf of the Society of Systematic Biologists. All rights reserved. For Permissions, please email: journals.permissions@oup.com
Power of the Concentrated Changes Test for Correlated Evolution
 Syst. Biol. 48(1):170 191, 1999 Power of the Concentrated Changes Test for Correlated Evolution PATRICK D. LORCH 1,3 AND JOHN MCA. EADIE 2 1 Department of Biology, University of Toronto at Mississauga,
Bayesian Estimation of Speciation and Extinction from Incomplete Fossil Occurrence Data
 Syst. Biol. 63(3):349 367, 2014 The Author(s) 2014. Published by Oxford University Press, on behalf of the Society of Systematic Biologists. All rights reserved. For Permissions, please email: journals.permissions@oup.com
Michael Yaffe Lecture #5 (((A,B)C)D) Database Searching & Molecular Phylogenetics A B C D B C D
C)D) Database Searching & Molecular Phylogenetics A B C D B C D") 7.91 Lecture #5 Database Searching & Molecular Phylogenetics Michael Yaffe B C D B C D (((,B)C)D) Outline Distance Matrix Methods Neighbor-Joining Method and Related Neighbor Methods Maximum Likelihood
7.91 Lecture #5 Database Searching & Molecular Phylogenetics Michael Yaffe B C D B C D (((,B)C)D) Outline Distance Matrix Methods Neighbor-Joining Method and Related Neighbor Methods Maximum Likelihood
Algorithms in Bioinformatics
 Algorithms in Bioinformatics Sami Khuri Department of Computer Science San José State University San José, California, USA khuri@cs.sjsu.edu www.cs.sjsu.edu/faculty/khuri Distance Methods Character Methods
Supplemental Data. Vanneste et al. (2015). Plant Cell /tpc
. Plant Cell /tpc") Supplemental Figure 1: Representation of the structure of an orthogroup. Each orthogroup consists out of a paralogous pair representing the WGD (denoted by Equisetum 1 and Equisetum 2) supplemented with
Supplemental Figure 1: Representation of the structure of an orthogroup. Each orthogroup consists out of a paralogous pair representing the WGD (denoted by Equisetum 1 and Equisetum 2) supplemented with
PhyQuart-A new algorithm to avoid systematic bias & phylogenetic incongruence
 PhyQuart-A new algorithm to avoid systematic bias & phylogenetic incongruence Are directed quartets the key for more reliable supertrees? Patrick Kück Department of Life Science, Vertebrates Division,
The phylogenetic effective sample size and jumps
 arxiv:1809.06672v1 [q-bio.pe] 18 Sep 2018 The phylogenetic effective sample size and jumps Krzysztof Bartoszek September 19, 2018 Abstract The phylogenetic effective sample size is a parameter that has
Hostplant change and paleoclimatic events explain diversification shifts in skipper butterflies (Family: Hesperiidae)
") Sahoo et al. BMC Evolutionary Biology (2017) 17:174 DOI 10.1186/s12862-017-1016-x RESEARCH ARTICLE Open Access Hostplant change and paleoclimatic events explain diversification shifts in skipper butterflies
Sahoo et al. BMC Evolutionary Biology (2017) 17:174 DOI 10.1186/s12862-017-1016-x RESEARCH ARTICLE Open Access Hostplant change and paleoclimatic events explain diversification shifts in skipper butterflies
UoN, CAS, DBSC BIOL102 lecture notes by: Dr. Mustafa A. Mansi. The Phylogenetic Systematics (Phylogeny and Systematics)
") - Phylogeny? - Systematics? The Phylogenetic Systematics (Phylogeny and Systematics) - Phylogenetic systematics? Connection between phylogeny and classification. - Phylogenetic systematics informs the
- Phylogeny? - Systematics? The Phylogenetic Systematics (Phylogeny and Systematics) - Phylogenetic systematics? Connection between phylogeny and classification. - Phylogenetic systematics informs the
Phylogenetic Tree Reconstruction
 I519 Introduction to Bioinformatics, 2011 Phylogenetic Tree Reconstruction Yuzhen Ye (yye@indiana.edu) School of Informatics & Computing, IUB Evolution theory Speciation Evolution of new organisms is driven
Evolution of Body Size in Bears. How to Build and Use a Phylogeny
 Evolution of Body Size in Bears How to Build and Use a Phylogeny Lesson II Using a Phylogeny Objectives for Lesson II: 1. Overview of concepts 1. Simple ancestral state reconstruction on the bear phylogeny
"PRINCIPLES OF PHYLOGENETICS: ECOLOGY AND EVOLUTION" Integrative Biology 200B Spring 2011 University of California, Berkeley
 "PRINCIPLES OF PHYLOGENETICS: ECOLOGY AND EVOLUTION" Integrative Biology 200B Spring 2011 University of California, Berkeley B.D. Mishler March 31, 2011. Reticulation,"Phylogeography," and Population Biology:
Phylogenetic Analysis. Han Liang, Ph.D. Assistant Professor of Bioinformatics and Computational Biology UT MD Anderson Cancer Center
 Phylogenetic Analysis Han Liang, Ph.D. Assistant Professor of Bioinformatics and Computational Biology UT MD Anderson Cancer Center Outline Basic Concepts Tree Construction Methods Distance-based methods
DNA-based species delimitation
 DNA-based species delimitation Phylogenetic species concept based on tree topologies Ø How to set species boundaries? Ø Automatic species delimitation? druhů? DNA barcoding Species boundaries recognized
"PRINCIPLES OF PHYLOGENETICS: ECOLOGY AND EVOLUTION" Integrative Biology 200B Spring 2009 University of California, Berkeley
 "PRINCIPLES OF PHYLOGENETICS: ECOLOGY AND EVOLUTION" Integrative Biology 200B Spring 2009 University of California, Berkeley B.D. Mishler Jan. 22, 2009. Trees I. Summary of previous lecture: Hennigian
Integrative Biology 200A "PRINCIPLES OF PHYLOGENETICS" Spring 2012 University of California, Berkeley
 Integrative Biology 200A "PRINCIPLES OF PHYLOGENETICS" Spring 2012 University of California, Berkeley B.D. Mishler April 12, 2012. Phylogenetic trees IX: Below the "species level;" phylogeography; dealing
The origin and evolution of coral species richness in a marine biodiversity hotspot
 ORIGINAL ARTICLE doi:10.1111/evo.13402 The origin and evolution of coral species richness in a marine biodiversity hotspot Danwei Huang, 1,2 Emma E. Goldberg, 3 Loke Ming Chou, 1 and Kaustuv Roy 4 1 Department
X X (2) X Pr(X = x θ) (3)
 X Pr(X = x θ) (3)") Notes for 848 lecture 6: A ML basis for compatibility and parsimony Notation θ Θ (1) Θ is the space of all possible trees (and model parameters) θ is a point in the parameter space = a particular tree
Notes for 848 lecture 6: A ML basis for compatibility and parsimony Notation θ Θ (1) Θ is the space of all possible trees (and model parameters) θ is a point in the parameter space = a particular tree
Constructing Evolutionary/Phylogenetic Trees
 Constructing Evolutionary/Phylogenetic Trees 2 broad categories: istance-based methods Ultrametric Additive: UPGMA Transformed istance Neighbor-Joining Character-based Maximum Parsimony Maximum Likelihood
PO Box 11103, 9700 CC, Groningen, The Netherlands 2 INRIA research team MERE, UMR Systems Analysis and Biometrics, 2 place Pierre Viala,
 Downloaded from http://rspb.royalsocietypublishing.org/ on June 8, 208 Diversity-dependence brings molecular phylogenies closer to agreement with the fossil record Rampal S. Etienne, *, Bart Haegeman 2,
Biol 206/306 Advanced Biostatistics Lab 11 Models of Trait Evolution Fall 2016
 Biol 206/306 Advanced Biostatistics Lab 11 Models of Trait Evolution Fall 2016 By Philip J. Bergmann 0. Laboratory Objectives 1. Explore how evolutionary trait modeling can reveal different information
Phylogenetic diversity and conservation
 Phylogenetic diversity and conservation Dan Faith The Australian Museum Applied ecology and human dimensions in biological conservation Biota Program/ FAPESP Nov. 9-10, 2009 BioGENESIS Providing an evolutionary
Lesson 1 Syllabus Reference
 Lesson 1 Syllabus Reference Outcomes A student Explains how biological understanding has advanced through scientific discoveries, technological developments and the needs of society. Content The theory
Biol 206/306 Advanced Biostatistics Lab 12 Bayesian Inference
 Biol 206/306 Advanced Biostatistics Lab 12 Bayesian Inference By Philip J. Bergmann 0. Laboratory Objectives 1. Learn what Bayes Theorem and Bayesian Inference are 2. Reinforce the properties of Bayesian
Constructing Evolutionary/Phylogenetic Trees
 Constructing Evolutionary/Phylogenetic Trees 2 broad categories: Distance-based methods Ultrametric Additive: UPGMA Transformed Distance Neighbor-Joining Character-based Maximum Parsimony Maximum Likelihood
Patterns of host plant utilization and diversification in the brush-footed butterflies
 ORIGINAL ARTICLE doi:10.1111/evo.12593 Patterns of host plant utilization and diversification in the brush-footed butterflies Christopher A. Hamm 1,2 and James A. Fordyce 3 1 Department of Ecology and
Taming the Beast Workshop
 Workshop and Chi Zhang June 28, 2016 1 / 19 Species tree Species tree the phylogeny representing the relationships among a group of species Figure adapted from [Rogers and Gibbs, 2014] Gene tree the phylogeny
What explains patterns of biodiversity across the Tree of Life?
 Prospects & Overviews What explains patterns of biodiversity across the Tree of Life? New research is revealing the causes of the dramatic variation in species numbers across branches of the Tree of Life
AToL: Collaborative research on ant phylogeny: a comprehensive evolutionary tree for the world s premier social organisms
 AToL: Collaborative research on ant phylogeny: a comprehensive evolutionary tree for the world s premier social organisms NSF EF-0431330; 10/01/2004 09/30/2009 P.S.Ward1, Seán Brady2, Brian Fisher3 & Ted
1/27/2010. Systematics and Phylogenetics of the. An Introduction. Taxonomy and Systematics
 Systematics and Phylogenetics of the Amphibia: An Introduction Taxonomy and Systematics Taxonomy, the science of describing biodiversity, mainly naming unnamed species, and arranging the diversity into
Historical Biogeography. Historical Biogeography. Systematics
 Historical Biogeography I. Definitions II. Fossils: problems with fossil record why fossils are important III. Phylogeny IV. Phenetics VI. Phylogenetic Classification Disjunctions debunked: Examples VII.
Likelihood Ratio Tests for Detecting Positive Selection and Application to Primate Lysozyme Evolution
 Likelihood Ratio Tests for Detecting Positive Selection and Application to Primate Lysozyme Evolution Ziheng Yang Department of Biology, University College, London An excess of nonsynonymous substitutions
Insect-Plant Interactions
 Insect-Plant Interactions Phytophagous insects account for approximately 40% of all described insects. In 1964 Paul Ehrlich and Peter Raven published a paper that argued that the incredible proliferation
Modes of Macroevolution
 Modes of Macroevolution Macroevolution is used to refer to any evolutionary change at or above the level of species. Darwin illustrated the combined action of descent with modification, the principle of