"PRINCIPLES OF PHYLOGENETICS: ECOLOGY AND EVOLUTION" Integrative Biology 200B Spring 2011 University of California, Berkeley
|
|
|
- Karin Dennis
- 5 years ago
- Views:
Transcription
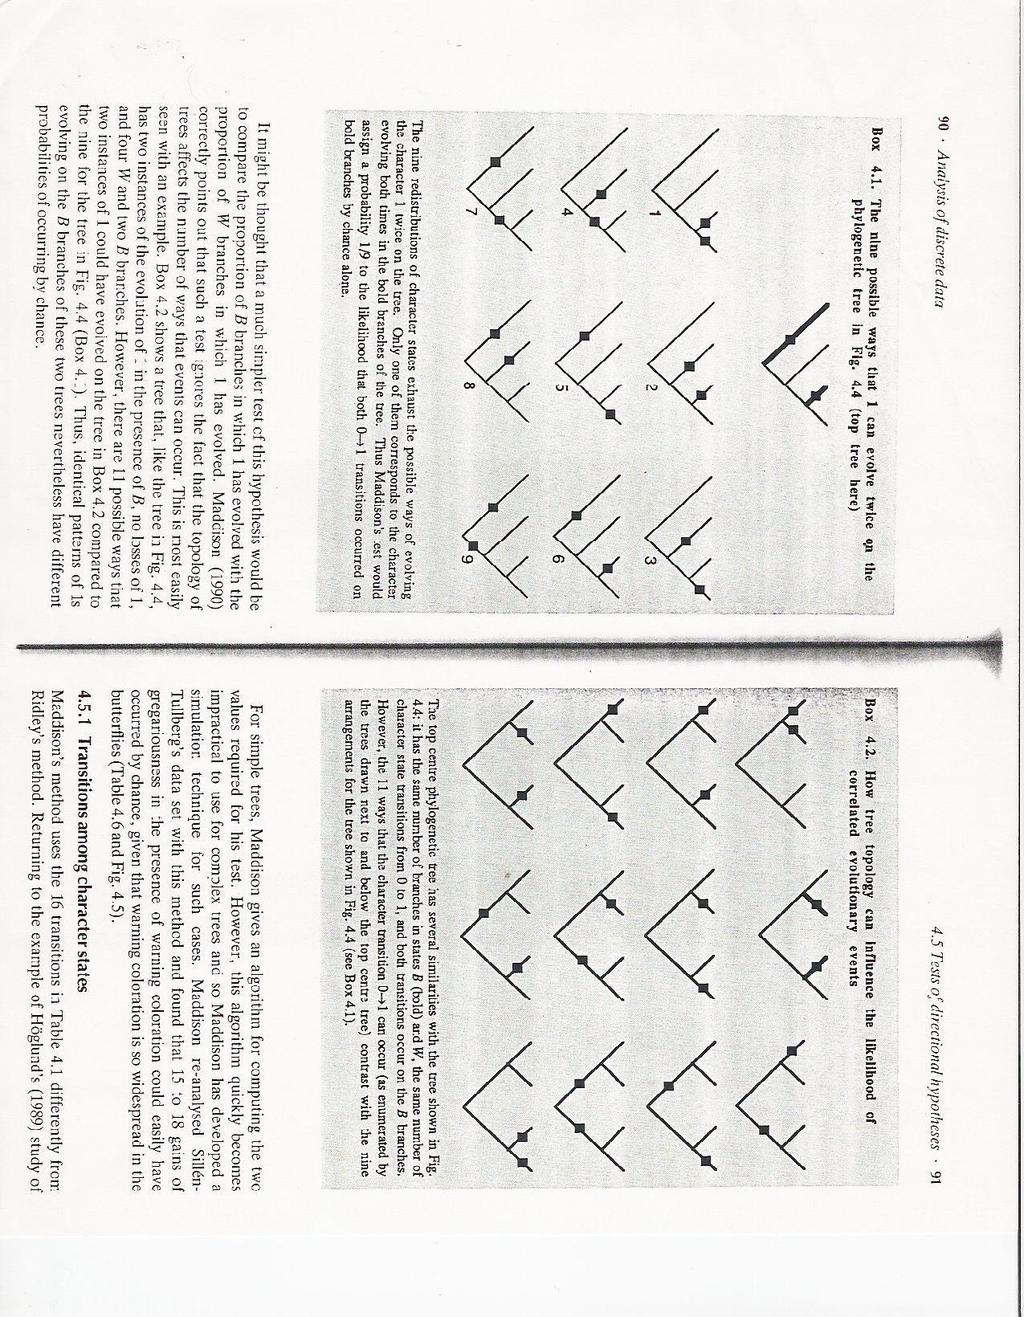
1 "PRINCIPLES OF PHYLOGENETICS: ECOLOGY AND EVOLUTION" Integrative Biology 200B Spring 2011 University of California, Berkeley B.D. Mishler Feb. 1, Qualitative character evolution (cont.) - comparing two or more characters 1. Correlated evolution of two binary traits under the parsimony criterion Maddison's (1990) concentrated changes test was one of the first tests introduced to test for correlations in the evolution of discrete traits, in a phylogenetic context. The test examines the question: are changes in character B concentrated on portions of the phylogeny where character A has a particular state, more than expected by chance? Examples shown on the following pages: Does larval gregariousness in butterflies evolve more often than expected in lineages with warning coloration? Does dioecy evolve from hermaphroditism more often than expected in lineages that have fleshy (vs. dry) fruits? The test proceeds in several steps: 1) first reconstruct the evolution of character A on the tree. This is considered fixed an independent factor that may influence evolution of character B, but is not dependent upon it. 2) character B is mapped on the tree, and the total number of evolutionary transitions (gains and losses), and the number of transitions that occur against each background in trait A, are tabulated; 3) by exact calculation, or simulation, the number of possible ways to arrange the same number of changes on the given phylogeny are calculated, along with the number of arrangements which involve as many or more changes against the relevant background of character A. 4) The significance of the observed pattern is calculated as the proportion of possible arrangements with as many or more changes located in the selected background of character A. 4 gains (out of 5 gains, 1 loss) on black branches: p = ways to arrange 2 gains and 0 losses 15 have 2 gains on black branches
2
3
4
5 2. Maximum likelihood principles, and applications to discrete characters Maximum likelihood (ML) principles provide an alternative to parsimony in the reconstruction of phylogenies and estimation of ancestral states. ML also represents an important shift in thinking from standard probabilistic statistics. In standard statistics we focus on the probability of a given observation under a null hypothesis. If the actual observations are considered very unlikely, then we reject the null hypothesis. However, we don't actually accept a particular alternative hypothesis. For example, consider a t-test of the following observations: Treatment A: 5, 8, 10 (mean = 7.7, sd = 2.5) Treatment B: 8, 12, 15 (mean = 11.7, sd = 3.5) Null hypothesis: Assume that observations represent a finite sample from a normal distribution (in other words, the process in the natural world that generates these data would generate a normal distribution if you collected an infinite sample) assume that the means and variances of those distributions are equal in the two samples if these assumptions are true, the probability of drawing two samples that differ by as much or more as the two above is Pr(d H0) = note that we can describe the full distribution of possible outcomes, in terms of the differences between the two groups, which will be a normal distribution that sums to 1. Maximum likelihood reverses the entire process. Let's assume that our data are real and true, and they reflect the outcome of some unknown process or model. Can we calculate the likelihood of the model, given these data, and compare that to the likelihood of alternative models. We are searching for the maximum likelihood model the model of the world that best fits the data. The problem is that there are an infinite number of possible models, so unlike probability we can't describe the entire likelihood space as a distribution that sums to 1. So how can we calculate their relative likelihoods? The fundamental insight (Edwards 1972) that makes ML statistics possible is that: L (m d) Pr (d m) Thus, we can obtain relative likelihoods of alternative models and compare them. One of those alternatives could be the traditional null hypothesis, leading to the same significance test, but in general the ability to specify a range of alternatives enhances our ability to explore specific hypotheses with the data. One of the main drawbacks is that it can be quite difficult in some cases to find the best model under ML, if there is no analytic solution.
6 Likelihood estimation of ancestral states and rates of character evolution on a phylogeny: We'll start with one of the simplest problem in phylogenetics: estimating the rates of character evolution for a binary trait. First consider the problem of evolution along a single branch: α = the instantaneous forward transition rate from 0 -> 1 β = the instantaneous reverse transition rate from 1 -> 0 With a little calculus one can show that the probabilities of change along a branch of length t are: From: To: P 00 = 1 P 01 P 10 = β 1 exp ( α + β)t α + β ( [ ]) 1 P 01 = α 1 exp ( α + β)t α + β ( [ ]) P 11 = 1 P 10 If one assumes that the backward and forward transition rates are the same, P01 and P10 also are the same and simplify considerably. For example: α = 0.5, β = 0.5, t = 1 To: From: For example: α = 0.8, β = 0.2, t = 1 To: From: For example: α = 0.8, β = 0.0, t =
.")

7 The first REALLY important thing about maximum likelihood view of evolutionary change is that branch lengths matter (unlike parsimony). Given instantaneous rates of change, α and β, a branch will eventually converge on a probability α that it ends in state 1 and probability β that it ends in state 0, regardless of the initial state. E.g. α = 0.8, β = 0.2 If both rates are lower, but similar ratio to each other, the branches will converge to the same point, but it will take longer. For α = 0.4, β = 0.1
8 ML estimation of transition rates and ancestral states 2 1. Calculate likelihood for all possible rates over all possible combinations of ancestral states 2. Sum probabilities over each ancestral set; max value = ML estimate of transition rate 3. Now, using that rate, evaluate likelihood of each ancestral set 4. Sum likelihoods for individual states at each node overall all possible values at other nodes; normalize to sum of 1 to get likelihood of state 0 and 1 at each internal node
9 phylogeny and species trait values BL=1.32 t3 t3=0 What is the likelihood of any one set of ancestral states given a hypothesized transition rate (assume equal forwards and backwards rates): Let A = 0, B = 1, alpha = beta = 0.3 A BL=0.93 B BL=0.39 BL=0.39 t2 t1 t2=1 t1=1 overall likelihood of this combination is the product of the individual likelihoods on each branch: A->B = P01,0.93 = B->t1 = P11,0.39 = B->t2 = P11,0.39 = A->t3 = P00,1.32 = prod =
10 phylogeny and species trait values A B t3 t2 t likelihood likelihood of transition rates depending on hypothesized ancestral node values (A,B) ML rate = (0,1) (1,1) (0,0) sum (1,0) rate
11 phylogeny and species trait values given ML rate = , what are probabilities of each combination of ancestral states (A,B) t3 0 A \ B 0 1 P(A) L(A) normalized A B t2 1 P(B) L(B) normaliz ed t1 1
12 Schluter et al Evolution
13 Likelihood ratio tests a measure of support for alternative hypotheses LR = -2*ln(L 1 /L 2 ) For two hypotheses with the same number of parameters, there is no exact significance value attached to the LR. Values greater than 2 are considered 'strong support' For nested hypotheses with different numbers of parameters, LR is distributed as a chi-square with df = the difference in number of parameters For example: If we find the maximum likelihood with alpha and beta fit independently: al = 0.59 be = 0.31 L(m) If we allow only one transition rate, such that al=be, then: al = be = inf L 0.25 LR = -2*ln(.25/.256) = 0.05 chisq(0.05, df=1) = 0.82 So these data are insufficient to reject a single rates model.
14 Pagel's (1994) discrete test of correlated evolution: Same idea as above, but test for parameters of dependence in trait change. For example: q12 is the probability that trait 2 changes from 0 -> 1, when trait 1 = 0 q34 is the probability that trait 2 changes from 0 -> 1, when trait 1 = 1 For an instantaneous model of change, assume they don't change simultaneously Model with full dependence has 8 parameters If traits evolve independently, there are only 4 parameters, because: q12 = q34; q13 = q24; q31 = q42; q21 = q43

15 ln(l(independent)) = ln(l(dependent)) = *ln(LI/LD) = 6.96 chisq(6.96,4) = 0.14 q12 = 0.29 gain of oestrous swellings in single-male breeding systems q34 = 3.45 gain of OS in multi-male breeding systems q13 = 1.87 gain of multi-male BS in absence of OS CITATIONS: Pagel M. (1994) Detecting correlated evolution on phylogenies: a general method for the comparative analysis of discrete characters. Proc. R. Soc. Lond. B, 255, Pagel M. (1999) The maximum likelihood approach to reconstructing ancestral character states of discrete characters on phylogenies. Syst. Biol., 48, Schluter D., Price T., Mooers A. & Ludwig D. (1997) Likelihood of ancestor states in adaptive radiation. Evolution, 51,
"PRINCIPLES OF PHYLOGENETICS: ECOLOGY AND EVOLUTION" Integrative Biology 200 Spring 2018 University of California, Berkeley
 "PRINCIPLES OF PHYLOGENETICS: ECOLOGY AND EVOLUTION" Integrative Biology 200 Spring 2018 University of California, Berkeley D.D. Ackerly Feb. 26, 2018 Maximum Likelihood Principles, and Applications to
Integrative Biology 200 "PRINCIPLES OF PHYLOGENETICS" Spring 2018 University of California, Berkeley
 Integrative Biology 200 "PRINCIPLES OF PHYLOGENETICS" Spring 2018 University of California, Berkeley B.D. Mishler Feb. 14, 2018. Phylogenetic trees VI: Dating in the 21st century: clocks, & calibrations;
Some of these slides have been borrowed from Dr. Paul Lewis, Dr. Joe Felsenstein. Thanks!
 Some of these slides have been borrowed from Dr. Paul Lewis, Dr. Joe Felsenstein. Thanks! Paul has many great tools for teaching phylogenetics at his web site: http://hydrodictyon.eeb.uconn.edu/people/plewis
Evolution of Body Size in Bears. How to Build and Use a Phylogeny
 Evolution of Body Size in Bears How to Build and Use a Phylogeny Lesson II Using a Phylogeny Objectives for Lesson II: 1. Overview of concepts 1. Simple ancestral state reconstruction on the bear phylogeny
Some of these slides have been borrowed from Dr. Paul Lewis, Dr. Joe Felsenstein. Thanks!
 Some of these slides have been borrowed from Dr. Paul Lewis, Dr. Joe Felsenstein. Thanks! Paul has many great tools for teaching phylogenetics at his web site: http://hydrodictyon.eeb.uconn.edu/people/plewis
Non-independence in Statistical Tests for Discrete Cross-species Data
 J. theor. Biol. (1997) 188, 507514 Non-independence in Statistical Tests for Discrete Cross-species Data ALAN GRAFEN* AND MARK RIDLEY * St. John s College, Oxford OX1 3JP, and the Department of Zoology,
Integrative Biology 200 "PRINCIPLES OF PHYLOGENETICS" Spring 2016 University of California, Berkeley. Parsimony & Likelihood [draft]
![Integrative Biology 200 PRINCIPLES OF PHYLOGENETICS Spring 2016 University of California, Berkeley. Parsimony & Likelihood [draft]](/thumbs/83/87443456.jpg "Integrative Biology 200 PRINCIPLES OF PHYLOGENETICS Spring 2016 University of California, Berkeley. Parsimony & Likelihood [draft]") Integrative Biology 200 "PRINCIPLES OF PHYLOGENETICS" Spring 2016 University of California, Berkeley K.W. Will Parsimony & Likelihood [draft] 1. Hennig and Parsimony: Hennig was not concerned with parsimony
Integrative Biology 200 "PRINCIPLES OF PHYLOGENETICS" Spring 2016 University of California, Berkeley K.W. Will Parsimony & Likelihood [draft] 1. Hennig and Parsimony: Hennig was not concerned with parsimony
Power of the Concentrated Changes Test for Correlated Evolution
 Syst. Biol. 48(1):170 191, 1999 Power of the Concentrated Changes Test for Correlated Evolution PATRICK D. LORCH 1,3 AND JOHN MCA. EADIE 2 1 Department of Biology, University of Toronto at Mississauga,
Likelihood Ratio Tests for Detecting Positive Selection and Application to Primate Lysozyme Evolution
 Likelihood Ratio Tests for Detecting Positive Selection and Application to Primate Lysozyme Evolution Ziheng Yang Department of Biology, University College, London An excess of nonsynonymous substitutions
ASYMMETRIES IN PHYLOGENETIC DIVERSIFICATION AND CHARACTER CHANGE CAN BE UNTANGLED
 doi:1.1111/j.1558-5646.27.252.x ASYMMETRIES IN PHYLOGENETIC DIVERSIFICATION AND CHARACTER CHANGE CAN BE UNTANGLED Emmanuel Paradis Institut de Recherche pour le Développement, UR175 CAVIAR, GAMET BP 595,
POPULATION GENETICS Winter 2005 Lecture 17 Molecular phylogenetics
 POPULATION GENETICS Winter 2005 Lecture 17 Molecular phylogenetics - in deriving a phylogeny our goal is simply to reconstruct the historical relationships between a group of taxa. - before we review the
Phenotypic Evolution. and phylogenetic comparative methods. G562 Geometric Morphometrics. Department of Geological Sciences Indiana University
 Phenotypic Evolution and phylogenetic comparative methods Phenotypic Evolution Change in the mean phenotype from generation to generation... Evolution = Mean(genetic variation * selection) + Mean(genetic
Homework Assignment, Evolutionary Systems Biology, Spring Homework Part I: Phylogenetics:
 Homework Assignment, Evolutionary Systems Biology, Spring 2009. Homework Part I: Phylogenetics: Introduction. The objective of this assignment is to understand the basics of phylogenetic relationships
AP Biology. Cladistics
 Cladistics Kingdom Summary Review slide Review slide Classification Old 5 Kingdom system Eukaryote Monera, Protists, Plants, Fungi, Animals New 3 Domain system reflects a greater understanding of evolution
Appendix from L. J. Revell, On the Analysis of Evolutionary Change along Single Branches in a Phylogeny
 008 by The University of Chicago. All rights reserved.doi: 10.1086/588078 Appendix from L. J. Revell, On the Analysis of Evolutionary Change along Single Branches in a Phylogeny (Am. Nat., vol. 17, no.
User s Manual for. Continuous. (copyright M. Pagel) Mark Pagel School of Animal and Microbial Sciences University of Reading Reading RG6 6AJ UK
 Mark Pagel School of Animal and Microbial Sciences University of Reading Reading RG6 6AJ UK") User s Manual for Continuous (copyright M. Pagel) Mark Pagel School of Animal and Microbial Sciences University of Reading Reading RG6 6AJ UK email: m.pagel@rdg.ac.uk (www.ams.reading.ac.uk/zoology/pagel/)
User s Manual for Continuous (copyright M. Pagel) Mark Pagel School of Animal and Microbial Sciences University of Reading Reading RG6 6AJ UK email: m.pagel@rdg.ac.uk (www.ams.reading.ac.uk/zoology/pagel/)
CIVL /8904 T R A F F I C F L O W T H E O R Y L E C T U R E - 8
 CIVL - 7904/8904 T R A F F I C F L O W T H E O R Y L E C T U R E - 8 Chi-square Test How to determine the interval from a continuous distribution I = Range 1 + 3.322(logN) I-> Range of the class interval
Chapter 7: Models of discrete character evolution
 Chapter 7: Models of discrete character evolution pdf version R markdown to recreate analyses Biological motivation: Limblessness as a discrete trait Squamates, the clade that includes all living species
--Therefore, congruence among all postulated homologies provides a test of any single character in question [the central epistemological advance].
![--Therefore, congruence among all postulated homologies provides a test of any single character in question [the central epistemological advance].](/thumbs/86/93197257.jpg "--Therefore, congruence among all postulated homologies provides a test of any single character in question [the central epistemological advance].") Integrative Biology 200A "PRINCIPLES OF PHYLOGENETICS" Spring 2008 University of California, Berkeley B.D. Mishler Jan. 29, 2008. The Hennig Principle: Homology, Synapomorphy, Rooting issues The fundamental
Integrative Biology 200A "PRINCIPLES OF PHYLOGENETICS" Spring 2008 University of California, Berkeley B.D. Mishler Jan. 29, 2008. The Hennig Principle: Homology, Synapomorphy, Rooting issues The fundamental
GENETICS - CLUTCH CH.22 EVOLUTIONARY GENETICS.
 !! www.clutchprep.com CONCEPT: OVERVIEW OF EVOLUTION Evolution is a process through which variation in individuals makes it more likely for them to survive and reproduce There are principles to the theory
Constructing Evolutionary/Phylogenetic Trees
 Constructing Evolutionary/Phylogenetic Trees 2 broad categories: Distance-based methods Ultrametric Additive: UPGMA Transformed Distance Neighbor-Joining Character-based Maximum Parsimony Maximum Likelihood
"PRINCIPLES OF PHYLOGENETICS: ECOLOGY AND EVOLUTION" Integrative Biology 200B Spring 2009 University of California, Berkeley
 "PRINCIPLES OF PHYLOGENETICS: ECOLOGY AND EVOLUTION" Integrative Biology 200B Spring 2009 University of California, Berkeley B.D. Mishler Jan. 22, 2009. Trees I. Summary of previous lecture: Hennigian
Analysis of variance (ANOVA) Comparing the means of more than two groups
 Comparing the means of more than two groups") Analysis of variance (ANOVA) Comparing the means of more than two groups Example: Cost of mating in male fruit flies Drosophila Treatments: place males with and without unmated (virgin) females Five treatments
Analysis of variance (ANOVA) Comparing the means of more than two groups Example: Cost of mating in male fruit flies Drosophila Treatments: place males with and without unmated (virgin) females Five treatments
Estimating a Binary Character s Effect on Speciation and Extinction
 Syst. Biol. 56(5):701 710, 2007 Copyright c Society of Systematic Biologists ISSN: 1063-5157 print / 1076-836X online DOI: 10.1080/10635150701607033 Estimating a Binary Character s Effect on Speciation
Constructing Evolutionary/Phylogenetic Trees
 Constructing Evolutionary/Phylogenetic Trees 2 broad categories: istance-based methods Ultrametric Additive: UPGMA Transformed istance Neighbor-Joining Character-based Maximum Parsimony Maximum Likelihood
Maximum Likelihood Tree Estimation. Carrie Tribble IB Feb 2018
 Maximum Likelihood Tree Estimation Carrie Tribble IB 200 9 Feb 2018 Outline 1. Tree building process under maximum likelihood 2. Key differences between maximum likelihood and parsimony 3. Some fancy extras
UoN, CAS, DBSC BIOL102 lecture notes by: Dr. Mustafa A. Mansi. The Phylogenetic Systematics (Phylogeny and Systematics)
") - Phylogeny? - Systematics? The Phylogenetic Systematics (Phylogeny and Systematics) - Phylogenetic systematics? Connection between phylogeny and classification. - Phylogenetic systematics informs the
- Phylogeny? - Systematics? The Phylogenetic Systematics (Phylogeny and Systematics) - Phylogenetic systematics? Connection between phylogeny and classification. - Phylogenetic systematics informs the
Theory of Evolution Charles Darwin
 Theory of Evolution Charles arwin 858-59: Origin of Species 5 year voyage of H.M.S. eagle (83-36) Populations have variations. Natural Selection & Survival of the fittest: nature selects best adapted varieties
Integrative Biology 200A "PRINCIPLES OF PHYLOGENETICS" Spring 2012 University of California, Berkeley
 Integrative Biology 200A "PRINCIPLES OF PHYLOGENETICS" Spring 2012 University of California, Berkeley B.D. Mishler Feb. 7, 2012. Morphological data IV -- ontogeny & structure of plants The last frontier
Biol 206/306 Advanced Biostatistics Lab 11 Models of Trait Evolution Fall 2016
 Biol 206/306 Advanced Biostatistics Lab 11 Models of Trait Evolution Fall 2016 By Philip J. Bergmann 0. Laboratory Objectives 1. Explore how evolutionary trait modeling can reveal different information
Classification and Phylogeny
 Classification and Phylogeny The diversity of life is great. To communicate about it, there must be a scheme for organization. There are many species that would be difficult to organize without a scheme
Amira A. AL-Hosary PhD of infectious diseases Department of Animal Medicine (Infectious Diseases) Faculty of Veterinary Medicine Assiut
 Faculty of Veterinary Medicine Assiut") Amira A. AL-Hosary PhD of infectious diseases Department of Animal Medicine (Infectious Diseases) Faculty of Veterinary Medicine Assiut University-Egypt Phylogenetic analysis Phylogenetic Basics: Biological
Amira A. AL-Hosary PhD of infectious diseases Department of Animal Medicine (Infectious Diseases) Faculty of Veterinary Medicine Assiut University-Egypt Phylogenetic analysis Phylogenetic Basics: Biological
Difference in two or more average scores in different groups
 ANOVAs Analysis of Variance (ANOVA) Difference in two or more average scores in different groups Each participant tested once Same outcome tested in each group Simplest is one-way ANOVA (one variable as
Concepts and Methods in Molecular Divergence Time Estimation
 Concepts and Methods in Molecular Divergence Time Estimation 26 November 2012 Prashant P. Sharma American Museum of Natural History Overview 1. Why do we date trees? 2. The molecular clock 3. Local clocks
BIOL Biometry LAB 6 - SINGLE FACTOR ANOVA and MULTIPLE COMPARISON PROCEDURES
 BIOL 458 - Biometry LAB 6 - SINGLE FACTOR ANOVA and MULTIPLE COMPARISON PROCEDURES PART 1: INTRODUCTION TO ANOVA Purpose of ANOVA Analysis of Variance (ANOVA) is an extremely useful statistical method
BIOLOGY 317 Spring First Hourly Exam 4/20/12
 Name: Lab sect. (TA name/time): BIOLOGY 317 Spring 2012 First Hourly Exam 4/20/12 1) (24 pts) Match the letter of the family given on the right with the characteristics for a plant described on the left.
Classification and Phylogeny
 Classification and Phylogeny The diversity it of life is great. To communicate about it, there must be a scheme for organization. There are many species that would be difficult to organize without a scheme
Page 1. Evolutionary Trees. Why build evolutionary tree? Outline
 Page Evolutionary Trees Russ. ltman MI S 7 Outline. Why build evolutionary trees?. istance-based vs. character-based methods. istance-based: Ultrametric Trees dditive Trees. haracter-based: Perfect phylogeny
POSITIVE CORRELATION BETWEEN DIVERSIFICATION RATES AND PHENOTYPIC EVOLVABILITY CAN MIMIC PUNCTUATED EQUILIBRIUM ON MOLECULAR PHYLOGENIES
 doi:10.1111/j.1558-5646.2012.01631.x POSITIVE CORRELATION BETWEEN DIVERSIFICATION RATES AND PHENOTYPIC EVOLVABILITY CAN MIMIC PUNCTUATED EQUILIBRIUM ON MOLECULAR PHYLOGENIES Daniel L. Rabosky 1,2,3 1 Department
From Individual-based Population Models to Lineage-based Models of Phylogenies
 From Individual-based Population Models to Lineage-based Models of Phylogenies Amaury Lambert (joint works with G. Achaz, H.K. Alexander, R.S. Etienne, N. Lartillot, H. Morlon, T.L. Parsons, T. Stadler)
Probabilistic modeling and molecular phylogeny
 Probabilistic modeling and molecular phylogeny Anders Gorm Pedersen Molecular Evolution Group Center for Biological Sequence Analysis Technical University of Denmark (DTU) What is a model? Mathematical
Dr. Amira A. AL-Hosary
 Phylogenetic analysis Amira A. AL-Hosary PhD of infectious diseases Department of Animal Medicine (Infectious Diseases) Faculty of Veterinary Medicine Assiut University-Egypt Phylogenetic Basics: Biological
Discrete & continuous characters: The threshold model
 Discrete & continuous characters: The threshold model Discrete & continuous characters: the threshold model So far we have discussed continuous & discrete character models separately for estimating ancestral
Testing adaptive hypotheses What is (an) adaptation? Testing adaptive hypotheses What is (an) adaptation?
 adaptation? Testing adaptive hypotheses What is (an) adaptation?") What is (an) adaptation? 1 A trait, or integrated set of traits, that increases the fitness of an organism. The process of improving the fit of phenotype to environment through natural selection What is
What is (an) adaptation? 1 A trait, or integrated set of traits, that increases the fitness of an organism. The process of improving the fit of phenotype to environment through natural selection What is
LAB 4: PHYLOGENIES & MAPPING TRAITS
 LAB 4: PHYLOGENIES & MAPPING TRAITS *This is a good day to check your Physcomitrella (protonema, buds, gametophores?) and Ceratopteris cultures (embryos, young sporophytes?)* Phylogeny Introduction The
Assessing an Unknown Evolutionary Process: Effect of Increasing Site- Specific Knowledge Through Taxon Addition
 Assessing an Unknown Evolutionary Process: Effect of Increasing Site- Specific Knowledge Through Taxon Addition David D. Pollock* and William J. Bruno* *Theoretical Biology and Biophysics, Los Alamos National
Using phylogenetics to estimate species divergence times... Basics and basic issues for Bayesian inference of divergence times (plus some digression)
") Using phylogenetics to estimate species divergence times... More accurately... Basics and basic issues for Bayesian inference of divergence times (plus some digression) "A comparison of the structures
Using phylogenetics to estimate species divergence times... More accurately... Basics and basic issues for Bayesian inference of divergence times (plus some digression) "A comparison of the structures
Cladistics and Bioinformatics Questions 2013
 AP Biology Name Cladistics and Bioinformatics Questions 2013 1. The following table shows the percentage similarity in sequences of nucleotides from a homologous gene derived from five different species
Statistical nonmolecular phylogenetics: can molecular phylogenies illuminate morphological evolution?
 Statistical nonmolecular phylogenetics: can molecular phylogenies illuminate morphological evolution? 30 July 2011. Joe Felsenstein Workshop on Molecular Evolution, MBL, Woods Hole Statistical nonmolecular
This is particularly true if you see long tails in your data. What are you testing? That the two distributions are the same!
 Two sample tests (part II): What to do if your data are not distributed normally: Option 1: if your sample size is large enough, don't worry - go ahead and use a t-test (the CLT will take care of non-normal
Lecture V Phylogeny and Systematics Dr. Kopeny
 Delivered 1/30 and 2/1 Lecture V Phylogeny and Systematics Dr. Kopeny Lecture V How to Determine Evolutionary Relationships: Concepts in Phylogeny and Systematics Textbook Reading: pp 425-433, 435-437
HYPOTHESIS TESTING: THE CHI-SQUARE STATISTIC
 1 HYPOTHESIS TESTING: THE CHI-SQUARE STATISTIC 7 steps of Hypothesis Testing 1. State the hypotheses 2. Identify level of significant 3. Identify the critical values 4. Calculate test statistics 5. Compare
Thursday, January 14. Teaching Point: SWBAT. assess their knowledge to prepare for the Evolution Summative Assessment. (TOMORROW) Agenda:
 Agenda:") Thursday, January 14 Teaching Point: SWBAT. assess their knowledge to prepare for the Evolution Summative Assessment. (TOMORROW) Agenda: 1. Show Hinsz your completed Review WS 2. Discuss answers to Review
Thursday, January 14 Teaching Point: SWBAT. assess their knowledge to prepare for the Evolution Summative Assessment. (TOMORROW) Agenda: 1. Show Hinsz your completed Review WS 2. Discuss answers to Review
A Phylogenetic Network Construction due to Constrained Recombination
 A Phylogenetic Network Construction due to Constrained Recombination Mohd. Abdul Hai Zahid Research Scholar Research Supervisors: Dr. R.C. Joshi Dr. Ankush Mittal Department of Electronics and Computer
Statistical Distribution Assumptions of General Linear Models
 Statistical Distribution Assumptions of General Linear Models Applied Multilevel Models for Cross Sectional Data Lecture 4 ICPSR Summer Workshop University of Colorado Boulder Lecture 4: Statistical Distributions
X X (2) X Pr(X = x θ) (3)
 X Pr(X = x θ) (3)") Notes for 848 lecture 6: A ML basis for compatibility and parsimony Notation θ Θ (1) Θ is the space of all possible trees (and model parameters) θ is a point in the parameter space = a particular tree
Notes for 848 lecture 6: A ML basis for compatibility and parsimony Notation θ Θ (1) Θ is the space of all possible trees (and model parameters) θ is a point in the parameter space = a particular tree
Biology 211 (2) Week 1 KEY!
 Week 1 KEY!") Biology 211 (2) Week 1 KEY Chapter 1 KEY FIGURES: 1.2, 1.3, 1.4, 1.5, 1.6, 1.7 VOCABULARY: Adaptation: a trait that increases the fitness Cells: a developed, system bound with a thin outer layer made of
Biology 211 (2) Week 1 KEY Chapter 1 KEY FIGURES: 1.2, 1.3, 1.4, 1.5, 1.6, 1.7 VOCABULARY: Adaptation: a trait that increases the fitness Cells: a developed, system bound with a thin outer layer made of
Some Aspects of Ancestor Reconstruction in the Study of Floral Assembly. Some Aspects of Ancestor Reconstruction in the Study of Floral Assembly
 Some Aspects of Ancestor Reconstruction in the Study of Floral Assembly Y Christopher Hardy James C. Parks Herbarium Dept. of Biology Millersville University of Pennsylvania 7 Jan 2009 Floral Assembly
Estimating Phylogenies (Evolutionary Trees) II. Biol4230 Thurs, March 2, 2017 Bill Pearson Jordan 6-057
 II. Biol4230 Thurs, March 2, 2017 Bill Pearson Jordan 6-057") Estimating Phylogenies (Evolutionary Trees) II Biol4230 Thurs, March 2, 2017 Bill Pearson wrp@virginia.edu 4-2818 Jordan 6-057 Tree estimation strategies: Parsimony?no model, simply count minimum number
Estimating Phylogenies (Evolutionary Trees) II Biol4230 Thurs, March 2, 2017 Bill Pearson wrp@virginia.edu 4-2818 Jordan 6-057 Tree estimation strategies: Parsimony?no model, simply count minimum number
T.I.H.E. IT 233 Statistics and Probability: Sem. 1: 2013 ESTIMATION AND HYPOTHESIS TESTING OF TWO POPULATIONS
 ESTIMATION AND HYPOTHESIS TESTING OF TWO POPULATIONS In our work on hypothesis testing, we used the value of a sample statistic to challenge an accepted value of a population parameter. We focused only
Phylogenetic inference
 Phylogenetic inference Bas E. Dutilh Systems Biology: Bioinformatic Data Analysis Utrecht University, March 7 th 016 After this lecture, you can discuss (dis-) advantages of different information types
Integrating Fossils into Phylogenies. Throughout the 20th century, the relationship between paleontology and evolutionary biology has been strained.
 IB 200B Principals of Phylogenetic Systematics Spring 2011 Integrating Fossils into Phylogenies Throughout the 20th century, the relationship between paleontology and evolutionary biology has been strained.
Section 9c. Propensity scores. Controlling for bias & confounding in observational studies
 Section 9c Propensity scores Controlling for bias & confounding in observational studies 1 Logistic regression and propensity scores Consider comparing an outcome in two treatment groups: A vs B. In a
Econ 583 Homework 7 Suggested Solutions: Wald, LM and LR based on GMM and MLE
 Econ 583 Homework 7 Suggested Solutions: Wald, LM and LR based on GMM and MLE Eric Zivot Winter 013 1 Wald, LR and LM statistics based on generalized method of moments estimation Let 1 be an iid sample
Chi Square Analysis M&M Statistics. Name Period Date
 Chi Square Analysis M&M Statistics Name Period Date Have you ever wondered why the package of M&Ms you just bought never seems to have enough of your favorite color? Or, why is it that you always seem
A (short) introduction to phylogenetics
 introduction to phylogenetics") A (short) introduction to phylogenetics Thibaut Jombart, Marie-Pauline Beugin MRC Centre for Outbreak Analysis and Modelling Imperial College London Genetic data analysis with PR Statistics, Millport Field
A (short) introduction to phylogenetics Thibaut Jombart, Marie-Pauline Beugin MRC Centre for Outbreak Analysis and Modelling Imperial College London Genetic data analysis with PR Statistics, Millport Field
Rapid evolution of the cerebellum in humans and other great apes
 Rapid evolution of the cerebellum in humans and other great apes Article Accepted Version Barton, R. A. and Venditti, C. (2014) Rapid evolution of the cerebellum in humans and other great apes. Current
Algorithms in Bioinformatics
 Algorithms in Bioinformatics Sami Khuri Department of Computer Science San José State University San José, California, USA khuri@cs.sjsu.edu www.cs.sjsu.edu/faculty/khuri Distance Methods Character Methods
Consistency Index (CI)
") Consistency Index (CI) minimum number of changes divided by the number required on the tree. CI=1 if there is no homoplasy negatively correlated with the number of species sampled Retention Index (RI)
Consistency Index (CI) minimum number of changes divided by the number required on the tree. CI=1 if there is no homoplasy negatively correlated with the number of species sampled Retention Index (RI)
C.DARWIN ( )
") C.DARWIN (1809-1882) LAMARCK Each evolutionary lineage has evolved, transforming itself, from a ancestor appeared by spontaneous generation DARWIN All organisms are historically interconnected. Their relationships
C.DARWIN (1809-1882) LAMARCK Each evolutionary lineage has evolved, transforming itself, from a ancestor appeared by spontaneous generation DARWIN All organisms are historically interconnected. Their relationships
Visual interpretation with normal approximation
 Visual interpretation with normal approximation H 0 is true: H 1 is true: p =0.06 25 33 Reject H 0 α =0.05 (Type I error rate) Fail to reject H 0 β =0.6468 (Type II error rate) 30 Accept H 1 Visual interpretation
Inferring Molecular Phylogeny
 Dr. Walter Salzburger he tree of life, ustav Klimt (1907) Inferring Molecular Phylogeny Inferring Molecular Phylogeny 55 Maximum Parsimony (MP): objections long branches I!! B D long branch attraction
Anatomy of a tree. clade is group of organisms with a shared ancestor. a monophyletic group shares a single common ancestor = tapirs-rhinos-horses
 Anatomy of a tree outgroup: an early branching relative of the interest groups sister taxa: taxa derived from the same recent ancestor polytomy: >2 taxa emerge from a node Anatomy of a tree clade is group
Testing quantitative genetic hypotheses about the evolutionary rate matrix for continuous characters
 Evolutionary Ecology Research, 2008, 10: 311 331 Testing quantitative genetic hypotheses about the evolutionary rate matrix for continuous characters Liam J. Revell 1 * and Luke J. Harmon 2 1 Department
Modeling continuous trait evolution in the absence of phylogenetic information
 Modeling continuous trait evolution in the absence of phylogenetic information Mariia Koroliuk GU university, EM in complex systems under the supervision of Daniele Silvestro June 29, 2014 Contents 1 Introduction
Phylogenetic relationship among S. castellii, S. cerevisiae and C. glabrata.
 Supplementary Note S2 Phylogenetic relationship among S. castellii, S. cerevisiae and C. glabrata. Phylogenetic trees reconstructed by a variety of methods from either single-copy orthologous loci (Class
HYPOTHESIS TESTING. Hypothesis Testing
 MBA 605 Business Analytics Don Conant, PhD. HYPOTHESIS TESTING Hypothesis testing involves making inferences about the nature of the population on the basis of observations of a sample drawn from the population.
Testing Independence
 Testing Independence Dipankar Bandyopadhyay Department of Biostatistics, Virginia Commonwealth University BIOS 625: Categorical Data & GLM 1/50 Testing Independence Previously, we looked at RR = OR = 1
Phylogeny 9/8/2014. Evolutionary Relationships. Data Supporting Phylogeny. Chapter 26
 Phylogeny Chapter 26 Taxonomy Taxonomy: ordered division of organisms into categories based on a set of characteristics used to assess similarities and differences Carolus Linnaeus developed binomial nomenclature,
Biol 206/306 Advanced Biostatistics Lab 12 Bayesian Inference
 Biol 206/306 Advanced Biostatistics Lab 12 Bayesian Inference By Philip J. Bergmann 0. Laboratory Objectives 1. Learn what Bayes Theorem and Bayesian Inference are 2. Reinforce the properties of Bayesian
Testing and Model Selection
 Testing and Model Selection This is another digression on general statistics: see PE App C.8.4. The EViews output for least squares, probit and logit includes some statistics relevant to testing hypotheses
STT 843 Key to Homework 1 Spring 2018
 STT 843 Key to Homework Spring 208 Due date: Feb 4, 208 42 (a Because σ = 2, σ 22 = and ρ 2 = 05, we have σ 2 = ρ 2 σ σ22 = 2/2 Then, the mean and covariance of the bivariate normal is µ = ( 0 2 and Σ
Michael Yaffe Lecture #5 (((A,B)C)D) Database Searching & Molecular Phylogenetics A B C D B C D
C)D) Database Searching & Molecular Phylogenetics A B C D B C D") 7.91 Lecture #5 Database Searching & Molecular Phylogenetics Michael Yaffe B C D B C D (((,B)C)D) Outline Distance Matrix Methods Neighbor-Joining Method and Related Neighbor Methods Maximum Likelihood
7.91 Lecture #5 Database Searching & Molecular Phylogenetics Michael Yaffe B C D B C D (((,B)C)D) Outline Distance Matrix Methods Neighbor-Joining Method and Related Neighbor Methods Maximum Likelihood
Simple logistic regression
 Simple logistic regression Biometry 755 Spring 2009 Simple logistic regression p. 1/47 Model assumptions 1. The observed data are independent realizations of a binary response variable Y that follows a
Integrative Biology 200A "PRINCIPLES OF PHYLOGENETICS" Spring 2008
 Integrative Biology 200A "PRINCIPLES OF PHYLOGENETICS" Spring 2008 University of California, Berkeley B.D. Mishler March 18, 2008. Phylogenetic Trees I: Reconstruction; Models, Algorithms & Assumptions
(Stevens 1991) 1. morphological characters should be assumed to be quantitative unless demonstrated otherwise
 1. morphological characters should be assumed to be quantitative unless demonstrated otherwise") Bot 421/521 PHYLOGENETIC ANALYSIS I. Origins A. Hennig 1950 (German edition) Phylogenetic Systematics 1966 B. Zimmerman (Germany, 1930 s) C. Wagner (Michigan, 1920-2000) II. Characters and character states
Bot 421/521 PHYLOGENETIC ANALYSIS I. Origins A. Hennig 1950 (German edition) Phylogenetic Systematics 1966 B. Zimmerman (Germany, 1930 s) C. Wagner (Michigan, 1920-2000) II. Characters and character states
Is the equal branch length model a parsimony model?
 Table 1: n approximation of the probability of data patterns on the tree shown in figure?? made by dropping terms that do not have the minimal exponent for p. Terms that were dropped are shown in red;
C3020 Molecular Evolution. Exercises #3: Phylogenetics
 C3020 Molecular Evolution Exercises #3: Phylogenetics Consider the following sequences for five taxa 1-5 and the known outgroup O, which has the ancestral states (note that sequence 3 has changed from
Applied Statistics for the Behavioral Sciences
 Applied Statistics for the Behavioral Sciences Chapter 8 One-sample designs Hypothesis testing/effect size Chapter Outline Hypothesis testing null & alternative hypotheses alpha ( ), significance level,
Week 8: Testing trees, Bootstraps, jackknifes, gene frequencies
 Week 8: Testing trees, ootstraps, jackknifes, gene frequencies Genome 570 ebruary, 2016 Week 8: Testing trees, ootstraps, jackknifes, gene frequencies p.1/69 density e log (density) Normal distribution:
Chapter 9: Beyond the Mk Model
 Chapter 9: Beyond the Mk Model Section 9.1: The Evolution of Frog Life History Strategies Frog reproduction is one of the most bizarrely interesting topics in all of biology. Across the nearly 6,000 species
UNIVERSITY OF MASSACHUSETTS Department of Mathematics and Statistics Applied Statistics Friday, January 15, 2016
 UNIVERSITY OF MASSACHUSETTS Department of Mathematics and Statistics Applied Statistics Friday, January 15, 2016 Work all problems. 60 points are needed to pass at the Masters Level and 75 to pass at the
Contingency Tables. Contingency tables are used when we want to looking at two (or more) factors. Each factor might have two more or levels.
 factors. Each factor might have two more or levels.") Contingency Tables Definition & Examples. Contingency tables are used when we want to looking at two (or more) factors. Each factor might have two more or levels. (Using more than two factors gets complicated,
Contingency Tables Definition & Examples. Contingency tables are used when we want to looking at two (or more) factors. Each factor might have two more or levels. (Using more than two factors gets complicated,
Phylogenetics: Bayesian Phylogenetic Analysis. COMP Spring 2015 Luay Nakhleh, Rice University
 Phylogenetics: Bayesian Phylogenetic Analysis COMP 571 - Spring 2015 Luay Nakhleh, Rice University Bayes Rule P(X = x Y = y) = P(X = x, Y = y) P(Y = y) = P(X = x)p(y = y X = x) P x P(X = x 0 )P(Y = y X
Macroevolution Part I: Phylogenies
 Macroevolution Part I: Phylogenies Taxonomy Classification originated with Carolus Linnaeus in the 18 th century. Based on structural (outward and inward) similarities Hierarchal scheme, the largest most
Chapter 26 Phylogeny and the Tree of Life
 Chapter 26 Phylogeny and the Tree of Life Chapter focus Shifting from the process of how evolution works to the pattern evolution produces over time. Phylogeny Phylon = tribe, geny = genesis or origin
EFFECTS OF TREE SHAPE ON THE ACCURACY OF MAXIMUM LIKELIHOOD-BASED ANCESTOR RECONSTRUCTIONS
 1 2 3 4 5 6 7 8 9 10 11 12 13 14 15 16 EFFECTS OF TREE SHAPE ON THE ACCURACY OF MAXIMUM LIKELIHOOD-BASED ANCESTOR RECONSTRUCTIONS Syst. Biol. 53:809-814 [2004] Arne Ø. Mooers Department of Biological Sciences,
Contingency Tables. Safety equipment in use Fatal Non-fatal Total. None 1, , ,128 Seat belt , ,878
 Contingency Tables I. Definition & Examples. A) Contingency tables are tables where we are looking at two (or more - but we won t cover three or more way tables, it s way too complicated) factors, each
Biol 206/306 Advanced Biostatistics Lab 12 Bayesian Inference Fall 2016
 Biol 206/306 Advanced Biostatistics Lab 12 Bayesian Inference Fall 2016 By Philip J. Bergmann 0. Laboratory Objectives 1. Learn what Bayes Theorem and Bayesian Inference are 2. Reinforce the properties
Evolutionary Models. Evolutionary Models
 Edit Operators In standard pairwise alignment, what are the allowed edit operators that transform one sequence into the other? Describe how each of these edit operations are represented on a sequence alignment