COMPARATIVE PHYLOGEOGRAPHY AND DEMOGRAPHIC HISTORIES OF WEST INDIAN BIRDS
|
|
|
- Osborne Flowers
- 5 years ago
- Views:
Transcription

1 University of Missouri, St. Louis UMSL Dissertations UMSL Graduate Works COMPARATIVE PHYLOGEOGRAPHY AND DEMOGRAPHIC HISTORIES OF WEST INDIAN BIRDS Maria Wilhelmina Barbosa de Oliveira Pil University of Missouri-St. Louis, mwbpv5@mail.umsl.edu Follow this and additional works at: Part of the Biology Commons Recommended Citation Barbosa de Oliveira Pil, Maria Wilhelmina, "COMPARATIVE PHYLOGEOGRAPHY AND DEMOGRAPHIC HISTORIES OF WEST INDIAN BIRDS" (2015). Dissertations This Dissertation is brought to you for free and open access by the UMSL Graduate Works at UMSL. It has been accepted for inclusion in Dissertations by an authorized administrator of UMSL. For more information, please contact marvinh@umsl.edu.
2 COMPARATIVE PHYLOGEOGRAPHY AND DEMOGRAPHIC HISTORIES OF WEST INDIAN BIRDS by MARIA W. BARBOSA DE OLIVEIRA PIL M.Sc., Ecology and Conservation, Universidade Federal do Paraná Brazil, 2009 B.S., Biology, Universidade Federal do Paraná Brazil, 2006 A DISSERTATION Submitted to the Graduate School of the UNIVERSITY OF MISSOURI- ST. LOUIS In partial Fulfillment of the Requirements for the Degree DOCTOR OF PHILOSOPHY in BIOLOGY with an emphasis in Ecology, Evolution and Systematics April 2015 Advisory Committee Robert E. Ricklefs, Ph.D. Chairperson Allison Miller, Ph.D. Elizabeth Kellogg, Ph.D. Patricia Parker, Ph.D. Copyright 2015 by Maria W. Barbosa de Oliveira Pil All Rights Reserved
3 TABLE OF CONTENTS DISSERTATION ABSTRACT 3 CHAPTER 1 5 CHAPTER 2 57 CHAPTER 3 94
4 3 1 DISSERTATION ABSTRACT My dissertation investigates the demographic history of multiple island populations of several Caribbean bird species through an assessment of contemporary genetic diversity, while inferring relationships between the comparative demography of individual island populations and characteristics of the islands and species. The sizes and distributions of populations vary over time, and episodes of expansion and contraction create characteristic patterns of genetic variation within and among populations. Consequently, contemporary patterns of genetic diversity open a window onto demographic and phylogeographic history. The strength of the study lies in the scale and comprehensiveness of the analysis, encompassing most of the West Indian islands and several species of birds, focusing on populations of 9 species. Methods included amplification and sequencing of mitochondrial DNA, calculation of pairwise genetic distances between and within populations, and coalescence-based estimates of past population sizes. I begin my investigation into the demographic and phylogeographic patterns of West Indian birds with an in-depth analysis of genetic patterns of a clade of tanagers, the Coerebinae, specifically the bananaquit and a group of three species of West Indian bullfinches, as models for investigating the system. These species showed several similarities in their genetic distribution in the archipelago and demographic patterns, which led me to a comparison of several other species to investigate whether general phylogeographic and demographic patterns emerge in an assemblage of birds from the West Indies. Comparative phylogeographic analyses suggest three conspicuous patterns
5 among West Indian birds: 1) populations on Greater Antillean islands are generally distinct from Lesser Antilles, 2) a common phylogeographic break occurs in most species between northern and southern Lesser Antilles populations, particularly between the islands of St. Lucia and St. Vincent, and 3) populations on Barbados are genetically distinct from others in the Lesser Antilles. Demographic trends revealed by coalescence analyses of contemporary genetic diversity are highly variable. Island is not predictive of demographic state of populations, while species identity predicts the demographic history of the West Indian avifauna, indicating that extrinsic factors such as hurricanes, volcanic eruptions, or the localized emergence of diseases do not play a major role in demographic history of West Indian avifauna
6 5 47 CHAPTER Original Article DEMOGRAPHIC CHANGES ASSOCIATED WITH TAXON CYCLE PHASES OF THE BANANAQUIT, COEREBA FLAVEOLA, IN THE WEST INDIES. Maria W. Pil 1*, Rebeka Fanti 2 and Robert E. Ricklefs Department of Biology, University of Missouri-St. Louis, One University Boulevard, St. Louis, Missouri Biotechnology Program, Missouri Baptist University, One College Park Dr., Saint Louis, Missouri *Correspondence: Maria W. Pil, Department of Biology, University of Missouri-St. Louis, One University Boulevard, St. Louis, Missouri mwbpv5@mail.umsl.edu Running head: Taxon cycle phases of bananaquits Word count (including abstract, main text and references): 7, ABSTRACT Aim The sizes and distributions of populations vary over time, and episodes of expansion and contraction create characteristic patterns of genetic variation within and among populations. Consequently, contemporary patterns of genetic diversity offer a window onto demographic history. Here, we employ population-genetics approaches to infer the
7 demographic history of the bananaquit, Coereba flaveola (Aves: Thraupidae), in the West Indies. Location The West Indian archipelago. Methods We analyzed genetic variation in two mitochondrial genes (cytochrome b and NADH subunit 2) for 562 individuals from 20 islands and two continental South American populations. Tajima s D, Fu s FS, Mismatch Distributions, and Bayesian skyline plots were calculated as indicators of population change, supplemented by signature shapes in haplotype networks. The latter, as well as rooted Maximum Likelihood and Bayesian phylogenies, and a Bayesian analysis of population structure, were used to infer relationships among populations. Results Greater Antillean islands to the west of Hispaniola (Jamaica and the Cayman Islands) and the southernmost Lesser Antillean islands of Saint Vincent and Grenada show evidence of stable populations, whereas the populations in the northern Lesser Antilles, Puerto Rico, and Hispaniola show clear signs of expansion. Main conclusion Based on the bananaquit phylogeny, expansion signatures, and geography of the eastern Antillean islands, we infer that the bananaquit colonized the Lesser Antilles from Puerto Rico but that the species has recently re-expanded across the northern Lesser Antilles, creating independent phylogenetic groups on Puerto Rico, Saint Vincent and Grenada (SV/GR), and the northern Lesser Antilles. These demographic patterns of expansion, contraction, and re-expansion may characterize taxon-cycle phases of the species in the archipelago. Keywords
8 colonization, demographic history, dispersal, haplotype network, island biogeography, phylogeography, population size INTRODUCTION Over fifty years ago, E. O. Wilson introduced the concept of the taxon cycle based on patterns of ant species distributions in the islands of Southeast Asia and Melanesia. The taxon cycle involves sequential phases of expansion and contraction of the geographic range of a species, associated with shifts in habitat distribution and population abundance, and ultimately leading to extinction of some island populations (Wilson, 1959; 1961). In the 1970 s, R. E. Ricklefs and G. W. Cox also inferred that patterns of distribution and taxonomic differentiation of bird species in the West Indies represented a time series from initial colonization and range expansion to localized extinctions and contraction of geographic ranges, with possible re-expansion from isolated populations. Recently expanded distributions were associated with large local populations and broad habitat distributions, linking geography, ecology, and demography (Ricklefs & Cox, 1972; 1977; 1978). Both Wilson s and Ricklefs and Cox s insights came from natural history observations of contemporary patterns of species occurrences. However, the dynamics of taxon cycles are too slow to observe directly, and one must use indirect approaches to follow populations through complete taxon cycles (Ricklefs, 2012). Fortunately, population expansion and decline leave predictable signatures in DNA sequence diversity because neutral alleles are lost faster by drift in smaller populations. Populations that experience long-term stability typically exhibit substantial genetic diversity (Harpending,
9 ). Prolonged population bottlenecks reduce genetic diversity and estimated effective population size, while rapid population growth following a bottleneck results in accumulation of clusters of haplotypes differing by one or a few recent nucleotide substitutions (Harpending, 1994). Accordingly, contemporary patterns of genetic diversity reveal much about the demographic history of a population. Genetic data can help us infer the relationship between historical demography, as perceived in single island populations, and taxon cycles inferred from geographic distribution and genetic differentiation between island populations. Geographic expansion and contraction of populations can be associated with shifts in ecological distribution and changes in population size through time. Therefore, taxon-cycle dynamics are relevant to a number of issues in biogeography, including response to climate change, vulnerability to extinction, and control of invasive species (Ricklefs & Cox, 1978; Whittaker, 1998). Studies on islands have contributed much to the development of evolutionary theory, and islands are often considered natural laboratories (Losos & Ricklefs, 2009). The main advantage of studying population processes on islands compared to continental regions is that species are subdivided into geographically discrete populations on individual islands separated by conspicuous barriers to dispersal (Losos & Ricklefs, 2009). The West Indies, which are the setting for this analysis, include the Greater and Lesser Antilles (Fig. 1). The latter were formed as a volcanic arc over the edge of the eastern Caribbean Plate; the Greater Antilles are continental fragments dragged to their present positions by plate movements within the region (Iturralde-Vinent & MacPhee, 1999). Inhabited islands in the archipelago range in size from ~110,000 km 2 (Cuba) to
10 ~13 km 2 (Saba). The contemporary volcanic islands probably originated within the past 20 million years (Ricklefs & Bermingham, 2008). During the last century, volcanic eruptions have occurred on the islands of Montserrat (since 1995), Guadeloupe (1977), Martinique (1932), and Saint Vincent (1979). The islands have never had direct land connections to the continent or with each other, except for the islands of Saint Kitts- Nevis, Antigua-Barbuda, and Grenada-Grenadines, which sit on shallow banks exposed during Pleistocene sea-level lows (Williams, 1969). One of the most common bird species in the West Indies is the bananaquit (Coereba flaveola), which also occurs in tropical America from southern Mexico to northern Argentina. This species belongs to the subfamily Coerebinae of the tanager family Thraupidae, with unresolved relationship to other tanagers, which diversified within the West Indies and is the ultimate source of the Darwin finches of the Galapagos Archipelago (Mallarino et al., 2012). In the West Indies, the bananaquit, which is the earliest diverging species in its clade, is abundant on all islands except Cuba, where it is a vagrant on small cays off the northern coast (Raffaele et al., 2010). Previous phylogeographic analyses based on mitochondrial and nuclear DNA sequences suggest that the bananaquit initially diversified in the Greater Antilles or Bahamas between 1.75 and 3.99 million years ago (Seutin et al., 1994; Bellemain & Ricklefs, 2008). According to Bellemain et al. (2008), the continental and Lesser Antillean populations were derived from the Greater Antilles, and populations at the far south of the Lesser Antilles archipelago (Saint Vincent and Grenada) are differentiated from those on the rest of the islands in the Lesser Antilles.
11 Here, we analyze long-term demographic changes in several island populations of the bananaquit. Our main goal is to characterize the relationship between inferred phases of the taxon cycle and population dynamics. To ascertain the dynamics of bananaquit populations we have two specific objectives: 1) discern genetic parameters of variability and structure within and between populations of bananaquits on islands of the West Indian archipelago, and 2) infer the demographic dynamics of these populations through mitochondrial DNA sequencing. We predict that individual island populations of C. flaveola will exhibit genetic indicators of population expansion if they are in an expanding phase of the taxon cycle (widespread and undifferentiated). Our results are consistent with the predicted relationship between geographic and population expansion: phylogeographically older populations show signs of demographic stability with highly differentiated mitochondrial haplotypes, whereas more recently colonized island populations in the northern Lesser Antilles exhibit less haplotype divergence with indications of demographic expansion. We also find evidence of population pulses, where differentiated mtdna haplotypes found in several recently colonized islands may indicate the presence of individual remnants of older resident populations, different from the one currently found on these islands MATERIALS AND METHODS Sampling and molecular methods Blood was collected from 541 individuals on 20 islands of the West Indies (up to 34 individuals per island; see Appendix S1 in Supporting Information), and two continental populations: Trinidad (an island connected during Pleistocene low sea levels
12 by a land-bridge to Venezuela, 11 km distant), and northern Venezuela. We sampled two populations on Puerto Rico, one high-elevation population in the northeast of the island, in the wet El Yunque forest, and another in the dry Guanica Forest on the southwestern coast (Fig. 1). For island coordinates see Appendix S1 in Supporting Information. Throughout the manuscript, islands names are sometimes abbreviated as per the acronyms found in Table 1. Sampling took place between 1991 and 2013, generally between April and August. Field methods, including avian blood collection, are described in Latta and Ricklefs (2010). DNA was extracted from blood obtained via sub-brachial venipuncture, using the isopropanol precipitation technique described in Svensson & Ricklefs (2009). Genetic variation in each population was analyzed by sequencing the mitochondrial genes cytochrome b (CYTB) and NADH dehydrogenase subunit 2 (ND2). The partial CYTB gene (850 bp) was amplified using primers L14990 (Kocher et al., 1989) and HCERC (TACAAGACCAATGTTTTTATAAACTATTA). The partial ND2 gene (795bp) was amplified using primers H6313 and L5219 (Johnson & Sorenson, 1998). For all analyses, the two gene sequences were concatenated (1645bp). All PCR amplifications were conducted in 25 μl total volumes using ~50 ng template DNA, U Takara Taq polymerase, 2 mm of MgCl2, 0.2 μm of each primer, 1x Buffer, and 0.8 mm of dntp. PCRs were performed with the following conditions: 94 C for 2 min (95 C for ND2) followed by 35 cycles of 94 C for 30 s (45 s for ND2), 52 C for 45 s, and 72 C for 1 min, concluding with a 10-min extension at 72 C. Negative controls were included in all sets of PCR reactions to confirm absence of contaminants, and PCR products were verified by visualization on 1% TBE agarose gels
13 stained with ethidium bromide. Reactions were cleaned using ExoSAP-IT (USB) following the manufacturer s protocol. Sequencing reactions of forward and reverse gene directions were conducted using BigDye v. 3.1 in a 3100 DNA Analyzer (Applied Biosystems). Contigs were aligned and edited in Geneious v. 5.6 (Kearse et al., 2012). Chromatograms were checked by eye to confirm polymorphisms. Haplotype sequences were deposited in GenBank (accession numbers xxxx-xxxxx, see Appendix S1). Data analyses Phylogenetic/phylogeographic analyses Basic phylogeographic analyses of the species in the region in question is necessary to confirm that populations are reciprocally monophyletic, and thus support independent coalescent processes. In addition, phylogenetic analyses will inform relative ages of individual populations and provide a better understanding of the colonization history. Relationships among island populations were inferred using Maximum Likelihood (ML) and Bayesian inference phylogenetic analyses via the CIPRES Science Gateway v.3.3 (Miller et al., 2010), using unique haplotypes among those found in all populations. The ML and Bayesian analyses produced largely concordant topologies (for separate trees see Appendix S2). ML was implemented using RAxML v.8.0 (Stamatakis, 2014), which applies a GTR + G model, and so model testing was not performed prior to the ML reconstruction. The most likely tree was computed, and 1,000 bootstrap replicates were performed to assess support for each node. Bootstrap values greater than 70% were considered strong support (Hillis & Bull, 1993). Bayesian analysis was implemented using BEAST v (Drummond et al., 2012), with 10 million generations sampled
14 every 1,000 th generation. Nodes with posterior probabilities of 0.95 and higher were considered strongly supported. Trees were generated employing the HKY nucleotide substitution model selected by jmodeltest v (Guindon & Gascuel, 2003; Darriba et al., 2012), and a strict molecular clock with a nucleotide substitution rate of 10-8 per position per year (Weir & Schluter, 2008). The results from the analysis were analyzed in Tracer v.1.5 for convergence and summarized in TreeAnnotator v after dropping 10,000 burn-in generations. The following outgroups were used in both phylogenetic analyses: Loxigilla portoricensis (unpublished data) and Melanospiza richardsoni (GeneBank accession numbers AY [CYTB], EF [ND2]). The outgroups were chosen based on their placement in the tanager phylogenetic tree both are members of a clade within the Coerebinae that is sister to C. flaveola, and both are endemic to the West Indies (Burns et al., 2014). Finally, the resulting tree was visualized and edited using FigTree v (available at We estimated genetic differentiation among populations (pairwise FST) using Arlequin v.3.5 (Excoffier & Lischer, 2010), with confidence intervals based on 1,000 permutations. Phylogeographic structure was further examined with analysis of molecular variance (AMOVA), which quantifies the proportion of total genetic variation distributed within and among populations (Excoffier et al., 1992). To portray relationships between haplotypes within each clade detected by the phylogenetic analyses, we created median-joining haplotype networks (Bandelt et al., 1999) using the software Network v.4.6 (available at To visualize the genetic mixing occurring within Puerto
15 Rico, we also constructed a median-joining haplotype network that included both of the populations sampled on this island (Guanica Forest and El Yunque). Island populations that share a large portion of their genetic variation were subjected to a spatially structured analysis. For the complex genetic structures in these populations, different approaches are required to extract the genetic information needed to relate demographic structure to attributes of islands and groups of islands. Bayesian spatial clustering methods provide a way of statistically inferring a spatially explicit representation of genetic structure (Corander et al., 2008). The spatial clustering of individuals model was implemented in Bayesian Analysis of Population Structure (BAPS v.6) (Corander et al., 2008), which provides a map of clusters representing the genetic entities within the group of islands in the form of a colored Voronoi tessellation graph where different colors indicate genetically differentiated populations (see Corander et al. (2008) for details). The simulations performed in BAPS included all islands, with the goal of determining the spatially explicit genetic clusters within the archipelago. The number of clusters, K, was restricted to a maximum of 10, 20 and 30, respectively, across 3 replicates for each K value. Demographic analyses After identifying lineages using phylogenetic methods and AMOVA, we used genetic diversity to estimate population histories. Summary statistics for genetic variation in island populations were calculated using Arlequin v.3.5 (Excoffier & Lischer, 2010): number of segregating sites (S), number of haplotypes (h), haplotype diversity (hd), and nucleotide diversity (π).
16 Island populations, or groups of island populations, that are reciprocally monophyletic were considered as individual entities in these demographic analyses. We accepted evidence of recent population expansion only when supported by two or more demographic indicators. For each monophyletic population, a suite of demographic measures was calculated. Indicators of change in population size (Tajima s D (Tajima, 1989) and Fu s FS (Fu, 1997)), along with their level of statistical significance, were calculated using Arlequin v.3.5. Mismatch Distributions and statistics that test for sudden population expansion (sum of squared deviation [SSD] and Harpending s raggedness index [r]) also were calculated using Arlequin v.3.5 (Harpending, 1994; Excoffier & Lischer, 2010). The Mismatch Distribution is a frequency graph of all pairwise differences between DNA sequences (Rogers & Harpending, 1992). Populations in longterm equilibrium exhibit multimodal distributions, whereas recently expanded populations typically exhibit a unimodal distribution. Graphs of pairwise differences were generated with R (R Core Team, 2014), using the ggplot2 package (Wickham, 2009). R Scripts are available in Appendix S3, or can be downloaded at Where relevant, the estimated number of generations since population expansion (tau [τ, generations] was converted to the most recent time-sinceexpansion (t, years) by solving t = τ/2u (Rogers & Harpending, 1992), where u is the rate of nucleotide substitution at any individual locus in the sequence. u was calculated from an average substitution rate, the number of base pairs in our sequence alignments (1645), and a generation time of 3 years (based on an adult survival rate of 0.51 on Puerto Rico determined by Faaborg & Arendt (1995), using the Mismatch Calculator (Schenekar & Weiss, 2011) available at:
17 Nucleotide substitution rate was based on the average sequence divergence per million years of passerine birds estimated by (Weir & Schluter, 2008), 2.07%. Confidence intervals of time since expansion were derived from the 2.5% and 97.5% quantiles forτ provided by Arlequin. Change in population size was further examined by Bayesian Skyline plots (BSP) (Drummond et al., 2005) produced using BEAST v (Drummond et al., 2012). The best nucleotide substitution models were estimated using the Akaike Information Criterion (AIC) implemented in jmodeltest v (Guindon & Gascuel, 2003; Darriba et al., 2012), which varied by population and are described in Table 1. A strict molecular clock was assumed (nucleotide substitution rate, μ = yr -1 ), with 10 grouped coalescent intervals. Convergence of the MCMC chains was inspected by checking the effective sample size (ESS) using Tracer v.1.5. Simulated genealogies and model parameters were sampled every 5,000 generations for 50 million generations with 10% of the initial samples discarded as burn-in. Tracer was used to visualize plots, to check for appropriately large ESS values, and to check for convergence of results and performance of operators. Because of the small number of individuals from Venezuela (n = 7), Mismatch Distribution and BSP analyses were not conducted for this population. Skyline Plots were generated with R (R Core Team, 2014), using the ggplot2 package (Wickham, 2009). R scripts are available in Appendix S3, or can be downloaded at Finally, star-like population haplotype networks characterize population expansion, whereas complex haplotype networks indicate populations at long-term demographic equilibrium.
18 RESULTS Genetic diversity The concatenated mitochondrial alignment revealed 101 unique haplotypes with polymorphisms at 231 segregating sites. The number of haplotypes varied between island populations, from 2 on Little Cayman to 17 at the El Yunque site in Puerto Rico (Table 1). The total number of haplotypes in populations on the Greater Antillean islands (n = 68) and the Lesser Antillean islands (n = 72) were similar. Haplotype diversity ranged from 0.14 (Guana, British Virgin Islands, BVI) to 0.95 (Jamaica) in the Greater Antilles, and from 0.53 (Dominica and Barbados) to 0.95 (Grenada) in the Lesser Antilles (Table 1). A Spearman correlation confirmed that haplotype diversity was independent of sample size (rho = 0.11, P = 0.6). Nucleotide diversity was lowest in the Cayman Islands ( on Little Cayman; Table 1), and also was not influenced by sample size (rho = 0.15, P = 0.5). Population structure Haplotypes were not shared between populations of bananaquits on the Greater Antillean and Lesser Antillean islands, except for the island of Guana (BVI), where the bananaquit population shares one haplotype with all islands north of Saint Vincent in the Lesser Antilles and none with nearby Puerto Rico (PR) or other islands in the Greater Antilles. Greater Antillean islands also shared few haplotypes between islands, whereas haplotypes were broadly shared across the Lesser Antilles, especially from the northern islands south to Saint Lucia. The southernmost islands of the Lesser Antilles, Saint Vincent and Grenada, share two haplotypes with each other, but none with the other
19 Lesser Antillean islands (see Appendix S1). Because of haplotype sharing, we shall refer to islands from Guana (BVI) to Saint Lucia collectively as the northern Lesser Antilles, whereas we refer to Saint Vincent and Grenada as the southern Lesser Antilles. Haplotype distributions of the northern Lesser Antilles are summarized as a median joining network in Fig. 2. This haplotype network is dominated by one haplotype (H_1) that occurs on all northern LA islands, except Barbados (BA). Many island populations additionally have private haplotypes that differ from the most common haplotype by a single mutation (e.g., H_2, H_22, H_27, H_11), indicative of a rapid population expansion. The population on Guadeloupe has the highest number, seven, of these private haplotypes. On the other hand, several haplotypes occur on multiple islands instead of being restricted to a single one (e.g., H_4, H_5, H_7). Another conspicuous characteristic of this network is the presence on some islands of haplotypes that differ from the most common one (H_1) by several mutations (e.g., H_12, H_28, H_29). Phylogenetic analyses were consistent with the patterns found previously by Seutin et al. (1994) and Bellemain et al. (2008), where bananaquits comprise six major clades: Bahamas; Greater Antilles (except PR and BVI); PR, BVI and the northern Lesser Antilles; Saint Vincent and Grenada; and continental populations, represented here by Trinidad and Venezuela (Fig. 3). One sequence from Quintana Roo on the Yucatan Peninsula of Mexico is closely related to the Bahamas sequences, suggesting a second colonization of the mainland (see Bellemain et al. 2008). Haplotypes from the island of Barbados comprise a monophyletic clade, which is not strongly supported in its own right but clearly falls within the northern Lesser Antilles populations (Fig. 3). The
20 southernmost LA islands of Saint Vincent and Grenada also form a distinct, wellsupported clade that is sister to the rest of the LA islands. Strong genetic structure was detected between islands of the archipelago (overall FST = 0.94, P < 0.001). AMOVA indicated that 94% of the genetic variation occurs among populations, with only 6% within populations. Hierarchical AMOVA identified three geographical groups: GA, LA, and continental populations (with BVI included as an LA island based on phylogenetic results) partitioning more than half of the genetic variation (53%) between these groups, followed by variation among populations within groups (42%), and only 4.5% within populations (see Appendix S1). Pairwise FST confirmed high levels of genetic structure between GA islands (0.80 < FST < 0.99), not considering the two Cayman Islands, Cayman Brac and Little Cayman, which despite being genetically structured (P < 0.05) exhibit a low fixation index (FST = 0.098) (Table 2). The two populations sampled within Puerto Rico, the southwestern Guanica Forest (GF) and the northeastern El Yunque (EY) location, are also genetically structured according to FST (P = 0.02), although the differentiation is minimal (FST = 0.04, Table 2) and is driven by several divergent haplotypes in the EY population that are well removed from both shared and closely related unique haplotypes in the GF population (Fig. 4). In contrast, pairwise FST values between the northern LA islands and BVI are all less than 0.13 (Table 2). We used a Bayesian analysis of population structure (BAPS) to resolve more detailed indices of differentiation among islands. This approach supports eight spatially distributed genetic clusters, as indicated by a Voronoi tessellation (Fig. 5). Each cell in
21 the tessellation corresponds to the neighboring area of a given geographical coordinate (i.e., each population). The colors represent the underlying genetic population structure. Concordant with the F-statistics, this Bayesian approach supports the genetic differentiation of all Greater Antillean islands, except the Cayman Islands, which form a single cluster in this analysis. In contrast to their significant pairwise FST, the two Puerto Rican populations were not differentiated according to the BAPS analysis. With the exception of two individuals from Guana (BVI), the BAPS analysis also detected a single cluster within the northern Lesser Antilles (from BVI to SL, including BA), as indicated by a single color in all neighboring Voronoi tessellation cells of that region (Fig. 5). Lastly, the analysis did not detect genetic differentiation between Saint Vincent and Grenada. Demographic analyses They reveal a variety of patterns in the archipelago. Pairwise demographic indices, Tajima s D and Fu s FS, and Mismatch Distribution values are presented in Table 3. Mismatch Distribution graphs and Bayesian Skyline Plots (BSP) are portrayed in Figs. 6 and 7, and individual island haplotype networks are depicted in Fig. 8. Populations of bananaquits in the Bahamas (ELE) and the western Greater Antillean islands (JA, CB and LC) show signs of long term stability, whereas eastern Greater Antillean populations in the Dominican Republic (DR) and Puerto Rico (GF and EY) show clear signs of expansion in all analyses: Tajima s D, Fu s FS, Mismatch Distribution, and BSP (Table 3, Figs. 6 and 7). Even though the Mismatch Distributions of populations on CB and LC show a unimodal distribution, any inference of expansion is contradicted by the
22 extremely few pairwise differences in the data from these two populations. Also, other indicators reveal no sign of expansion for these two populations. Because bananaquit populations are undifferentiated genetically across the northern Lesser Antilles, we treated these populations as one for demographic analyses. As expected from the star-like signature in the haplotype network (Fig. 2), this group of islands shows clear signs of a historical bottleneck and recent population expansion in all demographic analyses (Table 3, Figs. 6, 7). The population from Barbados (BA) also indicates expansion in all analyses. In contrast, the southernmost LA islands of SV and GD show no sign of recent population expansion. Therefore, our analyses suggest that the bananaquit has stable populations both in west GA and southernmost LA, but shows clear evidence of expansion on Hispaniola, Puerto Rico, and the northern Lesser Antilles (Fig. 1). Trinidad, which is considered here as a continental population because of its size, and its proximity and recent land connection to Venezuela, also showed evidence of population expansion (Table 3). Estimated expansion times of island populations dates are 54 kyr [DR and GF], 29 kyr [EY] and 41 kyr in the northern LA island populations. The youngest evident population expansions are Trinidad (17 kyr) followed by Barbados (24 kyr) (Table 3) DISCUSSION We analyzed the historical demography of bananaquits on most of the islands in the West Indies and our results show a clear relationship between the geographic signs of recent expansion (based on phylogeography), and demographic indicators of recent expansion within island populations or groups of populations. Demographic patterns of
23 expansion, stabilization, and re-expansion characterize taxon-cycle phases of the species in the archipelago. Populations on Greater Antillean islands to the west of Hispaniola, and the southernmost Lesser Antillean islands of Saint Vincent and Grenada show evidence of long-term stability, whereas the populations in-between, namely the northern Lesser Antilles, Puerto Rico, and Hispaniola show clear signs of recent expansion. Previous phylogeographic analyses of the bananaquit in the West Indies had already established, based on mitochondrial and nuclear DNA evolution, that the West Indian populations of bananaquits comprise five monophyletic groups: 1) the Bahamas, 2) Greater Antilles except Puerto Rico, 3) Puerto Rico, 4) the northern Lesser Antilles (from the British Virgin Islands to Saint Lucia), and 5) the southernmost islands of Saint Vincent and Grenada (Seutin et al., 1994; Bellemain et al., 2008). These analyses also indicated that the bananaquit originated in the Bahamas or the Greater Antilles, where the deepest phylogenetic nodes reside, which implies that the species later dispersed to the continent by expansion through the Lesser Antilles. As mentioned previously, birds in the Mexican state of Quintana Roo on the Yucatan Peninsula are most closely related to birds on the Bahamas and likely dispersed to the mainland across Cuba (Bellemain et al., 2008). These authors also suggested that the bananaquit colonized the Lesser Antilles at least twice from Puerto Rico, as evidenced by an earlier colonization of South America through the Lesser Antilles Million years ago [Mya], leaving old nuclear genotypes in some of the island populations, and a later colonization that extended to Grenada ( Mya). Finally, bananaquits have recently re-expanded across the northern Lesser Antilles, from an unknown island source but currently extending from Saint Lucia to the British Virgin Islands on the Puerto Rico Bank. This phylogeographic
24 history has resulted in contemporary independent phylogenetic groups on Puerto Rico, Saint Vincent/Grenada (SV/GR), and the northern Lesser Antilles (Bellemain et al., 2008; 2012). The taxon-cycle pattern linking geographic expansion to population growth is supported by within-population indicators of recent population increase on islands in the northern Lesser Antilles. This recent expansion did not include the southern Lesser Antillean islands of St. Vincent and Grenada. These islands, which were practically connected during Pleistocene sea-level lows, share haplotypes and exhibit genetic evidence of longer-term stable demography. The apparent recent expansion of bananaquit populations on Puerto Rico is not associated with colonization of other islands. To the contrary, individuals on the Puerto Rican land-bridge islands in the British Virgin islands share mitochondrial haplotypes with individuals in the northern Lesser Antilles. Bellemain et al. (2012) examined both mitochondrial (842 bp of the ATPase 6,8 gene) and nuclear (five introns) genetic variation on Puerto Rico, Guadeloupe, Dominica, and Grenada. Based on samples of 10 nuclear haplotypes and 10 mitochondrial haplotypes from each population, none of the values for Tajima s D differed significantly from 0. However, genetic diversity ( ) increased from the smallest to the largest of these islands, and population growth estimated by the program LAMARC with unconstrained migration, indicated significant population growth on Puerto Rico. Because of the small sample sizes in Bellemain et al. s study, it is difficult to interpret discrepancies with respect to the present analysis. We found evidence of recent expansion of the bananaquit through the northern Lesser Antilles in the presence of the same mitochondrial haplotype on all the islands.
25 Based on our data, we cannot determine which one or several of the islands was the source of the expanding and colonizing population. However, other inferences are possible from the diversity and distribution of haplotypes in the northern Lesser Antilles. First, the presence of several haplotypes that differ from the most common haplotype by a single mutation and are found in individuals from many islands (e.g., haplotypes 4, 7, 16, 17, 19) suggest that colonization of islands during expansion phases involved many individuals and a substantial part of the genetic variation in the founding populations. It seems unlikely that these haplotypes would have arisen independently by mutation on each of the islands. This is particularly true of three haplotypes (10, 13, and 34) that are two steps from haplotype 1 and also found on multiple islands. Second, several individual islands harbor unique haplotypes differing from haplotype 1 by several mutations (e.g., haplotypes 14, 15, and 18 on Saint Lucia, haplotypes on Guadeloupe, and haplotype 12 on Martinique). Simply because it is difficult to imagine the recent generation of such genetic diversity, these haplotypes likely represent older genetic remnants of populations that were reduced in size but did not become extinct prior to the current expansion of the bananaquit in the northern Lesser Antilles. Not all islands harbor individuals with such differentiated haplotypes, suggesting that older populations of bananaquits on such islands became extinct before this most recent geographic expansion. Based on the time since expansion calculated from Mismatch Distributionτ values, expansion of the bananaquit in the northern LA occurred ca. 40 thousand years ago (CI = thousand years), much more recently than the last geographic
26 expansion out of Puerto Rico, which Bellemain et al. (2008) suggested, on the basis of phylogeography, to have occurred between 340,000 and 930,000 years ago. Taxon cycles include phases of geographic expansion, which are clearly indicated at different times for bananaquits in the Lesser Antilles. The recent geographic expansion of the species through the northern Lesser Antilles is supported by the distributions of genetic diversity within island populations in the northern Lesser Antilles, which are consistent with local population expansion. However, changes in population size within an island need not be associated with geographic expansion or contraction. The expansion indicators for the Dominican Republic (Hispaniola) and Puerto Rico populations of bananaquits suggest that phases of expansion might occur within single large islands without resulting in geographic expansion to other islands in the archipelago. Highly mobile organisms such as birds can spread rapidly through a chain of islands, such as the West Indies. According to Ricklefs (2010), range expansion in the West Indies occurs primarily in a stepping-stone fashion, from one island to the next, as seems to be the case with bananaquits judging from the absence of gaps in distribution. Historical records of expanding species suggest that range expansion involves repeated cycles of arrival on one island, buildup of populations over a few decades, and subsequent colonization of the next island in the chain (Ricklefs, 2010). The genetic diversity in recently colonized island populations described here also suggests that colonization by bananaquits involved relatively large propagules. Ricklefs and Cox (1972) pointed out that species in expansion phases cannot be distinguished by particular ecological characteristics, such as morphology or diet. In
27 addition, expansion phases also do not appear to be driven by cyclical climate change that might affect many species in the same manner, as ecologically similar species are in different phases of the taxon cycle at any particular time, including the present. Glacial cycles could have influenced distributions of birds in the West Indies, because the lower sea levels and drier climate during glacial maxima provided increased areas of lowland dry forest (Bonatti & Gartner, 1973; Dexter, 2010) and connected some islands in the chain by land bridges (e.g., Antigua-Barbuda, Nevis-St. Kitts, Puerto Rico-Virgin Islands). Another possibility is that the re-expansion of bananaquits within the northern LA was associated with hurricane tracks. The West Indies, and especially the northern Lesser Antilles, are within a hurricane belt (see Fig. 5 in Hedges, 2006), with major storms affecting nectarivorous bird populations (Askins & Ewert, 1991; Waide, 1991a) occurring at intervals of 10 to 60 years (Waide, 1991b). However, it is still unclear why a particular population of a species should initiate a phase of expansion, as appears to be the case for the bananaquit in the northern Lesser Antilles, at a particular time. Phylogenetic reconstructions, population pairwise differences, and haplotype networks all indicate that bananaquits on the British Virgin Island (BVI) of Guana are genetically more similar to populations in the northern Lesser Antilles (NLA) than those in Puerto Rico (PR). The BVI are much closer to PR than to the NLA and were connected to PR by a land bridge during glacial periods low sea levels (Iturralde-Vinent, 2006). Other examples of biotic dissimilarity between Puerto Rico and the Virgin Islands include amphibians (Hedges, 1999), orchids (Trejo-Torres & Ackerman, 2003), Anolis cristatellus (Brandley & de Queiroz, 2004), and species of Amphiacusta ground crickets (Oneal et al., 2010); also see (Carstensen et al., 2012). Indeed, PR and the Virgin Islands
28 (including the BVI) form distinctive biogeographic clusters, suggesting limited dispersal between these regions, despite the periodic emergence of a land-bridge connection. A striking phylogeographic break in the West Indian distribution of bananaquits occurs between the islands of Saint Lucia (SL) and Saint Vincent (SV). As previously discussed, the bananaquits form two genetic clusters within the Lesser Antilles, one formed by the southern islands of Saint Vincent and Grenada (GD), and the other by all other islands of northern Lesser Antilles, including the British Virgin Island of Guana. Both populations in SV and GD show genetic signs of population stability (Table 3: insignificant values of D and FS) and are likely remnants of an earlier colonization of the Lesser Antilles by bananaquits from Puerto Rico. It is worth mentioning that bananaquits in these two islands harbor melanic morphs, unlike other islands of the Lesser Antilles (Theron et al., 2001). The two populations are separated by a shallow bank of islands, the Grenadines, which, during sea level lows during the last Glacial maximum, was exposed within a few kilometers of Saint Vincent. Intriguingly, distinctiveness between southern and northern islands is not uncommon within the Lesser Antilles. Several organisms have phylogenetic breaks between SL and SV, including the butterfly Dryas iulias (Davies & Bermingham, 2002) and Eleutherodactylus frogs (Kaiser et al., 1994). Others have phylogenetic breaks in different locations between northern and southern Lesser Antilles: among the Selenops spiders, one species extends from Les Saintes northward to Montserrat and Antigua and another is distributed in the Southern Lesser Antilles, from Dominica south to Saint Vincent and the Grenadines (Crews & Gillespie, 2010); the Anolis lizards (Schneider et al., 2001; Creer et al., 2001) and the gecko, Sphaerodactylus vincenti (Surget-Groba &
29 Thorpe, 2012), exhibit breaks between Martinique and Dominica. Thus, the phylogeographic break in the bananaquit distribution in the Lesser Antilles does not necessarily reflect a commonly recognized geographic or ecological discontinuity. Using a combination of population genetic approaches, this study provides detailed insight into the demographic and geographic history of the bananaquit among island populations of the West Indies. We have shown a clear correlation between geographic expansion and demographic expansion within populations of the northern Lesser Antilles. Populations from the Bahamas, the western Greater Antilles, and the southernmost islands of the Lesser Antilles are demographically stable and endemic to one or a few neighboring islands. Bananaquits in the northern Lesser Antilles exhibit population expansion associated with geographic expansion through a large part of the archipelago. The presence of both stable populations and rapidly expanding populations of the same species on close-by islands with similar ranges of habitats emphasizes the dynamic nature of island biotas and the potentially rapid shift between stable or declining populations and expanding populations. The patterns identified here are consistent with a taxon-cycle interpretation of the distribution and taxonomic differentiation within species of birds in this archipelago. The factors that shift populations from stable or declining phases to expanding phases of the taxon cycle are not understood. Phylogeographic analyses of additional species might produce some generalizations, or they might reinforce the idiosyncratic nature of species distributions ACKNOWLEDGMENTS
30 The authors thank Stéphane Garnier and Bruno Faivre for providing some of the samples from Martinique and Guadeloupe acquired with support from the Netbiome project FRAG&BINV ("Arrêté préfectoral number "). We are grateful to Dr. Allison Miller and Dr. Elizabeth Kellogg for helpful comments on the manuscript. This work was supported by the National Geographic Society, the National Science Foundation, Curators of the University of Missouri St. Louis, the Whitney R. Harris World Ecology Center (John Denver Memorial Scholarship in Tropical Ecology), the Student Research Award from the American Society of Naturalists, and the Saint Louis Audubon Society. M.W.P. received funding from Fulbright, the Coordination for the Improvement of Higher Education CAPES-MEC (Brazil), and the University of Missouri St. Louis REFERENCES Askins R.A. & Ewert D.N. (1991) Impact of Hurricane Hugo on Bird Populations on St. John, U.S. Virgin Islands. Biotropica, 23, Bandelt H.J., Forster P., & Röhl A. (1999) Median-joining networks for inferring intraspecific phylogenies. Molecular biology and evolution, 16, Bellemain E. & Ricklefs R.E. (2008) Are islands the end of the colonization road? Trends in ecology & evolution, 23, Bellemain E., Bermingham E., & Ricklefs R.E. (2008) The dynamic evolutionary history of the bananaquit (Coereba flaveola) in the Caribbean revealed by a multigene analysis. BMC evolutionary biology, 8, Bellemain E., Gaggiotti O.E., Fahey A., Bermingham E., & Ricklefs R.E. (2012) Demographic history and genetic diversity in West Indian Coereba flaveola populations. Genetica, 140, Bonatti E. & Gartner S. (1973) Caribbean climate during Pleistocene Ice Ages. Nature, 244, Brandley M.C. & de Queiroz K. (2004) Phylogeny, Ecomorphological Evolution, and
31 Historical Biogeography of the Anolis cristatellus Series. Herpetological Monographs, 18, Burns K.J., Shultz A.J., Title P.O., Mason N.A., Barker F.K., Klicka J., Lanyon S.M., & Lovette I.J. (2014) Phylogenetics and diversification of tanagers (Passeriformes: Thraupidae), the largest radiation of Neotropical songbirds. Molecular phylogenetics and evolution, 75, Carstensen D.W., Dalsgaard B., Svenning J. C., Rahbek C., Fjeldsa J., Sutherland W.J., & Olesen J.M. (2012) Biogeographical modules and island roles: a comparison of Wallacea and the West Indies. Journal of Biogeography, 39, Corander J., Sirén J., & Arjas E. (2008) Bayesian spatial modeling of genetic population structure. Computational Statistics, 23, Creer D.A., de Queiroz K., Jackman T.R., Losos J.B., & Larson A. (2001) Systematics of the Anolis roquet Series of the Southern Lesser Antilles. Journal of Herpetology, 35, Crews S.C. & Gillespie R.G. (2010) Molecular systematics of Selenops spiders (Araneae: Selenopidae) from North and Central America: implications for Caribbean biogeography. Biological Journal of the Linnean Society, 101, Darriba D., Taboada G.L., Doallo R., & Posada D. (2012) jmodeltest 2: more models, new heuristics and parallel computing. Nature Methods, 9, Davies N. & Bermingham E. (2002) The historical biogeography of two Caribbean butterflies (Lepidoptera: Heliconiidae) as inferred from genetic variation at multiple loci. Evolution; international journal of organic evolution, 56, Dexter K.G. (2010) The influence of dispersal on macroecological patterns of Lesser Antillean birds. Journal of Biogeography, 37, Drummond A.J., Rambaut A., Shapiro B., & Pybus O.G. (2005) Bayesian Coalescent Inference of Past Population Dynamics from Molecular Sequences. Molecular biology and evolution, 22, Drummond A.J., Suchard M.A., Xie D., & Rambaut A. (2012) Bayesian Phylogenetics with BEAUti and the BEAST 1.7. Molecular biology and evolution, 29, Excoffier L. & Lischer H.E.L. (2010) Arlequin suite ver 3.5: a new series of programs to perform population genetics analyses under Linux and Windows. Molecular Ecology Resources, 10, Excoffier L., Smouse P.E., & Quattro J.M. (1992) Analysis of molecular variance inferred from metric distances among DNA haplotypes: application to human mitochondrial DNA restriction data. Genetics, 131,
32 Faaborg J. & Arendt W.J. (1995) Survival rates of Puerto Rican birds: Are islands really that different? The Auk, 112, Fu Y.X. (1997) Statistical Tests of Neutrality of Mutations against Population Growth, Hitchhiking and Background Selection. Genetics, 147, Guindon S. & Gascuel O. (2003) A simple, fast, and accurate algorithm to estimate large phylogenies by maximum likelihood. Systematic biology, 52, Harpending H.C. (1994) Signature of ancient population growth in a low-resolution mitochondrial DNA mismatch distribution. Human Biology, 66, Hedges S.B. (1999) Distribution Patterns of Amphibians in the West Indies. Patterns of distribution of amphibians: A global perspective. (ed. by W.E. Duellman), pp The Johns Hopkins University Press, Baltimore. Hedges S.B. (2006) Paleogeography of the Antilles and origin of West Indian terrestrial vertebrates. Annals of the Missouri Botanical Garden, 93, Iturralde-Vinent M.A. (2006) Meso-Cenozoic Caribbean paleogeography: Implications for the historical biogeography of the region. International Geology Review, 48, Iturralde-Vinent M.A. & MacPhee R.D.E. (1999) Paleogeography of the Caribbean region: implications for cenozoic biogeography. Bulletin of the American Museum of Natural History, Johnson K. P. & Sorenson M. D. (1998) Comparing Molecular Evolution in Two Mitochondrial Protein Coding Genes (Cytochrome B and ND2) in the Dabbling Ducks (Tribe: Anatini). Molecular Phylogenetics and Evolution, 10, Kaiser H., Green D.M., & Schmid M. (1994) Systematics and biogeography of Eastern Caribbean frogs (Leptodactylidae: Eleutherodactylus), with the description of a new species from Dominica. Canadian Journal of Zoology, 72, Kocher, T.D., Thomas, W.K., Meyer, A., Edwards, S.V., Paabo, S., Villablanca, F.X. & Wilson, A.C. (1989) Dynamics of mitochondrial DNA evolution in animals: amplification and sequencing with conserved primers. Proceedings of the National Academy of Sciences of the United States of America, 86, Losos J.B. & Ricklefs R.E. (2009) Adaptation and diversification on islands. Nature, 457, Mallarino R., Campas O., Fritz J.A., Burns K.J., Weeks O.G., Brenner M.P., & Abzhanov A. (2012) Closely related bird species demonstrate flexibility between beak morphology and underlying developmental programs. Proceedings of the National Academy of Sciences, 109,
33 Miller M.A., Pfeiffer W., & Schwartz T. (2010) Creating the CIPRES Science Gateway for inference of large phylogenetic trees. Gateway Computing Environments Workshop (GCE), 1 8. Oneal E., Otte D., & Knowles L.L. (2010) Testing for biogeographic mechanisms promoting divergence in Caribbean crickets (genus Amphiacusta). Journal of Biogeography, 37, R Core Team (2014) R: A language and environment for statistical computing. R Foundation for Statistical Computing, Vienna, Austria. URL Raffaele H.A., Wiley J., Garrido O.H., Keith A., & Raffaele J.I. (2010) Birds of the West Indies, 2nd edn. Princeton University Press, Princeton. Ricklefs R. & Bermingham E. (2008) The West Indies as a laboratory of biogeography and evolution. Philosophical transactions of the Royal Society of London. Series B, Biological sciences, 363, Ricklefs R.E. (2010) Dynamics of Colonizations and Extinction on Islands. The theory of island biogegraphy revisited (ed. by J.B. Losos and R.E. Ricklefs), pp Princeton University Press, Princeton. Ricklefs R.E. (2012) Naturalists, Natural History, and the Nature of Biological Diversity. The American Naturalist, 179, Ricklefs R.E. & Cox G.W. (1972) Taxon Cycles in the West Indian Avifauna. The American Naturalist, 106, Ricklefs R.E. & Cox G.W. (1977) Morphological similarity and ecological overlap among passerine birds on St. Kitts, British West Indies. Oikos, 29, Ricklefs R.E. & Cox G.W. (1978) Stage of Taxon Cycle, Habitat Distribution, and Population Density in the Avifauna of the West Indies. The American Naturalist, 112, Rogers A.R. & Harpending H. (1992) Population growth makes waves in the distribution of pairwise genetic differences. Molecular biology and evolution, 9, Schenekar T. & Weiss S. (2011) High rate of calculation errors in mismatch distribution analysis results in numerous false inferences of biological importance. Heredity, 107, Schneider C.J., Losos J.B., & de Queiroz K. (2001) Evolutionary relationships of the Anolis bimaculatus group from the northern Lesser Antilles. Journal of Herpetology, 35, Seutin G., Klein N.K., Ricklefs R.E., & Bermingham E. (1994) Historical biogeography
34 of the bananaquit (Coereba flaveola) in the Caribbean region: a mitochondrial DNA assessment. Evolution, 48, Stamatakis A. (2014) RAxML version 8: a tool for phylogenetic analysis and postanalysis of large phylogenies. Bioinformatics, 30, Surget-Groba Y. & Thorpe R.S. (2012) A likelihood framework analysis of an island radiation: phylogeography of the Lesser Antillean gecko Sphaerodactylus vincenti, in comparison with the anole Anolis roquet. Journal of Biogeography, 40, Tajima F. (1989) Statistical method for testing the neutral mutation hypothesis by DNA polymorphism. Genetics, 123, Theron E., Hawkins K., Bermingham E., Ricklefs R.E., & Mundy N.I. (2001) The molecular basis of an avian plumage polymorphism in the wild. Current Biology, 11, Trejo-Torres J.C. & Ackerman J.D. (2003) Biogeography of the Antilles based on a parsimony analysis of orchid distributions. Journal of Biogeography, 28, Waide R.B. (1991a) The effect of hurricane Hugo on bird populations in the Luquillo Experimental Forest, Puerto Rico. Biotropica, 23, Waide R.B. (1991b) Summary of the response of animal populations to hurricanes in the Caribbean. Biotropica, 23, Weir J.T. & Schluter D. (2008) Calibrating the avian molecular clock. Molecular Ecology, 17, Whittaker R.J. (1998) Island Biogeography. Oxford University Press, Oxford, UK. Williams E.E. (1969) The ecology of colonization as seen in the zoogeography of Anoline lizards on small islands. The Quarterly Review of Biology, 44, Wilson E.O. (1959) Adaptive shift and dispersal in a tropical ant fauna. Evolution; international journal of organic evolution, 13, Wilson E.O. (1961) The nature of the taxon cycle in the Melanesian ant fauna. American Naturalist, 95, Supporting Information
35 Additional Supporting Information may be found in the online version of the article: Appendix S1 Supplemental tables Appendix S2 Supplemental figures Appendix S3 R scripts BIOSKETCHES Maria W. Pil has recently earned her Ph.D. in Biology at the University of Missouri-St. Louis. Her interests lie mainly in population genetics and island biogeography. Her current research involves the phylogeography and historical demography of several passerine species from the West Indies as models for the study of influences on the evolution of birds in the archipelago. Rebeka Fanti recently received her bachelor s degree in Biotechnology from the Missouri Baptist University and is currently working as a lab assistant at Monsanto. Robert E. Ricklefs is Curators Professor of Biology at the University of Missouri St. Louis. His interests include the historical biogeography of West Indian birds as a model system for regional faunal development and evolution. Author contributions: M.W.P and R.E.R. conceived the ideas; R.E.R. and M.W.P. collected the data; M.W.P. and R.F. analyzed the data; and M.W.P. and R.E.R. led the writing.
36 35 Table 1. Indices of genetic diversity for bananaquit populations: n, number of individuals sequenced; S, number of segregation sites; h, number of haplotypes; haplotype diversity; nucleotide diversity; and substitution model per population. Grey cells indicate islands included in the northern Lesser Antillean group. Island population n S h Haplotype diversity Nucleotide diversity Substitution model Eleuthera (ELE) / / HKY Jamaica (JA) / / GTR+I Cayman Brac (CB) / / HKY Little Cayman (LC) / / HKY Dominican Republic (DR) / / HKY Puerto Rico, El Yunque (EY) / / GTR+I Puerto Rico, Guanica Forest GF) / / GTR+I British Virgin Is., Guana (BVI) / / Saint Martin (SM) / / Saint Kitts (SK) / / Nevis (NE) / / Antigua (AN) / / Barbuda (BU) / / Guadeloupe (GU) / / Dominica (DO) / / Martinique (MA) / / Montserrat (MO) / / Saint Lucia (SL) / / Barbados (BA) / / GTR+G Saint Vincent (SV) / / GTR Grenada (GD) / / GTR Trinidad (TR) / / HKY Venezuela (VE) / / HKY+I
37 36 Table 2. Pairwise differences between pairs of sampled island populations. FST values are above the diagonal, and significance of population differentiation is below the diagonal. + indicates significant difference between populations (P < 0.05), and indicates no significant difference (P > 0.05). Island acronyms vide Table 1. Pop. LC CB JA DR EY GF BVI SM SK NE BU AN MO GU DO MA SL BA SV GD TR VE BH LC CB JA DR EY GF BVI SM SK NE BU AN MO GU DO MA SL BA SV GD TR VE
38 37 Table 3. Pairwise distance demographic analyses, number of samples (n), Tajima s D, Fu s FS, Sum of Squared Deviations (SSD), raggedness indices (r), the tau parameter (τ) and time since expansion (in years) including confidence intervals. * indicates statistically significant values (P < 0.05). n Tajima s D Fu s FS SSD r τ Time since expansion 2.07 div./my (μ =3.10x10⁻⁸ ) Eleuthera * NA Jamaica * NA Cayman Brac NA Little Cayman NA Dominican Republic * -4.90* ,435 ( ) Puerto Rico (EY) * -6.90* 0.17* ,130 (13,803 50,218) Puerto Rico (GF) * * ,435 (25,843 80,466) Northern Lesser Antilles * * * ,900 (26,137 53,155) Barbados * -8.93* ,128 (0 52,567) Saint Vincent NA Grenada NA Trinidad * -3.08* ,949 Venezuela NA
39 38 Figure 1. Map of the West Indian archipelago. The 20 islands sampled in this study are colored according to the legend. The continental populations are indicated with arrows. Modified from Raffaele et al Figure 2. Median joining haplotype network of northern Lesser Antillean island populations including Barbados. Each circle represents a different haplotype, and each open dot indicates a mutation between one haplotype and the other. Small red dots between haplotypes indicate an unsampled or ancestral haplotype state. The size of the circle corresponds to the number of individuals that share that haplotype. Each island is represented by a different color (see Legend). Figure 3. Consensus phylogenetic tree of unique haplotypes recovered from all bananaquit populations sampled. Maximum likelihood support values are above branch lines, and Bayesian posterior values are below lines. Islands are color coded as in Fig. 1, and island acronyms are the same as Table 1, except for PR = Puerto Rico, and LA = Lesser Antilles. For individual Bayesian and Maximum Likelihood phylogenetic trees with out groups refer to Appendix S2 in Supporting Information. Figure 4. Median joining haplotype network of the two Puerto Rican populations, El Yunque (red) and Guanica Forest (black). Each circle represents a different haplotype, and each open dot indicates a mutation between one haplotype and the other. The size of the circle corresponds to the number of individuals that share that haplotype.
40 39 Figure 5. Voronoi tessellation from spatial genetic clustering of island populations of bananaquits in the West Indies, inferred with the software BAPS. Identical color identifies populations with homogeneous genetic composition. There are eight clusters. Partitions within clusters represent geographical locations of samples. Tessellation is superimposed on West Indies map, but cells are not representative of actual island shapes since single geographic coordinate points are used. Figure 6. Historical demography analyses of mismatch distribution (left) and Bayesian Skyline Plots (right) showing changes in bananaquit population size through time (years) in genetically distinct islands or groups of islands. With respect to mismatch distributions, smooth unimodal graphs indicate population expansion, grey bars = observed values, black line = expected. Bayesian Skyline Plots, shaded area = 95% confidence interval, black line = median log (Ne). Figure 7. Historical demography analyses of mismatch distribution (left) and Bayesian Skyline Plots (right) showing changes in population size through time (years) in the two Puerto Rican populations, El Yunque and Guanica Forest. Mismatch Distributions, smooth unimodal graphs indicate population expansion, grey bars = observed values, black line = expected. Bayesian Skyline Plots, shaded area = 95% confidence interval, black line = median log (Ne).
41 40 Figure 8. Median joining haplotype networks of reciprocally monophyletic island populations. Each circle represents a different haplotype, and each small black dot indicates a missing haplotype.
42 Figure 1. 41
43 Figure 2. 42
44 Figure 3. 43
45 Figure 4. 44

46 45 Figure lat long
47 46 Figure 6. Frequency Eleuthera, Bahamas Pairwise differences log(ne) Time Frequency Jamaica Pairwise differences log(ne) Time Frequency Cayman Brac Pairwise differences log(ne) Time Frequency Little Cayman Pairwise differences log(ne) Time Frequency Dominican Republica, Hispaniola Pairwise differences log(ne) Time
48 47 Figure 6, continued. Frequency Northern Lesser Antilles Pairwise differences log(ne) e+00 1e+05 2e+05 3e+05 4e+05 5e+05 Time Frequency Barbados Pairwise differences log(ne) Time Frequency Saint Vincent Pairwise differences log(ne) Time Frequency Grenada Pairwise differences log(ne) Time Frequency Trinidad Pairwise differences log(ne) Time
 14 12")
 14 12")
49 48 Figure El Yunque, Puerto Rico 16 Frequency log(ne) Pairwise differences Time Guanica Forest, Puerto Rico Frequency 50 log(ne) Pairwise differences Time

50 Figure 8. 49
51 50 Appendix S1. Supplemental Tables. Supplemental table 1. West Indian island coordinates. Islands Latitude Longitude Eleuthera 24 57' N 75 49' W Jamaica 18 15'N 77 30' W Cayman Brac 19 19' N 81 15' W Little Cayman 19 41' N 80 02' W Dominican Republic 18 30' N 70 49' W Porto Rico, Guanica Forest 17 57' N 66 52' W Porto Rico, El Yunque 18 17' N 65 47' W British Virgin Is, Guana 18 30' N 64 30' W Saint Martin 18 04' N 63 03' W Saint Kitts 17 20' N 62 45' W Nevis 17 09' N 62 34' W Antigua 17 04' N 61 49' W Barbuda 17 37' N 61 46' W Guadalupe 16 15' N 61 33' W Dominica 15 20' N 61 22' W Martinique 14 49' N 61 02' W Montserrat 16 45' N 62 12' W Saint Lucia 13 53' N 60 58' W Barbados 13 10' N 59 32' W Saint Vincent 13 15' N 61 12' W Grenada 12 06' N 61 40' W Trinidad 10 10' N 60 50' W Venezuela 10 31' N 66 15' W
52 51 Supplemental table 2. Number of shared haplotypes between island populations of bananaquit. Values within shaded area are from islands populations considered as northern Lesser Antilles (NLA). Eleuthera (ELE) Jamaica (JA) Cayman Brac (CB) Little Cayman (LC) Dominican Republic (DR) Porto Rico - EY ELE JA CB LC DR EY GF BVI SM SK NE AN BU GU DO MA MO SL BA SV GD TR VE Porto Rico - GF 3 Guana (BVI) Saint Martin (SM) 1 1 Saint Kitts (SK) 1 2 Nevis (NE) Antigua (AN) Barbuda (BU) Guadalupe (GU) Dominica (DO) Martinique (MA) Montserrat (MO) Saint Lucia (SL) Barbados (BA) Saint Vincent (SV) Grenada (GD) 2 Trinidad (TR) Venezuela (VE)
53 52 Supplemental table 3. Results of the analysis of molecular variance (AMOVA) showing how genetic variation is distributed at different hierarchical levels. d.f., degrees of freedom; SS, sum of squares. Source of variation d.f. SS % variation One group Among populations Within populations Three groups Among groups Among populations within groups Within populations


54 53 Appendix S2. Supplemental figures. Supplemental figure 1. Maximum likelihood tree of the unique haplotypes recovered from all bananaquit populations sampled.
55 Supplemental figure 2. Bayesian tree of the unique haplotypes recovered from all bananaquit populations sampled. Branches are color coded per island as in Fig. 1. Node values represent posterior probability higher than 95%. 54
56 55 Appendix S3. R scripts #R script for MD graphs #import txt (first open in Excel to give header and correct configuration. Header should read: #"X.Diff","Observed","Low.bound","Up.bound","Model_Freq.". data <- read.table("data.txt", header=true) #give headers in case you didn't in Excel names(data) <- c("x.diff","observed","low.bound","up.bound","model_freq.") #load ggplot2 package library(ggplot2) #define individual plots MD <-ggplot(md, aes(x=x.diff,y=observed)) + geom_bar(stat="identity", width=0.6, fill="#808080") + geom_line (aes(y=model_freq.), size = 1) + ggtitle ("Population_name") + xlab("pairwise differences") + ylab("frequency") + theme_bw() + theme(panel.border = element_blank(), axis.line = element_line (colour="black")) + theme (panel.grid.major = element_blank(), panel.grid.minor = element_blank()) #to plot multiple graphs #load gridextra library(gridextra) # arrange plots in grid grid.arrange(md1, MD2,, ncol=2) #to save as pdf pdf("figure.pdf") grid.arrange (MD1, MD2,, ncol=2) dev.off() #R script for Bayesian Skyline Plots #import txt (first open in Excel to delete first row and correct configuration. Header should read: # Time, Mean, Median, Upper, Lower data <-read.table("data.txt", sep="\t", header=true) #load ggplot2 package library(ggplot2) #define individual plots BSP <- ggplot(data, aes(x=time,y=log(median))) + geom_ribbon(aes(ymin=log(lower),ymax=log(upper)),alpha=0.2) + geom_line() +
57 56 xlab("time") + ylab("log(ne)") + theme_bw() + theme(panel.border = element_blank(), axis.line = element_line(colour="black")) + theme(panel.grid.major = element_blank(), panel.grid.minor = element_blank()) #to plot multiple graphs #load gridextra library(gridextra) # arrange plots in grid grid.arrange(bsp1, BSP2,, ncol=2) #to save as pdf pdf("figure.pdf") grid.arrange (BSP1, BSP2,, ncol=2) dev.off()
58 CHAPTER 2 PHYLOGEOGRAPHY AND HISTORICAL DEMOGRAPHY OF LESSER ANTILLEAN LOXIGILLA SPP. 5 6 Maria W. Pil * and Robert E. Ricklefs Department of Biology, University of Missouri-St. Louis, One University Boulevard, St. Louis, Missouri Short title: Phylogeography of West Indian bullfinches *Corresponding author: Maria W. Pil University of Missouri St. Louis. One University Blvd, Research Building 223. Saint Louis, MO, 63121, USA. Telephone: mwbpv5@mail.umsl.edu ABSTRACT West Indian bullfinches belong to the paraphyletic genus Loxigilla (Thraupidae), composed of four species within the subfamily Coerebinae, all endemic to the West Indies archipelago. A single species, L. noctis, extends the length of the Lesser Antilles 57
59 from Grenada in the south to the Virgin Islands in the north. Loxigilla barbadensis is a related population on Barbados; L. portoricensis is endemic to Puerto Rico, the easternmost of the Greater Antilles and closest geographically to L. noctis. We used two mitochondrial genes to assess the phylogeography and historical demography of these species while investigating the genetic relationships between island populations and subspecies throughout the Lesser Antilles. Phylogenetic analyses show that L. barbadensis, the only sexually monomorphic population of Loxigilla, is embedded within L. noctis. Lesser Antillean bullfinches exhibit extensive intraspecific mitochondrial diversity and a high degree of population structure between island populations. Matrilineal genotype distributions distinguish four haplotype groups in L. noctis with the following distributions: 1) the northern Lesser Antillean islands from St. Kitts south to Martinique, 2) Martinique to Grenada, 3) St. Vincent and Grenada, and 4) L. barbadensis. Demographic inferences from mtdna variation in populations of bullfinches were varied. Only two populations L. barbadensis on Barbados and L. noctis on St. Vincent produced consistent indications of demographic expansion, even though L. noctis appears to have recently expanded its range in the northern Lesser Antilles. Phylogeographic analysis of L. noctis reveals a complex and dynamic history that is not evident in the subspecific taxonomy of the species. KEY-WORDS: demographic history, dispersal, haplotype network, island biogeography, population size 58
60 INTRODUCTION Loxigilla is a paraphyletic genus with four described species variously embedded within the subfamily Coerebinae (Thraupidae) (Burns et al., 2014), and endemic to the West Indies archipelago. Two are single-island endemics: Loxigilla portoricensis on Puerto Rico, and L. barbadensis on Barbados. The other two species occur, respectively, on the islands of the Greater Antilles (L. violacea) and across the Lesser Antilles (L. noctis) (Raffaele et al., 2010). Also part of this group is the Cuban bullfinch (Melopyrrha nigra), restricted to Cuba and the Cayman Islands, which is sister to L. violacea (Burns et al., 2014), neither of which will be considered further here. Bullfinches are typically abundant birds, particularly in scrubby habitats at low elevations, and they feed on a variety of insects, fruits, and seeds (Raffaele et al., 2010; P. A. Buckley & F. G. Buckley, 2004). The evolutionary history of the Loxigilla bullfinches has unfolded in the West Indies archipelago in the Caribbean Basin, which includes the Greater Antilles and the Lesser Antilles. The former are continental fragments dragged to their present positions by plate movements within the region (Iturralde-Vinent & MacPhee, 1999). The latter formed as an oceanic volcanic arc over the edge of the eastern Caribbean Plate; the archipelago has maintained its present configuration for perhaps 20 million years (Iturralde-Vinent & MacPhee, 1999; Ricklefs & Bermingham, 2008). The Lesser Antillean islands have never had direct land connections to the continent and have never been connected to each other, except for the islands of St. Kitts-Nevis, Antigua-Barbuda, and Grenada-Grenadines; each of these pairs of islands lie on shallow banks (Ricklefs & Bermingham, 2008). 59
61 The entire Coerebinae subfamily, which includes the Darwin finches, has undergone rapid diversification, not least the bullfinches (Mallarino et al., 2012; Burns et al., 2014). Morphological variation among populations of the Lesser Antillean bullfinch, L. noctis, led taxonomists to distinguish eight subspecies in addition to L. barbadensis (Barbados): 1) ridgwayi (Anguilla, St. Martin, St. Barthélémy, Barbuda, and Antigua); 2) coryi (Saba, St. Eustatius, St. Kitts, Nevis, and Montserrat); 3) dominicana (Guadeloupe, Îles des Saintes, Marie-Galante, and Dominica); 4) desiradensis (Désirade); 5) noctis (Martinique); 6) sclateri (St. Lucia); 7) crissalis (St. Vincent); and 8) grenadensis (Grenada) (Ridgway, 1901; P. A. Buckley & F. G. Buckley, 2004). Morphological differences mainly reflect small differences in color, patterning, or measurements (P. A. Buckley & F. G. Buckley, 2004). Species relationships in the genus Loxigilla are complex (see Burns et al., 2002; Mallarino et al., 2012; Burns et al., 2014). The four species of Loxigilla comprise two paraphyletic clades, one that includes L. portoricensis and L. violacea, as well as Melopyrrha nigra Burns et al. (2014) suggested that this clade be named Melopyrrha and another that includes the Lesser Antillean Loxigilla species, L. noctis and L. barbadensis (Burns et al., 2002; Mallarino et al., 2012; Burns et al., 2014). Except for the analyses of Lovette et al. (1999), who used mitochondrial markers to assess relationships between L. barbadensis and L. noctis on St. Lucia (sclateri) and St. Vincent (crissalis), no other phylogeographic information on Loxigilla bullfinches has been published. The historical demography of a population provides insights into the structuring of gene genealogies and is therefore relevant to phylogeographic patterns over microevolutionary scales (Avise, 2000). The distributions of widespread species like L. noctis 60
62 clearly have expanded relatively recently. Whether the history of this expansion, including founder effects and the generation of new genetic diversity within island populations, is retained in the genetic variation of contemporary populations is important to understanding the historical biogeography and demography of populations more generally. Understanding a population s trajectory through time can inform our understanding of selection and adaptation in such dynamic species. Ultimately, the fate of a population depends on its long-term demography (Fahey et al., 2014). Here, we assess the relationship between phylogeographic relationships and historical demographic patterns in island populations of Loxigilla species in Puerto Rico and the Lesser Antilles MATERIALS AND METHODS Study sites and field sample collection We studied three species of bullfinch: Loxigilla portoricensis, which is endemic to Puerto Rico; L. noctis, which is distributed from the Virgin Islands south through the Lesser Antilles to Grenada; and L. barbadensis, which is endemic to Barbados. Blood samples were collected from birds on 13 islands: the Puerto Rican bullfinch (L. portoricensis) sample used in this analysis represents a high elevation population in the wet El Yunque National Forest (EY) in eastern Puerto Rico; the Lesser Antillean bullfinch (L. noctis) was sampled on the following islands (from north to south) St. Kitts (SK), Nevis (NE), Montserrat (MO), Barbuda (BU), Antigua (AN), Guadeloupe (GU), Dominica (DO), Martinique (MA), St. Lucia (SL), St. Vincent (SV), and Grenada (GD); 61
63 finally, L. barbadensis was sampled on Barbados (BA) (Fig. 1). Blood was collected nondestructively, under permit from local governments, from 247 individuals (up to 31 individuals per island; Table 1). Birds were captured in mist nets between April and August over the period Blood was collected via sub-brachial venipuncture; detailed field methods are described in Latta and Ricklefs (2010). Molecular methods DNA was extracted from the 247 blood samples using an isopropanol precipitation protocol described in detail in Svensson and Ricklefs (2009). Genetic variation was quantified by sequencing two mitochondrial genes, cytochrome b (CYTB) and NADH subunit 2 (ND2) using methods described by Pil et al. (Chapter 1). All chromatograms were checked and aligned using Geneious v.5.6. Alignments of cytb and ND2 were concatenated for all analyses, adding to 1,479 bp. Haplotypes were deposited in GenBank (accession numbers xxxx-xxxxx). Phylogeography and population genetics analyses The following summary statistics were calculated for each population using Arlequin v.3.5 (Excoffier & Lischer, 2010): number of segregating sites (S), number of haplotypes (h), haplotype diversity (hd), and nucleotide diversity (π). Pairwise island genetic differentiation was estimated by FST with confidence intervals, based on 1,000 permutations, and by Raymond and Rousset s (1995) exact test of sample differentiation based on haplotype frequency with a Markov chain of 100,000 steps. Genetic distances between species were calculated as between-group distances by a maximum composite likelihood model (Tamura et al., 2004) with MEGA6 (Tamura et al., 2013). 62
64 To better understand the geographical distribution of genetic variation within L. noctis, an analysis of molecular variance (AMOVA, Excoffier et al., 1992) was performed using Arlequin to quantify the proportion of genetic variation distributed within and among populations of L. noctis. We also ran a hierarchical AMOVA with three groups representing the three different species of Loxigilla. Relationships among island populations of L. noctis were also inferred with median-joining haplotype networks (Bandelt et al., 1999) using the software Network v.4.6 (available at Because of the mitochondrial genetic similarity between L. noctis and L. barbadensis (see Results), we included both species in the haplotype network. Phylogeography of Loxigilla was inferred with Maximum Likelihood (ML) and Bayesian inference phylogenetic analyses. Individuals of Coereba flaveola (unpublished data) were used as an outgroup for both phylogenetic analyses; the species is sister to the clade including all three species of Loxigilla (Burns et al., 2014). ML inference was implemented using MEGA6 (Tamura et al., 2013) and the model of nucleotide substitution GTR + G, inferred with jmodeltest v (Guindon & Gascuel, 2003; Darriba et al., 2012) and selected by the Akaike Information Criterion (AIC). The most likely tree was computed, and 500 bootstrap replicates were performed to assess support for each node. Nodes with bootstrap values greater than 70% were considered strongly supported (Hillis & Bull, 1993). A Bayesian tree was generated with BEAST v (Drummond et al., 2012) implemented on the XSEDE computing cluster via the CIPRES Science Gateway v.3.3 (Miller et al., 2010) also using the nucleotide substitution model GTR+G inferred by 63
65 jmodeltest v (Guindon & Gascuel, 2003; Darriba et al., 2012). Bayesian analysis was run with 100 million generations sampled every 5,000. Trees were generated using a strict molecular clock with a nucleotide substitution rate of 10-8 per position per year (Weir & Schluter, 2008). We used Tracer v1.6 (Rambaut et al., 2014) to assess convergence across independent runs and to examine effective sample sizes for all parameters. We produced a maximum clade credibility tree using the BEAST program TreeAnnotator v (Drummond et al., 2012) ignoring the first 10,000 states as burnin. Posterior probabilities of 0.95 and higher were considered strong support. The resulting tree was visualized and edited using FigTree v (available at Demographic analyses To investigate historical demography of the genetically monophyletic populations of all species, we calculated several measures: (i) the index of change in population size, Tajima s D, which tests for an excess of low frequency polymorphisms (Tajima, 1989); (ii) Fu s FS, which tests for an excess of low-frequency haplotypes characteristic of expanding populations (Fu, 1997); (iii) mismatch distribution, which is the distribution of pairwise differences among haplotypes, and includes statistical tests of population sudden expansion, namely the sum of squared deviations (SSD) and Harpending s raggedness index (r) (Slatkin & Hudson, 1991; Rogers & Harpending, 1992; Harpending, 1994). All these indices and their respective levels of statistical significance were calculated with Arlequin v.3.5 (Excoffier & Lischer, 2010). Graphs of pairwise differences were generated with R (R Core Team, 2014), using the ggplot2 package (Wickham, 2009). R Scripts are available in Appendix A of Chapter 1, or can be downloaded at 64
66 Where relevant, the estimated mismatch distribution values of the tau parameter (τ, units of mutational time) were converted into the most recent timesince-expansion (t) by solving t = τ/2u (Rogers & Harpending, 1992), where u is the probability of a nucleotide substitution at any individual locus in the sequence, using the Mismatch Calculator (Schenekar & Weiss, 2011) available at: u was calculated from an average substitution rate, the number of base pairs in our sequence alignments (1,479), and a generation time of 3 years, based on an estimated adult survival rate of 0.51 for a related species, Coereba flaveola (Coerebinae), on Puerto Rico (Faaborg & Arendt, 1995). Substitution rates were calculated based on the 2.07% average sequence divergence per million years for passerine birds estimated by Weir and Schluter (2008). Confidence intervals of time since expansion were derived from 2.5% and 97.5% quantile values provided for τ by Arlequin. Skyline Bayesian plots (BSP) (Drummond et al., 2005) were also constructed for each reciprocally monophyletic population using BEAST v (Drummond et al., 2012), which provides graphs of estimated effective population size through time. A strict molecular clock was assumed (substitution rate, μ =1 x 10⁻⁸ ), with 10 grouped coalescent intervals (Markov chain Monte Carlo (MCMC) = 5 x 10 8 ; burn-in = 5 x 10 7 ; Piecewiseconstant skyline model; Coalescent: Constant Size tree priors). Convergence of the MCMC chain was inspected by checking the effective sample size (ESS) using Tracer v.1.6 (Rambaut et al., 2014). The nucleotide substitution models used varied by population and were estimated using AIC implemented in jmodeltest v (Posada, 2008) (Table 1). Skyline Plots were generated with R (R Core Team, 2014), using the 65
67 ggplot2 package (Wickham, 2009). R Scripts are available in Appendix A of Chapter 1, or can be downloaded at RESULTS Summary statistics The alignment of concatenated sequences of all 247 samples for the three species of Loxigilla resulted in 68 distinct haplotypes, diverging at 176 segregating sites, with haplotype diversity ranging from 0.39 ± 0.14 on St. Vincent to 0.96 ± 0.04 on Martinique. Nucleotide diversity was low overall, ranging from ± on Antigua to ± at El Yunque, Puerto Rico (Table 1). Number of haplotypes per island population of each species was similar: 10 in L. barbadensis, an average of 6 in L. noctis, and 7 in L. portoricensis. Phylogenetic inferences Bayesian inference and Maximum Likelihood presented similar topologies (Fig. 2). These support species monophyly for Loxigilla portoricensis and L. noctis; L. barbadensis is embedded within L. noctis, although its placement lacks support (Fig. 2). In both topologies, the L. barbadensis clade has strong support. The genetic distance between L. portoricensis and the other two species, based on the mitochondrial data, is 7%; only 0.6% separate L. barbadensis and L. noctis. Loxigilla noctis encompasses three clades consistent with the grouping found in the haplotype network. These clades partially overlap geographically: one extends through island populations from St. Kitts/Nevis south to Martinique; the second includes individuals from Martinique south 66
68 to Grenada; and the third is restricted to individuals from St. Vincent and Grenada, apart from the L. barbadensis clade (Fig. 2). Most of the relationships between L. noctis haplotypes did not receive strong statistical support and short internodes characterized most of the branches among these lineages. Estimated node ages in the Bayesian tree suggest that the basal split between L. portoricencis and the ancestor of L. noctis and L. barbadensis occurred ca. 9.5 million years ago (C.I. = 7 12). The basal divergence of contemporary haplotypes within the L. portoricensis clade is approximately 196 thousand years old (C.I. = ); L. noctis haplotypes coalesced around 534 thousand years ago (C.I. = ), and L. barbadensis haplotypes coalesced approximately 158 thousand years ago (C.I. = ). Both northern (Dominica north) and southern (Martinique south) radiations of L. noctis coalesce to approximately the same time: 410 thousand years in the south (C.I. = ) and 375 thousand years in the north (C.I. = ). The divergence between L. barbadensis and L. noctis took place around 345 thousand years ago (C.I. = ). Population structure of L. noctis Bullfinches show extensive intraspecific mitochondrial diversity. Pairwise FST values between populations of L. noctis varied substantially, from 0.02 between St. Kitts and Nevis, to 0.91 between St. Vincent and Antigua, but most values exceeded 0.2 (Table 2). Pairwise comparisons that included the southernmost island of St. Vincent yielded uniformly high values of FST, except in the case of the neighboring island of Grenada (GD) (FST = 0.23). The significance values for all FST comparisons indicate genetic structure (P < 0.01) except between the pair of populations on Dominica and 67
69 Guadeloupe, and the pair on St. Kitts and Nevis (Table 2). The exact test of population differentiation indicates a lack of population structure only between St. Kitts and Nevis, the two closest islands in the Lesser Antilles. Because these populations show strong evidence of gene flow or recent derivation (the islands were connected by a land bridge during the Last Glacial Maximum), we will consider them as a single population for demographic analyses. We also calculated pairwise FST between populations of the two other species of bullfinches, which was 0.98 between L. portoricensis and L. barbadensis, between L. portoricensis and L. noctis, and 0.57 (MA) to 0.88 (NE) between L. noctis and L. barbadensis. AMOVA also indicated a high degree of population structure between L. noctis populations: 68% of the genetic variation occurs among populations, and 32% within populations (Table 3). Hierarchical AMOVA including island populations of all three species indicated a high degree of differentiation among species, as expected, partitioning 89% of the genetic variation between species, followed by 7% of the variation among populations within species, and only 4% within populations (Supplemental Table 2). The median-joining haplotype network including L. noctis populations and L. barbadensis (Fig. 3) provides a clear picture of L. barbadensis genetic isolation, although the two species are separated by only three steps through the shortest pathway (H_10 to H_34 in Fig. 3). Haplotype sharing was evident among the northern Lesser Antillean Islands, from St. Kitts to Guadeloupe (H_2 in Fig. 3). Over all the samples for L. noctis and L. barbadensis, the haplotype network distinguishes four groups: 1) the northern Lesser Antillean islands from St. Kitts to Martinique, 2) Martinique to Grenada, 3) St. Vincent and Grenada, and 4) L. barbadensis. Separate from these four groups are two 68
70 haplotypes, one representing three individuals from Barbuda (H_13) and from the other, one individual from Guadeloupe (H_30) Demographic analyses Only two populations show consistent indications of demographic expansion from all indices: the endemic L. barbadensis on BA, and L. noctis on St. Vincent (Table 4, Fig. 4). Mismatch graphs show a unimodal distribution indicative of population demographic expansion for L. barbadensis, and the L. noctis populations in St. Vincent (Fig. 4). Time since last expansion calculated from τ values indicate that the sudden expansion occurred ca. 58,245 years ago (97.5% CI = 28,239-94,419) in the L. barbadensis population, and ca. 97,990 years ago (CI = 0-116,096) in the St. Vincent population (Table 4). Tajima s D and Fu s FS corroborate a scenario of population expansion in L. barbadensis, although only significantly for FS (P<0.05). The only other population that presents a significant negative value of Fu s FS is L. noctis on St. Vincent. Other populations present negative and positive values of Tajima s D and/or Fu s FS, but none are significant (Table 4). The Bayesian Skyline Plots indicate increase through time in population size in L. barbadensis, although the 95% confidence intervals are broad, and in three populations of L. noctis: Martinique, St. Lucia, and St. Vincent (Fig.4). The analysis also suggests a population decline in L. noctis on Grenada, and demographic stability in all other populations, including L. portoricencis. 69
71 DISCUSSION Using a combination of population genetic approaches, this study provides insight into the demographic and geographic history of bullfinch species among island populations of the West Indies. Of the three species studied here, the island endemic populations of L. barbadensis and L. portoricensis are monophyletic. However, the widespread L. noctis is paraphyletic, with L. barbadensis being deeply nested within the clade. Island populations of L. noctis are mostly genetically distinct, except for those on the neighboring islands of St. Kitts and Nevis, which were recently connected by a land bridge. Genetic divergence between islands occurs within several named subspecies. In common with other species (e.g. Pil et al. Chapter 1; Crews & Gillespie, 2010; Surget- Groba & Thorpe, 2012), L. noctis exhibits a phylogeographic break between the northern and southern islands in the Lesser Antilles. We discuss these findings below in more detail. Phylogenetic relationships between Loxigilla species Our phylogeny is somewhat concordant with previously studies investigating the relationships among Loxigilla species (i.e. Burns et al., 2002; Mallarino et al., 2012). Loxigilla portoricensis is distantly related to the L. noctis and L. barbadensis clade. Although previous broad-scale studies of the Coerebinae have placed L. noctis and L. barbadensis as sister taxa (e.g., Burns et al. 2014), detailed analyses of many island populations of Loxigilla in the Lesser Antilles presented here clearly places L. barbadensis within L. noctis. 70
72 The origin of the Barbados population of Loxigilla has been studied by Lovette et al. (1999) based on mitochondrial DNA sequences from L. barbadensis and from L. noctis on St. Lucia (sclateri) and St. Vincent (crissalis). They found the three populations to be reciprocally monophyletic and suggested that Barbados was colonized in a single event from either St. Lucia or St. Vincent. Our results are consistent in that Barbados lineages are distinct enough to indicate that migration to the island is infrequent, and that the Barbados population likely derived from a single early invasion. However, the population on Barbados is genetically more closely related to the populations of L. noctis on Martinique (subspecies noctis) and St. Lucia (subspecies sclateri), and it is clearly embedded within, rather than being sister to, L. noctis. The lower pairwise FST values between Barbados and Martinique (0.57) and St. Lucia (0.65), compared to St. Vincent (0.86) suggests that the source of the L. barbadensis population might have been either St. Lucia or Martinique. Phylogeography of L. noctis Plausibly, following the initial expansion of L. noctis in the Lesser Antilles, distinct groups of populations formed as movement between the islands decreased: one group in northern Lesser Antilles extends from St. Kitts to Dominica, a second group occurs on Martinique and St. Lucia, and a third on St. Vincent and Grenada, with the Barbados population allied with the Martinique/St. Lucia populations. The haplotype network also indicates sporadic movement of haplotypes between Martinique and northern Lesser Antilles (Dominica north), and from St. Lucia south to Grenada. The bullfinch population on Martinique includes individuals with mitochondrial haplotypes more closely related to the northern group of islands, but also several that are 71
73 more related to the southern group (St. Lucia through St. Vincent). This pattern of genetic distribution indicates gene flow occurred after the northern and southern groups became genetically separated. Despite some gene flow, a second strong matrilineal phylogeographic break, supported by both the phylogenetic tree and the haplotype network, occurs between Dominica and Martinique. Phylogeographic breaks between northern and southern Lesser Antillean islands are relatively common, and include organisms with different dispersal abilities (Kaiser et al., 1994; Schneider et al., 2001; Creer et al., 2001; Davies & Bermingham, 2002; e.g. 2002; Crews & Gillespie, 2010; Surget-Groba & Thorpe, 2012). The location of the phylogenetic breaks varies among the lineages. For example, the bananaquit, Coereba flaveola, another member of the Coerebinae, presents a clear phylogeographic break between St. Lucia and St. Vincent, without any sign of gene flow between northern and southern groups (Pil et al., Chapter 1). Even though phylogeographic breaks can occur in the absence of a geographic barrier to gene flow (Irwin, 2002; Kuo & Avise, 2005), such breaks are clearly associated with water gaps in the Lesser Antilles. It is striking that the distinctiveness of genetic lineages occurs so often between northern and southern Lesser Antillean islands, but with no consistency of where. This apparent shift of where the break occurs renders the phenomenon difficult to explain. Demographic patterns The demographic patterns exhibited by populations of bullfinches appear idiosyncratic. Most populations are stable, including that of the Puerto Rican endemic, L. portoricensis, and almost all L. noctis populations, except the one on St. Vincent, which 72
74 shows signs of expansion. Loxigilla barbadensis also appears to have expanded recently. Furthermore, the Bayesian Skyline plot and positive values of Tajima s D and Fu s FS suggest that the L. noctis population on Grenada has experienced a recent decline. This decline in population size depicted for the L. noctis population on Grenada might be related to a considerable shrinkage in island size since the Last Glacial Maximum (LGM). Currently, the islands of the West Indies are likely close to their historical minimum size because of high sea levels. Grenada nowadays has approximately 348 Km 2 of area. However, during the LGM, Grenada was connected to the Grenadines, which considerably increased its size, and has since then shrunk almost 2,000 Km 2 (Sietze Norder & Kenneth Rijsdijk, personal communication, but see Rijsdijk et al. (2014) for bathymetric methods). Expansions and contractions of West Indian birds have been discussed since Ricklefs and Cox s description of the taxon cycle (Ricklefs & Cox, 1972; 1978). There is a cyclic nature to populations of West Indian birds. Molecular phylogenetic analyses have confirmed that Ricklefs and Cox s taxon cycle stages represent a time sequence that begins with young taxa that are widespread and undifferentiated (stage I), then passes to older taxa that are widespread but differentiated (stage II), and finally reaches older endemic taxa that have fragmented distributions or are single island endemics (stages III and IV, respectively) (Ricklefs & Bermingham, 2004; Ricklefs, 2010). Recently, Pil et al. (Chapter 1) have investigated the taxon cycle status of the bananaquit, Coereba flaveola (Thraupidae: Coerebinae). On the Greater Antillean islands to the west of Hispaniola (Jamaica and the Cayman Islands), and on the southernmost Lesser Antillean islands of Saint Vincent and Grenada, bananaquits show evidence of stable populations, whereas 73
75 the populations in the northern Lesser Antilles, Puerto Rico, and Hispaniola show clear signs of expansion. These demographic patterns of expansion characterize a different taxon-cycle phase of the species in relation to Loxigilla species. Loxigilla noctis falls within the stage II category, and thus, it is not surprising that most of its populations are stable, since the species has reached the differentiation phase ACKNOWLEDGEMENTS This work was supported by the National Geographic Society, the National Science Foundation, Curators of the University of Missouri St. Louis, the Whitney R. Harris World Ecology Center (John Denver Memorial Scholarship in Tropical Ecology), the Student Research Award from the American Society of Naturalists, and the Saint Louis Audubon Society. M.W.P. received funding from Fulbright, the Coordination for the Improvement of Higher Education CAPES-MEC (Brazil), and the University of Missouri St. Louis REFERENCES Avise, J.C Phylogeography: the history and formation of species. Harvard University Press Bandelt, H.J., Forster, P. & Röhl, A Median-joining networks for inferring intraspecific phylogenies. Molecular biology and evolution 16: Buckley, P.A. & Buckley, F.G Rapid speciation by a Lesser Antillean endemic, Barbados Bullfinch Loxigilla barbadensis. Bulletin of the British Ornithologists Club 74
76 : Burns, K.J., Hackett, S.J. & Klein, N.K Phylogenetic relationships and morphological diversity in Darwin's finches and their relatives. Evolution; international journal of organic evolution 56: Burns, K.J., Shultz, A.J., Title, P.O., Mason, N.A., Barker, F.K., Klicka, J., et al Molecular Phylogenetics and Evolution. Molecular phylogenetics and evolution 75: Creer, D.A., de Queiroz, K., Jackman, T.R., Losos, J.B. & Larson, A Systematics of the Anolis roquet Series of the Southern Lesser Antilles. Journal of Herpetology 35: Crews, S.C. & Gillespie, R.G Molecular systematics of Selenops spiders (Araneae: Selenopidae) from North and Central America: implications for Caribbean biogeography. Biological Journal of the Linnean Society 101: Darriba, D., Taboada, G.L., Doallo, R. & Posada, D jmodeltest 2: more models, new heuristics and parallel computing. Nature Methods 9: Davies, N. & Bermingham, E The historical biogeography of two Caribbean butterflies (Lepidoptera: Heliconiidae) as inferred from genetic variation at multiple loci. Evolution; international journal of organic evolution 56: Drummond, A.J., Rambaut, A., Shapiro, B. & Pybus, O.G Bayesian Coalescent Inference of Past Population Dynamics from Molecular Sequences. Molecular 75
77 biology and evolution 22: Drummond, A.J., Suchard, M.A., Xie, D. & Rambaut, A Bayesian Phylogenetics with BEAUti and the BEAST 1.7. Molecular biology and evolution 29: Excoffier, L. & Lischer, H.E.L Arlequin suite ver 3.5: a new series of programs to perform population genetics analyses under Linux and Windows. Molecular Ecology Resources 10: Excoffier, L., Smouse, P.E. & Quattro, J.M Analysis of molecular variance inferred from metric distances among DNA haplotypes: application to human mitochondrial DNA restriction data. Genetics 131: Faaborg, J. & Arendt, W.J Survival rates of Puerto Rican birds: Are islands really that different? The Auk 112: Fahey, A.L., Ricklefs, R.E. & DeWoody, J.A DNA based approaches for evaluating historical demography in terrestrial vertebrates. Biological Journal of the Linnaean Society 112: Fu, Y.X Statistical Tests of Neutrality of Mutations against Population Growth, Hitchhiking and Background Selection. Genetics 147: Guindon, S. & Gascuel, O A simple, fast, and accurate algorithm to estimate large phylogenies by maximum likelihood. Systematic biology 52: Harpending, H.C Signature of ancient population growth in a low-resolution mitochondrial DNA mismatch distribution. Human Biology 66:
78 Hillis, D.M. & Bull, J.J An Empirical Test of Bootstrapping as a Method for Assessing Confidence in Phylogenetic Analysis. Systematic biology 42: Irwin, D.E Phylogeographic breaks without geographic barrier to gene flow. Evolution 56: Iturralde-Vinent, M.A. & MacPhee, R.D.E Paleogeography of the Caribbean region: implications for cenozoic biogeography. Bulletin of the American Museum of Natural History Kaiser, H., Green, D.M. & Schmid, M Systematics and biogeography of Eastern Caribbean frogs (Leptodactylidae: Eleutherodactylus), with the description of a new species from Dominica. Canadian Journal of Zoology 72: Kuo, C.-H. & Avise, J.C Phylogeographic breaks in low-dispersal species: the emergence of concordance across gene trees. Genetica 124: Latta, S.C. & Ricklefs, R.E Prevalence patterns of avian haemosporida on Hispaniola. Journal of Avian Biology 41: Lovette, I.J., Seutin, G., Ricklefs, R.E. & Bermingham, E The assembly of an island fauna by natural invasion : Sources and temporal patterns in the avian colonization of Barbados. Biological Invasions 1: Mallarino, R., Campas, O., Fritz, J.A., Burns, K.J., Weeks, O.G., Brenner, M.P., et al Closely related bird species demonstrate flexibility between beak morphology and underlying developmental programs. Proceedings of the National Academy of 77
79 Sciences 109: Miller, M.A., Pfeiffer, W. & Schwartz, T Creating the CIPRES Science Gateway for inference of large phylogenetic trees. pp IEEE, New Orleans Posada, D jmodeltest: Phylogenetic Model Averaging. Molecular biology and evolution 25: R Core Team (2014). R: A language and environment for statistical computing. R Foundation for Statistical Computing, Vienna, Austria. URL project.org/ Raffaele, H.A., Wiley, J., Garrido, O.H., Keith, A. & Raffaele, J.I Birds of the West Indies, 2nd ed. Princeton University Press, Princeton Rambaut, A., Suchard, M.A., Xie, D. & Drummond, A.J Tracer v.1.6. Available from Raymond, M. & Rousset, F An Exact Test for Population Differentiation. Evolution 49: Ricklefs, R. & Bermingham, E The West Indies as a laboratory of biogeography and evolution. Philosophical transactions of the Royal Society of London. Series B, Biological sciences 363: Ricklefs, R.E Colonization of the Lesser Antilles by land birds. Ecology 91: Ricklefs, R.E. & Bermingham, E History and the species-area relationship in 78
80 Lesser Antillean birds. The American Naturalist 163: Ricklefs, R.E. & Cox, G.W Taxon Cycles in the West Indian Avifauna. The American Naturalist 106: Ricklefs, R.E. & Cox, G.W Stage of Taxon Cycle, Habitat Distribution, and Population Density in the Avifauna of the West Indies. The American Naturalist 112: Ridgway, R The birds of North and Middle America : a descriptive catalogue of the higher groups, genera, species, and subspecies of birds known to occur in North America, from the Arctic lands to the Isthmus of Panama, the West Indies and other islands of the Caribbean sea, and the Galapagos Archipelago. Part I. Family Fringilidae - The Finches. Bulletin of the United States National Museum 50: Rijsdijk, K.F., Hengl, T., Norder, S.J., Otto, R., Emerson, B.C., Ávila, S.P., et al Quantifying surface-area changes of volcanic islands driven by Pleistocene sea-level cycles: biogeographical implications for the Macaronesian archipelagos. Journal of Biogeography 41: Rogers, A.R. & Harpending, H Population growth makes waves in the distribution of pairwise genetic differences. Molecular biology and evolution 9: Schenekar, T. & Weiss, S High rate of calculation errors in mismatch distribution analysis results in numerous false inferences of biological importance. Heredity 107:
81 Schneider, C.J., Losos, J.B. & de Queiroz, K Evolutionary Relationships of the Anolis bimaculatus Group from the Northern Lesser Antilles. Journal of Herpetology 35: Slatkin, M. & Hudson, R.R Pairwise Comparisons of Mitochondrial DNA Sequences in Stable and Exponentially Growing Populations. Genetics 129: Surget-Groba, Y. & Thorpe, R.S A likelihood framework analysis of an island radiation: phylogeography of the Lesser Antillean gecko Sphaerodactylus vincenti, in comparison with the anole Anolis roquet. Journal of Biogeography 40: Svensson, L.M.E. & Ricklefs, R.E Low diversity and high intra-island variation in prevalence of avian Haemoproteus parasites on Barbados, Lesser Antilles. Parasitology 136: Tajima, F Statistical Method for Testing the Neutral Mutation Hypothesis by DNA Polymorphism. Genetics 123: Tamura, K., Nei, M. & Kumar, S Prospects for inferring very large phylogenies by using the neighbor-joining method. Proceedings of the National Academy of Sciences of the United States of America 101: Tamura, K., Stecher, G., Peterson, D., Filipski, A. & Kumar, S MEGA6: Molecular Evolutionary Genetics Analysis version 6.0. Molecular biology and evolution 30:
82 Weir, J.T. & Schluter, D Calibrating the avian molecular clock. Molecular Ecology 17: Wickham, Hadley ggplot2: Elegant Graphics for Data Analysis. Springer, New York
83 TABLES Table 1. Indices of genetic diversity for bananaquit populations: n, number of individuals sequenced; S, number of segregation sites; h, number of haplotypes; haplotype diversity; and nucleotide diversity. n S h Haplotype diversity (hd) Nucleotide diversity (π) Substitution model Loxigilla barbadensis Barbados / / HKY Loxigilla noctis St. Kitts / / HKY Nevis / / HKY+I Montserrat / / TrN Barbuda / / HKY Antigua / / HKY Guadaloupe / / HKY Dominica / / HKY+I Martinique / / GTR St. Lucia / / HKY+I St. Vincent / / GTR Grenada / / HKY+I Loxigilla portoricensis Porto Rico - EY / / HKY+I
84 Table 2. Pairwise differences between pairs of sampled island populations. FST values are below the diagonal, and significance of population differentiation is above the diagonal. + indicates significant difference between populations (P < 0.05), and indicates no significant difference (P > 0.05). PR BA SK NE MO BU AN GU DO MA SL SV GD PR BA SK NE MO BU AN GU DO MA SL SV GD
85 Table 3. Results of the analysis of molecular variance (AMOVA) showing how genetic variation is distributed in Loxigilla noctis, and in a hierarchical AMOVA with all three species. d.f., degrees of freedom. 570 Source of variation d.f. Sum of Squares Variance components Percent of variation 571 Loxigilla noctis Among populations Within populations Hierarchical Amog groups Among populations withing groups Within populations
86 Table 4. Demographic analyses: Tajima s D, Fu s FS, Sum of Squared Deviations (SSD), raggedness indices (r), and time since most recent expansion (in years) derived from the τ parameter, including confidence intervals. * indicates statistically significant values (P < 0.05). 588 Tajima s D Fu s FS SSD r time since expansion Loxigilla barbadensis Barbados * ,245 (28,239-94,419) Loxigilla noctis St. Kitts/Nevis Montserrat Barbuda * Antigua Guadaloupe Dominica Martinique St. Lucia St. Vincent * ,990 (0-116,096) Grenada Loxigilla portoricensis Porto Rico - EY
87 FIGURE LEGENDS Figure 1. Map of the West Indies. Amplified islands in box correspond to sampled islands Figure 2. Phylogenetic trees of Loxigilla species. Smaller tree includes all three species of bullfinches. Upper node values represent Bayesian posterior probability, and lower node values represent Maximum Likelihood bootstrap values. Larger tree is an enlargement of the section of the Bayesian phylogenetic analysis that included L. noctis and L. barbadensis, surrounded by the red rectangle. Node values represent posterior probability higher than 95%. Branch tips are colored according to island where individual was collected as per legend Figure 3. Median joining haplotype network of Loxigilla noctis populations and L. barbadensis. Each circle represents a different haplotype, and each open dot indicates a mutation between one haplotype and the other. Small red dots between haplotypes indicate an unsampled or ancestral haplotype state. The size of the circle corresponds to the number of individuals that share that haplotype according to legend. Each island is represented by a different color (see legend). Haplotypes origins: H_1: AN; H_2: AN, BU, GU, MO, NE, SK; H_3 H_12: BA; H_13: BU; H_14: MO; H_15: DO, GU; H_16: DO; H_17: DO, GU; H_18 H_20: DO; H_21: GD, MA, SL, SV; H_22 H_25: GD, H_26 H_32: GU; H_33 H_35: MA; H_36: MA, MO; H_37: MA; H_38: MA, MO; 86
88 H_39 H_42: MA; H_43: MO; H_44: NE, SK; H_45: NE, SK; H_46 H_53: SL; H_54 H_57: SV Figure 4. Historical demography analyses based on mismatch distributions (left) and Bayesian Skyline Plots (right) showing changes in bullfinch population size through time (years). With respect to mismatch distributions, smooth unimodal graphs indicate population expansion, black lines indicate observed pairwise difference values, and dashed lines indicate expected values under a population expansion model. Bayesian Skyline Plots, shaded area = 95% confidence interval, black line = median log (Ne). 87

89 88 Figure 1. 88

90 Figure Loxigilla portoricensis Loxigilla noctis Loxigilla barbadensis outgroup 89
91 90 Figure 3. 90
92 91 Figure 4. Frequency L. noctis, SK NE Pairwise differences log(ne) Time Frequency L. noctis, BU Pairwise differences log(ne) Time Frequency L. noctis, AN log(ne) Pairwise differences Time Frequency L. noctis, GU Pairwise differences log(ne) e+00 5e+04 1e+05 Time Frequency L. noctis, DO Pairwise differences log(ne) Time 91
93 92 Frequency L. noctis, MA Pairwise differences log(ne) Time Frequency L. noctis, MO Pairwise differences log(ne) Time Frequency L. noctis, SL Pairwise differences log(ne) e+00 1e+05 2e+05 Time Frequency L. noctis, SV Pairwise differences log(ne) Time Frequency L. noctis, GD Pairwise differences log(ne) e+00 1e+05 2e+05 Time 92
 13 12 11 10 10 0 0 2 4 6 Pairwise differences 0 5000 10000 15000 20000 Time")
94 93 L. barbadensis Frequency 50 log(ne) Pairwise differences Time 50 L. portoricensis Frequency log(ne) Pairwise differences Time 93
95 CHAPTER 3 COMPARATIVE PHYLOGEOGRAPHY AND DEMOGRAPHY OF THE WEST INDIAN AVIFAUNA Maria W. Pil 1* and Robert E. Ricklefs Department of Biology, University of Missouri-St. Louis, One University Boulevard, St. Louis, Missouri *Correspondence: Maria W. Pil, Department of Biology, University of Missouri-St. Louis, One University Boulevard, St. Louis, Missouri mwbpv5@mail.umsl.edu ABSTRACT Comparative phylogeography provides a way to incorporate spatial information on genetic diversity to regional assessments of biodiversity, thereby allowing the investigation of fundamental relationships between population processes and regional patterns of diversity and biogeography. Genetic data from several co-occurring species enables one to determine the influence of geographic, geological, and climatological events that have had a common influence on current patterns of genetic diversity and demography. In a group of species of the same region, homogeneous patterns would likely signify environmental factors might be playing an important role in shaping the demographic change occurring in the community in question, whereas idiosyncratic patterns would imply species-specific factors govern the demographic history of the 94
96 community. With an extensive sample collection of nine avian species on 21 islands, this study investigates phylogeographic and demographic patterns in the West Indies. Comparative phylogeographic analyses reveal three conspicuous patterns: 1) populations on larger Greater Antillean islands are generally distinct from those on the smaller Lesser Antilles; 2) a common phylogeographic break exists between northern and southern Lesser Antilles, particularly between the islands of St. Lucia and St. Vincent; and 3) populations on Barbados, a low-lying island to the east of the main Lesser Antilles, are genetically distinct. Demographic trends revealed by coalescence analyses of contemporary genetic diversity are highly variable. Island identity is not predictive of demographic state, species specific behavior predicts the demographic history of the West Indian avifauna Key words: biogeography, Coereba, Loxigilla, population genetics, Tiaris 95
97 INTRODUCTION Phylogeographic analyses reveal relationships between population processes and regional patterns of diversity and biogeography (Avise 2000). Using genetic data from several co-occurring species, comparative phylogeographic analyses address questions concerning geographic, geological, and climatological events that have produced the current patterns of diversity (Hickerson et al. 2010). Comparative phylogeographic analyses of several species in a broad geographic range have received much less attention than single species phylogeographic works; however, it is only by comparing several species from the same geographic area that one can disentangle the effects of species characteristics and regional attributes to understand factors that cause demographic change (Avise 2000). Islands are often considered natural laboratories, and studies on islands have greatly contributed to the development of evolutionary and ecological theory (Ricklefs and Bermingham 2004; Losos and Ricklefs 2009; Ricklefs and Bermingham 2001). The main advantage of studying islands instead of continental regions is that species are subdivided into discrete populations, geographically isolated from other island populations. The West Indies, which comprise the Bahamans, the Greater and Lesser Antilles, form one of these unique systems. The Greater Antilles consist of mainly continental fragments that remained somewhat connected to the North American continent until arriving at their current positions ca million years ago. In contrast, the Lesser Antilles are mostly volcanic in origin, and are estimated to be million years old (Iturralde-Vinent and MacPhee 1999; Iturralde-Vinent 2006). One of the Lesser Antillean islands, Barbados, which is an uplifted marine platform, lies east of the main volcanic arc and is by far the 96
98 youngest island, being about 700 thousand years old (Mesolella 1967). The Lesser Antillean volcanic arc islands range in size from Guadeloupe (1628 km 2 ) to Saba (13 km 2 ). The contemporary volcanic islands probably originated within the past 20 million years (Iturralde-Vinent and MacPhee 1999). Volcanic eruptions have occurred on Montserrat, Martinique, and Saint Vincent during the past century. Most of the Lesser Antillean islands have been isolated from each other by marine passages through geological time. None have had land connections to the continent. Some of the Lesser Antilles lying on shallow marine platforms have been connected during Pleistocene sea level low stands (Last Glacial Maximum, ca. 20 thousand years ago (kya)): Anguilla, St. Martin and St. Bartholomew; Guadeloupe and Marie-Galante; Antigua and Barbuda; St. Kitts, Nevis, and St. Eustatius; Grenada and the Grenadines (Woods and Sergile 2001). According to Curtis et al. (2001), the Caribbean experienced a cool, arid late glacial climate, which progressed to a moister, more tropical climate in middle-late Holocene. Making use of an extensive sample, we ask whether general phylogeographic and demographic patterns emerge in an assemblage of birds within a single, large region, in this case the West Indies archipelago. Genetic indicators of population expansion and phylogeographic analyses permit an appraisal of changes in population sizes of birds over time and how their genetic variation is distributed over space, respectively. Understanding the changes in population size in the context of historical and ecological factors provides perspective on future change. In an assemblage of species in the same archipelago, homogeneous patterns would signify that environmental factors might be playing an important role in shaping the demographic change occurring in the community in question, whereas idiosyncratic patterns would imply species-specific factors govern 97
99 the demographic history of the community. We find common phylogeographic characteristics in West Indians birds, and discuss them in the light of geology, geography and species-specific terms. Demographic patterns, on the other hand, show no commonality among the species sampled, and indicate that species-specific patterns play a more important role in shaping the demographic fluctuations in the West Indies MATERIALS AND METHODS Studied species To investigate phylogeography and historical demography, we quantified mitochondrial genetic variation from nine avian species of five families across 21 islands (Figure 1, Table 1). The species are Margarops fuscatus (Mimidae); Setophaga petechia (Parulidae); Coereba flaveola, Loxigilla barbadensis, Loxigilla noctis, Loxigilla portoricensis and Tiaris bicolor (Thraupidae); Elaenia martinica (Tyrannidae); and Vireo altiloquus (Vireonidae). The representative of the Mimidae, the pearly-eyed thrasher, M. fuscatus, is endemic to the West Indies, occurring on the Bahamas, Puerto Rico, the Virgin Islands and the Lesser Antilles down to St. Lucia. It inhabits a variety of habitats at all elevations, from mangroves to mountain tops (Raffaele et al. 2010). The representative of the Parulidae, the yellow warbler, S. petechia, is widespread in the West Indies, occurring on all islands, inhabiting mainly mangroves, but also coastal scrubs in some islands (Raffaele et al. 2010). The tanagers (Thraupidae) include C. flaveola, the bananaquit, 98
100 which is widespread in the West Indies, except Cuba, and inhabits all types of habitats; L. barbadensis, a bullfinch endemic to Barbados; L. noctis, the Lesser Antillean bullfinch, found in the Virgin Islands and all Lesser Antillean islands, except the Grenadines; L. portoricensis, the Puerto Rican bullfinch, another single-island endemic; and T. bicolor, the black-faced grassquit, widespread in the West Indies, although rare in Cuba (Raffaele et al. 2010). The representative of the Tyrannidae, E. martinica, the Caribbean elaenia, occupies woodlands, scrubs and forests (Raffaele et al. 2010). Finally, Vireonidae is represented by the black-whiskered vireo, V. altiloquus. The species occupies all types of forest and is present in almost the entire archipelago, but is a year-round resident only in Hispaniola and the Lesser Antilles (Raffaele et al. 2010) Molecular methods Genetic variation in each population of these species was analyzed by sequencing the mitochondrial genes cytochrome b (CYTB), and NADH dehydrogenase 2 subunit (ND2) of up to 34 individuals of each species and population, depending on availability and species distribution, adding up to 1,452 individuals sampled (Table 1). A few species were collected in two locations within the same island, Puerto Rico, one of the biggest of the sampled ones. One of these locations is the El Yunque Forest Reserve, a wet forest on the far northeast of the islands, and the other is the Guanica Forest, a reserve of dry forest on the far southwest side of the island. For one species, S. petechia, the population was sampled on Boquerón, at the Refugio de Boquerón, also in the far southwest of the country. Although the genes amplified here represent a single linked locus, the rate of 99
101 nucleotide substitution is high enough to exhibit reciprocal monophyly between island populations, which is important for establishing independence in population demography. In demographic analyses of animal populations, mitochondrial DNA has been the locus of choice mainly because the mitochondrial genome evolves quickly and does not usually recombine (Ho and Shapiro 2011). The smaller effective population size of mitochondrial markers provides resolution of demographic changes within a shorter coalescence time than nuclear markers, as showed by Bellemain et al. (2008) for one of our study species, C. flaveola. Avian blood samples were collected in the West Indies by R. E. Ricklefs and collaborators from All samples were collected and transported under the appropriate permits and licenses. Birds were sampled using standard mist net protocol, usually between April and August. A small blood sample was collected via brachial venipuncture, and all birds were released back to the wild after the procedure. Blood samples were stored at room temperature in 1 ml of Longmire s lysis buffer (Longmire et al. 1988). DNA was extracted from blood samples using sodium acetate protein precipitation followed by DNA isolation via isopropanol precipitation. Amplification of the two mitochondrial genes was done through polymerase chain reaction (PCR) in the following manner: the partial CYTB gene (850 bp) was amplified using primers L14990 (Kocher et al. 1989) and HCERC (Pil et al., Chapter 1). The partial ND2 gene was amplified using primers H6313 and L5219 (Johnson and Sorenson 1998). The two gene sequences were concatenated, and total number of base pairs (bp) varied in different species, and is specified in Results. All PCR amplifications were conducted in 25 μl total volumes using ca. 50 ng template DNA, U Taq polymerase, 2 mm of 100
102 MgCl2, 0.2 μm of each primer, 1x Buffer, and 0.8 mm of dntp. PCRs were performed with the following conditions: 94 C for 2 min (95 C for ND2) followed by 35 cycles of 94 C for 30 s (45 s for ND2), 52 C for 45 s, and 72 C for 1 min, concluding with a 10- min extension at 72 C. Negative controls were included in all sets of PCR reactions to confirm absence of contaminants, and PCR products were verified by visualization on 1% TAE agarose gels stained with ethidium bromide. Sequencing reactions of forward gene direction were conducted in the Beckman Coulter Genomics facility (Danvers, MA, USA), following the manufacturer s protocol. Contigs were aligned and edited in Geneious v. 5.6 (Kearse et al. 2012). Chromatograms were checked by eye to confirm polymorphisms. Haplotype sequences were deposited in GenBank (accession numbers xxxx-xxxxx) Phylogeographic analyses Analyses were performed with the combined dataset of the two mitochondrial genes. Summary statistics were calculated using Arlequin v. 3.5 (Excoffier and Lischer 2010): number of segregating sites (S), number of haplotypes (h), haplotype diversity (hd) and nucleotide diversity (π). Relationships among and within populations of each species were inferred through Bayesian and Maximum Likelihood phylogenetic analyses and median-joining haplotype networks. Maximum Likelihood phylogenetic analyses were performed using MEGA6 (Tamura et al. 2013), using nucleotide substitution models selected for each species by jmodeltest2 v (Darriba et al. 2012; Guindon and Gascuel 2003) and outgroups (Table 2). The most likely tree was computed, and 1,000 bootstrap replicates were performed to assess support for each node. Bootstrap 101
103 values greater than 70% were considered strong support (Hillis and Bull 1993). Bayesian inference of phylogenetic analyses was done via the CIPRES Science Gateway v.3.3 (Miller, Pfeiffer, and Schwartz 2010). The analyses were implemented using BEAST v (Drummond et al. 2012), with 10 million generations sampled every 1,000 th generation. Nodes with posterior probabilities of 0.95 and higher were considered strongly supported. Trees were generated employing the nucleotide substitution model selected for each species (Table 2), and a strict molecular clock with a nucleotide substitution rate of 10-8 per site per generation (Weir and Schluter 2008). The results from the analysis were analyzed in Tracer v.1.5 for convergence and summarized in TreeAnnotator v after dropping 1,000 burn-in states. Minimum spanning haplotype networks (Bandelt, Forster, and Röhl 1999) were generated with the Network software v.4.6 (available at Levels of genetic differentiation among populations (pairwise FST) were estimated with Arlequin v. 3.5 (Excoffier and Lischer 2010), based on a distance matrix and using 1000 permutations. The phylogeographic structure was further examined with analysis of molecular variance (AMOVA) in the same software, which provided information on the proportion of total mtdna variation distributed within and among populations. Whenever the number of individuals in a population was too small (<4, see Table 1), we did not consider that population for pairwise FST and AMOVA analyses, and included them only in phylogenetic trees and haplotype networks. In some cases, populations from the continent were included in the analyses as outgroups (see Table 1) Demographic analyses 102
104 For each population, a suite of demographic measures was calculated: Tajima s D (Tajima 1989) and Fu s FS (Fu 1997), along with their level of statistical significance; and mismatch distribution (Harpending 1994) using Arlequin v. 3.5 (Excoffier and Lischer 2010). Populations that were represented by less than 10 individuals (Table 3) were not included in demographic analyses, only in phylogeographic ones. The Mismatch Distribution is a frequency graph of all pairwise differences between DNA sequences (Rogers and Harpending 1992), and includes statistics that test for sudden population expansion (sum of squared deviation [SSD] and Harpending s raggedness index [r]). Populations in long-term equilibrium exhibit multimodal distributions, whereas recently expanded populations typically exhibit a unimodal distribution. Graphs of pairwise differences were generated with R (R Core Team, 2014), using the ggplot2 package (Wickham 2009). R Scripts can be downloaded at Where relevant, the estimated number of generations since population expansion (τ, generations) was converted to the most recent time-sinceexpansion (t, years) by solving t = τ/2u (Rogers and Harpending 1992), where u is the rate of nucleotide substitution at any individual locus in the sequence. t was calculated using the Mismatch Calculator (Schenekar and Weiss 2011) available at: Nucleotide substitution rate was based on the average sequence divergence per million years of passerine birds estimated by Weir & Schluter (2008) of 2.07%. Confidence intervals of time since expansion were derived from the 2.5% and 97.5% quantiles for τ provided by Arlequin. We accepted evidence of recent population expansion only when supported by two or more demographic indicators. 103
105 To determine whether attributes of species and islands have influenced the recent demographic history of West Indian birds, we ran a general linear model relating population indices of expansion (Fu s FS and Tajima s D) to 21 islands for seven widespread species (see Table 1). Despite the different numbers of individuals sampled per population, the demographic indices were independent of sample size (D: F = 1.35, df = 1, P = 0.25; FS: F = 3.71, df = 1, P = 0.06). Therefore, all samples of widespread species were included in the model. Analyses were run using SAS v.8.12 (GLM Procedure) (Statistical Analysis System, Cary, North Carolina, USA) RESULTS We present, for each family, the summary statistics: number of haplotypes, haplotype diversity and nucleotide diversity; as well as relationship between island populations and/or species. We also describe the demographic patterns observed for each species. Appendix A, Figures S1 S9 contain the Mismatch Distribution graphs of all populations, and Appendix B, Table S1 contains all other demographic analysis results Mimidae (Margarops fuscatus) The 1,490 bp alignment of concatenated sequences of all 82 samples of pearlyeyed thrasher, M. fuscatus, resulted in 19 distinct haplotypes, diverging at 58 segregating sites, with haplotype diversity ranging from 0.54 ± 0.12 on Nevis to 0.93 ± 0.12 on Guadeloupe. Nucleotide diversity ranged from 0.03 ± 0.02 in Guadeloupe to 0.13 ± 0.07 in St. Kitts. Number of haplotypes per island population of each species was lowest in Nevis, 2, and similar in other populations, averaging 5 (Table 3). 104
106 Trees from Bayesian inference and Maximum Likelihood shared an identical topology (Fig. 2). The trees show support for four clades: 1) one consisting of the individual collected on St. Lucia; 2) another consisting of individuals collected on Guadeloupe, as well as one of the individuals collected on St. Kitts; and two others comprising haplotypes present in populations of islands from Puerto Rico to Montserrat, 3) Puerto Rico, Guana, St. Kitts, Nevis and Montserrat; and 4) Puerto Rico, Guana, Barbuda, St. Kitts, Nevis and Montserrat. The haplotype network (Fig. 3) shows the same clustering of haplotypes, although we didn t include the individual sampled in St. Lucia, because it differs by too many mutations, 34, from the other clusters. The genetic variation of pearly-eyed thrashers, calculated by an AMOVA, is evenly distributed between and within populations, occurring 55.20% within and 44.80% between. Pairwise FST values between populations varied substantially, from between St. Kitts and Puerto Rico, to between Guadeloupe and Puerto Rico (Table 4). Pairwise comparisons that included the islands of Puerto Rico and Guadeloupe yielded uniformly high values of FST. The significance values for all pairwise FST comparisons that included these two islands indicate genetic structure (P < 0.01) between them and other islands (Table 4). The islands located between Puerto Rico and Guadeloupe did not present significant genetic structure between them. None of the populations of pearly-eyed thrasher for which we had enough samples to perform demographic showed signs of population expansion (Table 3 and Appendix A, Fig. S1)
107 Parulidae ( Setophaga petechia ) The 1,506 bp alignment of concatenated sequences of all 12 populations of the yellow warbler, S. petechia, resulted in 12 distinct haplotypes, diverging at 40 segregating sites, with haplotype diversity ranging from 0 on Grand Cayman and Jamaica to 0.8 ± 0.16 in Mexico. Populations on Antigua, Montserrat and Dominica also had 0 haplotype diversity, but only two individuals were collected there; Martinique had a haplotype diversity of 1, but only two individuals were collected there, and the diversity was absolute because these two individuals had different haplotypes. Nucleotide diversity was relatively high and ranged from ± in Martinique to ± in Mexico; the number of haplotypes, on the other hand, was low even on islands for which we have better sampling numbers, like St. Kitts and Nevis (Table 3). Trees from Bayesian inference and Maximum Likelihood presented similar topologies (Fig. 4). The phylogenetic trees support three distinct clusters: 1) one with individuals from the Dominican Republic (Hispaniola), Puerto Rico, and all sampled northern Lesser Antillean islands down to Montserrat, and some individuals from Barbados; 2) another clade also including the Greater Antillean island of Puerto Rico, Grand Cayman, Jamaica and Mexico, and the southern Lesser Antillean islands of Dominica, Martinique and Barbados; and finally, 3) a clade consisting of only Mexican yellow warblers, S. petechia bryanti (Fig. 4). According to node ages of Bayesian phylogenetic tree, the Mexican warblers diverged from West Indian ones approximately 422 kya (95% C.I. = 265, ,378). Clades 1) and 2) described above diverged approximately kya (C.I. = 47,
108 ,680). Within clade 2), the Greater Antillean islands diverged from the Lesser Antilles around 60 kya (25, ,589). In the network (Fig. 4), three clusters are evident. One similar to the clade in the tree with individuals from the Dominican Republic (Hispaniola), Puerto Rico, and all sampled northern Lesser Antillean islands down to Montserrat, and some individuals from Barbados (H_1, H_2, H_4, H_6, H_9, H_10); another with the Greater Antillean islands of Grand Cayman and Jamaica (H_7), and a separate but close Puerto Rican haplotype (H_3); and a third with the Barbuda individual, and the southern Lesser Antillean islands of Dominica, Martinique and Barbados (H_5, H_8). Most of the genetic variability is distributed among populations, 61%, with the remaining 39% distributed within populations according to the AMOVA performed. Populations of this species are highly genetically structured in the West Indies (AMOVA, P<0.001). Pairwise FST values between populations indicate genetic structure, except between St. Kitts and Nevis (0.019), and Puerto Rico and Nevis (0) (Table 5). Populations on St Kitts and Nevis were the only ones with sufficient sample size for demographic analyses. St. Kitts showed no genetic variability while Nevis presents signs of past demographic expansion (Table 3). Mismatch graphs show a unimodal distribution indicative of population demographic expansion in this population (Table 3 and Appendix A, Fig. S2). Time since last expansion calculated from the τ value indicates that the sudden expansion occurred ca. 97 kya (C.I. = ) (Table 3). In Nevis, Tajima s D and Fu s FS corroborate a scenario of population expansion, although not significantly for Fu s FS (P<0.05) (Table 3)
109 Thraupidae Coereba flaveola Detailed phylogeography and demographic history of the bananaquit, C. flaveola, can also be found in one of our previous papers, Pil et al. (Chapter 1). The concatenated mitochondrial alignment was 1,250 bp long and revealed 101 unique haplotypes with polymorphisms at 231 segregating sites. The number of haplotypes varied between island populations, from 2 on Little Cayman and Guana to 17 at the El Yunque site in Puerto Rico (Table 3). Haplotype diversity ranged from 0.14 ± 0.08 (Guana, British Virgin Islands and Little Cayman) to 0.95 ± 0.02 (Jamaica) in the Greater Antilles, and from 0.53 (Dominica and Barbados) to 0.95 ± 0.02 (Grenada) in the Lesser Antilles (Table 3). Nucleotide diversity was lowest in the Cayman Islands ( ± on Little Cayman; Table 3). Phylogenetic trees comprise six major clades: Bahamas; Greater Antilles (except Puerto Rico and British Virgin Islands); Puerto Rico, British Virgin Islands (represented here by Guana) and the northern Lesser Antilles; St. Vincent and Grenada; and continental populations, represented here by Trinidad and Venezuela (Fig. 5). Haplotypes from the island of Barbados comprise a monophyletic clade, which is not strongly supported in its own right but clearly falls within the northern Lesser Antilles populations (Fig. 5). The southernmost Lesser Antillean islands of St. Vincent and Grenada also form a distinct and well-supported clade that is sister to the rest of the Lesser Antillean islands. Based on node ages inferred from Bayesian tree, the Bahamas clade and the rest of West Indian island populations diverged approximately 3.7 million years ago (mya, C.I. = 3 4); the Greater Antilles minus Puerto Rico and Guana diverged from the Lesser 108
110 Antilles around 3 mya (C.I. = ); Puerto Rico diverged from the Lesser Antilles about 976 kya (C.I. = ); and the northern Lesser Antilles (south to St. Lucia) diverged from southern Lesser Antilles (St. Vincent and Grenada) about 678 kya (C.I. = ). Haplotypes were not shared between populations of bananaquits on the Greater Antillean and Lesser Antillean islands, except for the island of Guana, where the bananaquit population shares one haplotype with all islands north of St. Vincent in the Lesser Antilles and none with nearby Puerto Rico or other islands in the Greater Antilles. Greater Antillean islands also shared few haplotypes between islands, whereas haplotypes were broadly shared across the Lesser Antilles, especially from the northern islands, south to St. Lucia. The southernmost islands of the Lesser Antilles, St. Vincent and Grenada, share two haplotypes with each other, but none with the other Lesser Antillean islands. Haplotype distributions of the Lesser Antilles, including Guana to the north, are summarized as a median joining network in Fig. 5. This haplotype network is dominated by one haplotype that occurs on northern Lesser Antillean islands including Guana, south to St. Lucia, and additionally, has a cluster of individuals from Barbados, and separately, a cluster of individuals from St. Vincent and Grenada (Fig. 5). Strong genetic structure was detected between islands of the archipelago (overall FST = 0.94, P < 0.001)). AMOVA indicated that 94% of the genetic variation occurs among populations, with only 6% within populations. Pairwise FST confirmed high levels of genetic structure between Greater Antillean islands (0.80 < FST < 0.99), not considering the two Cayman Islands, Cayman Brac and Little Cayman, which despite being genetically structured (P < 0.05) exhibit a low fixation index (FST = 0.098) (Table 109
111 ). The two populations sampled within Puerto Rico, the southwestern Guanica Forest (GF) and the northeastern El Yunque (EY) location, are also genetically structured according to FST (P = 0.02), although the differentiation is minimal (FST = 0.04, Table 3). Demographic analyses of bananaquit populations on the West Indies reveal a variety of patterns (Table 3 and Appendix A, Figs. S3 and S4). Populations of bananaquits in the Bahamas and the western Greater Antillean islands (Jamaica, Cayman Brac and Little Cayman) show signs of long term stability, whereas eastern Greater Antillean populations in the Dominican Republic (Hispaniola) and Puerto Rico (Guanica Forest and El Yunque) show clear signs of expansion in all analyses (Table 3). In the Lesser Antilles, only the populations on St. Martin, Martinique and the southernmost St. Vincent and Grenada lack support for demographic expansion (Table 3 and Appendix A, Fig. S3). Therefore, our analyses suggest that the bananaquit has stable populations both in west Greater Antilles and southernmost Lesser Antilles, but shows clear evidence of expansion on Hispaniola, Puerto Rico, and the northern Lesser Antilles. Trinidad, which is considered here as a continental population because of its size, and its proximity and recent land connection to Venezuela, also showed evidence of population expansion (Table 3). Estimated expansion times of island populations dates are 54 kya [Dominican Republic and Guanica Forest], 29 kya [El Yunque] and kya [Dominica, Guadeloupe] in the northern LA island populations. The youngest evident population expansions are Trinidad (17 kya) followed by Barbados (24 kya) (Table 3)
112 Loxigilla spp. Detailed phylogeography and demographic history of the bullfinches, Loxigilla spp., can also be found in one of our previous papers, Pil et al. (Chapter 2). The 1,479 bp-long alignment of concatenated sequences of all 247 samples for the three species of Loxigilla resulted in 68 distinct haplotypes, diverging at 176 segregating sites, with haplotype diversity ranging from 0.39 ± 0.14 on St. Vincent to 0.96 ± 0.04 on Martinique. Overall, nucleotide diversity was low, ranging from ± on Antigua to ± at El Yunque, Puerto Rico (Table 3). Number of haplotypes per island population of each species was similar: 10 in L. barbadensis, an average of 6 in L. noctis, and 7 in L. portoricensis (Table 3). Bayesian inference and Maximum Likelihood presented similar topologies (Fig. 6). These support species monophyly for Loxigilla portoricensis and L. noctis; L. barbadensis is embedded within L. noctis, although its precise placement lacks support (Fig. 6 and 7). In both topologies, the L. barbadensis clade has strong support. Figure 7 shows the Bayesian tree for just Loxigilla noctis, which encompasses three clades consistent with the grouping found in the haplotype network. These clades partially overlap geographically: one extends through island populations from St. Kitts/Nevis south to Martinique; the second includes individuals from Martinique south to Grenada; and the third is restricted to individuals from St. Vincent and Grenada, apart from the L. barbadensis clade (Fig. 7). Most of the relationships between L. noctis haplotypes did not receive strong statistical support and short inter-nodes characterized most of the branches among these lineages. 111
113 Estimated node ages in the Bayesian tree suggest that the basal split between L. portoricencis and the ancestor of L. noctis and L. barbadensis occurred ca. 9.5 mya (C.I. = 7 12). The basal divergence of contemporary haplotypes within the L. portoricensis clade is approximately 196 kya (C.I. = ); L. noctis haplotypes coalesced around 534 kya (C.I. = ), and L. barbadensis haplotypes coalesced approximately 158 kya (C.I. = ). Both northern (Dominica north) and southern (Martinique south) radiations of L. noctis coalesce to approximately the same time: 410 kya in the south (C.I. = ) and 375 kya in the north (C.I. = ). The divergence between L. barbadensis and L. noctis took place around 345 kya (C.I. = ). The median-joining haplotype network including L. noctis populations and L. barbadensis (Fig. 7) provides a clear picture of L. barbadensis genetic isolation. Over all the samples for L. noctis and L. barbadensis, the haplotype network distinguishes four groups: 1) the northern Lesser Antillean islands from St. Kitts to Martinique, 2) Martinique to Grenada, 3) St. Vincent and Grenada, and 4) L. barbadensis. Separate from these four groups are two haplotypes, one representing three individuals from Barbuda and from the other, one individual from Guadeloupe. Bullfinches show extensive intraspecific mitochondrial diversity. AMOVA indicated a high degree of population structure between L. noctis populations: 68% of the genetic variation occurs among populations, and 32% within populations. Pairwise FST values between populations of L. noctis varied substantially, from 0.02 between St. Kitts and Nevis, to 0.91 between St. Vincent and Antigua, but most values exceeded 0.2 (Table 7). The significance values for all FST comparisons indicate genetic structure (P < 0.01) 112
114 except between the pair of populations on Dominica and Guadeloupe, and the pair on St. Kitts and Nevis (Table 7). Only two populations show consistent indications of demographic expansion from all indices: the endemic L. barbadensis on BA, and L. noctis on St. Vincent (Table 3). Mismatch graphs show a unimodal distribution indicative of population demographic expansion for L. barbadensis, and the L. noctis populations in St. Vincent (Appendix A, Fig. S5 and S6). Time since last expansion calculated from τ values indicate that the sudden expansion occurred ca. 58 kya (97.5% CI = 28 94) in the L. barbadensis population, and ca. 98 kya (C.I. = 0 116) in the St. Vincent population (Table 3). Tajima s D and Fu s FS corroborate a scenario of population expansion in L. barbadensis, although only significantly for FS (P<0.05). The only other population that presents a significant negative value of Fu s FS is L. noctis on St. Vincent (Table 3) Tiaris bicolor The concatenated mitochondrial alignment of the 275 grassquit samples was 1,344 bp long, and revealed 59 unique haplotypes with polymorphisms at 56 segregating sites. Haplotype diversity ranged from 0.25 ± 0.18 in Martinique to 1 in the Dominican Republic and in El Yunque, Puerto Rico, although these two islands have a low sample size of 4 and 5, respectively. Nucleotide diversity was lowest in Montserrat ( / ) and highest in the Dominican Republic ( / ). The number of haplotypes was generally low, where several islands presented only 2 haplotypes, even where sampling was reasonably good, in Montserrat, Barbuda, Martinique, and Grenada. It was highest in St. Vincent, which presented 13 haplotypes (Table 3). 113
115 Bayesian inference and Maximum Likelihood shared similar topologies (Fig. 8). Both showed lack of support for most clades. There was support, however, for a group of individuals from St. Vincent, who formed a clade sister to the rest of the West Indian populations, which form a large group with no support in the tree (Fig. 8). Within this unsupported group, the Greater Antillean islands form a distinct clade separate from the Lesser Antillean islands, except Barbados, which was embedded within this Greater Antillean clade. However, even though both trees show support for the Barbados clade, there was none for the Greater Antillean one. Furthermore, other individuals from Barbados fall outside the well-supported clade. Individuals from Venezuela form a wellsupported clade sister to the Greater Antillean group. A few individuals from the Guanica Forest, in Puerto Rico, also form a well-supported clade. Estimated node ages in the Bayesian tree suggest that the split between the clade of T. bicolor individuals from St. Vincent and the rest of the populations is 525,410 years old (C.I. = 299, ,375). The St. Vincent clade itself is around 250,636 years old (C.I. = 60, ,590). The Puerto Rico clade, for which there is also support, is estimated to be 63,663 years old (C.I. = 11, ,524), and the Barbados one, approximately 73,676 (C.I. = 10, ,050). Haplotype distributions of the grassquit populations are summarized as a median joining network in Fig. 9. This haplotype network is dominated by one haplotype (H_18) that occurs on all islands, except Jamaica and Dominican Republic. Many island populations additionally have private haplotypes that differ from the most common haplotype by a single mutation (e.g., H_20, H_21, H_40, H_42). On the other hand, other haplotypes occur on multiple islands instead of being restricted to a single one (e.g., 114
116 H_22, H_29, H_33, H_44). Another conspicuous characteristic of this network is the presence of several haplotypes from the St. Vincent population that differ considerably from the other haplotypes (i.e. H_50, 51, 52, 56) by several mutations. The haplotypes from the Jamaican and Hispaniola populations cluster together, also with haplotypes from Barbados. The percentage of genetic variation of grassquits in the West Indies, calculated by an AMOVA, is allocated mostly within populations, 73.34% against 26.66% between. Strong genetic structure was detected between islands of the archipelago (overall FST = 0.266, P < 0.001). Pairwise FST values between populations of grassquits varied substantially, from between Dominican Republic and Barbuda, to 0 between islands of the Lesser Antilles (Table 8). Pairwise FST values, which indicate genetic structure or the lack thereof between populations, agree with the scenario of population clustering described in the haplotype network. The values show there is no genetic structure between the populations of grassquit in Jamaica and the Dominican Republic, in the island of Hispaniola (FST = 0.12, P>0.05), but there are uniformly high degrees of genetic structure between these islands and all others sampled in the archipelago (0.368< FST >0.653, P<0.05). The two populations sampled within Puerto Rico, the southwestern Guanica Forest and the northeastern El Yunque location, are not genetically structured (FST = 0, P>0.05). The Guanica Forest population is genetically distinct from almost all other populations sampled, except Dominica and Martinique, in the Lesser Antilles. Lesser Antillean islands show a pattern of high similarity amongst each other (0 < FST < 0.539), where most pairwise values are not significant (P>0.05) (Table 8). The southernmost islands of 115
117 Grenada and Barbados in the Lesser Antilles, on the other hand, are genetically structured with most other islands, indicating a break in gene flow between these islands and the one northwards (Table 8). The populations on Antigua, Nevis and the Guanica Forest, in Puerto Rico, are the only ones that showed consistent indications of demographic expansion (Table 3 and Appendix A, Fig. S8). Based on the τ value from the mismatch distribution analyses, the expansion occurred around 79 kya (97.5% CI = 0 116,096) in Antigua, around 34 kya (0 72,931) in Nevis, and approximately 70 kya (2, ,958) in Puerto Rico (Table 3). Appendix A, Figure S7 contains the Mismatch Distribution graphs of all populations Tyrannidae (1 species, Elaenia martinica) Elaenia martinica The concatenated mitochondrial alignment of the 127 samples of Caribbean elaenia was 1,441 bp long and revealed 28 unique haplotypes with polymorphisms at 54 segregating sites. The number of haplotypes varied between island populations, from 1 on Barbuda, Guana and Little Cayman to 5 on Dominica, Martinique and Nevis. Haplotype diversity ranged from 0, where we found only 1 haplotype (Barbuda, Guana and Little Cayman) to (Dominica and Guadeloupe), not considering Antigua, where haplotype diversity was 1 because we sampled only 2 individuals with different haplotypes. Nucleotide diversity was lowest where we found only 1 haplotype (Barbuda, Guana and Little Cayman), and as high as / in Guadeloupe (Table 3). 116
118 Phylogenetic analyses conducted with Bayesian inference and Maximum Likelihood agree with support for the same major clades. The Greater Antillean population in Little Cayman forms a well-supported clade sister to the Lesser Antillean population, within which there is a well-supported clade of all individuals from St. Vincent, sister to a clade of the Barbados and Guadeloupe population and the rest of the Lesser Antilles. Individuals from the Puerto Rican population (Guanica Forest, GF) are embedded within the Lesser Antillean clade (Fig. 10). Node ages on Bayesian tree indicate the split between E. flavogaster and E. martinica is approximately 8.5 million years (C.I. = 6,708,316 10,793,954). Within E. martinica, the Little Cayman clade and the rest of the Caribbean elaenia populations diverged about 948 kya (C.I. = 616,700 1,329,400). The Saint Vincent clade diverged from all other Lesser Antilles plus Puerto Rico about 303 kya (C.I. = 172, ,161). Within the Lesser Antillean clade is Barbados, which coalesced about 60 kya (C.I. = 13,208 78,024). Haplotype network shows the geographical distribution of haplotypes on populations of Caribbean elania (Fig. 11). Haplotypes were not shared between the Greater Antillean populations of Caribbean elanias on the Cayman Islands (Cayman Brac and Little Cayman) and population on other islands. The other Greater Antillean population, on Puerto Rico, shared haplotypes with Lesser Antillean islands. The haplotypes on Barbados form a distinct cluster, and shares one of the haplotypes with an individual from Guadeloupe. The population on St. Vincent also forms a distinct cluster (Fig. 11). 117
119 Strong genetic structure was detected between islands of the archipelago (overall FST = 0.90, P < 0.001). AMOVA indicated that 90% of the genetic variation occurs among populations, with only 10% within populations. Pairwise FST confirmed high levels of gene flow between the two islands in the Cayman group, Cayman Brac and Little Cayman (FST = 0, P<0.001). Most of the populations within Lesser Antilles are also genetically structured (Table 9). Demographic analyses of Caribbean elaenia populations in the West Indies reveal no signs of expansion on any population (Table 3 and Appendix A, Fig. S8 for mismatch distribution graphs) Vireonidae (1 species, Vireo altiloquus) The concatenated mitochondrial alignment of the 107 samples of black-whiskered vireos was 1,230 bp long and revealed 41 unique haplotypes with polymorphisms at 94 segregating sites. The number of haplotypes varied between island populations, from 2 on Antigua and Montserrat to 13 on St. Lucia. Haplotype diversity was high, ranging from / on St. Kitts to 1 on Grenada and Martinique, where we found different haplotypes in all samples collected. Nucleotide diversity was lowest in St. Kitts ( / ), and as high as / on Grenada (Table 3). Bayesian inference and Maximum Likelihood trees agree with the same wellsupported clades, separating black-whiskered vireos in the West Indies into two main clades, 1) one that includes populations from all Greater Antillean islands and a few individuals from Lesser Antillean populations and 2) another with Lesser Antillean 118
120 populations and one individual from Puerto Rico. Within clade (1), there is one wellsupported clade with the Greater Antillean populations from Puerto Rico and Little Cayman, sister to an individual from Barbados. This clade is sister to a clade consisting of haplotypes of vireos from Saint Vincent and Grenada, in one cluster, and an individual from Martinique. Within clade (2), are the populations from the Lesser Antillean islands of Montserrat, Barbuda, Antigua, one individual from Grenada, and several from Barbados, sister to a group of individuals from Saint Kitts and Nevis and one individual from Antigua (Fig. 12). Estimated node ages in the Bayesian tree suggest that the split between clades (1) and (2) is approximately 2.3 million years old (C.I. = 1.6 3). Clade (1), which includes the Greater Antillean islands and the southernmost islands of Martinique, St. Vincent and Grenada, is around 1.2 million years old (C.I. = 802, ). Within it, the St. Vincent, Grenada and Martinique clade is approximately 764 thousand years old (C.I. = 442 1,033,660), and the St. Vincent and Grenada group is around 16 thousand years old. Clade (2), which includes the Lesser Antillean islands and a Puerto Rican individual, is around 622 thousand years old (C.I. = ). Within it, the Lesser Antillean group is around 301 thousand years old (C.I. = ). Haplotype distributions of the Lesser Antillean black-whiskered vireo populations are summarized as a median joining network in Fig. 13. This haplotype network is dominated by two haplotypes (H_1 H_5) that together occur on all Lesser Antillean islands. The populations on Martinique, St. Lucia and Barbados have many private haplotypes that are unique to that island (e.g. H_7 H_9 (MA), H_20 H_29 (SL), H_11 H_17 (BA). The populations on St. Vincent and Grenada are not present in this network 119
121 because they cluster with Greater Antillean populations that are too many mutations different from the other Lesser Antillean populations. There is, however, one haplotype, from an individual captured in Grenada (H_30), which is more closely related to other Lesser Antillean islands. The percentage of genetic variation of black-whiskered vireos in the West Indies, calculated by AMOVA, is allocated mostly among populations, 76.63%, against 23.37% within. Strong genetic structure was detected between islands of the archipelago (overall FST = 0.766, P < 0.001). Pairwise FST values between populations varied substantially. The populations on El Yunque, in Puerto Rico, and the one on St. Vincent are highly structured in comparison to all other populations (0.651 < pairwise FST > 0.980, P<0.05). Pairwise values between Lesser Antillean populations also showed presence of genetic structure, but in lower degrees (0 < FST > 0.677), and a few pairs of populations are not structured (St. Kitts Nevis, Barbados Antigua, Martinique, St. Lucia) (Table 10). The populations on Barbados and St. Kitts are the only ones that showed consistent indications of demographic expansion (Table 3 and Appendix A, Fig. S7). Based on the τ value from the mismatch distribution analyses, the expansion occurred around 24 kya (97.5% CI = 0 48,544) in St. Kitts, and approximately 131 kya (53, ,894) in Barbados (Table 3). Appendix A, Figure S9 contains the Mismatch Distribution graphs of all populations
122 Effect of island and species on demographic patterns Island identity did not influence either demographic index: D (df = 20, F = 4.16, P = 0.07) or FS (df = 20, F = 1.25, P = 0.24). However, both these indices varied significantly among species: D (df = 6, F = 4.16, P = 0.001) and FS (df = 6, F = 5.04, P = ). The species influence on demographic parameters is mainly driven by C. flaveola, which has more populations with lower values of D and FS (Table 11; Appendix A, Figs. S10 and S11) DISCUSSION Phylogeographic patterns Phylogeographic data exhibit three prominent patterns: 1) populations on Greater Antillean islands are mainly distinct from Lesser Antillean ones, 2) populations on Barbados are usually monophyletic or distinct from populations on other Lesser Antillean islands, and 3) many species have a phylogeographic break between northern and southern Lesser Antillean islands (mainly between St. Lucia and St. Vincent). We discuss these three points in more detail separately Phylogeographic patterns on Greater Antillean islands In the six widespread species sampled in our study, only two showed no phylogeographic distinction between Greater and Lesser Antillean island populations, M. fuscatus and S. petechia. The other four species populations present differentiation of 121
123 Greater Antillean islands of different degrees. Unlike many other widespread avian species in the West Indies archipelago (Ricklefs and Cox 1972, Ricklefs and Bermingham 2007, Ricklefs 2010), S. petechia doesn t show a stepping-stone colonization model, having colonized the archipelago at least twice from different sources, South and Central America (Klein et al. 1994). The West Indian mimids, on the other hand, including M. fuscatus, are an example of indigenous radiation (Hunt et al. 2001), where gene flow between Puerto Rico in the Greater Antilles and Lesser Antillean islands still occurs. The Greater Antilles is composed of mainly large, mountainous, old islands with a complex geological origin (Iturralde-Vinent 2006; Iturralde-Vinent and MacPhee 1999). Iturralde-Vinent (2006) suggests the proto-greater Antilles first emerged as separate fragments and that each of the major Greater Antillean islands consists of several fragments, with some parts having been connected in the past. However, the connectivity of the major Greater Antillean islands, such as that between Hispaniola and Jamaica, ended with the dissipation of the GAARlandia (Greater Antilles + Aves Ridge), around million years ago. Therefore, these geological events would have no influence in the patterns of affinity between islands among contemporary bird species, such as found in C. flaveola and T. bicolor. The Cayman Islands, too, are old, low-lying, mainly sedimentary islands that have probably never been connected to the Greater Antilles (Iturralde-Vinent and MacPhee 1999). Therefore, haplotype sharing between the Cayman Islands and Jamaica found in E. martinica is likely due to overwater dispersal. In general, we found that populations on the Greater Antilles were genetically 122
124 structured among islands, and also were genetically distinct from populations in the Lesser Antilles, except for Puerto Rico and Guana, in the British Virgin Islands, which, in several species, had extensive haplotype sharing with populations on the Lesser Antillean islands, such as with E. martinica, M. fuscatus, S. petechia, and T. bicolor (see phylogenetic trees). In fact, populations on Guana of C. flaveola are more genetically similar to populations in the Lesser Antilles than to birds on Puerto Rico (Pil et al. Chapter 1), despite Guana having been connected to Puerto Rico when sea levels were lower during the Last Glacial Period (Iturralde-Vinent and MacPhee 1999). The distinction of Greater Antillean island populations is not surprising given the high number of avian species endemics in these islands (Dalsgaard et al. 2014), which is often the result of population isolation and differentiation Phylogeographic breaks in Lesser Antilles We considered the phylogeography of seven wide-spread species in the Lesser Antilles, C. flaveola, E. martinica, L. noctis, M. fuscatus, S. petechia, T. bicolor and V. altiloquus. We found phylogeographic breaks between the islands of St. Lucia and St. Vincent for four of these species, spanning a mean divergence time frame between 303 to 764 thousand years (Table 12, Fig. S12). Loxigilla noctis show a phylogeographic break between Dominica and Martinique. The two other widespread species, M. fuscatus and S. petechia, also show evidence of a phylogeographic break between northern and southern Lesser Antillean islands (Guadeloupe/St. Lucia and Martinique/Dominica, respectively), but we don t have samples from islands between breaks to determine the exact location. The heterogeneity in the location of these breaks, where most are located between St. 123
125 Lucia and St. Vincent was confirmed by a G-test (G = 9.25, df = 3, P=0.02). The phylogeographic breaks found here are also highly correlated with high values of pairwise FST values for these species (non-parametric one-way ANOVA, F = 3.49, df = 3, P = 0.04). When comparing the level of genetic differentiation (pairwise FST) of populations in adjacent islands between Guadeloupe and St. Vincent, one is more likely to also find a phylogeographic break between islands where populations have high levels of genetic differentiation. Other species of birds also show genetic disjunctions between northern and southern islands of the Lesser Antilles: the forest thrush, Cichlherminia lherminieri (between Guadeloupe/Dominica) (Arnoux et al. 2014); the scaly-breasted thrasher Margarops fuscus (Dominica/Martinique); the rufous-throated solitaire, Myadestes genibarbis (Dominica/Martinique); the Lesser Antillean flycatcher, Myiarchus oberi (Dominica/Martinique); and the Lesser Antillean saltator, Saltator albicollis (Dominica/Martinique) (Ricklefs and Bermingham 2001, Ricklefs and Bermingham 2007) (Table 12). Additionally, a phylogeographic break between northern and southern Lesser Antillean islands has been found for several other organisms, such as the Dryas iulias butterfly (St. Lucia/St. Vincent) (Davies and Bermingham 2002), the Eleutherodactylus frog (St. Lucia/St. Vincent) (Kaiser, Green, and Schmid 1994), Anolis lizards (Dominica/Martinique) (Schneider, Losos, and de Queiroz 2001), and the gecko Sphaerodactylus vincenti (Dominica/Martinique) (Surget-Groba and Thorpe 2012). Even though most of phylogeographic breaks in these species occur either between Dominica and Martinique or between St. Lucia and St. Vincent, there is no apparent reason for a phylogeographic break in these specific locations. The islands 124
126 between Guadeloupe and St. Vincent reside within a part of the archipelago where islands have always been isolated and never have had contact with other islands, even when sea levels were as much as 120 meters lower than at present about 26,000 years ago (Fairbanks 1989) during the Last Glacial Period. A bathymetric map of the Lesser Antilles shows how islands would have been connected when sea levels were 100 m below current level (Fig. 14); islands from St. Lucia north to Guadeloupe are separated by deep-water channels. Thus, even though phylogeographic breaks are all situated between deep-sea channels, there is no physical features between Dominica and Martinique, or between St. Lucia and St. Vincent, would create a bigger barrier to avian dispersal than between any of the other islands in that region. Islands between Guadeloupe and St. Vincent along the Lesser Antillean volcanic arc are also similar in habitat and elevation (Ricklefs and Lovette 1999). Although volcanic activity continues to affect its current avifauna, this probably has a minimal effect on species communities in general (Dalsgaard et al. 2007). With respect to variation in the propensity of avian lineages to diversify in different archipelagoes, Ricklefs and Bermingham (2007) suggested that secondary sympatry of divergent genetic lineages in the Lesser Antilles might be constrained by island host-specific pathogens that prevent co-occurrence of allopatric divergent populations. The inability of divergent populations of the same species to support between-island migration might have a similar basis, although we have no information on endemic pathogens that might prevent the mixing of island populations of hosts, or an explanation for why phylogeographic breaks and reduced gene flow should occur between particular pairs of islands in a variety of different species. 125
127 Genetic distinctiveness in Barbados Populations of most species of birds on Barbados show a high degree of mitochondrial distinctiveness. We have samples for six species from Barbados (C. flaveola, E. martinica, L. noctis, S. petechia, T. bicolor and V. altiloquus). Of these, three have monophyletic populations in Barbados, which share no haplotypes with other Lesser Antillean populations: C. flaveola; L. noctis, which is considered a different species (L. barbadensis), although we find evidence of low genetic divergence between them (Pil & Ricklefs, Chapter 2); and E. martinica. The sampled population of T. bicolor in Barbados forms a distinct cluster as evidenced in the species haplotype network and phylogenetic tree, but there is also evidence of admixture with other populations, mainly due to a dominant haplotype that occurs on all islands sampled. Only for the two other species, V. altiloquus and S. petechia, there is no evidence of complete distinctiveness of Barbados haplotypes. Even though the only endemic bird species in Barbados is L. barbadensis, the genetic distinctiveness of avian populations in Barbados has also been reported by Monceau et al. (2013) with respect to the Zenaida dove (Zenaida aurita), and Lovette et al. (1999) with respect to T. bicolor and Columbina passerina. Further evidence of Barbados distinctiveness is seen in the sexual monomorphy of Lesser Antillean bullfinches, L. barbadensis, which are sexually dimorphic everywhere else in the archipelago (P. A. Buckley and Buckley 2004). This distinctiveness of Barbados populations makes sense in the light of the different geological isolation and timing of the island s uplift. The island is much younger than other Lesser Antillean islands (~700,000 years) and is not volcanic. In its 126
128 early history, the island was formed by a combination of coral reefs and low-lying small islands, which were periodically rebuilt because of sea-level changes that eroded and submerged some of their area (Mesolella 1967). Barbados sits 150 km east of the main Windward Islands, outside of the trade winds circulation. Also, unlike the volcanic Antillean-arc islands, vegetation in Barbados is typical of dry environments and lacks moist forest (P. A. Buckley and Buckley 2004). All these differences might play a role in the genetic distinctiveness of Barbados, colonization time on Barbados must have been later than in older Lesser Antillean islands, and gene flow between this island and others might be suppressed by the distance between them Demographic patterns Demographic analyses reveal a variety of patterns in the archipelago. Because island identity is not predictive of demographic state, it is unlikely that island-specific factors affecting several populations on a given island are influencing population demography. Such factors might include localized influences, such as hurricanes or volcanic eruptions, or the localized emergence of diseases or introduction of predators with broad host effects. In our analysis, demographic patterns of individual island populations varied significantly among species. Fahey et al. (2012) also found contrasting patters of demographic history in bird species in Hispaniola; most of the resident species showed signs of stable populations (Elaenia fallax, Loxigilla violacea, Myiarchus stolidus, Turdus plumbeus, Microligea palustris, Phaenicophilus palmarum and Spindalis 127
129 dominicensis), while three species (Coereba flaveola, Columbina passerine and Todus subulatus) exhibited indications of recent population expansion. In our study, heterogeneity among species resulted from expansion of populations of the bananaquit Coereba flaveola on most islands. In particular, the genetic uniformity of populations from St. Lucia north through the Virgin Islands suggests a recent geographic expansion of that population within the northern Lesser Antilles, which is reflected in local demographic signatures of expansion from recent colonization, i.e., founder effects. Species populations have a cyclic nature in the West Indies, as shown for several species (Ricklefs and Cox 1972; Ricklefs and Cox 1978; Ricklefs and Bermingham 1999), including the bananaquit (Coereba flaveola, Pil et al. Chapter 1). Populations expand and contract over the geography of the archipelago, which undoubtedly creates a signal in the demographic history of individual island populations. The causes of taxon cycles are unknown, however the idiosyncratic nature of distribution and phylogeography suggests that the stages of expansion and contraction that species go through might be associated to co-evolutionary relations with specialized predators, parasites, and competitors (Ricklefs and Bermingham 2002) CONCLUSIONS Several common patterns were revealed in the phylogeography and historical demography of the West Indies avifauna; populations on larger Greater Antillean islands are generally distinct from those on the smaller Lesser Antilles; a common phylogeographic break exists between northern and southern Lesser Antilles, particularly 128
130 between the islands of St. Lucia and St. Vincent; populations on Barbados are genetically distinct; and demographic trends are not predicted by island identity, and species vary in the way they behave demographically within the same island. While this study provides important insights into the patterns of phylogeography and historical demography found in avian species in the West Indies, further investigation into factors that govern the common patterns found here are warranted for a better understanding of the extrinsic and intrinsic influences on the evolution of island biota REFERENCES Arnoux, E, C Eraud, N Navarro, C Tougard, A Thomas, F Cavallo, N Vetter, B Faivre, and S Garnier Morphology and Genetics Reveal an Intriguing Pattern of Differentiation at a Very Small Geographic Scale in a Bird Species, the Forest Thrush Turdus Lherminieri. Heredity, Avise, J C Phylogeography: the History and Formation of Species. Harvard University Press. Bandelt, H J, P Forster, and A Röhl Median-Joining Networks for Inferring Intraspecific Phylogenies Molecular Biology and Evolution 16 (1): Bellemain, E, E Bermingham, and R E Ricklefs The Dynamic Evolutionary History of the Bananaquit (Coereba Flaveola) in the Caribbean Revealed by a Multigene Analysis. BMC Evolutionary Biology 8: 240. Buckley, P A, and F G Buckley Rapid Speciation by a Lesser Antillean Endemic, Barbados Bullfinch Loxigilla Barbadensis. Bulletin of the British Ornithologists Club 124 (2):
131 Curtis, J H, M B, and D A Hodell Climate Change in the Circum Caribbean Late Pleistocene to Present and Implications for Regional Biogeography. In Biogeography of the West Indies: Patterns and Perspectives, edited by C A Woods and F E Sergile, Boca Raton, FL: CRC Press. Dalsgaard, B, G M Hilton, G A L Gray, L Aymer, J Boatswain, J Daley, C Fenton, et al Impacts of a Volcanic Eruption on the Forest Bird Community of Montserrat, Lesser Antilles. Ibis 149 (2): Darriba, D, G L Taboada, R Doallo, and D Posada jmodeltest 2: More Models, New Heuristics and Parallel Computing. Nature Methods 9 (8): Davies, N, and E Bermingham The Historical Biogeography of Two Caribbean Butterflies (Lepidoptera: Heliconiidae) as Inferred From Genetic Variation at Multiple Loci. Evolution; International Journal of Organic Evolution 56 (3): Drummond, A J, M A Suchard, D Xie, and A Rambaut Bayesian Phylogenetics with BEAUti and the BEAST 1.7. Molecular Biology and Evolution 29 (8): Excoffier, L, and H E L Lischer Arlequin Suite Ver 3.5: a New Series of Programs to Perform Population Genetics Analyses Under Linux and Windows. Molecular Ecology Resources 10 (3): Fahey, A L, R E Ricklefs, S C Latta, and J A DeWoody Comparative Historical Demography of Migratory and Nonmigratory Birds From the Caribbean Island of Hispaniola. Evolutionary Biology 39: Fairbanks, R G A 17,000-Year Glacio-Eustatic Sea Level Record: Influence of 130
132 Glacial Melting Rates on the Younger Dryas Event and Deep-Ocean Circulation. Nature 342: Fu, Y X Statistical Tests of Neutrality of Mutations Against Population Growth, Hitchhiking and Background Selection. Genetics 147 (2): Guindon, S, and O Gascuel A Simple, Fast, and Accurate Algorithm to Estimate Large Phylogenies by Maximum Likelihood. Systematic Biology 52 (5). Oxford University Press: Harpending, H C Signature of Ancient Population Growth in a Low-Resolution Mitochondrial DNA Mismatch Distribution. Human Biology 66 (4): Hickerson, M J, B C Carstens, J Cavender-Bares, K A Crandall, C H Graham, J B Johnson, L Rissler, P F Victoriano, and A D Yoder Phylogeography s Past, Present, and Future: 10 Years After Avise, Molecular Phylogenetics and Evolution 54 (1): Hillis, D M, and J J Bull An Empirical Test of Bootstrapping as a Method for Assessing Confidence in Phylogenetic Analysis. Systematic Biology 42 (2): Ho, S Y W, and B Shapiro Skyline-Plot Methods for Estimating Demographic History From Nucleotide Sequences. Molecular Ecology Resources 11 (3): Hunt, J S, E Bermingham, and R E Ricklefs Molecular Systematics and Biogeography of Antillean Thrashers, Tremblers, and Mockingbirds (Aves: Mimidae). The Auk 118 (1): Iturralde-Vinent, M A, and R D E MacPhee Paleogeography of the Caribbean Region: Implications for Cenozoic Biogeography. Bulletin of the American Museum 131
133 of Natural History, April, Iturralde-Vinent, M A Meso-Cenozoic Caribbean Paleogeography: Implications for the Historical Biogeography of the Region. International Geology Review 48 (9): Johnson, K P, and M D Sorenson Comparing Molecular Evolution in Two Mitochondrial Protein Coding Genes (Cytochrome B and ND2) in the Dabbling Ducks (Tribe: Anatini). Molecular Phylogenetics and Evolution 10 (1): Kaiser, H, D M Green, and M Schmid Systematics and Biogeography of Eastern Caribbean Frogs (Leptodactylidae: Eleutherodactylus), with the Description of a New Species From Dominica. Canadian Journal of Zoology 72 (12): Kearse, M., R Moir, A Wilson, S Stones-Havas, M Cheung, S Sturrock, S Buxton, et al Geneious Basic: an Integrated and Extendable Desktop Software Platform for the Organization and Analysis of Sequence Data. Bioinformatics 28: Klein, N K, and W M Brown Intraspecific Molecular Phylogeny in the Yellow Warbler (Dendroica Petechia), and Implications for Avian Biogeography in the West Indies. Evolution 48 (6): Kocher, T D, W K Thomas, A Meyer, S V Edwards, S Pääbo, F X Villablanca, and A C Wilson Dynamics of Mitochondrial DNA Evolution in Animals: Amplification and Sequencing with Conserved Primers.. Proceedings of the National Academy of Sciences of the United States of America 86 (16): Longmire, J L, A K Lewis, N C Brown, J M Buckingham, L M Clark, M D Jones, L J Meincke, et al Isolation and Molecular Characterization of a Highly Polymorphic Centromeric Tandem Repeat in the Family Falconidae. Genomics 2 132
134 (1): Losos, J B, and R E Ricklefs Adaptation and Diversification on Islands.. Nature 457 (7231): Lovette, I J, G Seutin, R E Ricklefs, and E Bermingham The Assembly of an Island Fauna by Natural Invasion: Sources and Temporal Patterns in the Avian Colonization of Barbados. Biological Invasions, 1 (1): Mesolella, K J Zonation of Uplifted Pleistocene Coral Reefs on Barbados, West Indies. Science 156 (3775): Miller, M A, W Pfeiffer, and T Schwartz Creating the CIPRES Science Gateway for Inference of Large Phylogenetic Trees. Gateway Computing Environments Workshop (GCE), 1 8. Monceau, K, F Cézilly, J Moreau, S Motreuil, and R Wattier Colonisation and Diversification of the Zenaida Dove (Zenaida Aurita) in the Antilles: Phylogeography, Contemporary Gene Flow and Morphological Divergence. PloS One 8 (12): e R Core Team R: A language and environment for statistical computing. R Foundation for Statistical Computing, Vienna, Austria. URL Raffaele, H A, J Wiley, O H Garrido, A Keith, and J I Raffaele Birds of the West Indies. 2nd ed. Princeton: Princeton University Press. Ricklefs, Robert E Host-Pathogen Coevolution, Secondary Sympatry and Species Diversification. Philosophical Transactions of the Royal Society B: Biological Sciences 365 (1543):
135 Ricklefs, R E, and E Bermingham Taxon Cycles in the Lesser Antillean Avifauna. Ostrich 70 (1): Ricklefs, R E, and E Bermingham Nonequilibrium Diversity Dynamics of the Lesser Antillean Avifauna. Science 294 (5546): Ricklefs, R E, and E Bermingham Application of Johnson Et Al.'S Speciation Threshold Model to Apparent Colonization Times of Island Biotas. Evolution 58 (8): Ricklefs, R E, and E Bermingham The Concept of the Taxon Cycle in Biogeography.. Global Ecology and Biogeography 11 (5): Ricklefs, R E, and E Bermingham The Causes of Evolutionary Radiations in Archipelagoes: Passerine Birds in the Lesser Antilles. The American Naturalist 169 (3): Ricklefs, R E, and G W Cox Taxon Cycles in the West Indian Avifauna. The American Naturalist 106 (948): Ricklefs, R E, and G W Cox Stage of Taxon Cycle, Habitat Distribution, and Population Density in the Avifauna of the West Indies. The American Naturalist 112 (987): Ricklefs, R E, and I J Lovette The Roles of Island Area Per Se and Habitat Diversity in the Species-Area Relationships of Four Lesser Antillean Faunal Groups. The Journal of Animal Ecology 68 (6): Rogers, A R, and H Harpending Population Growth Makes Waves in the Distribution of Pairwise Genetic Differences. Molecular Biology and Evolution 9 (3):
136 Schenekar, T, and S Weiss High Rate of Calculation Errors in Mismatch Distribution Analysis Results in Numerous False Inferences of Biological Importance. Heredity 107 (6): Schneider, C J, J B Losos, and K de Queiroz Evolutionary Relationships of the Anolis Bimaculatus Group From the Northern Lesser Antilles. Journal of Herpetology 35 (1): Surget-Groba, Y, and R S Thorpe A Likelihood Framework Analysis of an Island Radiation: Phylogeography of the Lesser Antillean Gecko Sphaerodactylus vincenti, in Comparison with the Anole Anolis Roquet. Journal of Biogeography 40 (1): Tajima, F Statistical Method for Testing the Neutral Mutation Hypothesis by DNA Polymorphism. Genetics 123 (3): Tamura, K., Stecher, G., Peterson, D., Filipski, A. & Kumar, S MEGA6: Molecular Evolutionary Genetics Analysis version 6.0. Molecular biology and evolution 30: Weir, J T, and D Schluter Calibrating the Avian Molecular Clock. Molecular Ecology 17 (10): Wickham, H Ggplot2: Elegant Graphics for Data Analysis. Springer. Woods, C A, and F E Sergile Biogeography of the West Indies
137 136 Table 1. Number of individuals collected per species in each sampled population on islands of the West Indies. Species acronyms: CFA, Coereba flaveola; TBI, Tiaris bicolor; SPE, Setophaga petechia; EMA, Elaenia martinica; LNO, Loxigilla noctis; LPO, Loxigilla portoricensis; LBA, Loxigilla barbadensis; MFT, Margarops fuscatus; VAL, Vireo altiloquus. Greyed cells are continental populations. CFA TBI SPE EMA LNO LPO LBA MFT VAL Eleuthera, Bahamas (BH) Grand Cayman (GC) Cayman Brac (CB) Little Cayman (LC) Jamaica (JA) Dominican Republic, Hispaniola (DR) Puerto Rico, El Yunque (EY) Puerto Rico, Guanica Forest (GF) Puerto Rico, Boqueron (RB) Guana, British Virgin Islands (BVI) Saint Martin (SM) Saint Kitts (SK) Nevis (NE) Barbuda (BU) Antigua (AN) Montserrat (MO) Guadeloupe (GU) Dominica (DO) Martinique (MA) Saint Lucia (SL) Barbados (BA) Saint Vincent (SV) Grenada (GD) Trinidad (TR) Mexico (MEX) Venezuela (VE) Total n
138 137 Table 2. Substitution models used for Maximum Likelihood and Bayesian phylogenetic trees, and the correspondent outgroups used for those analyses. Species Substitution model Outgroup Coereba flaveola GTR + G Loxigilla portoricensis and Melanospiza richardsoni Elaenia martinica HKY + G Elaenia flavogaster Loxigilla spp. HKY Coereba flaveola Margarops fuscatus GTR + G Cinclocerthia guturralis Setophaga petechia GTR + I S. petechia bryanti (Mexico) Tiaris bicolor HKY + G + I Melanospiza richardsoni Vireo altiloquus GTR + I + G Vireo latimeri 137
139 138 Table 3. Indices of genetic diversity for bananaquit populations: n, number of individuals sequenced; S, number of segregation sites; h, number of haplotypes; hd, haplotype diversity; and π, nucleotide diversity. Demography indicates populations that show signs of expansion (in pink) or stability (green), cells in white represent populations for which demographic analyses were not done. island species n S h hd π demography ELE CFA / / GC SPE LC EMA CFA / / CB EMA / / CFA / / JA SPE CFA / / TBI / / DR CFA / / TBI / / PR (RB) SPE / / PR (EY) VAL / / CFA / / LPO / / TBI / / PR (GF) MFT / / EMA / / CFA / / TBI / / BVI MFT / / EMA CFA / / TBI / / SM CFA / / SK MFT / / SPE EMA / / VAL / / CFA / /
140 139 LNO / / TBI / / NE MFT / / SPE / / EMA / / VAL / / CFA / / LNO / / TBI / / MO MFT / / SPE VAL / / CFA / / LNO / / TBI / / BU EMA CFA / / LNO / / TBI / / AN SPE EMA / / VAL / / CFA / / LNO / / TBI / / GU MFT / / EMA / / CFA / / LNO / / TBI / / DO SPE EMA / / CFA / / LNO / / TBI / / MA SPE / / EMA / / VAL / / CFA / / LNO / /
141 140 TBI / / SL EMA / / VAL / / CFA / / LNO / / TBI / / SV EMA / / VAL / / CFA / / LNO / / TBI / / GD VAL / / CFA / / LNO / / TBI / / BA SPE / / EMA / / VAL / / CFA / / LBA / / TBI / / TR CFA / / VE CFA / / MEX SPE / /
142 141 Table 4. Pairwise differences (FST values) between pairs of sampled island populations of Margarops fuscatus. Bold values indicate significant difference between populations (P < 0.05). Island acronyms: PR, Guanica Forest, Puerto Rico; BVI, Guana, British Virgin Islands; SK, St. Kitts; NE, Nevis; MO, Montserrat; GU, Guadeloupe. PR BVI SK NE MO GU PR - BVI SK NE MO GU
143 142 Table 5. Pairwise differences (FST values) between pairs of sampled island populations of Setophaga petechia. Bold values indicate significant difference between populations (P < 0.05). Island acronyms: CY, Grand Cayman; JA, Jamaica; PR, Boqueron, Puerto Rico; SK, St. Kitts; NE, Nevis; BA, Barbados; MEX, Mexico. CY JA PR SK NE BA MEX CY - JA PR SK NE BA MEX
144 143 Table 6. Pairwise differences (FST values) between pairs of sampled island populations of Coereba flaveola. Bold values indicate significant difference between populations (P < 0.05). Island acronyms: BH, Eleuthera, Bahamas; LC, Little Cayman; CB, Cayman Brac; JA, Jamaica; DR, Dominican Republic, Hispaniola; EY, El Yunque, Puerto Rico; GF, Guanica Forest, Puerto Rico; BVI, Guana, British Virgin Islands; SM, St. Martin; SK, St. Kitts; NE, Nevis; BU, Barbuda; AN, Antigua; MO, Montserrat; GU, Guadeloupe; DO, Dominica; MA, Martinique; SL, St. Lucia; BA, Barbados; SV, St. Vincent; GD, Grenada; TR, Trinidad; VE, Venezuela. BH LC CB JA DR EY GF BVI SM SK NE BU AN MO GU DO MA SL BA SV GD TR BH - LC CB JA DR EY GF BVI SM SK NE BU AN MO GU DO MA SL
145 144 BA SV GD TR VE
146 145 Table 7. Pairwise differences (FST values) between pairs of sampled island populations of Loxigilla noctis. Bold values indicate significant difference between populations (P < 0.05). Island acronyms: SK, St. Kitts; NE, Nevis; MO, Montserrat; BU, Barbuda; AN, Antigua; GU, Guadeloupe; DO, Dominica; MA, Martinique; SL, St. Lucia; SV, St. Vincent; GD, Grenada. SK NE MO BU AN GU DO MA SL SV SK - NE MO BU AN GU DO MA SL SV GD
147 146 Table 8. Pairwise differences (FST values) between pairs of sampled island populations of Tiaris bicolor. Bold values indicate significant difference between populations (P < 0.05). Island acronyms: JA, Jamaica; DR, Dominican Republic, Hispaniola; EY, El Yunque, Puerto Rico; GF, Guanica Forest, Puerto Rico; BVI, Guana, British Virgin Islands; NE, Nevis; SK, St. Kitts; MO, Montserrat; BU, Barbuda; AN, Antigua; GU, Guadeloupe; DO, Dominica; MA, Martinique; SL, St. Lucia; SV, St. Vincent; GD, Grenada; BA, Barbados. JA DR EY GF BVI NE SK MO BU AN GU DO MA SL SV GD BA JA - DR EY GF BVI NE SK MO BU AN GU DO MA SL SV GD BA
148 147 Table 9. Pairwise differences (FST values) between pairs of sampled island populations of Elaenia martinica. Bold values indicate significant difference between populations (P < 0.05). Island acronyms: CB, Cayman Brac; LC, Little Cayman; GF, Guanica Forest, Puerto Rico; BVI, Guana, British Virgin Islands; SK, St. Kitts; NE, Nevis; BU, Barbuda; GU, Guadeloupe; DO, Dominica; MA, Martinique; SL, St. Lucia; BA, Barbados; SV, St. Vincent. CB LC GF SK NE BU DO MA SL BA SV LC GF SK NE BU DO MA SL BA SV
149 148 Table 10. Pairwise differences (FST values) between pairs of sampled island populations of Vireo altiloquus. Bold values indicate significant difference between populations (P < 0.05). Island acronyms: EY, El Yunque, Puerto Rico; SK, St. Kitts; NE, Nevis; BU, Barbuda; AN, Antigua; MA, Martinique; SL, St. Lucia; BA, Barbados; SV, St. Vincent. EY SK NE AN MA SL BA SV EY - SK NE AN MA SL BA SV
150 149 Table 11. Generalized linear model results with multiple regression estimates, t value, and P value for each species analyzed. Fu's FS Estimate t P Intercept 0.15 ± Coereba flaveola ± Setophaga petechia 0.85 ± Elaenia martinica ± Loxigilla noctis ± Margarops fuscatus 1.79 ± Tiaris bicolor ± Vireo altiloquus... Tajima's D Intercept ± Coereba flaveola ± Setophaga petechia 0.35 ± Elaenia martinica 0.30 ± Loxigilla noctis 0.48 ± Margarops fuscatus 0.87 ± Tiaris bicolor ± Vireo altiloquus
151 150 Table 12. Phylogeographic breaks found for widespread sampled West Indian species, and time of divergence between groups of islands in thousands of years (95% confidence interval). * phylogeographic breaks detected by Ricklefs and Bermingham (2001), detected by Ricklefs and Bermingham (2007). Species Phylogeographic break between Divergence time Coereba flaveola St. Lucia - St. Vincent 678 ( ) Elaenia martinica St. Lucia - St. Vincent 303 ( ) Loxigilla noctis Dominica - Martinique 410 ( ) Tiaris bicolor St. Lucia - St. Vincent 525 ( ) Vireo altiloquus St. Lucia - St. Vincent 764 (442 1,033) Cichlherminia lherminieri* Guadeloupe - Dominica Margarops fuscus Dominica - Martinique Myadestes genibarbis Dominica - Martinique Myiarchus oberi Dominica - Martinique Saltator albicollis* Dominica - Martinique 150
152 151 FIGURE LEGENDS Figure 1. Map of the West Indies. Highlighted in the square are the Lesser Antillean Islands, out of it are the Greater Antillean Islands and the Bahamas. Longitude (long) and latitude (lat) are indicated on the x and y axes, respectively. Figure 2. Consensus phylogenetic tree of pearly-eyed thrashers, Margarops fuscatus, sampled in the West Indies. Bayesian posterior values are above branch lines of tree, and Maximum likelihood support values are below lines. Island acronyms vide Table 1. Bird illustration modified from Raffaele et al. (2010). Figure 3. Median-joining haplotype network of pearly-eyed thrashers, Margarops fuscatus. Each circle represents a different haplotype, and each open dot indicates an unsampled haplotype (mutational steps). The grey rectangles also represent mutational steps between haplotypes, but in higher number, eight in the larger rectangle, and four in the smaller one. The size of the circle corresponds to the number of individuals that share that haplotype, as per circle size legend. Each island is represented by a different color (see Legend). Haplotypes island origins: H_1: SK, PR, NE, MO, BVI; H_2: SK, NE; H_3 H_4: SK, BVI; H_5: SK, GU; H_6 H_7: GF; H_8: GF, MO, BVI, BU; H_9 H_10: GF; H_11 13: MO; H_14 H_17: GU; H_18: BVI. Figure 4. Consensus phylogenetic tree and median-joining haplotype network of yellow warblers, Setophaga petechia, sampled in the West Indies. Bayesian posterior values are above branch lines of tree, and Maximum likelihood support values are below lines. 151
153 152 Island acronyms vide Table 1. In haplotype network, each circle represents a different haplotype, and each open dot indicates an unsampled or ancestral haplotype state. The size of the circle corresponds to the number of individuals that share that haplotype, as per circle size legend. Each island is represented by a different color (see Legend). Haplotypes island origins: H_1: SK, RB, NE, AN, BA; H_2 H_3: RB; H_4: NE; H_5: NE, BA, DO, MA; H_6: MO; H_7: GC, JA; H_8: MA; H_9: DR; H_10: BU. Bird illustration modified from Raffaele et al. (2010). Figure 5. Consensus phylogenetic tree and median-joining haplotype network of bananaquits, Coereba flaveola, sampled in the West Indies. Bayesian posterior values are above branch lines of tree, and Maximum likelihood support values are below lines. In haplotype network, each circle represents a different haplotype, and each open dot indicates an unsampled or ancestral haplotype state. The size of the circle corresponds to the number of individuals that share that haplotype, as per circle size legend. Each island is represented by a different color (see Legend). Figures from Pil et al. (Chapter 1) and bird illustration modified from Raffaele et al. (2010). Figure 6. Phylogenetic tree of Loxigilla species. Upper node values represent Bayesian posterior probability, and lower node values represent Maximum Likelihood bootstrap values. Red rectangle encompasses L. noctis and the back rectangle within it, L. barbadensis. Figure from Pil & Ricklefs (Chapter 2) and bird illustration modified from Raffaele et al. (2010). 152
154 153 Figure 7. Consensus phylogenetic tree and median-joining haplotype network of Lesser Antillean bullfinches, Loxigilla noctis, sampled in the West Indies. Bayesian posterior values are above branch lines of tree, and Maximum likelihood support values are below lines. Branch tips are colored according to island where individual was collected as per legend. In haplotype network, each circle represents a different haplotype, and each open dot indicates an unsampled or ancestral haplotype state. The size of the circle corresponds to the number of individuals that share that haplotype, as per circle size legend. Each island is represented by a different color (see Legend). Figures from Pil & Ricklefs (Chapter 2). Figure 8. Consensus phylogenetic tree of grassquits, Tiaris bicolor, sampled in the West Indies. Bayesian posterior values are above branch lines of tree, and Maximum likelihood support values are below lines. Branch tips are colored according to island where individual was collected as per legend. Island acronyms vide Table 1. Bird illustration modified from Raffaele et al. (2010). Figure 9. Haplotype network of grassquit individuals, Tiaris bicolor. Each circle represents a different haplotype, and each open dot indicates an unsampled or ancestral haplotype state. The size of the circle corresponds to the number of individuals that share that haplotype, as per circle size legend. Each island is represented by a different color (see Legend). Haplotypes island origins: H_1 H_12: JA; H_13 H_16: DR; H_17: EY; H_18: EY, GF, BVI, NE, SK, MO, BU, AN, GU, DO, MA, SL, SV, GD, BA; H_19: EY, GF; H_20: EY; H_21: GF; H_22: GF, NE, SK, MO, BU, AN, DO; H_23 H_28: GF; 153
155 154 H_29: GF, BVI, NE, AN; H_30: GF; H_31, BVI; H_32: NE; H_33: NE, SV, GD; H_34: NE; H_35: NE, AN; H_36: NE, SK; H_37: NE, SV; H_38 H_39: SK, H_40 H_42: AN; H_43: GU; H_44: GU, DO, SV; H_45: MA; H_46: SL; H_47: SL; H_48 H_56: SV; H_57 H_59: BA. Figure 10. Consensus phylogenetic tree of Caribbean elaenias, Elaenia martinica, sampled in the West Indies. Bayesian posterior values are above branch lines of tree, and Maximum likelihood support values are below lines. Island acronyms vide Table 1. Bird illustration modified from Raffaele et al. (2010). Figure 11. Haplotype network of Caribbean elaenia individuals, Elaenia martinica. Each circle represents a different haplotype, and each open dot indicates an unsampled haplotype (mutational steps). The grey rectangles also represent a group of 21 mutational steps between haplotypes. The size of the circle corresponds to the number of individuals that share that haplotype, as per circle size legend. Each island is represented by a different color (see Legend). Haplotype islands origin: H_1: AN, GU, DO; H_2: GF, BVI, SK, NE, BU, AN; H_3: BA, GU; H_4 H_6: BA; H_7: LC, CB; H_8: CB; H_9: DO; H_10: SK, NE, DO; H_11 H_12: DO; H_13: GF; H_14: SK, NE, GU, MA; H_15 H_18: MA; H_19: MO; H_20 H_21: NE; H_22 H_24: SL; H_25 H_28:SV. Figure 12. Consensus phylogenetic tree of black-whiskered vireos, Vireo altiloquus, sampled in the West Indies. Bayesian posterior values are above branch lines of tree, and 154
156 155 Maximum likelihood support values are below lines. Island acronyms vide Table 1. Bird illustration modified from Raffaele et al. (2010). Figure 13. Haplotype network of black-whiskered vireos, Vireo altiloquus. Each circle represents a different haplotype, and each open dot indicates an unsampled or ancestral haplotype state. The size of the circle corresponds to the number of individuals that share that haplotype, as per circle size legend. Each island is represented by a different color (see Legend). Haplotypes island origins: H_1: SK, NE, AN, BA; H_2: SK, NE, H_3: NE, H_4: SK, H_5: SL, MO, AM, BA, SL; H_6: NE, H_7 9: MA; H_10: MO; H_11 17: BA; H_18 19: BA, SL; H_20 29: SL; H_30: GD. Figure 14. Bathymetric map of Lesser Antilles, showing -100 m isobath line around islands (in black), and decreasing -100 m isobaths. In grey are the current shapes of the islands. 155
157 156 Figure 1. Eleuthera 24 Bahamas Cuba lat 20 Cayman Brac Little Cayman Dominican Republic Guana El Yunque Lesser Antilles St. Martin Jamaica Hispaniola Guanica Puerto Rico St. Kitts Nevis Barbuda Antigua 16 Montserrat Guadeloupe Dominica CARIBBEAN SEA Martinique St. Lucia St. Vincent Barbados 12 Grenada long 156

158 157 Figure
159 158 Figure

160 159 Figure

161 160 Figure

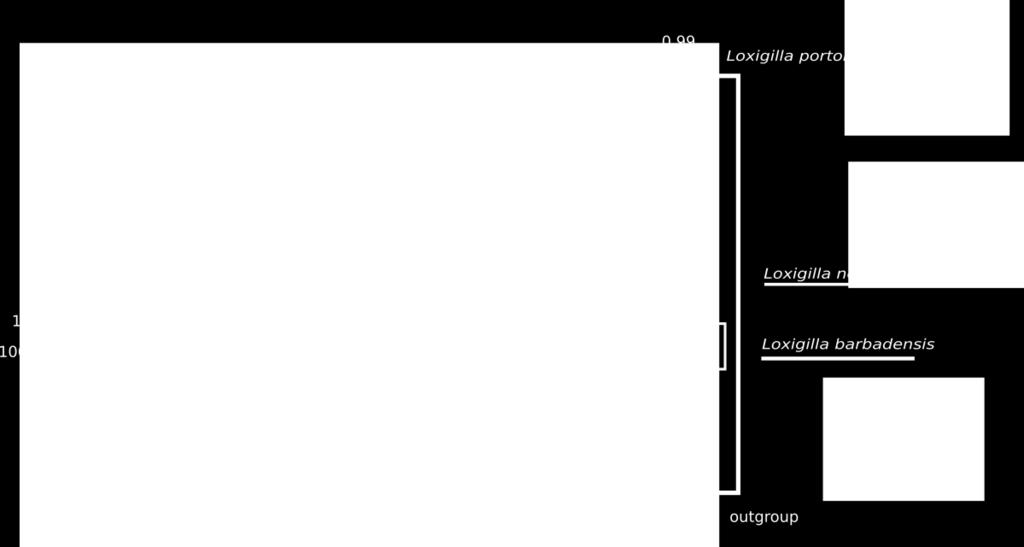
162 161 Figure
163 162 Figure
164 163 Figure
165 164 Figure 9. H_

166 165 Figure

167 166 Figure
168 167 Figure
169 168 Figure

170 169 Figure
Phylogeography and genetic differentiation between Loxigilla noctis and L. barbadensis in the Lesser Antilles
 Phylogeography and genetic differentiation between Loxigilla noctis and L. barbadensis in the Lesser Antilles Sophie Arnaud-Haond 1, Carla Daniel 2, Sébastien Motreuil 3, Julia Horrocks 2 & Frank Cézilly
Applications of Genetics to Conservation Biology
 Applications of Genetics to Conservation Biology Molecular Taxonomy Populations, Gene Flow, Phylogeography Relatedness - Kinship, Paternity, Individual ID Conservation Biology Population biology Physiology
Biogeography. An ecological and evolutionary approach SEVENTH EDITION. C. Barry Cox MA, PhD, DSc and Peter D. Moore PhD
 Biogeography An ecological and evolutionary approach C. Barry Cox MA, PhD, DSc and Peter D. Moore PhD Division of Life Sciences, King's College London, Fmnklin-Wilkins Building, Stamford Street, London
History and the Species-Area Relationship in Lesser Antillean Birds
 vol. 163, no. the american naturalist february 004 History and the Species-Area Relationship in Lesser Antillean Birds Robert E. Ricklefs 1,* and Eldredge Bermingham, 1. Department of Biology, University
Ph ylogeography. A guide to the study of the spatial distribution of Seahorses. By Leila Mougoui Bakhtiari
 Ph ylogeography A guide to the study of the spatial distribution of Seahorses By Leila Mougoui Bakhtiari Contents An Introduction to Phylogeography JT Bohem s Resarch Map of erectu s migration Conservation
Fields connected to Phylogeography Microevolutionary disciplines Ethology Demography Population genetics
 Stephen A. Roussos Fields connected to Phylogeography Microevolutionary disciplines Ethology Demography Population genetics Macrevolutionary disciplines Historical geography Paleontology Phylogenetic biology
Biogeography expands:
 Biogeography expands: Phylogeography Ecobiogeography Due to advances in DNA sequencing and fingerprinting methods, historical biogeography has recently begun to integrate relationships of populations within
Geography of Evolution
 Geography of Evolution Biogeography - the study of the geographic distribution of organisms. The current distribution of organisms can be explained by historical events and current climatic patterns. Darwin
Why the Indian subcontinent holds the key to global tiger recovery
 Why the Indian subcontinent holds the key to global tiger recovery QuickTime and a TIFF (Uncompressed) decompressor are needed to see this picture. Samrat Mondol K. Ullas Karanth Uma Ramakrishnan NCBS-TIFR
Community phylogenetics review/quiz
 Community phylogenetics review/quiz A. This pattern represents and is a consequent of. Most likely to observe this at phylogenetic scales. B. This pattern represents and is a consequent of. Most likely
THE UNIVERSITY OF THE WEST INDIES MONA CAMPUS TOTAL NUMBER OF GRADUATES - OFF-CAMPUS BY FACULTY, COUNTRY AND SEX, 2007
 TABLE 49 TOTAL NUMBER OF - OFF-CAMPUS ANGUILLA M F T M F T M F T M F T M F T M F T 0 0 0 0 1 1 0 0 0 0 0 0 0 0 0 0 1 1 ANTIGUA & BARBUDA 0 0 0 0 0 0 0 0 0 0 1 1 0 0 0 0 1 1 BAHAMAS 1 0 1 0 0 0 0 0 0 0
Dr. Amira A. AL-Hosary
 Phylogenetic analysis Amira A. AL-Hosary PhD of infectious diseases Department of Animal Medicine (Infectious Diseases) Faculty of Veterinary Medicine Assiut University-Egypt Phylogenetic Basics: Biological
Amira A. AL-Hosary PhD of infectious diseases Department of Animal Medicine (Infectious Diseases) Faculty of Veterinary Medicine Assiut
 Faculty of Veterinary Medicine Assiut") Amira A. AL-Hosary PhD of infectious diseases Department of Animal Medicine (Infectious Diseases) Faculty of Veterinary Medicine Assiut University-Egypt Phylogenetic analysis Phylogenetic Basics: Biological
Amira A. AL-Hosary PhD of infectious diseases Department of Animal Medicine (Infectious Diseases) Faculty of Veterinary Medicine Assiut University-Egypt Phylogenetic analysis Phylogenetic Basics: Biological
Table S1. Locations and dates of reported sightings of massive pelagic Sargassum strandings in the tropical North Atlantic in 2011.
 Supplemental Content for Franks et al. 2016. Franks, J.S., D.R. Johnson, and D.S. Ko. 2016. Pelagic Sargassum in the tropical North Atlantic. Gulf and Caribbean Research 27:S6-S12. DOI: 10.18785/gcr.2701.08
GIS Applications to Museum Specimens
 GIS Applications to Museum Specimens Joseph Grinnell (1877 1939) At this point I wish to emphasize what I believe will ultimately prove to be the greatest value of our museum. This value will not, however,
8/23/2014. Phylogeny and the Tree of Life
 Phylogeny and the Tree of Life Chapter 26 Objectives Explain the following characteristics of the Linnaean system of classification: a. binomial nomenclature b. hierarchical classification List the major
Integrative Biology 200 "PRINCIPLES OF PHYLOGENETICS" Spring 2018 University of California, Berkeley
 Integrative Biology 200 "PRINCIPLES OF PHYLOGENETICS" Spring 2018 University of California, Berkeley B.D. Mishler Feb. 14, 2018. Phylogenetic trees VI: Dating in the 21st century: clocks, & calibrations;
Estimating Evolutionary Trees. Phylogenetic Methods
 Estimating Evolutionary Trees v if the data are consistent with infinite sites then all methods should yield the same tree v it gets more complicated when there is homoplasy, i.e., parallel or convergent
Lecture 11 Friday, October 21, 2011
 Lecture 11 Friday, October 21, 2011 Phylogenetic tree (phylogeny) Darwin and classification: In the Origin, Darwin said that descent from a common ancestral species could explain why the Linnaean system
Postglacial colonizer or cryptic invader? Case of Gammarus roeselii (Crustacea Amphipoda) in Europe
 in Europe") Postglacial colonizer or cryptic invader? Case of Gammarus roeselii (Crustacea Amphipoda) in Europe Tomasz Rewicz, Paula Krzywozniak, Tomasz Mamos, Karolina Bacela Spychalska, Remi Wattier, Michal Grabowski
Postglacial colonizer or cryptic invader? Case of Gammarus roeselii (Crustacea Amphipoda) in Europe Tomasz Rewicz, Paula Krzywozniak, Tomasz Mamos, Karolina Bacela Spychalska, Remi Wattier, Michal Grabowski
Geographical variation in genetic structure of an Atlantic Coastal Forest frog reveals regional differences in habitat stability
 Molecular Ecology (2009) 18, 2877 2896 doi: 10.1111/j.1365-294X.2009.04245.x Geographical variation in genetic structure of an Atlantic Coastal Forest frog reveals regional differences in habitat stability
The West Indies as a laboratory of biogeography and evolution
 PHILOSOPHICAL TRANSACTIONS OF THE ROYAL SOCIETY FirstCite e-publishing doi: 10.1098/rstb.2007.2068 Published online Review The West Indies as a laboratory of biogeography and evolution Robert Ricklefs
Biogeography of Islands
 Biogeography of Islands Biogeography of Islands Biogeography of Islands Biogeography of Islands Biogeography of Islands Biogeography of Islands Biogeography of Islands Biogeography of Islands Biogeography
Intraspecific gene genealogies: trees grafting into networks
 Intraspecific gene genealogies: trees grafting into networks by David Posada & Keith A. Crandall Kessy Abarenkov Tartu, 2004 Article describes: Population genetics principles Intraspecific genetic variation
EVOLUTION change in populations over time
 EVOLUTION change in populations over time HISTORY ideas that shaped the current theory James Hutton (1785) proposes that Earth is shaped by geological forces that took place over extremely long periods
 that of Phylotree.org, mtdna tree Build 1756 (Supplementary TableS2). is resulted in 78 individuals allocated to the hg B4a1a1 and three individuals to hg Q. e control region (nps 57372 and nps 1602416526)
photo courtesy of
 BRITISH VIRGIN ISLANDS REPORT TROPICAL STORM JEANNE photo courtesy of www.bviplatinum.com PREPARED BY THE DEPARTMENT OF DISASTER MANAGEMENT 1 EVENT 13 th -16 th September, 2004 TROPICAL STORM JEANNE Sequence
Alligator mississippiensis.
 Alligator mississippiensis http://www.birdsasart.com/bn201.htm Core Case Study: Why Should We Care about the American Alligator? Largest reptile in North America 1930s: Hunters and poachers Importance
A (short) introduction to phylogenetics
 introduction to phylogenetics") A (short) introduction to phylogenetics Thibaut Jombart, Marie-Pauline Beugin MRC Centre for Outbreak Analysis and Modelling Imperial College London Genetic data analysis with PR Statistics, Millport Field
A (short) introduction to phylogenetics Thibaut Jombart, Marie-Pauline Beugin MRC Centre for Outbreak Analysis and Modelling Imperial College London Genetic data analysis with PR Statistics, Millport Field
POPULATION GENETICS Winter 2005 Lecture 17 Molecular phylogenetics
 POPULATION GENETICS Winter 2005 Lecture 17 Molecular phylogenetics - in deriving a phylogeny our goal is simply to reconstruct the historical relationships between a group of taxa. - before we review the
Using phylogenetics to estimate species divergence times... Basics and basic issues for Bayesian inference of divergence times (plus some digression)
") Using phylogenetics to estimate species divergence times... More accurately... Basics and basic issues for Bayesian inference of divergence times (plus some digression) "A comparison of the structures
Using phylogenetics to estimate species divergence times... More accurately... Basics and basic issues for Bayesian inference of divergence times (plus some digression) "A comparison of the structures
ECOLOGICAL PLANT GEOGRAPHY
 Biology 561 MWF 11:15 12:05 Spring 2018 128 Wilson Hall Robert K. Peet ECOLOGICAL PLANT GEOGRAPHY Objectives: This is a course in the geography of plant biodiversity, vegetation and ecological processes.
EVOLUTION change in populations over time
 EVOLUTION change in populations over time HISTORY ideas that shaped the current theory James Hutton & Charles Lyell proposes that Earth is shaped by geological forces that took place over extremely long
Introduction to Advanced Population Genetics
 Introduction to Advanced Population Genetics Learning Objectives Describe the basic model of human evolutionary history Describe the key evolutionary forces How demography can influence the site frequency
Natural Selection. Professor Andrea Garrison Biology 3A Illustrations 2011 Pearson Education, Inc., unless otherwise noted
 Natural Selection Professor Andrea Garrison Biology 3A Illustrations 2011 Pearson Education, Inc., unless otherwise noted Natural Selection Mechanism for change in species over time Proposed by Charles
AP Biology Review Packet 5- Natural Selection and Evolution & Speciation and Phylogeny
 AP Biology Review Packet 5- Natural Selection and Evolution & Speciation and Phylogeny 1A1- Natural selection is a major mechanism of evolution. 1A2: Natural selection acts on phenotypic variations in
Molecular Markers, Natural History, and Evolution
 Molecular Markers, Natural History, and Evolution Second Edition JOHN C. AVISE University of Georgia Sinauer Associates, Inc. Publishers Sunderland, Massachusetts Contents PART I Background CHAPTER 1:
Review of molecular biology
 Review of molecular biology DNA is into RNA, which is into protein. What mrna sequence would be transcribed from the DNA template CTA? What sequence of trna would be attracted by the above mrna sequence?
The Theory of Evolution
 Name Date Class CHAPTER 13 DIRECTED READING The Theory of Evolution Section 13-1: The Theory of Evolution by Natural Selection Darwin Proposed a Mechanism for Evolution Mark each statement below T if it
Chapter 22: Descent with Modification 1. BRIEFLY summarize the main points that Darwin made in The Origin of Species.
 AP Biology Chapter Packet 7- Evolution Name Chapter 22: Descent with Modification 1. BRIEFLY summarize the main points that Darwin made in The Origin of Species. 2. Define the following terms: a. Natural
Past climate change on Sky Islands drives novelty in a core developmental gene network and its phenotype
 Supplementary tables and figures Past climate change on Sky Islands drives novelty in a core developmental gene network and its phenotype Marie-Julie Favé 1, Robert A. Johnson 2, Stefan Cover 3 Stephan
APPENDIX S1: DESCRIPTION OF THE ESTIMATION OF THE VARIANCES OF OUR MAXIMUM LIKELIHOOD ESTIMATORS
 APPENDIX S1: DESCRIPTION OF THE ESTIMATION OF THE VARIANCES OF OUR MAXIMUM LIKELIHOOD ESTIMATORS For large n, the negative inverse of the second derivative of the likelihood function at the optimum can
Island biogeography. Key concepts. Introduction. Island biogeography theory. Colonization-extinction balance. Island-biogeography theory
 Island biogeography Key concepts Colonization-extinction balance Island-biogeography theory Introduction At the end of the last chapter, it was suggested that another mechanism for the maintenance of α-diversity
Biogeography of Islands. Oceanic islands Sky islands (mountain tops) Forest fragments Prairie potholes Prairie remnants
 Forest fragments Prairie potholes Prairie remnants") Biogeography of Islands Oceanic islands Sky islands (mountain tops) Forest fragments Prairie potholes Prairie remnants Biogeography of Islands Oceanic islands Sky islands (mountain tops) Forest fragments
Biogeography of Islands Oceanic islands Sky islands (mountain tops) Forest fragments Prairie potholes Prairie remnants Biogeography of Islands Oceanic islands Sky islands (mountain tops) Forest fragments
Climate Change Impacts and Adaptation for Coastal Transport Infrastructure in Caribbean SIDS
 UNCTAD National Workshop Saint Lucia 24 26 May 2017, Rodney Bay, Saint Lucia Climate Change Impacts and Adaptation for Coastal Transport Infrastructure in Caribbean SIDS Impacts of Natural Hazards on the
Evidences of Evolution (Clues)
") Evidences of Evolution (Clues) Darwin stated that all organisms descended from a common ancestor Darwin based his theory of Natural Selection on observations of: Traits, geographical distribution, selective
Evidences of Evolution (Clues) Darwin stated that all organisms descended from a common ancestor Darwin based his theory of Natural Selection on observations of: Traits, geographical distribution, selective
The Phylogenetic Reconstruction of the Grass Family (Poaceae) Using matk Gene Sequences
 Using matk Gene Sequences") The Phylogenetic Reconstruction of the Grass Family (Poaceae) Using matk Gene Sequences by Hongping Liang Dissertation submitted to the Faculty of the Virginia Polytechnic Institute and State University
The Phylogenetic Reconstruction of the Grass Family (Poaceae) Using matk Gene Sequences by Hongping Liang Dissertation submitted to the Faculty of the Virginia Polytechnic Institute and State University
CARIBBEAN TOURISM CLIMATIC BULLETIN
 A Joint Bulletin of the CTO, the CHTA and the CIMH CARIBBEAN TOURISM CLIMATIC BULLETIN for Tourism Businesses and Policymakers May 2017 Vol I Issue 1 Photo Credit:pixabay.com Purpose This bulletin is a
Unit 7: Evolution Guided Reading Questions (80 pts total)
") AP Biology Biology, Campbell and Reece, 10th Edition Adapted from chapter reading guides originally created by Lynn Miriello Name: Unit 7: Evolution Guided Reading Questions (80 pts total) Chapter 22 Descent
AP Biology Biology, Campbell and Reece, 10th Edition Adapted from chapter reading guides originally created by Lynn Miriello Name: Unit 7: Evolution Guided Reading Questions (80 pts total) Chapter 22 Descent
Glacial History of the North Atlantic Marine Snail, Littorina saxatilis, Inferred from Distribution of Mitochondrial DNA Lineages
 Glacial History of the North Atlantic Marine Snail, Littorina saxatilis, Inferred from Distribution of Mitochondrial DNA Lineages Marina Panova 1 *, April M. H. Blakeslee 2, A. Whitman Miller 2, Tuuli
Gene Pool The combined genetic material for all the members of a population. (all the genes in a population)
") POPULATION GENETICS NOTES Gene Pool The combined genetic material for all the members of a population. (all the genes in a population) Allele Frequency The number of times a specific allele occurs in a
POPULATION GENETICS NOTES Gene Pool The combined genetic material for all the members of a population. (all the genes in a population) Allele Frequency The number of times a specific allele occurs in a
AP Environmental Science I. Unit 1-2: Biodiversity & Evolution
 NOTE/STUDY GUIDE: Unit 1-2, Biodiversity & Evolution AP Environmental Science I, Mr. Doc Miller, M.Ed. North Central High School Name: ID#: NORTH CENTRAL HIGH SCHOOL NOTE & STUDY GUIDE AP Environmental
The Tempo of Macroevolution: Patterns of Diversification and Extinction
 The Tempo of Macroevolution: Patterns of Diversification and Extinction During the semester we have been consider various aspects parameters associated with biodiversity. Current usage stems from 1980's
ISLAND BIOGEOGRAPHY Lab 7
 Reminders! Bring memory stick Read papers for Discussion Key Concepts Biogeography/Island biogeography Convergent evolution Dynamic equilibrium Student Learning Outcomes After Lab 7 students will be able
Conservation Genetics. Outline
 Conservation Genetics The basis for an evolutionary conservation Outline Introduction to conservation genetics Genetic diversity and measurement Genetic consequences of small population size and extinction.
Molecular Phylogenetics and Evolution
 Molecular Phylogenetics and Evolution 49 (2008) 277 291 Contents lists available at ScienceDirect Molecular Phylogenetics and Evolution journal homepage: www.elsevier.com/locate/ympev In situ genetic differentiation
About the Authors Geography and Tourism: The Attraction of Place p. 1 The Elements of Geography p. 2 Themes of Geography p. 4 Location: The Where of
 Preface p. ix About the Authors p. xi Geography and Tourism: The Attraction of Place p. 1 The Elements of Geography p. 2 Themes of Geography p. 4 Location: The Where of Geography p. 4 Place and Space:
PHYLOGENY AND SYSTEMATICS
 AP BIOLOGY EVOLUTION/HEREDITY UNIT Unit 1 Part 11 Chapter 26 Activity #15 NAME DATE PERIOD PHYLOGENY AND SYSTEMATICS PHYLOGENY Evolutionary history of species or group of related species SYSTEMATICS Study
I. Short Answer Questions DO ALL QUESTIONS
 EVOLUTION 313 FINAL EXAM Part 1 Saturday, 7 May 2005 page 1 I. Short Answer Questions DO ALL QUESTIONS SAQ #1. Please state and BRIEFLY explain the major objectives of this course in evolution. Recall
Biology 559R: Introduction to Phylogenetic Comparative Methods Topics for this week (Jan 27 & 29):
:") Biology 559R: Introduction to Phylogenetic Comparative Methods Topics for this week (Jan 27 & 29): Statistical estimation of models of sequence evolution Phylogenetic inference using maximum likelihood:
Biology 559R: Introduction to Phylogenetic Comparative Methods Topics for this week (Jan 27 & 29): Statistical estimation of models of sequence evolution Phylogenetic inference using maximum likelihood:
BINF6201/8201. Molecular phylogenetic methods
 BINF60/80 Molecular phylogenetic methods 0-7-06 Phylogenetics Ø According to the evolutionary theory, all life forms on this planet are related to one another by descent. Ø Traditionally, phylogenetics
Speciation. Today s OUTLINE: Mechanisms of Speciation. Mechanisms of Speciation. Geographic Models of speciation. (1) Mechanisms of Speciation
 Mechanisms of Speciation") Speciation Today s OUTLINE: (1) Geographic Mechanisms of Speciation (What circumstances lead to the formation of new species?) (2) Species Concepts (How are Species Defined?) Mechanisms of Speciation Last
Speciation Today s OUTLINE: (1) Geographic Mechanisms of Speciation (What circumstances lead to the formation of new species?) (2) Species Concepts (How are Species Defined?) Mechanisms of Speciation Last
Chapter 26: Phylogeny and the Tree of Life Phylogenies Show Evolutionary Relationships
 Chapter 26: Phylogeny and the Tree of Life You Must Know The taxonomic categories and how they indicate relatedness. How systematics is used to develop phylogenetic trees. How to construct a phylogenetic
Concepts and Methods in Molecular Divergence Time Estimation
 Concepts and Methods in Molecular Divergence Time Estimation 26 November 2012 Prashant P. Sharma American Museum of Natural History Overview 1. Why do we date trees? 2. The molecular clock 3. Local clocks
Speciation. Today s OUTLINE: Mechanisms of Speciation. Mechanisms of Speciation. Geographic Models of speciation. (1) Mechanisms of Speciation
 Mechanisms of Speciation") Speciation Today s OUTLINE: (1) Geographic Mechanisms of Speciation (What circumstances lead to the formation of new species?) (2) Species Concepts (How are Species Defined?) Mechanisms of Speciation Last
Speciation Today s OUTLINE: (1) Geographic Mechanisms of Speciation (What circumstances lead to the formation of new species?) (2) Species Concepts (How are Species Defined?) Mechanisms of Speciation Last
Karine Monceau 1, Frank Cézilly 1,2,Jérôme Moreau 1,Sébastien Motreuil 1,Rémi Wattier 1 * Abstract. Introduction
 Colonisation and Diversification of the Zenaida Dove (Zenaida aurita) in the Antilles: Phylogeography, Contemporary Gene Flow and Morphological Divergence Karine Monceau 1, Frank Cézilly 1,2,Jérôme Moreau
C3020 Molecular Evolution. Exercises #3: Phylogenetics
 C3020 Molecular Evolution Exercises #3: Phylogenetics Consider the following sequences for five taxa 1-5 and the known outgroup O, which has the ancestral states (note that sequence 3 has changed from
EVOLUTION. HISTORY: Ideas that shaped the current evolutionary theory. Evolution change in populations over time.
 EVOLUTION HISTORY: Ideas that shaped the current evolutionary theory. Evolution change in populations over time. James Hutton & Charles Lyell proposes that Earth is shaped by geological forces that took
Design Wind Speeds for the Caribbean for use with the Wind Load Provisions of ASCE 7
 Design Wind Speeds for the Caribbean for use with the Wind Load Provisions of ASCE 7 Prepared by Peter J Vickery and Dhiraj Wadhera Applied Research Associates 854 Colonnade Center Drive, Suite 37 Raleigh,
How to read and make phylogenetic trees Zuzana Starostová
 How to read and make phylogenetic trees Zuzana Starostová How to make phylogenetic trees? Workflow: obtain DNA sequence quality check sequence alignment calculating genetic distances phylogeny estimation
Rapid speciation following recent host shift in the plant pathogenic fungus Rhynchosporium
 Rapid speciation following recent host shift in the plant pathogenic fungus Rhynchosporium Tiziana Vonlanthen, Laurin Müller 27.10.15 1 Second paper: Origin and Domestication of the Fungal Wheat Pathogen
Constructing Evolutionary/Phylogenetic Trees
 Constructing Evolutionary/Phylogenetic Trees 2 broad categories: istance-based methods Ultrametric Additive: UPGMA Transformed istance Neighbor-Joining Character-based Maximum Parsimony Maximum Likelihood
THE PHYLOGEOGRAPHIC PERSPECTIVE ON EVOLUTION OF ENDEMISM IN THE CAUCASIAN AVIFAUNA: PRELIMINARY DATA
 THE PHYLOGEOGRAPHIC PERSPECTIVE ON EVOLUTION OF ENDEMISM IN THE CAUCASIAN AVIFAUNA: PRELIMINARY DATA Sergei V. Drovetski, Robert M. Zink 2, Michael Westberg 2, Igor V. Fadeev, Yevgeniy V. Nesterov, Yevgeniy
Q1) Explain how background selection and genetic hitchhiking could explain the positive correlation between genetic diversity and recombination rate.
 Explain how background selection and genetic hitchhiking could explain the positive correlation between genetic diversity and recombination rate.") OEB 242 Exam Practice Problems Answer Key Q1) Explain how background selection and genetic hitchhiking could explain the positive correlation between genetic diversity and recombination rate. First, recall
OEB 242 Exam Practice Problems Answer Key Q1) Explain how background selection and genetic hitchhiking could explain the positive correlation between genetic diversity and recombination rate. First, recall
Evolution. Darwin s Voyage
 Evolution Darwin s Voyage Charles Darwin Explorer on an observation trip to the Galapagos Islands. He set sail on the HMS Beagle in 1858 from England on a 5 year trip. He was a naturalist (a person who
Insular East Asia pig dispersal and vicariance inferred from Asian wild boar genetic evidence 1
 Insular East Asia pig dispersal and vicariance inferred from Asian wild boar genetic evidence 1 K. Y. Li,* K. T. Li, C. H. Yang, M. H. Hwang, S. W. Chang,# S. M. Lin, H. J. Wu, E. B. Basilio Jr., ** R.
Gene Genealogies Coalescence Theory. Annabelle Haudry Glasgow, July 2009
 Gene Genealogies Coalescence Theory Annabelle Haudry Glasgow, July 2009 What could tell a gene genealogy? How much diversity in the population? Has the demographic size of the population changed? How?
The Origin of Species The Making of a Theory
 DISCOVERING THE WALLACE LINE BACKGROUND This activity supports the HHMI short film The Origin of Species:. Students are presented with a map of the Malay Archipelago and a series of observations of animals.
Competition: Observations and Experiments. Cedar Creek MN, copyright David Tilman
 Competition: Observations and Experiments Cedar Creek MN, copyright David Tilman Resource-Ratio (R*) Theory Species differ in critical limiting concentration for resources (R* values) R* values differ
A comparison of two popular statistical methods for estimating the time to most recent common ancestor (TMRCA) from a sample of DNA sequences
 from a sample of DNA sequences") Indian Academy of Sciences A comparison of two popular statistical methods for estimating the time to most recent common ancestor (TMRCA) from a sample of DNA sequences ANALABHA BASU and PARTHA P. MAJUMDER*
Indian Academy of Sciences A comparison of two popular statistical methods for estimating the time to most recent common ancestor (TMRCA) from a sample of DNA sequences ANALABHA BASU and PARTHA P. MAJUMDER*
GEOLOGY 12 CHAPTER 8 PATTERNS OF EVOLUTION EVIDENCE FOR EVOLUTION. fossils (many forms now extinct)
") GEOLOGY 12 CHAPTER 8 PATTERNS OF EVOLUTION NOTES EVIDENCE FOR EVOLUTION INDIRECT fossils (many forms now extinct) changes in a single species of snail DIRECT common ancestry (adaptive radiation) similar
GEOLOGY 12 CHAPTER 8 PATTERNS OF EVOLUTION NOTES EVIDENCE FOR EVOLUTION INDIRECT fossils (many forms now extinct) changes in a single species of snail DIRECT common ancestry (adaptive radiation) similar
Evolution Problem Drill 09: The Tree of Life
 Evolution Problem Drill 09: The Tree of Life Question No. 1 of 10 Question 1. The age of the Earth is estimated to be about 4.0 to 4.5 billion years old. All of the following methods may be used to estimate
Disaster Risk Assessment: Opportunities for GIS and data management with Open DRI
 Disaster Risk Assessment: Opportunities for GIS and data management with Open DRI Jacob Opadeyi Department of Geomatics Engineering and Land Management, The University of the West Indies, St. Augustine,
Climate Change Impacts and Adaptation for Coastal Transport Infrastructure in Caribbean SIDS
 UNCTAD National Workshop Jamaica 30 May 1 June 2017, Kingston, Jamaica Climate Change Impacts and Adaptation for Coastal Transport Infrastructure in Caribbean SIDS Impacts of Natural Hazards on the Transport
CARIBBEAN TOURISM CLIMATIC BULLETIN
 A Joint Bulletin of the CTO, the CHTA and the CIMH CARIBBEAN TOURISM CLIMATIC BULLETIN for Tourism Businesses and Policymakers Sept-Oct-Nov 2018 I Vol 2 I Issue 3 Photo Credit: Cayman Islands Department
Genetic Drift in Human Evolution
 Genetic Drift in Human Evolution (Part 2 of 2) 1 Ecology and Evolutionary Biology Center for Computational Molecular Biology Brown University Outline Introduction to genetic drift Modeling genetic drift
Covered Area Rainfall Event (18-19 September 2017) Hurricane Maria Excess Rainfall
 Hurricane Maria Excess Rainfall") Covered Area Rainfall Event (18-19 September 2017) Hurricane Maria Excess Rainfall Event Briefing Barbados 28 September 2017 Registered Office: CCRIF SPC c/o Sagicor Insurance Managers Ltd., 198 North
Covered Area Rainfall Event (18-19 September 2017) Hurricane Maria Excess Rainfall Event Briefing Barbados 28 September 2017 Registered Office: CCRIF SPC c/o Sagicor Insurance Managers Ltd., 198 North
Selection against A 2 (upper row, s = 0.004) and for A 2 (lower row, s = ) N = 25 N = 250 N = 2500
 and for A 2 (lower row, s = ) N = 25 N = 250 N = 2500") Why mitochondrial DN is simple Mitochondrial DN and the History of Population Size lan R Rogers January 4, 8 inherited from mother only no recombination evolves fast mean pairwise difference: average number
Why mitochondrial DN is simple Mitochondrial DN and the History of Population Size lan R Rogers January 4, 8 inherited from mother only no recombination evolves fast mean pairwise difference: average number
Microevolution (Ch 16) Test Bank
 Test Bank") Microevolution (Ch 16) Test Bank Multiple Choice Identify the letter of the choice that best completes the statement or answers the question. 1. Which of the following statements describes what all members
Microevolution (Ch 16) Test Bank Multiple Choice Identify the letter of the choice that best completes the statement or answers the question. 1. Which of the following statements describes what all members
Speciation. Today s OUTLINE: Mechanisms of Speciation. Mechanisms of Speciation. Geographic Models of speciation. (1) Mechanisms of Speciation
 Mechanisms of Speciation") Speciation Today s OUTLINE: (1) Geographic Mechanisms of Speciation (What circumstances lead to the formation of new species?) (2) Species Concepts (How are Species Defined?) Mechanisms of Speciation Last
Speciation Today s OUTLINE: (1) Geographic Mechanisms of Speciation (What circumstances lead to the formation of new species?) (2) Species Concepts (How are Species Defined?) Mechanisms of Speciation Last
Phylogeny and systematics. Why are these disciplines important in evolutionary biology and how are they related to each other?
 Phylogeny and systematics Why are these disciplines important in evolutionary biology and how are they related to each other? Phylogeny and systematics Phylogeny: the evolutionary history of a species
Phylogeography Historical Biogeography of the Species
 Historical biogeography traditionally deals with relationships among species, genera, and higher taxonomic groups and the areas they occupy Due to advances in DNA sequencing and fingerprinting methods,
Earth s Changing Continents
 2 What You Will Learn Earth s continents have moved around Earth s surface throughout Earth s history and have only recently arrived at their current locations. Rocks and fossils provide evidence of continental
Caribbean Tropical Cyclone Modeling
 Caribbean Tropical Cyclone Modeling Filmon Habte, PhD 2018 RAA Catastrophe Risk Management Conference Orlando, Florida February 14, 2018 Agenda Hurricane risk in the Caribbean 2017 hurricane season Lessons
Cambridge International Examinations Cambridge Ordinary Level
 Cambridge International Examinations Cambridge Ordinary Level *0607581492* GEOGRAPHY 2217/13 Paper 1 October/November 2018 1 hour 45 minutes Candidates answer on the Question Paper. Additional Materials:
Unit 9 - Evolution Practice Quiz
 Unit 9 - Evolution Practice Quiz Multiple Choice Identify the choice that best completes the statement or answers the question. 1. Lamarck s theory of evolution includes the concept that new organs in
Origin of an idea about origins
 Origin of an idea about origins Biological evolution is the process of change during the course of time because of the alteration of the genotype and the transfer of these altered genes to the next generation.
Mechanisms of Evolution. Adaptations. Old Ideas about Evolution. Behavioral. Structural. Biochemical. Physiological
 Mechanisms of Evolution Honors Biology 2012 1 Adaptations Behavioral Structural Biochemical Physiological 2 Old Ideas about Evolution Aristotle (viewed species perfect and unchanging) Lamarck suggested
SPECIATION. REPRODUCTIVE BARRIERS PREZYGOTIC: Barriers that prevent fertilization. Habitat isolation Populations can t get together
 SPECIATION Origin of new species=speciation -Process by which one species splits into two or more species, accounts for both the unity and diversity of life SPECIES BIOLOGICAL CONCEPT Population or groups
EARTH SYSTEM: HISTORY AND NATURAL VARIABILITY Vol. III - Global Biodiversity and its Variation in Space and Time - D. Storch
 GLOBAL BIODIVERSITY AND ITS VARIATION IN SPACE AND TIME D. Storch Charles University, Center for Theoretical Study, Prague, Czech Republic Keywords: species diversity, interspecific interactions, communities,