USING CENSUS OUTPUT AREAS FOR MARKET RESEARCH SAMPLING
|
|
|
- Joseph Rogers
- 6 years ago
- Views:
Transcription

1 USING CENSUS OUTPUT AREAS FOR MARKET RESEARCH SAMPLING Martin van Staveren Small Area Geography Planning for the Future MRS CGG Seminar, 5 th February 2007
2 INITIAL USE OF GEODEMOGRAPHICS BMRB was first company to link Census geodemographics to market research data TGI data showed stronger relationship between product/brand usage and geodemographics than for social grade So geodemographics could be used as a powerful discriminator in sample area selection From 1983, used a master sample of Enumeration Districts (EDs) selected by region and ACORN type Samples for each survey selected to a matrix, representative by region and ACORN type Matched samples could be selected for Pre/Post or Continuous surveys
3 INSITE SAMPLING SYSTEM Computerised system introduced in 1990 Database of ALL Census EDs, linked to demographic data, ACORN type and PAF listing Much greater flexibility than partial, paper system Automated selection of samples to specified parameters For continuous or repeat jobs, could select points to match a specified matrix Could track EDs already used, and re-use in a controlled manner Easy to select similar adjacent areas (additional or replacement) if required
4 CENSUS AREAS 1981 & 1991 Census statistics released for EDs EDs were designed before Census, for operational field workloads So size and shape suitable for face-to-face interviewers Average size about 150 households, but BMRB only used EDs with 90+ addresses, increasing average size to 200+ addresses EDs varied considerably in size and content not designed to be statistically homogenous areas Boundaries not available, so census agencies derived approximate address list from centroids
5 CENSUS AREAS Census statistics for Output Areas (OAs) OAs designed after Census, for statistical purposes, so much more homogeneous Typical size for England and Wales is 125 households, with much less variation OAs built from unit postcodes & nest within wards But smaller size and falling response rates make them less suitable for survey research Not designed for interviewers less regular shapes So need to combine OAs to form new Sample Units
6 Sample Units - the Brief Need continuity & homogeneity Areas larger than previous EDs preferable Decided on one-off grouping exercise, in preference to matched samples for each survey: Need to group Scotland as in 1991 Matching will be more difficult over time Cost Basic plan was to merge adjacent OAs within a ward to give average SU of households slightly larger than average issued ED size Also take account of the OA level ACORN solution
7 Sample Units - The Process Some OAs (over 200 households) large enough to use as Sample Units in their own right Identify remaining OAs within each ward that share a boundary Rank available merges by ACORN type difference and significance of shared boundary Merge OAs with only 1 neighbour with same ACORN type Merge other OAs of same ACORN type Merge OAs of different ACORN types starting with ±1type Merge remaining OAs with smallest available unit usually a Sample Unit and over 200 households Manually edit large Sample Units where shape impractical or where original merge not ideal
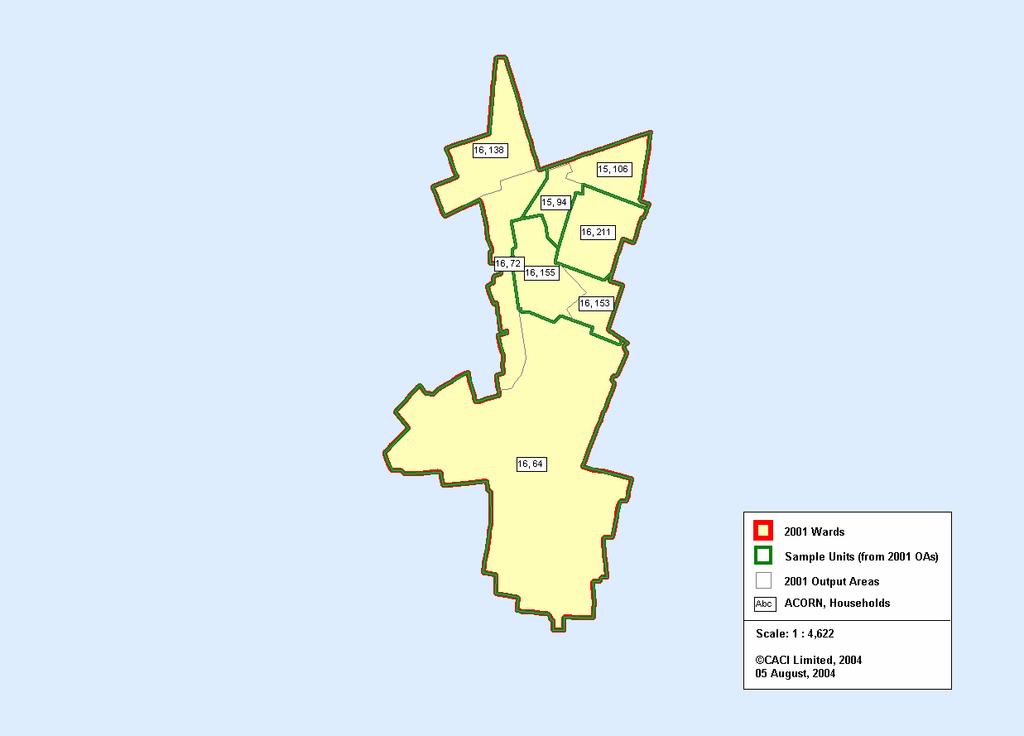
8 The Ideal


9 Example of a Bridge Example of a Bridge

10 A Bridge Too Far?


11 Example in Scotland
12 Results We now have Sample Units We have ensured continuity in our sampling processes while achieving larger areas built from more robust building blocks Average size is 300 households 62% of OAs are in Sample Units of the same dominant ACORN type: 66% in England & Wales, 48% in Scotland Now use more of the population - virtually all areas included (0.1% of pop. not in use against 2.9% of pop. using EDs)
13 Distribution by Size Count Percent 0.2% 0.2% 2.1% % 2.1% 1.3% 0.0%
14 Current Position Larger, more suitable areas A customised geography that is still compatible with Census areas Retained homogeneity from OAs - as far as possible Solution is durable for several years Continuity with past procedures
15 The future Declining use of Face-to-face interviewing in market research, but still the best method for some studies Areas of around 300 households suit our methods best perhaps a little larger if response rates continue to fall Preference for areas which nest within wards and Local Authorities, so sampling points can be selected with reference to larger geographies Homogenous areas make sampling statistically more efficient less variation within areas means a lower Design Effect
16 The future Adjust areas to retain homogeneity, size & compatibility with LA geography v. Maintain areas to be comparable with 2001 X Can cope with a one-off change in boundaries if the consequence is better homogeneity and more uniform size.
2011 census geography and beyond: what can we expect? David Martin SLA Conference, 27 October 2008
 2011 census geography and beyond: what can we expect? David Martin SLA Conference, 27 October 2008 Overview A quick history lesson: census 2001-2001 output area design Where have we got to since then?
Gridded population. redistribution models and applications. David Martin 20 February 2009
 Gridded population data for the UK redistribution models and applications David Martin 20 February 2009 Overview UK gridded data history (brief!) Small area data availability Grid-based modelling responses
The Efficacy of Focused Enumeration. Patten Smith, IpsosMORI Kevin Pickering, NatCen Joel Williams, TNS-BMRB Rachel Hay, Ipsos-MORI
 The Efficacy of Focused Enumeration Patten Smith, IpsosMORI Kevin Pickering, NatCen Joel Williams, TNS-BMRB Rachel Hay, Ipsos-MORI Structure of session 1. Introduction: identifying ethnic minorities in
Population health across space & time: geographical harmonisation of the ONS Longitudinal Study for England & Wales
 British Society for Population Studies Annual Conference, York, September 2011 Population health across space & time: geographical harmonisation of the ONS Longitudinal Study for England & Wales Paul Norman
Understanding and accessing 2011 census aggregate data
 Understanding and accessing 2011 census aggregate data 4 July 11:00 to 16:00 BST Justin Hayes and Richard Wiseman UK Data Service Census Support UK censuses provide an unparalleled resource of high quality
What are we like? Population characteristics from UK censuses. Justin Hayes & Richard Wiseman UK Data Service Census Support
 What are we like? Population characteristics from UK censuses Justin Hayes & Richard Wiseman UK Data Service Census Support Who are we? Richard Wiseman UK Data Service / Jisc Justin Hayes UK Data Service
A Guide to Census Geography
 Research Briefing 2013-05 July 2013 A Guide to Census Geography Contents 1 About this Briefing... 3 2 Sub Ward Geography... 3 3 The Geographical Hierarchies... 3 4 The Statistical Hierarchy... 4 5 Nesting...
2016 New Ward Boundaries Guidance on calculating statistics for the new 2016 wards
 2016 New Ward Boundaries Page 1 Performance, Information and Intelligence 2016 New Ward Boundaries Guidance on calculating statistics for the new 2016 wards Briefing Note February 2016 2016 New Ward Boundaries
The History Behind Census Geography
 The History Behind Census Geography Michael Ratcliffe Geography Division US Census Bureau Kentucky State Data Center Affiliate Meeting August 5, 2016 Today s Presentation A brief look at the history behind
British Household Panel Survey, waves 1-17 ( )
") UK Data Archive Study Number 6032 - British Household Panel Survey, Waves 1-17, 1991-2008: Conditional Access, Rural-Urban s British Household Panel Survey, waves 1-17 (1991-2008) User Documentation: Rural-Urban
UK Data Archive Study Number 6032 - British Household Panel Survey, Waves 1-17, 1991-2008: Conditional Access, Rural-Urban s British Household Panel Survey, waves 1-17 (1991-2008) User Documentation: Rural-Urban
Creating a Geodemographic Classification
 Creating a Geodemographic Classification Dr Daniel Vickers Department of Geography, University of Sheffield D.Vickers@sheffield.ac.uk www.shef.ac.uk/sasi www.areaclassification.org.uk Why classify areas?
Mastering ArcGIS Platforms to Build a National Census Web Mapping Tool. Eoghan McCarthy (AIRO)
") Mastering ArcGIS Platforms to Build a National Census Web Mapping Tool Eoghan McCarthy (AIRO) Outline What is AIRO The Census in Ireland Building National Mapping Infrastructure Demographic Profiling through
Mastering ArcGIS Platforms to Build a National Census Web Mapping Tool Eoghan McCarthy (AIRO) Outline What is AIRO The Census in Ireland Building National Mapping Infrastructure Demographic Profiling through
2016 New Ward Boundaries Guidance on calculating statistics for the new 2016 wards
 2016 New Ward Boundaries Page 1 Performance, Information and Intelligence 2016 New Ward Boundaries Guidance on calculating statistics for the new 2016 wards Briefing Note Version 2 - March 2016 2016 New
Correspondence: Kamarul Ismail (
 GEOGRAFIA Online TM Malaysian Journal of Society and Space 12 issue 6 (34-42) 34 Improving the tool for analyzing Malaysia s demographic change: Data standardization analysis to form geo-demographics classification
Geography and Usability of the American Community Survey. Seth Spielman Assistant Professor of Geography University of Colorado
 Geography and Usability of the American Community Survey Seth Spielman Assistant Professor of Geography University of Colorado Goals 1. To convince you that the margins of error from the American Community
Urbanisation Dynamics in West Africa AFRICAPOLIS I, 2015 UPDATE
 Public Disclosure Authorized Public Disclosure Authorized Urbanisation Dynamics in West Africa 1950 2010 AFRICAPOLIS I, 2015 UPDATE uy François Moriconi-Ebrard, Dominique Harre, Philipp Heinrigs Washington
Applying cluster analysis to 2011 Census local authority data
 Applying cluster analysis to 2011 Census local authority data Kitty.Lymperopoulou@manchester.ac.uk SPSS User Group Conference November, 10 2017 Outline Basic ideas of cluster analysis How to choose variables
Understanding the 2011 Census Geographies December 2012
 Introduction Understanding the 2011 Census Geographies December 2012 10 21 Other useful documents: The release of the 2011 Census results has brought with it some changes to the geographies at which we
Gridded population data for the UK redistribution models and applications
 Gridded population data for the UK redistribution models and applications David Martin 1 1 School of Geography, University of Southampton, Southampton, SO17 1BJ, UK e- mail: D.J.Martin@soton.ac.uk Abstract
The History Behind Census Geography
 The History Behind Census Geography Michael Ratcliffe Geography Division US Census Bureau Tennessee State Data Center August 8, 2017 Today s Presentation A brief look at the history behind some of the
Profiling Burglary in London using Geodemographics. Chris Gale 1, Alex Singleton 2, Paul Longley 1
 Profiling Burglary in London using Geodemographics Chris Gale 1, Alex Singleton 2, Paul Longley 1 1 2 Geodemographic Classifications A Geodemographic Classification: Simplifies a large and complex body
Understanding the modifiable areal unit problem
 Understanding the modifiable areal unit problem Robin Flowerdew School of Geography and Geosciences, University of St Andrews March 2009 Acknowledgements Mick Green (Lancaster) and David Steel (Wollongong),
Defining Metropolitan Regions (MRs): coping with complexity
: coping with complexity") OECD Paris 27 November 2006 Defining Metropolitan Regions (MRs): coping with complexity Mike Coombes CURDS Newcastle University Britain Acknowledgements CURDS colleagues eg. Simon Raybould Past sponsors
OECD Paris 27 November 2006 Defining Metropolitan Regions (MRs): coping with complexity Mike Coombes CURDS Newcastle University Britain Acknowledgements CURDS colleagues eg. Simon Raybould Past sponsors
Geographical Inequalities and Population Change in Britain,
 Geographical Inequalities and Population Change in Britain, 1971-2011 Chris Lloyd, Nick Bearman, Gemma Catney Centre for Spatial Demographics Research, University of Liverpool, UK Email: c.d.lloyd@liverpool.ac.uk
2011 Built-up Areas - Methodology and Guidance
 2011 Built-up Areas - Methodology and Guidance June 2013 Version: 2013 v1 Office for National Statistics 2013 Contents 1. Introduction... 3 2. Methodology... 3 2.1 Identifying built-up areas for the 2011
Census GIS and beyond: a journey in space and time
 Census GIS and beyond: a journey in space and time David Martin, University of Southampton AGI Education Lecture 2011 University College London 2 Overview Two timelines Census GIS: the historical view
Understanding Your Community A Guide to Data
 Understanding Your Community A Guide to Data Alex Lea September 2013 Research and Insight Team LeicestershireCounty Council Understanding Geographies Important to understand the various geographies that
Adding Value to Census Data: Public Sector Applications of the Super Profiles Geodemographic Typology
 Adding Value to Census Data: Public Sector Applications of the Super Profiles Geodemographic Typology Peter J.B. Brown, Alex F.G. Hirschfield and Peter W.J. Batey Abstract This paper reviews a series of
BROOKINGS May
 Appendix 1. Technical Methodology This study combines detailed data on transit systems, demographics, and employment to determine the accessibility of jobs via transit within and across the country s 100
Millennium Cohort Study:
 Millennium Cohort Study: Geographic Identifiers in MCS June 2009 Jon Johnson Centre for Longitudinal Studies Faculty of Policy and Society Institute of Education, University of London Page 1 Introduction
THE USAGE OF GIS APPLICATIONS IN SURVEYS DEPARTMENT. Tools for planning and managing the work of interviewers
 THE USAGE OF GIS APPLICATIONS IN SURVEYS DEPARTMENT Tools for planning and managing the work of interviewers In the Surveys Department, we use the GIS tool for field work. For example: visualization of
Human Population Dynamics CAPT Embedded Task
 Name Per. Assigned Due Human Population Dynamics CAPT Embedded Task Essential Question: What factors influence population growth? The human population has existed for a little more than 500,000 years.
Presented at ESRI Education User Conference, July 6-8, 2001, San Diego, CA
 Presented at ESRI Education User Conference, July 6-8, 2001, San Diego, CA Irina V. Sharkova, Ph.D., Research Assistant Professor Richard Lycan, Ph.D., Senior Research Associate Population Research Center
Census Geography, Geographic Standards, and Geographic Information
 Census Geography, Geographic Standards, and Geographic Information Michael Ratcliffe Geography Division US Census Bureau New Mexico State Data Center Data Users Conference November 19, 2015 Today s Presentation
Mapping UK. David Martin, University of Southampton. Open Data Workshop, Nottingham, 21 June 2011
 Mapping UK population over time David Martin, University of Southampton Open Data Workshop, Nottingham, 21 June 2011 Presentation overview Small area spatial population distributions The time dimension
THE DIFFICULTY OF LINKING TWO DIFFERENTLY AGGREGATED SPATIAL DATASETS: USING A LOOK-UP TABLE TO LINK POSTAL SECTORS AND 1991
 THE DIFFICULTY OF LINKING TWO DIFFERENTLY AGGREGATED SPATIAL DATASETS: USING A LOOK-UP TABLE TO LINK POSTAL SECTORS AND 1991 CENSUS ENUMERATION DISTRICTS Daniel Vickers School of Geography University of
Exploring the Impact of Ambient Population Measures on Crime Hotspots
 Exploring the Impact of Ambient Population Measures on Crime Hotspots Nick Malleson School of Geography, University of Leeds http://nickmalleson.co.uk/ N.S.Malleson@leeds.ac.uk Martin Andresen Institute
Exploring Digital Welfare data using GeoTools and Grids
 Exploring Digital Welfare data using GeoTools and Grids Hodkinson, S.N., Turner, A.G.D. School of Geography, University of Leeds June 20, 2014 Summary As part of the Digital Welfare project [1] a Java
The Use of Geographic Information Systems (GIS) by Local Governments. Giving municipal decision-makers the power to make better decisions
 by Local Governments. Giving municipal decision-makers the power to make better decisions") The Use of Geographic Information Systems (GIS) by Local Governments Giving municipal decision-makers the power to make better decisions Case Study: Examples of GIS Usage by Local Governments in North
The Use of Geographic Information Systems (GIS) by Local Governments Giving municipal decision-makers the power to make better decisions Case Study: Examples of GIS Usage by Local Governments in North
An Open Source Geodemographic Classification of Small Areas In the Republic of Ireland Chris Brunsdon, Martin Charlton, Jan Rigby
 An Open Source Geodemographic Classification of Small Areas In the Republic of Ireland Chris Brunsdon, Martin Charlton, Jan Rigby National Centre for Geocomputation National University of Ireland, Maynooth
Geodemographic segmentation systems for
 S34 S4ournal of Epidemiology and Community Health 1995;49(Suppl 2):S34-S38 School of Geography, Leeds University, Leeds LS2 9JT S Openshaw M Blake Correspondence to: Professor S Openshaw. Geodemographic
Introduction to Geographic Information Science. Updates/News. Last Lecture 1/23/2017. Geography 4103 / Spatial Data Representations
 Geography 4103 / 5103 Introduction to Geographic Information Science Spatial Data Representations Updates/News Waitlisted students First graded lab this week: skills learning Instructional labs vs. independence
Second High Level Forum on GGIM Seminar on Regional Cooperation in Geospatial Information Management Doha, Qatar, 7 February 2013
 Second High Level Forum on GGIM Seminar on Regional Cooperation in Geospatial Information Management Doha, Qatar, 7 February 2013 Overview on Geospatial Activities in Egypt BY : Eng.Nahla Seddik Mohamed
Profiling Burglary in London using Geodemographics
 Profiling Burglary in London using Geodemographics C G Gale *1, A D Singleton 2 and P A Longley 3 1 UCL Department of Civil, Environmental & Geomatic Engineering 2 University of Liverpool Department of
B R E X I T, M I G R AT I O N A N D T H E W O R K F O R C E
 H E A L T H W E A L T H C A R E E R B R E X I T, M I G R AT I O N A N D T H E W O R K F O R C E U S I N G M E R C E R W O R K F O R C E M O N I T O R I N S I G H T S T O B E AT A S K I L L S C R I S I
Preparing Spatial Data
 13 CHAPTER 2 Preparing Spatial Data Assessing Your Spatial Data Needs 13 Assessing Your Attribute Data 13 Determining Your Spatial Data Requirements 14 Locating a Source of Spatial Data 14 Performing Common
Tuesday 6:30 9:30 (First/Last classes) Home Phone: SYLLABUS. I. Focus of Course
 Home Phone: SYLLABUS. I. Focus of Course") PSC 560-G Stephen Sherman GIS in Public Administration Political Science Dept. Summer, First Session, 2014 Work Phone: 373-4503 (Tue & Thur) Tuesday 6:30 9:30 (First/Last classes) Home Phone: 375-5328
PSC 560-G Stephen Sherman GIS in Public Administration Political Science Dept. Summer, First Session, 2014 Work Phone: 373-4503 (Tue & Thur) Tuesday 6:30 9:30 (First/Last classes) Home Phone: 375-5328
APPLIED FIELDWORK ENQUIRY SAMPLE ASSESSMENT MATERIALS
 GCSE GEOGRAPHY B Sample Assessment Materials 85 GCSE GEOGRAPHY B COMPONENT 3 APPLIED FIELDWORK ENQUIRY SAMPLE ASSESSMENT MATERIALS 1 hour 30 minutes For examiner s use only SPaG Part A 18 0 Part B 18 0
Data Matrix User Guide
 Data Matrix User Guide 1. Introduction The 2017 Data Matrix is designed to support the 2017 iteration of the Regional Skills Assessments (RSAs) in Scotland. The RSAs align with the Regional Outcome Agreement
Population 24/7 Download: User Guide. Purpose
 Population 24/7 Download: User Guide Purpose The Population 24/7 Download application is designed to enable a user to navigate around a map of England and Wales; select an area of interest represented
SPATIAL INEQUALITIES IN PUBLIC TRANSPORT AVAILABILITY: INVESTIGATION WITH SMALL-AREA METRICS
 SPATIAL INEQUALITIES IN PUBLIC TRANSPORT AVAILABILITY: INVESTIGATION WITH SMALL-AREA METRICS Research conducted by Yeran Sun and Piyushimita (Vonu) Thakuriah Presented by Obinna C.D. Anejionu INTRODUCTION
Brazil Paper for the. Second Preparatory Meeting of the Proposed United Nations Committee of Experts on Global Geographic Information Management
 Brazil Paper for the Second Preparatory Meeting of the Proposed United Nations Committee of Experts on Global Geographic Information Management on Data Integration Introduction The quick development of
Evaluation of automated maintenance procedures
 Evaluation of automated maintenance procedures Samantha Cockings and Andrew Harfoot School of Geography University of Southampton September 2010 Produced by the Census2011Geog project (ESRC Census Programme
GLA small area population projection methodology
 Update 2017-04 GLA small area population projection methodology 2015-based projections February 2017 Introduction The GLA produces a range of annually updated demographic projections for London. Among
Key Issue 1: Where Are Services Distributed? INTRODUCING SERVICES AND SETTLEMENTS LEARNING OUTCOME DESCRIBE THE THREE TYPES OF SERVICES
 Revised 2017 NAME: PERIOD: Rubenstein: The Cultural Landscape (12 th edition) Chapter Twelve Services and Settlements (pages 430 thru 457) This is the primary means by which you will be taking notes this
DRAFT RURAL-URBAN POPULATION CHANGE IN PUERTO RICO, 1990 TO 2000
 DRAFT RURAL-URBAN POPULATION CHANGE IN PUERTO RICO, 1990 TO 2000 Mei-Ling Freeman Geographic Standards and Criteria Branch Geography Division US Census Bureau For presentation at the Western Regional Science
LEHMAN COLLEGE OF THE CITY UNIVERSITY OF NEW YORK. 1. Type of Change: Change in Degree Requirements
 Alpha Number: Hegis Code 1214 Program Code: 30600 1. Type of Change: Change in Degree Requirements 2. From: [The curriculum consists of 45 graduate credits and includes core courses, an area of specialization,
EXPLORATORY SPATIAL DATA ANALYSIS OF BUILDING ENERGY IN URBAN ENVIRONMENTS. Food Machinery and Equipment, Tianjin , China
 EXPLORATORY SPATIAL DATA ANALYSIS OF BUILDING ENERGY IN URBAN ENVIRONMENTS Wei Tian 1,2, Lai Wei 1,2, Pieter de Wilde 3, Song Yang 1,2, QingXin Meng 1 1 College of Mechanical Engineering, Tianjin University
Labour Market Areas in Italy. Sandro Cruciani Istat, Italian National Statistical Institute Directorate for territorial and environmental statistics
 Labour Market Areas in Italy Sandro Cruciani Istat, Italian National Statistical Institute Directorate for territorial and environmental statistics Workshop on Developing European Labour Market Areas Nuremberg,
Hennig, B.D. and Dorling, D. (2014) Mapping Inequalities in London, Bulletin of the Society of Cartographers, 47, 1&2,
 Mapping Inequalities in London, Bulletin of the Society of Cartographers, 47, 1&2,") Hennig, B.D. and Dorling, D. (2014) Mapping Inequalities in London, Bulletin of the Society of Cartographers, 47, 1&2, 21-28. Pre- publication draft without figures Mapping London using cartograms The
Hennig, B.D. and Dorling, D. (2014) Mapping Inequalities in London, Bulletin of the Society of Cartographers, 47, 1&2, 21-28. Pre- publication draft without figures Mapping London using cartograms The
Empowering Local Health through GIS
 Empowering Local Health through GIS Mapping data from Washington s Immunization Information System (IIS). Presented to IACW October 16 th, 2013 by: Chris Halsell and Isaiah Berg Agenda IIS Overview Why
Louisiana Transportation Engineering Conference. Monday, February 12, 2007
 Louisiana Transportation Engineering Conference Monday, February 12, 2007 Agenda Project Background Goal of EIS Why Use GIS? What is GIS? How used on this Project Other site selection tools I-69 Corridor
Improving TIGER, Hidden Costs: The Uncertain Correspondence of 1990 and 2010 U.S. Census Geography
 Improving TIGER, Hidden Costs: The Uncertain Correspondence of 1990 and 2010 U.S. Census Geography Jonathan P. Schroeder ABSTRACT: The U.S. Census Bureau supplies GIS-compatible definitions of census geographic
The Spatial Structure of Cities: International Examples of the Interaction of Government, Topography and Markets
 Module 2: Spatial Analysis and Urban Land Planning The Spatial Structure of Cities: International Examples of the Interaction of Government, Topography and Markets Alain Bertaud Urbanist Summary What are
DataShine Automated Thematic Mapping of 2011 Census Quick Statistics
 DataShine Automated Thematic Mapping of 2011 Census Quick Statistics Oliver O Brien, James Cheshire Department of Geography University College London UKDS Census Applications Conference, July 2015 Contents
A Note on Methods. ARC Project DP The Demand for Higher Density Housing in Sydney and Melbourne Working Paper 3. City Futures Research Centre
 A Note on Methods ARC Project DP0773388 The Demand for Higher Density Housing in Sydney and Melbourne Working Paper 3 City Futures Research Centre February 2009 A NOTE ON METHODS Dr Raymond Bunker, Mr
Colm O Muircheartaigh
 THERE AND BACK AGAIN: DEMOGRAPHIC SURVEY SAMPLING IN THE 21 ST CENTURY Colm O Muircheartaigh, University of Chicago Page 1 OVERVIEW History of Demographic Survey Sampling 20 th Century Sample Design New
A Modified DBSCAN Clustering Method to Estimate Retail Centre Extent
 A Modified DBSCAN Clustering Method to Estimate Retail Centre Extent Michalis Pavlis 1, Les Dolega 1, Alex Singleton 1 1 University of Liverpool, Department of Geography and Planning, Roxby Building, Liverpool
Open Geospatial Data Science for Modelling Commuter Movements and Demographics
 Open Geospatial Data Science for Modelling Commuter Movements and Demographics Lorraine Barry Centre for GIS and Geomatics, School of Natural and Built Environment, Queen s University Belfast l.barry@qub.ac.uk
National Statistics 2001 Area Classifications
 National Statistics 2001 Area Classifications John Charlton, ONS see http://neighbourhood.statistics.gov.uk areaclassifications@ons.gov.uk Copyright ONS What are the Area Classifications Summarise 2001
Visualization of Origin- Destination Commuter Flow Using CTPP Data and ArcGIS
 Visualization of Origin- Destination Commuter Flow Using CTPP Data and ArcGIS Research & Analysis Department Southern California Association of Governments 2015 ESRI User Conference l July 23, 2015 l San
Population 24/7. David Martin, University of Southampton
 Population 24/7 David Martin, University of Southampton Demographics User Group 18 March 2011 Presentation overview Acknowledgement: Samantha Cockings and Samuel Leung; ESRC award RES-062-23-181 Small
How Geography Affects Consumer Behaviour The automobile example
 How Geography Affects Consumer Behaviour The automobile example Murtaza Haider, PhD Chuck Chakrapani, Ph.D. We all know that where a consumer lives influences his or her consumption patterns and behaviours.
ALL will be able to describe the best weather needed to play three sports.
 Resource developed by Martin Sutton, Maiden Erlegh School, Reading ALL will be able to describe the best weather needed to play three sports. MOST will be able to use websites to collect weather data to
School of Geography and Geosciences. Head of School Degree Programmes. Programme Requirements. Modules. Geography and Geosciences 5000 Level Modules
 School of Geography and Geosciences Head of School Degree Programmes Graduate Diploma: Dr W E Stephens Health Geography Research Environmental History and Policy (see School of History) M.Res.: M.Litt.:
STATE GEOGRAPHIC INFORMATION DATABASE
 STATE GEOGRAPHIC INFORMATION DATABASE Data Information and Knowledge Management STATE GEOGRAPHIC INFORMATION DATABASE EXECUTIVE SUMMARY Utah has developed one of the most comprehensive statewide GIS resources
Population Profiles
 U N D E R S T A N D I N G A N D E X P L O R I N G D E M O G R A P H I C C H A N G E MAPPING AMERICA S FUTURES, BRIEF 6 2000 2010 Population Profiles Atlanta, Las Vegas, Washington, DC, and Youngstown Allison
Is the Glass Ceiling Cracking?: A Simple Test
 Is the Glass Ceiling Cracking?: A Simple Test Ting Hu Business School, Tulane University Myeong-Su Yun Economics, Tulane University Keywords: glass ceiling, executive compensation, gender gap, top rank
The Church Demographic Specialists
 The Church Demographic Specialists Easy-to-Use Features Map-driven, Web-based Software An Integrated Suite of Information and Query Tools Providing An Insightful Window into the Communities You Serve Key
Environmental Analysis, Chapter 4 Consequences, and Mitigation
 Environmental Analysis, Chapter 4 4.17 Environmental Justice This section summarizes the potential impacts described in Chapter 3, Transportation Impacts and Mitigation, and other sections of Chapter 4,
Lessons Learned from the production of Gridded Population of the World Version 4 (GPW4) Columbia University, CIESIN, USA EFGS October 2014
 Columbia University, CIESIN, USA EFGS October 2014") Lessons Learned from the production of Gridded Population of the World Version 4 (GPW4) Columbia University, CIESIN, USA EFGS October 2014 Gridded Population of the World Gridded (raster) data product
Lessons Learned from the production of Gridded Population of the World Version 4 (GPW4) Columbia University, CIESIN, USA EFGS October 2014 Gridded Population of the World Gridded (raster) data product
INSIDE. Metric Descriptions by Topic Area. Data Sources and Methodology by Topic Area. Technical Appendix
 As part of the Chicago Neighborhoods 2015 (CN2015) project, the Institute for Housing Studies at DePaul University collected data and built metrics to help The Chicago Community Trust and the City of Chicago
Introduction. --- Chapter One --- What Is GIS?
 --- Chapter One --- Introduction What Is GIS? A geographical information system (known as a GIS for short) is a database which allows the user to explore spatial relationships within and between data sets.
Comparing Internal Migration Around the GlobE (IMAGE): The Effects of Scale and Pattern
: The Effects of Scale and Pattern") Comparing Internal Migration Around the GlobE (IMAGE): The Effects of Scale and Pattern International Conference on Population Geographies, 25-28 June 2013 Martin Bell, Elin Charles Edwards 1 John Stillwell,
Comparing Internal Migration Around the GlobE (IMAGE): The Effects of Scale and Pattern International Conference on Population Geographies, 25-28 June 2013 Martin Bell, Elin Charles Edwards 1 John Stillwell,
Dorling fbetw.tex V1-04/12/2012 6:10 P.M. Page xi
 Dorling fbetw.tex V1-04/12/2012 6:10 P.M. Page xi List of figures P.1 Born in England, Scotland or Wales Britain 1981 (four levels each), ward map (wards are used to define most other administrative areas
Assessing the impact of seasonal population fluctuation on regional flood risk management
 Assessing the impact of seasonal population fluctuation on regional flood risk management Alan Smith *1, Andy Newing 2, Niall Quinn 3, David Martin 1 and Samantha Cockings 1 1 Geography and Environment,
Population, Housing and Employment Forecasts. Technical Report
 Population, Housing and Employment Forecasts Technical Report Population, Housing and Employment Forecasts Technical Report Research and Performance April 2013 A report by the Cambridgeshire County Council
IMPACT OF GRIDLINK ON USERS OF ONS POSTCODE LOCATION PRODUCTS
 IMPACT OF GRIDLINK ON USERS OF ONS POSTCODE LOCATION PRODUCTS 1. Introduction 1.1 Gridlink is a high quality postcode-based dataset created by a consortium comprising the Office for National Statistics
Typical information required from the data collection can be grouped into four categories, enumerated as below.
 Chapter 6 Data Collection 6.1 Overview The four-stage modeling, an important tool for forecasting future demand and performance of a transportation system, was developed for evaluating large-scale infrastructure
Summary and Implications for Policy
 Summary and Implications for Policy 1 Introduction This is the report on a background study for the National Spatial Strategy (NSS) regarding the Irish Rural Structure. The main objective of the study
GIS TECHNICIAN I GIS TECHNICIAN II
 GIS TECHNICIAN I GIS TECHNICIAN II CITY OF ROSEVILLE DEFINITION To perform a variety of technical office and field work duties related to the creation and maintenance of maps, tables, graphs and other
Small area analysis and health service research
 Community Medicine (1981) 3, 131 139 Printed in Great Britain 131 Small area analysis and health service research Vera Carstairs Information Services Division, Scottish Health Service Common Services Agency
An Introduction to China and US Map Library. Shuming Bao Spatial Data Center & China Data Center University of Michigan
 An Introduction to China and US Map Library Shuming Bao Spatial Data Center & China Data Center University of Michigan Current Spatial Data Services http://chinadataonline.org China Geo-Explorer http://chinageoexplorer.org
UNCERTAINTY IN THE POPULATION GEOGRAPHIC INFORMATION SYSTEM
 UNCERTAINTY IN THE POPULATION GEOGRAPHIC INFORMATION SYSTEM 1. 2. LIU De-qin 1, LIU Yu 1,2, MA Wei-jun 1 Chinese Academy of Surveying and Mapping, Beijing 100039, China Shandong University of Science and
Mapping the Route Identifying and Consulting with HS2 s Impacted Populations
 Tuesday 6 December 2016 Mapping the Route Identifying and Consulting with HS2 s Impacted Populations Carry Stephenson, Evelyn Robertson SYSTRA Michael Flynn HS2 Summary Study Context and Objectives Methodology
Areal Interpolation Methods using Land Cover and Street Data. Jeff Bourdier GIS Master s s Project Summer 2006
 Areal Interpolation Methods using Land Cover and Street Data Jeff Bourdier GIS Master s s Project Summer 2006 Objective The areal interpolation problem Some variable (here, population) is known in a given
Assessment and management of at risk populations using a novel GIS based UK population database tool
 Safety and Security Engineering 203 Assessment and management of at risk populations using a novel GIS based UK population database tool H. Balmforth 1, H. McManus 1 & A. Fowler 2 1 Health and Safety Laboratory,
Brazil Experience in SDG data production, dissemination and capacity building
 Brazil Experience in SDG data production, dissemination and capacity building Claudio Stenner Coordinator of Geography 4th Meeting of the Working Group on Geospatial Information IAEG-SDG United Nations
THE FUTURE OF FORECASTING AT METROPOLITAN COUNCIL. CTS Research Conference May 23, 2012
 THE FUTURE OF FORECASTING AT METROPOLITAN COUNCIL CTS Research Conference May 23, 2012 Metropolitan Council forecasts Regional planning agency and MPO for Twin Cities metropolitan area Operates regional
Module 10 Summative Assessment
 Module 10 Summative Assessment Activity In this activity you will use the three dimensions of vulnerability that you learned about in this module exposure, sensitivity, and adaptive capacity to assess