WATER RESOURCES AND URBANIZATION Vulnerability and Adaptation in the Context of Climate Variability
|
|
|
- Antony Nicholson
- 5 years ago
- Views:
Transcription
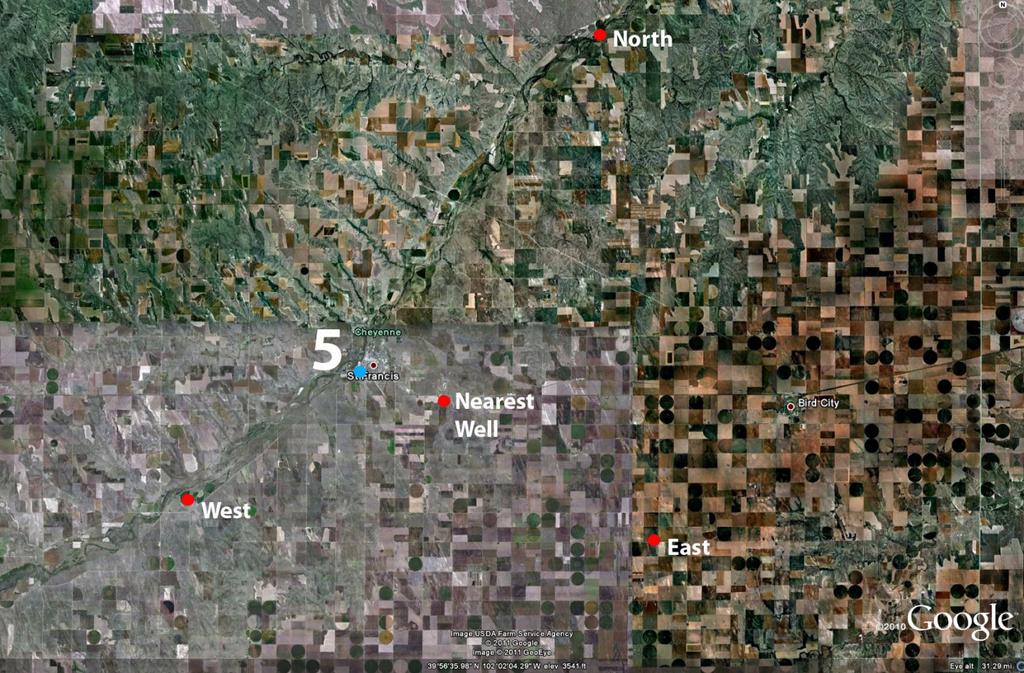
1 WATER RESOURCES AND URBANIZATION Vulnerability and Adaptation in the Context of Climate Variability Krishna Balakrishnan LA 221: Class Project Problem Statement My PhD research focuses on the vulnerability of groundwater resources in Indian cities in the context of climate variability. I am particularly interested in exploring the relevance of conjunctive ground and surface water management in measures for adaptation to climate variability. This class project for LA 221 explores the possibility of creating a GIS model which will help me identify spatial correlation between rainfall trends and groundwater recharge trends. In this class project I shall focus on data from US counties since it is well organized and readily available. Literature Review Cities across the world depend on groundwater to varying extents to meet their requirements. In some parts of the US like the arid West, urban areas have increasingly depended on groundwater since surface water has already been over-allocated (Collins and Bolin, 2007). Over the past decade researchers have increasingly examined vulnerability of urban areas to climate variability (Romero Lankao and Qin, 2011) and in particular the vulnerability of urban areas dependent on groundwater (Green et.al., 2011, Collins and Bolin, 2007). In India, much of the newer urban development is dependent on groundwater to meet domestic needs since public infrastructure planning lags behind the initiative of private capital and housing demands. Using the survey of water utilities completed by the National Institute of Urban Affairs in 2002, Patel and Krishnan (2009) demonstrate that smaller cities are more dependent on groundwater sources for their water supply. In this context it is significant to evaluate the vulnerability of these cities to climate change related variability in precipitation and identify possible adaptation measures. Aquifers provide an opportunity for large scale water storage which may help buffer fluctuation in water availability and conjunctive management of ground and surface water management could be a significant part of climate adaptation strategies. While some urban areas already rely on conjunctive water management for their water supply (Alameda County Water District, 2011) cities like San Francisco are
2 also exploring the possibility of using groundwater to supplement surface water supply in case of climate variability related fluctuations or emergency (SFPUC, 2011). Identification of sources of rechargee would be a critical first step towards the formulation of conjunctive water management proposals. In this class project I propose to address this question using GIS to identify correlation between historic trends of rainfall and groundwater levels. Solution A conceptual model of the proposed solution is provided below:
. The dataset provides county level water consumption data under many heads.")

3 Explanation of Conceptual Model and Results 1. Input U.S. groundwater consumption data at the county level (2005): This data was obtained from the USGS website ( The dataset provides county level water consumption data under many heads. The quantity of interest to this GIS project comes under the head of total public groundwater supply. 2. Classify counties based on dependence of public water supply on groundwater: This was done by creating a new column in the dataset and computing the percentage of groundwater in relation to total public supply. The resulting map is given below: 3. Input rain gauge locations and historic rainfall data: This data was obtained from ( These rain gauges have continuous data from the late nineteenth century till the present day. The map below shows the rain gauge locations superimposed on the map showing county level groundwater dependence of public water supply.
4 4. Select a state with high groundwater dependence and sufficient number of rain gauges: I selected Kansas since it satisfies both the conditions mentioned above, and is also known to lie predominantly on the Ogallala aquifer, while also being at the geographic center of the U.S. Besides, it is also relatively flat, hence limiting influence of topography in groundwater recharge. 5. Input locations and historic data from groundwater monitoring wells: This data was obtained from the USGS website ( mitted_form=intro duction). Since there was a very large amount of data and since the more recent years have relatively better record, I decided to download data for the forty year period from This data had to be reformatted in order to make it usable and this was done using a python script. Using the script I also selected all the wells which have less than 5 years of missing data. This selection was used for all subsequent operations. 6. Perform spatial join of rain gauges with nearest monitoring well and export data to excel: In order to check for correlation between rainfall trends and groundwater level trends, I first performed a spatial join of the rain gauges with the nearest monitoring well and exported the data to excel. The map below shows selected rain gauges and surrounding wells with upto 5 years of data gaps. After exporting it to excel I used a linear regression model to check for correlation between each of the rain gauges and their nearest groundwater monitoring well. In order to do this, the rain gauge measurement data was first converted to a cumulative deviation from mean format. The resulting graphs of rain fall trends and groundwater level trends are shown in the following pages.
5
6
7
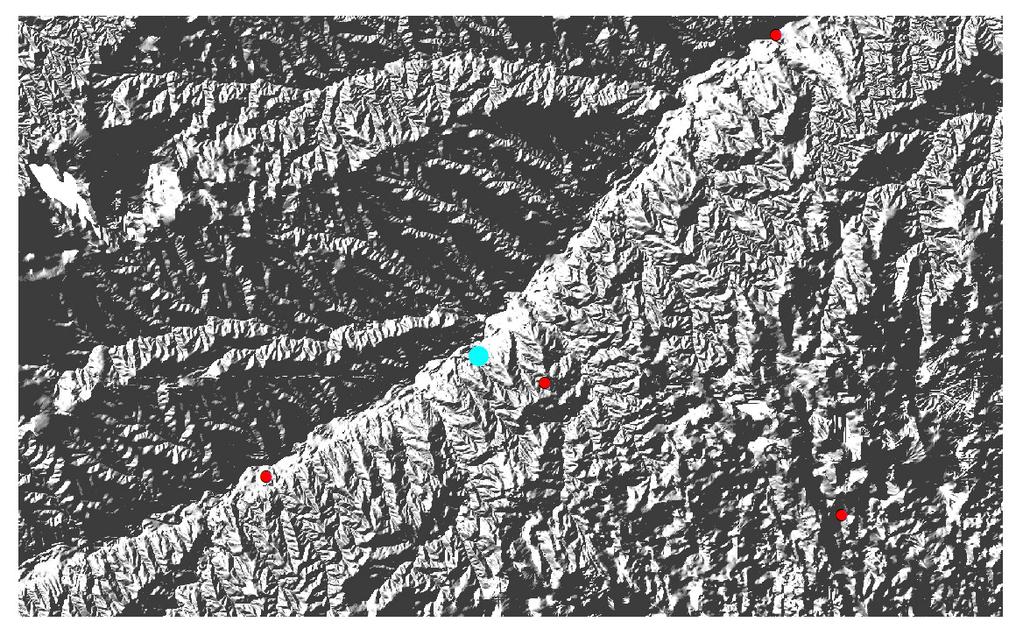
8 7. Identify well and rain gauge pair with strongest correlation: Based on the regression analysis, it is clear that two of the rain gauges and their nearest monitoring wells have relatively high correlation. Rain gauge no.5 which had the highest correlation with its nearest well (Rsquare: 0.8) was selected for more detailed subsequent analysis. 8. Identify other wells near this rain gauge and check for correlation: For this, I visually selected three more wells in the vicinity of the selected rain gauge. The intention was to check whether the groundwater levels in the vicinity of this particular rain gauge is somehow very closely related to the rainfall trend. The results of the correlation analysis is shown below. 9. Input NED data and satellite imagery for the area in which the selected rain gauge and surrounding wells are located: NED data was obtained from the seamless server, while satellite imagery was obtained from Google Earth. I used both of these to further understand local conditions which may be contributing to variation in correlation between the selected rain gauge data and its four surrounding wells. NED imagery and satellite image from Google Earth for the selected area is shown below.
9
10 10. Check for physiographic factors which may explain variation in correlation: Examination of the NED data and satellite imagery shows that the selected rain gauge lies along a stream channel. The selected monitoring wells north and south of the rain gauge are also relatively close to the stream channel and I expected them also to show a high correlation with the rainfall trend, since it is quite possible that rain water conveyed through the stream channel is contributing substantially to groundwater recharge. But there seems to be very little correlation between these wells and the selected rain gauge. The well which is further to the east seems to have even lesser correlation and this could be because, based on the NED dataset and satellite imagery it seems to be within another watershed altogether. Discussion The results show that there can be strong correlation between historic rainfall trends and groundwater levels and this can be identified using GIS. But correlation clearly does not imply causation and to understand the causes one needs to be able to understand other local factors like topography, geology and soil and aquifer conditions. Of these, I was only able to take into account topography using the NED dataset. Besides these local factors, rate of extraction of groundwater and location of these extraction wells are other critical factors which will contribute to trends in groundwater levels. Since the county level water consumption data was available only at 5 year intervals, it was very difficult to understand rate of extraction of groundwater in these areas, while the location of the extraction wells were unavailable due to security considerations. Conclusions The attempt to build a GIS model to evaluate the spatial distribution of correlation between historic rainfall and groundwater level trends was only partly successful. I had to use a combination of excel and GIS to do even the most basic of correlation studies. Besides, much effort went into sorting and reformatting the groundwater level data. Both of these convince me that I need to learn Python well in order to automate the correlation analysis and also to efficiently and quickly reformat and subset the datasets. The study also helped me identify other factors which I need to take into consideration while doing future analysis of such correlation.
11 It should be possible to construct a GIS model in which I automate the process of checking correlation between each rain gauge and the wells around it, probably moving from the closest wells to the farthest. Such a model may help me identify which rain gauges are correlated to which wells and the model might provide many new insights since rainfall in surprisingly distant areas may contribute to groundwater level fluctuations due to the geologic conditions. A model of this nature could be very useful to identify areas which have higher potential for conjunctive water management. References Alameda County Water District. (2011). Niles cone groundwater basin. Retrieved October / 18, 2011, from Collins, T. W., & Bolin, B. (2007). Characterizing vulnerability to water scarcity: The case of a groundwater-dependent, rapidly urbanizing region. Environmental Hazards, 7(4), doi: /j.envhaz Green, T. R., Taniguchi, M., Kooi, H., Gurdak, J. J., Allen, D. M., Hiscock, K. M.,... Aureli, A. (2011). Beneath the surface of global change: Impacts of climate change on groundwater. Journal of Hydrology, 405(3-4), doi: /j.jhydrol Patel, A., & Krishnan, S. (2008). Groundwater situation in urban india: Overview, opportunities and challenges. In U. A. Amarasinghe, T. Shah & R. P. S. Malik (Eds.), Strategic analysis of the national river-linking project of india, series 1: India's water future: Scenarios and issues (pp ). Colombo: International Water Management Institute. Retrieved from df Romero Lankao, P., & Qin, H. (2011). Conceptualizing urban vulnerability to global climate and environmental change. Current Opinion in Environmental Sustainability, 3(3), SFPUC. (2011). San francisco groundwater supply project: Creating local and reliable water sources. Retrieved October/17, 2011, from
Hydrologic Modelling of the Upper Malaprabha Catchment using ArcView SWAT
 Hydrologic Modelling of the Upper Malaprabha Catchment using ArcView SWAT Technical briefs are short summaries of the models used in the project aimed at nontechnical readers. The aim of the PES India
INDIAN INSTITUTE OF SCIENCE STOCHASTIC HYDROLOGY. Course Instructor : Prof. P. P. MUJUMDAR Department of Civil Engg., IISc.
 INDIAN INSTITUTE OF SCIENCE STOCHASTIC HYDROLOGY Course Instructor : Prof. P. P. MUJUMDAR Department of Civil Engg., IISc. Course Contents Introduction to Random Variables (RVs) Probability Distributions
Leon Creek Watershed October 17-18, 1998 Rainfall Analysis Examination of USGS Gauge Helotes Creek at Helotes, Texas
 Leon Creek Watershed October 17-18, 1998 Rainfall Analysis Examination of USGS Gauge 8181400 Helotes Creek at Helotes, Texas Terrance Jackson MSCE Candidate University of Texas San Antonio Abstract The
Designing a Dam for Blockhouse Ranch. Haley Born
 Designing a Dam for Blockhouse Ranch Haley Born CE 394K GIS in Water Resources Term Paper Fall 2011 Table of Contents Introduction... 1 Data Sources... 2 Precipitation Data... 2 Elevation Data... 3 Geographic
DRAFT. REVISED Draft. Paso Robles Subbasin Groundwater Sustainability Plan Chapter 6
 REVISED Draft Paso Robles Subbasin Groundwater Sustainability Plan Chapter 6 Prepared for the Paso Robles Subbasin Cooperative Committee and the Groundwater Sustainability Agencies February 14, 2019 Paso
Development and Land Use Change in the Central Potomac River Watershed. Rebecca Posa. GIS for Water Resources, Fall 2014 University of Texas
 Development and Land Use Change in the Central Potomac River Watershed Rebecca Posa GIS for Water Resources, Fall 2014 University of Texas December 5, 2014 Table of Contents I. Introduction and Motivation..4
Delineation of Groundwater Potential Zone on Brantas Groundwater Basin
 Delineation of Groundwater Potential Zone on Brantas Groundwater Basin Andi Rachman Putra 1, Ali Masduqi 2 1,2 Departement of Environmental Engineering, Sepuluh Nopember Institute of Technology, Indonesia
Water & Climate; Floods & Droughts (The yin & yang of water availablilty) Water & Climate; Floods & Droughts (The yin & yang of water availablilty)
 Water & Climate; Floods & Droughts (The yin & yang of water availablilty)") (Acknowledgment: This presentation was developed in collaboration with ESA, NEON and NCEAS, federal agencies and academic team members from minority serving institutions.) Water & Climate; Floods & Droughts
(Acknowledgment: This presentation was developed in collaboration with ESA, NEON and NCEAS, federal agencies and academic team members from minority serving institutions.) Water & Climate; Floods & Droughts
MISSOURI LiDAR Stakeholders Meeting
 MISSOURI LiDAR Stakeholders Meeting East-West Gateway June 18, 2010 Tim Haithcoat Missouri GIO Enhanced Elevation Data What s different about it? Business requirements are changing.fast New data collection
Management and Sharing of Hydrologic Information of Cache County
 Geographic Information System in Water Resources CEE6440 Fall Semester 2012 Management and Sharing of Hydrologic Information of Cache County To: Dr. David Tarboton Instructor By: Tian Gan Dec.7, 2012 I.
Land subsidence due to groundwater withdrawal in Hanoi, Vietnam
 Land Subsidence (Proceedings of the Fifth International Symposium on Land Subsidence, The Hague, October 1995). 1AHS Publ. no. 234, 1995. 55 Land subsidence due to groundwater withdrawal in Hanoi, Vietnam
The Recent Long Island Drought
 The Recent Long Island Drought David J. Tonjes Department of Technology and Society Stony Brook University david.tonjes@stonybrook.edu Abstract Drought is a qualitatively defined and determined phenomenon.
MODULE 7 LECTURE NOTES 5 DRAINAGE PATTERN AND CATCHMENT AREA DELINEATION
 MODULE 7 LECTURE NOTES 5 DRAINAGE PATTERN AND CATCHMENT AREA DELINEATION 1. Introduction Topography of the river basin plays an important role in hydrologic modelling, by providing information on different
Chapter 6. Fundamentals of GIS-Based Data Analysis for Decision Support. Table 6.1. Spatial Data Transformations by Geospatial Data Types
 Chapter 6 Fundamentals of GIS-Based Data Analysis for Decision Support FROM: Points Lines Polygons Fields Table 6.1. Spatial Data Transformations by Geospatial Data Types TO: Points Lines Polygons Fields
Delineation of high landslide risk areas as a result of land cover, slope, and geology in San Mateo County, California
 Delineation of high landslide risk areas as a result of land cover, slope, and geology in San Mateo County, California Introduction Problem Overview This project attempts to delineate the high-risk areas
A GIS-based Approach to Watershed Analysis in Texas Author: Allison Guettner
 Texas A&M University Zachry Department of Civil Engineering CVEN 658 Civil Engineering Applications of GIS Instructor: Dr. Francisco Olivera A GIS-based Approach to Watershed Analysis in Texas Author:
CHAPTER VII FULLY DISTRIBUTED RAINFALL-RUNOFF MODEL USING GIS
 80 CHAPTER VII FULLY DISTRIBUTED RAINFALL-RUNOFF MODEL USING GIS 7.1GENERAL This chapter is discussed in six parts. Introduction to Runoff estimation using fully Distributed model is discussed in first
IMPACT OF CLIMATE CHANGE OVER THE ARABIAN PENINSULA
 IMPACT OF CLIMATE CHANGE OVER THE ARABIAN PENINSULA By: Talal Alharbi June, 29 2017 1 Motivation: In arid and semi-arid regions of the world the demand for fresh water resources is increasing due to: increasing
Hydrologic and Hydraulic Analyses Using ArcGIS
 Hydrologic and Hydraulic Analyses Using ArcGIS Two day training class Overview ArcGIS and Arc Hydro provide strong foundation for support of hydrologic and hydraulic (H&H) analyses. This two-day course
USING GIS TO MODEL AND ANALYZE HISTORICAL FLOODING OF THE GUADALUPE RIVER NEAR NEW BRAUNFELS, TEXAS
 USING GIS TO MODEL AND ANALYZE HISTORICAL FLOODING OF THE GUADALUPE RIVER NEAR NEW BRAUNFELS, TEXAS ASHLEY EVANS While the state of Texas is well-known for flooding, the Guadalupe River Basin is one of
Dr.Sinisa Vukicevic Dr. Robert Summers
 Dr.Sinisa Vukicevic Dr. Robert Summers "Planning" means the scientific, aesthetic, and orderly disposition of land, resources, facilities and services with a view to securing the physical, economic and
Last Updated HYDROLOGIC ATLAS OF THE BLACK HILLS, PENNINGTON COUNTY, SOUTH DAKOTA
 Last Updated 10-29-2015 HYDROLOGIC ATLAS OF THE BLACK HILLS, PENNINGTON COUNTY, SOUTH DAKOTA INTRODUCTION The following is a brief outline of ground water characteristics in Pennington County, South Dakota.
Graduate Courses Meteorology / Atmospheric Science UNC Charlotte
 Graduate Courses Meteorology / Atmospheric Science UNC Charlotte In order to inform prospective M.S. Earth Science students as to what graduate-level courses are offered across the broad disciplines of
Comparison of GIS based SCS-CN and Strange table Method of Rainfall-Runoff Models for Veeranam Tank, Tamil Nadu, India.
 International Journal of Scientific & Engineering Research, Volume 3, Issue 10, October-2012 1 Comparison of GIS based SCS-CN and Strange table Method of Rainfall-Runoff Models for Veeranam Tank, Tamil
MEMORANDUM. Jerry Conrow, Ojai Basin Groundwater Management Agency
 MEMORANDUM TO: FROM: Jerry Conrow, Ojai Basin Groundwater Management Agency Gregory Schnaar, PhD, Stephen J. Cullen, PhD, PG, DATE: August 6, 2014, 2014 SUBJECT: Ojai Basin Groundwater Model - Extended
Climatic Change Implications for Hydrologic Systems in the Sierra Nevada
 Climatic Change Implications for Hydrologic Systems in the Sierra Nevada Part Two: The HSPF Model: Basis For Watershed Yield Calculator Part two presents an an overview of why the hydrologic yield calculator
Existing NWS Flash Flood Guidance
 Introduction The Flash Flood Potential Index (FFPI) incorporates physiographic characteristics of an individual drainage basin to determine its hydrologic response. In flash flood situations, the hydrologic
ENGRG Introduction to GIS
 ENGRG 59910 Introduction to GIS Michael Piasecki March 17, 2014 Lecture 08: Terrain Analysis Outline: Terrain Analysis Earth Surface Representation Contour TIN Mass Points Digital Elevation Models Slope
Land cover modeling in the Travis County
 Land cover modeling in the Travis County Contents Introduction.1 Data collection 3 Data pre-processing 6 Land cover modeling 12 Final considerations 13 Prepared for: GIS and Water Resources By Julie C
Biodiversity Blueprint Overview
 Biodiversity Blueprint Overview Climate Variability Climate projections for the Glenelg Hopkins Regions suggest that the weather will be hotter and drier in the coming years which will impact on land use,
Flash Flood Guidance System On-going Enhancements
 Flash Flood Guidance System On-going Enhancements Hydrologic Research Center, USA Technical Developer SAOFFG Steering Committee Meeting 1 10-12 July 2017 Jakarta, INDONESIA Theresa M. Modrick Hansen, PhD
Study of Hydrometeorology in a Hard Rock Terrain, Kadirischist Belt Area, Anantapur District, Andhra Pradesh
 Open Journal of Geology, 2012, 2, 294-300 http://dx.doi.org/10.4236/ojg.2012.24028 Published Online October 2012 (http://www.scirp.org/journal/ojg) Study of Hydrometeorology in a Hard Rock Terrain, Kadirischist
Title: High resolution geographical information system for assessing vineyard site suitability
 Title: High resolution geographical information system for assessing vineyard site suitability Progress Report Grant Code: 2009-16 Name(s), mailing and email address(s) of principal investigators: Principle
Effect of land use/land cover changes on runoff in a river basin: a case study
 Water Resources Management VI 139 Effect of land use/land cover changes on runoff in a river basin: a case study J. Letha, B. Thulasidharan Nair & B. Amruth Chand College of Engineering, Trivandrum, Kerala,
INTERNATIONAL JOURNAL OF GEOMATICS AND GEOSCIENCES Volume 2, No 1, 2011
 INTERNATIONAL JOURNAL OF GEOMATICS AND GEOSCIENCES Volume 2, No 1, 2011 Copyright 2010 All rights reserved Integrated Publishing services Research article ISSN 0976 4380 Hypsometric Analysis of Varattaru
GIS feature extraction tools in diverse landscapes
 CE 394K.3 GIS in Water Resources GIS feature extraction tools in diverse landscapes Final Project Anna G. Kladzyk M.S. Candidate, Expected 2015 Department of Environmental and Water Resources Engineering
Using groundwater-flow model results to evaluate a useful 3-D GFM mapping scale
 Topography Geology Hydrology Using groundwater-flow model results to evaluate a useful 3-D GFM mapping scale Sally L. Letsinger, Ph.D., LPG, GISP IU Center for Geospatial Data Analysis, Indiana Geological
Executive Summary. Water Quantity
 Executive Summary Stakeholders in the Rock-Glade Watershed have taken the initiative to proceed with watershed planning as provided by the State of Washington under the Watershed Management Act (Chapter
Application of GIS Technology in Watershed-based Management and Decision Making
 Application of GIS Technology in Watershed-based Management and Decision Making U. Sunday Tim Iowa State University Department of Agricultural and Biosystems Engineering 100 Davidson Hall Email:
Regional Flash Flood Guidance and Early Warning System
 WMO Training for Trainers Workshop on Integrated approach to flash flood and flood risk management 24-28 October 2010 Kathmandu, Nepal Regional Flash Flood Guidance and Early Warning System Dr. W. E. Grabs
Geo-spatial Analysis for Prediction of River Floods
 Geo-spatial Analysis for Prediction of River Floods Abstract. Due to the serious climate change, severe weather conditions constantly change the environment s phenomena. Floods turned out to be one of
Flood Level Simulation Modeling And Vulnerability Of Slums Along Musiriver, Hyderabad
 International Journal of Humanities and Social Science Invention (IJHSSI) ISSN (Online): 2319 7722, ISSN (Print): 2319 7714 Volume 7 Issue 05 Ver. I May. 2018 PP.51-56 Flood Level Simulation Modeling And
Near Real-Time Runoff Estimation Using Spatially Distributed Radar Rainfall Data. Jennifer Hadley 22 April 2003
 Near Real-Time Runoff Estimation Using Spatially Distributed Radar Rainfall Data Jennifer Hadley 22 April 2003 Introduction Water availability has become a major issue in Texas in the last several years,
GIS in Weather and Society
 GIS in Weather and Society Olga Wilhelmi Institute for the Study of Society and Environment National Center for Atmospheric Research WAS*IS November 8, 2005 Boulder, Colorado Presentation Outline GIS basic
4. GIS Implementation of the TxDOT Hydrology Extensions
 4. GIS Implementation of the TxDOT Hydrology Extensions A Geographic Information System (GIS) is a computer-assisted system for the capture, storage, retrieval, analysis and display of spatial data. It
Rainfall variability and uncertainty in water resource assessments in South Africa
 New Approaches to Hydrological Prediction in Data-sparse Regions (Proc. of Symposium HS.2 at the Joint IAHS & IAH Convention, Hyderabad, India, September 2009). IAHS Publ. 333, 2009. 287 Rainfall variability
Dept. of Earth and Environmental Sciences, University of Waterloo, 200 University Ave W, Waterloo, Ontario, Canada, N2L 3G1 2
 A modelling strategy to develop a regional Quaternary geological model across rural and urban areas and administrative borders using existing geological information M. Ross 1, M. Parent 2, A. Taylor 1
flow and ways: a storm
 Flow Tell Us? Chicago River Classroom Activity Summary In this lesson, students will examine historic stream flow data to understand how stream flow has changed over time. Students will then hypothesize
CHANGE DETECTION USING REMOTE SENSING- LAND COVER CHANGE ANALYSIS OF THE TEBA CATCHMENT IN SPAIN (A CASE STUDY)
") CHANGE DETECTION USING REMOTE SENSING- LAND COVER CHANGE ANALYSIS OF THE TEBA CATCHMENT IN SPAIN (A CASE STUDY) Sharda Singh, Professor & Programme Director CENTRE FOR GEO-INFORMATICS RESEARCH AND TRAINING
CHANGE DETECTION USING REMOTE SENSING- LAND COVER CHANGE ANALYSIS OF THE TEBA CATCHMENT IN SPAIN (A CASE STUDY) Sharda Singh, Professor & Programme Director CENTRE FOR GEO-INFORMATICS RESEARCH AND TRAINING
Temporal variability in the isotopic composition of meteoric water in Christchurch, New Zealand; Can we create reliable isoscapes?
 1 2 3 4 5 6 7 8 9 10 11 12 13 14 15 16 17 18 19 20 21 22 23 24 25 26 27 28 29 30 31 Temporal variability in the isotopic composition of meteoric water in Christchurch, New Zealand; Can we create reliable
ENGRG Introduction to GIS
 ENGRG 59910 Introduction to GIS Michael Piasecki November 17, 2017 Lecture 11: Terrain Analysis Outline: Terrain Analysis Earth Surface Representation Contour TIN Mass Points Digital Elevation Models Slope
PRELIMINARY ASSESSMENT OF SURFACE WATER RESOURCES - A STUDY FROM DEDURU OYA BASIN OF SRI LANKA
 PRELIMINARY ASSESSMENT OF SURFACE WATER RESOURCES - A STUDY FROM DEDURU OYA BASIN OF SRI LANKA THUSHARA NAVODANI WICKRAMAARACHCHI Hydrologist, Water Resources Secretariat of Sri Lanka, Room 2-125, BMICH,
USING GIS CARTOGRAPHIC MODELING TO ANALYSIS SPATIAL DISTRIBUTION OF LANDSLIDE SENSITIVE AREAS IN YANGMINGSHAN NATIONAL PARK, TAIWAN
 CO-145 USING GIS CARTOGRAPHIC MODELING TO ANALYSIS SPATIAL DISTRIBUTION OF LANDSLIDE SENSITIVE AREAS IN YANGMINGSHAN NATIONAL PARK, TAIWAN DING Y.C. Chinese Culture University., TAIPEI, TAIWAN, PROVINCE
Objectives: After completing this assignment, you should be able to:
 Data Analysis Assignment #1 Evaluating the effects of watershed land use on storm runoff Assignment due: 21 February 2013, 5 pm Objectives: After completing this assignment, you should be able to: 1) Calculate
Atlas of the Upper Gila River Watershed
 Atlas of the Upper Gila River Watershed Katie Banister, David Chan, Jessica M. Driscoll, Christopher Fullerton, Aaron Lien and Kelly Mott Lacroix January 2014 The University of Arizona Water Resources
Grant 0299-NEP: Water Resources Project Preparatory Facility
 Document Produced under Grant Project Number: 45206 May 2016 Grant 0299-NEP: Water Resources Project Preparatory Facility Final Report Volume 3 East Rapti (1 of 9) Prepared by Pvt. Ltd. For Ministry of
3D Modelling of the Uppsala Esker
 3D Modelling of the Uppsala Esker Eva Jirner (SGU) Duncan McConnachie (WSP Sweden) 2017-05-31 ISO/TC211 Geographic Information/Geomatics A collabrative effort Orientation 3 Background Uppsala municiaplity
Ground Water Protection Council 2017 Annual Forum Boston, Massachusetts. Ben Binder (303)
") Ground Water Protection Council 2017 Annual Forum Boston, Massachusetts Protecting Groundwater Sources from Flood Borne Contamination Ben Binder (303) 860-0600 Digital Design Group, Inc. The Problem Houston
Ground Water Protection Council 2017 Annual Forum Boston, Massachusetts Protecting Groundwater Sources from Flood Borne Contamination Ben Binder (303) 860-0600 Digital Design Group, Inc. The Problem Houston
STATE GEOGRAPHIC INFORMATION DATABASE
 STATE GEOGRAPHIC INFORMATION DATABASE Data Information and Knowledge Management STATE GEOGRAPHIC INFORMATION DATABASE EXECUTIVE SUMMARY Utah has developed one of the most comprehensive statewide GIS resources
Appendix J Vegetation Change Analysis Methodology
 Appendix J Vegetation Change Analysis Methodology Regional Groundwater Storage and Recovery Project Draft EIR Appendix-J April 2013 APPENDIX J- LAKE MERCED VEGETATION CHANGE ANALYSIS METHODOLOGY Building
Subject Area: Geography
 Long Term Planning Overview Key Stage 3 Subject Area: Geography Academic : 08-9 7 Assessment Your Island Home the physical and human geography of the UK and will investigate weather patterns, population
Coastal Flooding in Brevard County, Florida
 Helen Gerlach CE 394K.3 December 4, 2015 Coastal Flooding in Brevard County, Florida Introduction My project was to create a model of the coastal flooding that occurred in Brevard County, Florida in August
A Cloud-Based Flood Warning System For Forecasting Impacts to Transportation Infrastructure Systems
 A Cloud-Based Flood Warning System For Forecasting Impacts to Transportation Infrastructure Systems Jon Goodall Associate Professor, Civil and Environmental Engineering Associate Director, Link Lab April
Streams in the Ranching Country of South Texas
 Streams in the Ranching Country of South Texas Watershed Analysis of HUC 12110207 Sandranell Moerbe CE GIS in Water Resources Fall 2015 INTRODUCTION This project investigates the portion of South Texas
Natural hazards in Glenorchy Summary Report May 2010
 Natural hazards in Glenorchy Summary Report May 2010 Contents Glenorchy s hazardscape Environment setting Flood hazard Earthquakes and seismic hazards Hazards Mass movement Summary Glossary Introduction
CAUSES FOR CHANGE IN STREAM-CHANNEL MORPHOLOGY
 CAUSES FOR CHANGE IN STREAM-CHANNEL MORPHOLOGY Chad A. Whaley, Department of Earth Sciences, University of South Alabama, MobileAL, 36688. E-MAIL: caw408@jaguar1.usouthal.edu The ultimate goal of this
8 th 12 th Designing a Monitoring Plan Mapping & Analysis (Activities 1 2)
") 8 th 12 th Designing a Monitoring Plan Mapping & Analysis (Activities 1 2) Objectives for All Activities - To be able to define and describe the purpose and uses of topographic maps. - To define rules
8 th 12 th Designing a Monitoring Plan Mapping & Analysis (Activities 1 2) Objectives for All Activities - To be able to define and describe the purpose and uses of topographic maps. - To define rules
Spatial Optimization of CoCoRAHS Network in Tennessee. Joanne Logan Department of Biosystems Engineering and Soil Science University of Tennessee
 Spatial Optimization of CoCoRAHS Network in Tennessee Joanne Logan Department of Biosystems Engineering and Soil Science University of Tennessee Abstract CoCoRaHS (Community Collaborative Rain, Hail and
Excel Geomatics: Offering Excellence with Unique Consultancy & Services
 Excel Geomatics: Offering Excellence with Unique Consultancy & Services Providing consultancy and value Added Services using Remote Sensing, Photogrammetry and LiDAR in areas such as Agriculture, Forestry,
GIS for ChEs Introduction to Geographic Information Systems
 GIS for ChEs Introduction to Geographic Information Systems AIChE Webinar John Cirucci 1 GIS for ChEs Introduction to Geographic Information Systems What is GIS? Tools and Methods Applications Examples
Paper presented in the Annual Meeting of Association of American Geographers, Las Vegas, USA, March 2009 ABSTRACT
 Paper presented in the Annual Meeting of Association of American Geographers, Las Vegas, USA, March 2009 ABSTRACT CHANGING GEOMORPHOLOGY OF THE KOSI RIVER SYSTEM IN THE INDIAN SUBCONTINENT Nupur Bose,
Mapping Water Resources and Reservoirs for Climate Resilience in Zambezi River Basin
 Mapping Water Resources and Reservoirs for Climate Resilience in Zambezi River Basin Corné van der Sande, NEO BV Senior Advisor Earth Observation Services for Monitoring Drought and Water Resources in
REMOTE SENSING AND GEOSPATIAL APPLICATIONS FOR WATERSHED DELINEATION
 REMOTE SENSING AND GEOSPATIAL APPLICATIONS FOR WATERSHED DELINEATION Gaurav Savant (gaurav@engr.msstate.edu) Research Assistant, Department of Civil Engineering, Lei Wang (lw4@ra.msstate.edu) Research
Management of Natural and Environmental Resources for Sustainable Agricultural Development
 World Meteorological Organization (WMO) Management of Natural and Environmental Resources for Sustainable Agricultural Development Use of the Object Modeling System for Operational Water Supply Forecasting
Land Cover and Soil Properties of the San Marcos Subbasin
 Land Cover and Soil Properties of the San Marcos Subbasin Cody McCann EWRE Graduate Studies December 6, 2012 Table of Contents Project Background............................................................
Analysis of Meteorological drought condition for Bijapur region in the lower Bhima basin, India
 Analysis of Meteorological drought condition for Bijapur region in the lower Bhima basin, India Mamatha.K PG Student Department of WLM branch VTU, Belagavi Dr. Nagaraj Patil Professor and Head of the Department
Water Supply Outlook. Interstate Commission on the Potomac River Basin (ICPRB) 30 W. Gude Drive, Suite 450 Rockville, MD Tel: (301)
 30 W. Gude Drive, Suite 450 Rockville, MD Tel: (301)") Water Supply Outlook June 2, 2016 To subscribe: please email aseck@icprb.org Interstate Commission on the Potomac River Basin (ICPRB) 30 W. Gude Drive, Suite 450 Rockville, MD 20850 Tel: (301) 274-8120
Water Supply Outlook June 2, 2016 To subscribe: please email aseck@icprb.org Interstate Commission on the Potomac River Basin (ICPRB) 30 W. Gude Drive, Suite 450 Rockville, MD 20850 Tel: (301) 274-8120
sea levels 100 year/ payments. FIGURE 1
 MIAMI DADE COUNTY CLIMATE INDICATORS RAINFALL SUMMARY Much of Miami Dade County is susceptible to localized flooding, particularly during the rainy season of June through October. The County s flat terrain
Section 4: Model Development and Application
 Section 4: Model Development and Application The hydrologic model for the Wissahickon Act 167 study was built using GIS layers of land use, hydrologic soil groups, terrain and orthophotography. Within
Louisiana Transportation Engineering Conference. Monday, February 12, 2007
 Louisiana Transportation Engineering Conference Monday, February 12, 2007 Agenda Project Background Goal of EIS Why Use GIS? What is GIS? How used on this Project Other site selection tools I-69 Corridor
Integrated GIS based approach in mapping the groundwater potential zones in Kota Kinabalu, Sabah, Malaysia
 Integrated GIS based approach in mapping the groundwater potential zones in Kota Kinabalu, Sabah, Malaysia Zulherry Isnain and Juhari Mat Akhir Faculty of Science and Natural Resources, Universiti Malaysia
ESTIMATING SNOWMELT CONTRIBUTION FROM THE GANGOTRI GLACIER CATCHMENT INTO THE BHAGIRATHI RIVER, INDIA ABSTRACT INTRODUCTION
 ESTIMATING SNOWMELT CONTRIBUTION FROM THE GANGOTRI GLACIER CATCHMENT INTO THE BHAGIRATHI RIVER, INDIA Rodney M. Chai 1, Leigh A. Stearns 2, C. J. van der Veen 1 ABSTRACT The Bhagirathi River emerges from
GOVERNMENT OF NEPAL MINISTRY OF IRRIGATION GROUND WATER RESOURCES DEVELOPMENT BOARD BABARMAHAL, KATHMANDU, NEPAL
 GOVERNMENT OF NEPAL MINISTRY OF IRRIGATION GROUND WATER RESOURCES DEVELOPMENT BOARD BABARMAHAL, KATHMANDU, NEPAL GIS Based Updating of Groundwater Level Siraha District Final Report Submitted to Ground
Department of Geography: Vivekananda College for Women. Barisha, Kolkata-8. Syllabus of Post graduate Course in Geography
 India: Regional Problems and Resource management Module 11 (Full Marks 50) Unit I: Region and Regionalisation 1.1 Various bases of regionalisation of India; problems of identification and delineation.
Multi-scale modeling of species distributions, hydrology, & gene flow
 Multi-scale modeling of species distributions, hydrology, & gene flow Douglas R. Leasure PhD. Candidate University of Arkansas Department of Biological Sciences BIG data in GIS http://www.gap.uidaho.edu/portal/datadownload.html
Model Calibration and Forecast Error for NFIE-Hydro
 Corey Van Dyk C E 397 Flood Forecasting 5/8/15 Model Calibration and Forecast Error for NFIE-Hydro Introduction The forecasting component of the National Flood Interoperability Experiment (NFIE), like
NRC Workshop - Probabilistic Flood Hazard Assessment Jan 2013
 Regional Precipitation-Frequency Analysis And Extreme Storms Including PMP Current State of Understanding/Practice Mel Schaefer Ph.D. P.E. MGS Engineering Consultants, Inc. Olympia, WA NRC Workshop - Probabilistic
URBAN WATERSHED RUNOFF MODELING USING GEOSPATIAL TECHNIQUES
 URBAN WATERSHED RUNOFF MODELING USING GEOSPATIAL TECHNIQUES DST Sponsored Research Project (NRDMS Division) By Prof. M. GOPAL NAIK Professor & Chairman, Board of Studies Email: mgnaikc@gmail.com Department
UK Flooding Feb 2003
 UK Flooding 2000 06 Feb 2003 Britain has taken a battering from floods in the last 5 years, with major events in 1998 and 2000, significant floods in 2001 and minor events in each of the other years. So
Role of Arc GIS in developing Real Time and Forecasting Water Resource System ANMOL BHARDWAJ 1, ANIL VYAS 2 1
 Role of Arc GIS in developing Real Time and Forecasting Water Resource System ANMOL BHARDWAJ 1, ANIL VYAS 2 1 Project Associate, Indian Institute of Technology Roorkee 2 ADE National Hydrology Project,
Use of PRISM Data. for Precipitation Estimates. in ESPAM2 AS BUILT
 Use of PRISM Data for Precipitation Estimates in ESPAM2 AS BUILT Prepared by Idaho Water Resources Research Institute In fulfillment of the Water-Budget Component Precipitation of Contract # CON00803 for
Appendix D. Sediment Texture and Other Soil Data
 5 6 7 8 Appendix D. Sediment Texture and Other Soil Data This appendix describes the sediment texture of the aquifer system in the Restoration Area. The contents of this appendix describe the: Importance
Introducing IMS. v) Select the Zoom to Full Extent tool. Did you return to the original view?
 Select the Zoom to Full Extent tool. Did you return to the original view?") Ocean/ENVIR 260, Winter 2006 Lab 1, Get to Know the Puget Sound Watershed Name Introducing IMS 1) Open your web browser and navigate to http://128.208.23.127/website/lab1. (This link can be found on the
Ocean/ENVIR 260, Winter 2006 Lab 1, Get to Know the Puget Sound Watershed Name Introducing IMS 1) Open your web browser and navigate to http://128.208.23.127/website/lab1. (This link can be found on the
Dr. S.SURIYA. Assistant professor. Department of Civil Engineering. B. S. Abdur Rahman University. Chennai
 Hydrograph simulation for a rural watershed using SCS curve number and Geographic Information System Dr. S.SURIYA Assistant professor Department of Civil Engineering B. S. Abdur Rahman University Chennai
COUPLED SURFACE WATER-GROUNDWATER MODEL TO ANALYZE SUSTAINABILITY OF THE ATASCADERO SUBBASIN. A Thesis presented to
 COUPLED SURFACE WATER-GROUNDWATER MODEL TO ANALYZE SUSTAINABILITY OF THE ATASCADERO SUBBASIN A Thesis presented to the Faculty of California Polytechnic State University, San Luis Obispo In Partial Fulfillment
Watershed Modeling With DEMs
 Watershed Modeling With DEMs Lesson 6 6-1 Objectives Use DEMs for watershed delineation. Explain the relationship between DEMs and feature objects. Use WMS to compute geometric basin data from a delineated
Internet GIS Sites. 2 OakMapper webgis Application
 Internet GIS Sites # Name URL Description 1 City of Sugar Land http://www.sugarlandtx.gov/index.htm It is a city in Texas with 65,000 Residents. The City of Sugar Land, Texas, provides ArcIMS-based maps
APPLICATION OF LAND CHANGE MODELER FOR PREDICTION OF FUTURE LAND USE LAND COVER A CASE STUDY OF VIJAYAWADA CITY
 APPLICATION OF LAND CHANGE MODELER FOR PREDICTION OF FUTURE LAND USE LAND COVER A CASE STUDY OF VIJAYAWADA CITY K. Sundara Kumar 1, Dr. P. Udaya Bhaskar 2, Dr. K. Padmakumari 3 1 Research Scholar, 2,3
A Comparison of Rainfall Estimation Techniques
 A Comparison of Rainfall Estimation Techniques Barry F. W. Croke 1,2, Juliet K. Gilmour 2 and Lachlan T. H. Newham 2 SUMMARY: This study compares two techniques that have been developed for rainfall and
Large Alberta Storms. March Introduction
 Large Alberta Storms Introduction Most of the largest runoff events in Alberta have been in response to large storms. Storm properties, such as location, magnitude, and geographic and temporal distribution