Hydrodynamic changes in the Agulhas Current and associated changes in the Indian and Atlantic Ocean
|
|
|
- Leslie Dennis
- 5 years ago
- Views:
Transcription
1 Hydrodynamic changes in the Agulhas Current and associated changes in the Indian and Atlantic Ocean Mathieu Rouault Department of Oceanography, Mare Institute, University of Cape Town Nansen-Tutu Center for Marine Environment, South Africa Contributions from Pierrick Penven, Benjamin Pohl, Bjorn Backeberg Sea surface temperature estimated by AVHRR aboard NOAA (1x1 km resolution) Funding from WRC, ACCESS, Nansen-Tutu Center

2 Mean AVHRR Pathfinder 4x4 km sea surface temperature and merged altimetry derived geostrophic currents
")
3 Sequence of weekly mean TMI TRMM sea surface temperature showing an unusual early retroflection of the Agulhas Current at a position more eastward and northwards than normal. Warm Agulhas water eventually re-enter the current. Data is shown each week from the last week of January 2001 to the first week of March 2001 (Rouault and Lutjeharms, 2003)
4

5 Siedler G, M Rouault, A Biastoch, B Backeberg, C J.C. Reason, and J. R. E. Lutjeharms 2009 Modes of the southern extension of the East Madagascar Current, JGR Ocean

6 Altimetry derived geostrophic currents averaged over five years from August 2001 to May 2006 showing the newly documented South Indian Counter Current and the related retroflection South of Madagascar. The magenta dots indicate the positions of the WOCE stations used for transport calculations (Siedler et al, 2009)
7 Change in sea surface temperature from 1985 to 2007 in C per 10-year using 4 km resolution AVHRR only. Superimposed is the mean ocean current (yellow to red: warming, green blue: cooling)

8 Net heat budget at the sea surface = latent heat and sensible (WHOI OA Fluxes) +shortwave and longwave radiative fluxes (ISCCP) from at 1 deg resolution Longwave=incoming longwave-outgoing longwave Western boundary current such as Agulhas Current are loosing energy all year long

9 Mean turbulent latent heat fluxes from

10 THE AGULHAS CURRENT AIR SEA EXCHANGE EXPERIMENT Avril Mai 1995 SA ALGOA
11

12 18 km 18 resolution km resolution AVHRR AVHRR Pathfinder Pathfinder SST (Reynolds SST (Reynolds and Smith, and Smith, 1994) averaged 1994) averaged over the over period the period April during April 1995 which during the ACASEX which the field ACASEX expedition field took expedition place. The took ACASEX place. The cruise track is shown ACASEX in blue. The cruise core track of the is Agulhas shown in Current blue. The has core SST of > the 22 o C. Agulhas White areas Current over has the SST ocean > 22 correspond C. White to those areas for over which the there ocean was correspond persistent to cloud those cover for which during there the cruise was persistent cloud cover during the cruise
13 Air sea interaction Wind stress Turbulent flux of sensible heat Turbulent flux of humidity aka turbulent latent heat flux

14 Specific humidity vertical profile derived from a transect of radiosondes. Wind was alongshore that day

15 Specific humidity vertical profile derived from a transect of radiosondes. Wind was onshore that day

16 Meteosat visible Image during the cruise
17

18 Cloud top temperature derived from Meteosat infrared channel is a good proxy for rainfall on 15 December 1998

19 15 DECEMBER 1998 UMTATA, AFTER THE TORNADO
)!")
20 WARMING OF THE OCEAN SINCE 1950 Linear trend in C per 10 year !!! Since 1950 sea surface t e mperature warming using Hadley SST (UKMO, ex GISST, Rayner et al, 2003))! Caution SST reconstruction along ship track and filling gap with statistics (EOF) Not many observations south of 35 S in the South Indian Ocean
21 Linear trend in SST in C per decade using 1x1 degree Reynolds SST The Agulhas Current system and South Angola have significantly warmed up by up to 1.5 C since the 1980 s.
22 Change in sea surface temperature from 1985 to 2007 in C per 10-year using 4 km resolution AVHRR only. Superimposed is the mean ocean current (yellow to red: warming, green blue: cooling)
![linear trend in SST from 1982 to 2006 [C/decade] showing a warming of up to 0.5 C per decade using OI Reynold SST Linear trend in sensible and latent heat flux [W.](/docs-images/82/85800793/images/23-0.jpg "m-2/decade] for the same period using OA WHOI fluxes (positive values represent a loss of energy for the ocean).")
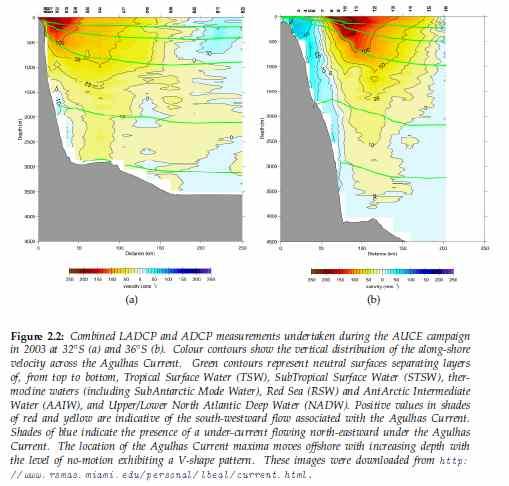
23 linear trend in SST from 1982 to 2006 [C/decade] showing a warming of up to 0.5 C per decade using OI Reynold SST Linear trend in sensible and latent heat flux [W.m-2/decade] for the same period using OA WHOI fluxes (positive values represent a loss of energy for the ocean). Observations of the recent warming in the Agulhas Current system and related increase in sensible and latent heat fluxes. The black contours represent an observed mean dynamic topography (1 contour per 20 cm) accounting for the mean surface currents. Arrows indicate the direction of the flow. Rouault, Penven, Pohl, GRL, 2009

24 Linear trend in modeled temperature at 500 m from 1982 to 2001 from Modeling the warming in the Agulhas Current system. Temperature trend, at 500 m showing a stronger temperature increase. Black line will be used to calculated the leakage of Indian Ocean water to the Atlantic Ocean (Rouault et al, 2009)
![SST anomaly observed (green,and red) and modeled(green) in from 1960 to 2006 Modeled (red) and observed (black stars) temperature anomalies [C] at 500m Modeled (black)](/docs-images/82/85800793/images/25-0.jpg "and observed (blue) geostrophic eddy kinetic energy derived from sea surface height Changes in the Agulhas Retroflection region (36S to 41S and 10E to 20E) from 1960 to")
25 SST anomaly observed (green,and red) and modeled(green) in from 1960 to 2006 Modeled (red) and observed (black stars) temperature anomalies [C] at 500m Modeled (black) and observed (blue) geostrophic eddy kinetic energy derived from sea surface height Changes in the Agulhas Retroflection region (36S to 41S and 10E to 20E) from 1960 to 2006
26 Modeled ocean transport in SV from 1000m to the surface: across a coastal section off South Africa (Port Elizabeth) (blue). The red line represents the modeled SST over the Retroflection
27 Modeled ocean transport in SV from 1000m to the surface: across a coastal section off South Africa (Port Elizabeth) (blue), South of Madagascar (black) and across a zonal section in the Mozambique Channel at 20 S (yellow). The red line represents the modeled SST over the Retroflection in domain used in Figure 2

28 Left: linear trend in modeled temperature from 1982 to 2001 in C/decade along a vertical section going from the Cape of Good Hope to 10 E 42 S. Right: linear trend in modeled salinity from in PSU/decade along the same vertical section. Mean condition superimposed in black
29 Consequences of an increase of the Agulhas current. Net westward transport for water with temperature above 5 C and salinity above 34.8 PSU across a meridional section at 18 E (blue), net salt flux in kg.s-1 (green) and net heat flux in PW for the same water across the same section (red).

30 Linear trend in surface wind speed from 1979 to 2001 in m.s-1/decade using ERA 40. Climatological wind direction is represented with black arrows. (Rouault, Penven, Pohl, 2009, supplementary material)

31 linear trend (mm/day per decade) in rain rate using 2.5x 2.5 degree resolution GPCPV2.1 rainfall data estimated from satellite remote sensing A substantial increase in rainfall has occurred above the Indian Ocean between 15 N and 15 S concomitant with the increase in sea surface temperature previously described. According to William and Funk, 2010 this is the cause of the observed decrease in rainfall over East Africa via modification of the Walker circulation. This also could be the caused of a intensification of the Hadley circulation in the Indian Ocean.
32 Linear trend in SST in C per decade using 1x1 degree Reynolds SST The Agulhas Current system and South Angola have significantly warmed up by up to 1.5 C since the 1980 s.

33 Observation: recent warming in the Agulhas Retroflection region. - Signal in a regional ocean model (SAfE): possibility for diagnostics. Increased wind stress curl Increased Agulhas Current Increased Agulhas Current transport Increased Agulhas Leakage Increased Retroflection SST Rouault, M., P. Penven and B. Pohl, Warming in the Agulhas Current system since the 1980's, 2009, Geophys. Res. Lett., 36, L12602.
 Agulhas Current transport leads to larger (smaller) Indian-Atlantic inter-ocean exchange Increased Agulhas Current Earlier Retroflection (Ou and de Ruijter, 1986)!")
34 BUT... A weaker Agulhas Current leads to more Agulhas leakage van Sebille et al. (2009). Virtual Lagrangian floats in a nested ocean model. smaller (larger) Agulhas Current transport leads to larger (smaller) Indian-Atlantic inter-ocean exchange Increased Agulhas Current Earlier Retroflection (Ou and de Ruijter, 1986)! Reduced Agulhas Leakage van Sebille, E., A. Biastoch, P. J. van Leeuwen, and W. P. M. de Ruijter (2009), A weaker Agulhas Current leads to more Agulhas leakage, Geophys. Res. Lett., 36, L Ou H.W. and W.P.M. de Ruijter (1986), Separation of an Inertial Boundary Current from a Curved Coastline, J. Phys. Oceanogr., 16,

35 AND... Increase in Agulhas leakage due to poleward shift of Southern Hemisphere westerlies Biastoch et al. (2009), Beal et al (2011). Poleward shift of 0 wind stress curl Reduced Agulhas Current Increased Agulhas Leakage Decreased transport in the Mozambique Channel + Reduced South west Indian Subgyre Agulhas Current do not follow sverdrup transport relationship A. Biastoch, C. W. Boning, F. U. Schwarzkopf and J.R.E. Lutjeharms, Increase in Agulhas leakage due to poleward shift of Southern Hemisphere westerlies, Nature, 462,

36 Linear trend in SST since 1982 in C per decade using 1x1 degree Reynolds SST A zoom of the former graph shows that closer to Africa the Agulhas Current system has significantly warmed up by up to 1.5 C since the 1980 s.

37 Sea surface temperature (SST) trends in ºC / 10 years from OI SST from 1992 to 2010
38 Thanks, please visit us in Cape Town Contributions from Pierrick Penven(IRD), Benjamin Pohl(CRC Dijon), Bjorn Backeberg Sea surface temperature estimated by AVHRR aboard NOAA (1x1 km resolution) Funding from WRC, ACCESS, Nansen-Tutu Center
The Agulhas Current system: its dynamics and climatic importance
 The Agulhas Current system: its dynamics and climatic importance BJØRN BACKEBERG 1 NANSEN-TUTU CENTRE FOR MARINE ENVIRONMENTAL RESEARCH 2 DEPTARTMENT OF OCEANOGRAPHY, UNIVERSITY OF CAPE TOWN Nansen Centers
Arne Biastoch Helmholtz Centre for Ocean Research Kiel. Modelling the Agulhas Current and its Coupling with the Atlantic Circulation
 Arne Biastoch Helmholtz Centre for Ocean Research Kiel Modelling the Agulhas Current and its Coupling with the Atlantic Circulation The Agulhas System as a Key Region of the Global Oceanic Circulation
Atmospheric driving forces for the Agulhas Current in the subtropics
 Click Here for Full Article GEOPHYSICAL RESEARCH LETTERS, VOL. 34, L15605, doi:10.1029/2007gl030200, 2007 Atmospheric driving forces for the Agulhas Current in the subtropics A. Fetter, 1 J. R. E. Lutjeharms,
ATOC 5051 INTRODUCTION TO PHYSICAL OCEANOGRAPHY. Lecture 19. Learning objectives: develop a physical understanding of ocean thermodynamic processes
 ATOC 5051 INTRODUCTION TO PHYSICAL OCEANOGRAPHY Lecture 19 Learning objectives: develop a physical understanding of ocean thermodynamic processes 1. Ocean surface heat fluxes; 2. Mixed layer temperature
C
 C 0.8 0.4 0.2 0.0-0.2-0.6 Fig. 1. SST-wind relation in the North Pacific and Atlantic Oceans. Left panel: COADS SST (color shade), surface wind vectors, and SLP regressed upon the Pacific Decadal Oscillation
Invited paper on the South Atlantic J. Lutjeharms
 AGU Chapman Conference on the Agulhas System Stellenbosch South Africa October 8 12, 2012 With regard to the thermohaline circulation, we identify some key locations where very important processes occur,
Arnold L. Gordon Retroflections and Bifurcations Johann Lutjeharms Memorial Lecture
 The Agulhas System and its Role in Changing Ocean Circulation, Climate & Marine Ecosystems Spier Hotel, Stellenbosch, Western Cape, South Africa 8 12 October 2012 Brazil/Malvinas Agulhas Retroflection
Wind changes above warm Agulhas Current eddies
 Wind changes above warm Agulhas Current eddies M. Rouault 1,2, P. Verley 1,3, B. Backeberg 2,4 1 Department of Oceanography, Mare Institute, University of Cape Town 2 Nansen-Tutu Center for Marine Environmental
General Circulation. Nili Harnik DEES, Lamont-Doherty Earth Observatory
 General Circulation Nili Harnik DEES, Lamont-Doherty Earth Observatory nili@ldeo.columbia.edu Latitudinal Radiation Imbalance The annual mean, averaged around latitude circles, of the balance between the
Lecture 1. Amplitude of the seasonal cycle in temperature
 Lecture 6 Lecture 1 Ocean circulation Forcing and large-scale features Amplitude of the seasonal cycle in temperature 1 Atmosphere and ocean heat transport Trenberth and Caron (2001) False-colour satellite
What governs the location of the Southern Ocean deep winter mixing in CESM
 NSF NCAR WYOMING SUPERCOMPUTER CENTER DOE SCIDAC FUNDED PROJECT What governs the location of the Southern Ocean deep winter mixing in CESM Justin Small Dan Whitt Alice DuVivier Matt Long Acknowledging:
The Arctic Energy Budget
 The Arctic Energy Budget The global heat engine [courtesy Kevin Trenberth, NCAR]. Differential solar heating between low and high latitudes gives rise to a circulation of the atmosphere and ocean that
Univeristy of Cape Town
 Sea surface temperature trends around Southern Africa. (Focusing on the Benguela Current system and the Agulhas Retroflection area) Prepared by: Xolisa Dlomo DLMXOL007 Univeristy of Cape Town Minor dissertation
SIO 210 Introduction to Physical Oceanography Mid-term examination November 3, 2014; 1 hour 20 minutes
 NAME: SIO 210 Introduction to Physical Oceanography Mid-term examination November 3, 2014; 1 hour 20 minutes Closed book; one sheet of your own notes is allowed. A calculator is allowed. (100 total points.)
Agulhas Leakage in the CCSM4. Wilbert Weijer (LANL, Los Alamos) Erik van Sebille (UNSW, Sydney)
 Erik van Sebille (UNSW, Sydney)") Agulhas Leakage in the CCSM4 Wilbert Weijer (LANL, Los Alamos) Erik van Sebille (UNSW, Sydney) Slide 1 Agulhas Leakage Exchange of water between South Indian and Atlantic Oceans Takes part in Supergyre
Agulhas Leakage in the CCSM4 Wilbert Weijer (LANL, Los Alamos) Erik van Sebille (UNSW, Sydney) Slide 1 Agulhas Leakage Exchange of water between South Indian and Atlantic Oceans Takes part in Supergyre
SIO 210 Final Exam Dec Name:
 SIO 210 Final Exam Dec 8 2006 Name: Turn off all phones, pagers, etc... You may use a calculator. This exam is 9 pages with 19 questions. Please mark initials or name on each page. Check which you prefer
Upper Ocean Circulation
 Upper Ocean Circulation C. Chen General Physical Oceanography MAR 555 School for Marine Sciences and Technology Umass-Dartmouth 1 MAR555 Lecture 4: The Upper Oceanic Circulation The Oceanic Circulation
SIO 210 Introduction to Physical Oceanography Mid-term examination November 5, 2012; 50 minutes Answer key
 SIO 210 Introduction to Physical Oceanography Mid-term examination November 5, 2012; 50 minutes Answer key Closed book; one sheet of your own notes is allowed. A calculator is allowed. (100 total points.)
Climate Change Research Centre
 Lagrangian particles to study the ocean circulation All trajectories of buoys in the Global Drifter Program Erik van Sebille With input from Matthew England, Judith Helgers, Claire Paris, Bernadette Sloyan,
Variability of the Boundary Circulation Systems at 11 S
 Variability of the Boundary Circulation Systems at 11 S Rebecca Hummels 1, Peter Brandt 1, Marcus Dengler 1, Jürgen Fischer 1, Moacyr Araujo 2, Doris Veleda 2, Jonathan V. Durgadoo 1, Josefine Herrford
Global Ocean Monitoring: Recent Evolution, Current Status, and Predictions
 Global Ocean Monitoring: Recent Evolution, Current Status, and Predictions Prepared by Climate Prediction Center, NCEP November 6, 2009 http://www.cpc.ncep.noaa.gov/products/godas/ This project to deliver
SST Observations of the Agulhas and East Madagascar Retroflections by the TRMM Microwave Imager
 MAY 2002 NOTES AND CORRESPONDENCE 1585 SST Observations of the Agulhas and East Madagascar Retroflections by the TRMM Microwave Imager GRAHAM D. QUARTLY AND MERIC A. SROKOSZ James Rennell Division for
ENSO Outlook by JMA. Hiroyuki Sugimoto. El Niño Monitoring and Prediction Group Climate Prediction Division Japan Meteorological Agency
 ENSO Outlook by JMA Hiroyuki Sugimoto El Niño Monitoring and Prediction Group Climate Prediction Division Outline 1. ENSO impacts on the climate 2. Current Conditions 3. Prediction by JMA/MRI-CGCM 4. Summary
What caused the significant increase in Atlantic Ocean heat content since the mid 20th century?
 GEOPHYSICAL RESEARCH LETTERS, VOL. 38,, doi:10.1029/2011gl048856, 2011 What caused the significant increase in Atlantic Ocean heat content since the mid 20th century? Sang Ki Lee, 1,2 Wonsun Park, 3 Erik
Arctic Climate Change. Glen Lesins Department of Physics and Atmospheric Science Dalhousie University Create Summer School, Alliston, July 2013
 Arctic Climate Change Glen Lesins Department of Physics and Atmospheric Science Dalhousie University Create Summer School, Alliston, July 2013 When was this published? Observational Evidence for Arctic
Eddy-resolving Simulation of the World Ocean Circulation by using MOM3-based OGCM Code (OFES) Optimized for the Earth Simulator
 Optimized for the Earth Simulator") Chapter 1 Atmospheric and Oceanic Simulation Eddy-resolving Simulation of the World Ocean Circulation by using MOM3-based OGCM Code (OFES) Optimized for the Earth Simulator Group Representative Hideharu
Chapter 1 Atmospheric and Oceanic Simulation Eddy-resolving Simulation of the World Ocean Circulation by using MOM3-based OGCM Code (OFES) Optimized for the Earth Simulator Group Representative Hideharu
INFLUENCE OF LARGE-SCALE ATMOSPHERIC MOISTURE FLUXES ON THE INTERANNUAL TO MULTIDECADAL RAINFALL VARIABILITY OF THE WEST AFRICAN MONSOON
 3C.4 INFLUENCE OF LARGE-SCALE ATMOSPHERIC MOISTURE FLUXES ON THE INTERANNUAL TO MULTIDECADAL RAINFALL VARIABILITY OF THE WEST AFRICAN MONSOON Andreas H. Fink*, and Sonja Eikenberg University of Cologne,
WATER VAPOR FLUXES OVER EQUATORIAL CENTRAL AFRICA
 WATER VAPOR FLUXES OVER EQUATORIAL CENTRAL AFRICA INTRODUCTION A good understanding of the causes of climate variability depend, to the large extend, on the precise knowledge of the functioning of the
Tasman leakage in a fine-resolution ocean model
 GEOPHYSICAL RESEARCH LETTERS, VOL. 39,, doi:10.1029/2012gl051004, 2012 Tasman leakage in a fine-resolution ocean model Erik van Sebille, 1 Matthew H. England, 1 Jan D. Zika, 1 and Bernadette M. Sloyan
On the fast decay of Agulhas rings
 Click Here for Full Article JOURNAL OF GEOPHYSICAL RESEARCH, VOL. 115,, doi:10.1029/2009jc005585, 2010 On the fast decay of Agulhas rings Erik van Sebille, 1,2 Peter Jan van Leeuwen, 1,3 Arne Biastoch,
Large-Eddy Simulations of Tropical Convective Systems, the Boundary Layer, and Upper Ocean Coupling
 DISTRIBUTION STATEMENT A. Approved for public release; distribution is unlimited. Large-Eddy Simulations of Tropical Convective Systems, the Boundary Layer, and Upper Ocean Coupling Eric D. Skyllingstad
Role of Interannual Kelvin wave propagations in the equatorial Atlantic on the Angola-Benguela current system.
 Role of Interannual Kelvin wave propagations in the equatorial Atlantic on the Angola-Benguela current system. Presented by: Rodrigue Anicet IMBOL KOUNGUE With the Collaboration of: - Dr Serena ILLIG -
SUPPLEMENTARY INFORMATION
 Effect of remote sea surface temperature change on tropical cyclone potential intensity Gabriel A. Vecchi Geophysical Fluid Dynamics Laboratory NOAA Brian J. Soden Rosenstiel School for Marine and Atmospheric
Lecture 8. Lecture 1. Wind-driven gyres. Ekman transport and Ekman pumping in a typical ocean basin. VEk
 Lecture 8 Lecture 1 Wind-driven gyres Ekman transport and Ekman pumping in a typical ocean basin. VEk wek > 0 VEk wek < 0 VEk 1 8.1 Vorticity and circulation The vorticity of a parcel is a measure of its
SE Atlantic SST variability and southern African climate
 SE Atlantic SST variability and southern African climate Chris Reason Oceanography Dept, Univ. Cape Town Overview of southern African climate and tropical Atlantic SST South American monsoon, Benguela
Atmospheric Sciences 321. Science of Climate. Lecture 20: More Ocean: Chapter 7
 Atmospheric Sciences 321 Science of Climate Lecture 20: More Ocean: Chapter 7 Community Business Quiz discussion Next Topic will be Chapter 8, Natural Climate variability in the instrumental record. Homework
Decay of Agulhas rings due to cross-frontal secondary circulations
 Decay of Agulhas rings due to cross-frontal secondary circulations S.S. Drijfhout Royal Netherlands Meteorological Institute, De Bilt, The Netherlands L. de Steur, and P.J. van Leeuwen Institute for Marine
psio 210 Introduction to Physical Oceanography Mid-term examination November 3, 2014; 1 hour 20 minutes Answer key
 NAME: psio 210 Introduction to Physical Oceanography Mid-term examination November 3, 2014; 1 hour 20 minutes Answer key Closed book; one sheet of your own notes is allowed. A calculator is allowed. (100
Observation and modeling of eddies and dipoles in the Southern Indian Ocean
 Observation and modeling of eddies and dipoles in the Southern Indian Ocean Yana Bebieva 1 Utrecht University 19.06.2013 Abstract Analysis of the along track satellite data near the southern tip of Madagascar
ENSO Cycle: Recent Evolution, Current Status and Predictions. Update prepared by Climate Prediction Center / NCEP 5 August 2013
 ENSO Cycle: Recent Evolution, Current Status and Predictions Update prepared by Climate Prediction Center / NCEP 5 August 2013 Outline Overview Recent Evolution and Current Conditions Oceanic Niño Index
Climate Change Research Centre
 2S On Agulhas rings and leakage (and whether it all matters) All trajectories of observational Agulhas buoys 3S 4S Erik van Sebille 1E 2E 3E 4E With input from Lisa Beal, Arne Biastoch, Matthew England,
Figure 1: Two schematic views of the global overturning circulation. The Southern Ocean plays two key roles in the global overturning: (1) the
 the") Figure 1: Two schematic views of the global overturning circulation. The Southern Ocean plays two key roles in the global overturning: (1) the Antarctic Circumpolar Current connects the ocean basins, establishing
Figure 1: Two schematic views of the global overturning circulation. The Southern Ocean plays two key roles in the global overturning: (1) the Antarctic Circumpolar Current connects the ocean basins, establishing
Kalimantan realistically (Figs. 8.23a-d). Also, the wind speeds of the westerly
. Also, the wind speeds of the westerly") suppressed rainfall rate (maximum vertical velocity) around 17 LST (Figs. 8.21a-b). These results are in agreement with previous studies (e. g., Emanuel and Raymond 1994). The diurnal variation of maximum
suppressed rainfall rate (maximum vertical velocity) around 17 LST (Figs. 8.21a-b). These results are in agreement with previous studies (e. g., Emanuel and Raymond 1994). The diurnal variation of maximum
the 2 past three decades
 SUPPLEMENTARY INFORMATION DOI: 10.1038/NCLIMATE2840 Atlantic-induced 1 pan-tropical climate change over the 2 past three decades 3 4 5 6 7 8 9 10 POP simulation forced by the Atlantic-induced atmospheric
SUPPLEMENTARY INFORMATION
 SUPPLEMENTARY INFORMATION DOI: 1.138/NCLIMATE216 Recent intensification of wind-driven circulation in the Pacific and the ongoing warming hiatus (a) Observed wind trends 6N N 2N 2S S 6S 6E 12E 18E 12W
SIO 210 Problem Set 2 October 17, 2011 Due Oct. 24, 2011
 SIO 210 Problem Set 2 October 17, 2011 Due Oct. 24, 2011 1. The Pacific Ocean is approximately 10,000 km wide. Its upper layer (wind-driven gyre*) is approximately 1,000 m deep. Consider a west-to-east
SIO 210 Final examination Wednesday, December 12, :30-2:30 Eckart 227 Name:
 SIO 210 Final examination Wednesday, December 12, 2018 11:30-2:30 Eckart 227 Name: Please put your initials or name on each page, especially if you pull pages apart. Turn off all phones, ipods, etc. and
Preliminary Cruise Report PIRATA Northeast Extension 2006 / AMMA / Sahara Dust Cruise NOAA Ship Ronald H. Brown
 Preliminary Cruise Report PIRATA Northeast Extension 2006 / AMMA / Sahara Dust Cruise NOAA Ship Ronald H. Brown Leg 1: May 27-June 18, 2006 San Juan, Puerto Rico to Recife, Brazil Leg 2: June 22 - July
S11. Indian Ocean: Supplementary Materials
 C H A P T E R S11 Indian Ocean: Supplementary Materials FIGURE S11.1 Indian Ocean surface circulation (Tables S11.1, S11.2 and Figure 11.1). Surface height (cm). Data from Niiler, Maximenko, and McWilliams
SUPPLEMENTARY INFORMATION
 Intensification of Northern Hemisphere Subtropical Highs in a Warming Climate Wenhong Li, Laifang Li, Mingfang Ting, and Yimin Liu 1. Data and Methods The data used in this study consists of the atmospheric
SIO 210 Final examination Answer Key for all questions except Daisyworld. Wednesday, December 10, PM Name:
 SIO 210 Final examination Answer Key for all questions except Daisyworld. Wednesday, December 10, 2008 3-6 PM Name: This is a closed book exam. You may use a calculator. There are two parts: Talley (weighted
Chapter 6. Antarctic oceanography
 Chapter 6 Antarctic oceanography The region of the world ocean bordering on Antarctica is unique in many respects. First of all, it is the only region where the flow of water can continue all around the
Ocean Mixing and Climate Change
 Ocean Mixing and Climate Change Factors inducing seawater mixing Different densities Wind stirring Internal waves breaking Tidal Bottom topography Biogenic Mixing (??) In general, any motion favoring turbulent
2. Meridional atmospheric structure; heat and water transport. Recall that the most primitive equilibrium climate model can be written
 2. Meridional atmospheric structure; heat and water transport The equator-to-pole temperature difference DT was stronger during the last glacial maximum, with polar temperatures down by at least twice
The Use of Lagrangian Drifters to Measure Biogeochemical Processes and to Analyze Satellite Data Sets
 The Use of Lagrangian Drifters to Measure Biogeochemical Processes and to Analyze Satellite Data Sets John R. Moisan Laboratory for Hydrospheric Processes NASA Goddard Space Flight Center Pearn P. Niiler
Estimation of the Agulhas ring impacts on meridional heat fluxes and transport using ARGO floats and satellite data
 GEOPHYSICAL RESEARCH LETTERS, VOL. 38,, doi:10.1029/2011gl049359, 2011 Estimation of the Agulhas ring impacts on meridional heat fluxes and transport using ARGO floats and satellite data J. M. A. C. Souza,
Convection Trigger: A key to improving GCM MJO simulation? CRM Contribution to DYNAMO and AMIE
 Convection Trigger: A key to improving GCM MJO simulation? CRM Contribution to DYNAMO and AMIE Xiaoqing Wu, Liping Deng and Sunwook Park Iowa State University 2009 DYNAMO Workshop Boulder, CO April 13-14,
Water characteristics and transport of the Antarctic circumpolar current in the Indian Ocean
 Proc. Indian Acad. Sci. (Earth Planet. Sci.), Vol. 97, No. 2, December 1988, pp. 183-191. ~) Printed in India. Water characteristics and transport of the Antarctic circumpolar current in the Indian Ocean
ENSO Cycle: Recent Evolution, Current Status and Predictions. Update prepared by Climate Prediction Center / NCEP 25 February 2013
 ENSO Cycle: Recent Evolution, Current Status and Predictions Update prepared by Climate Prediction Center / NCEP 25 February 2013 Outline Overview Recent Evolution and Current Conditions Oceanic Niño Index
Chapter 7: Thermodynamics
 Chapter 7: Thermodynamics 7.1 Sea surface heat budget In Chapter 5, we have introduced the oceanic planetary boundary layer-the Ekman layer. The observed T and S in this layer are almost uniform vertically,
Project of Strategic Interest NEXTDATA. Deliverables D1.3.B and 1.3.C. Final Report on the quality of Reconstruction/Reanalysis products
 Project of Strategic Interest NEXTDATA Deliverables D1.3.B and 1.3.C Final Report on the quality of Reconstruction/Reanalysis products WP Coordinator: Nadia Pinardi INGV, Bologna Deliverable authors Claudia
Climate Change Impacts on the Marine Environment
 Climate Change Impacts on the Marine Environment Ken Ridgway CSIRO Marine and Atmospheric Research Wealth from Oceans National Research Flagship www.csiro.au Acknowledgements Jeff Dunn, John Church, Katy
Lecture 20 ATOC 5051 INTRODUCTION TO PHYSICAL OCEANOGRAPHY
 ATOC 5051 INTRODUCTION TO PHYSICAL OCEANOGRAPHY Lecture 20 Learning objectives: should be able to apply mixed layer temperature equation to explain observations; understand buoyancy forcing & salinity
CHAPTER 2 DATA AND METHODS. Errors using inadequate data are much less than those using no data at all. Charles Babbage, circa 1850
 CHAPTER 2 DATA AND METHODS Errors using inadequate data are much less than those using no data at all. Charles Babbage, circa 185 2.1 Datasets 2.1.1 OLR The primary data used in this study are the outgoing
OCN/ATM/ESS 587. Ocean circulation, dynamics and thermodynamics.
 OCN/ATM/ESS 587 Ocean circulation, dynamics and thermodynamics. Equation of state for seawater General T/S properties of the upper ocean Heat balance of the upper ocean Upper ocean circulation Deep circulation
The feature of atmospheric circulation in the extremely warm winter 2006/2007
 The feature of atmospheric circulation in the extremely warm winter 2006/2007 Hiroshi Hasegawa 1, Yayoi Harada 1, Hiroshi Nakamigawa 1, Atsushi Goto 1 1 Climate Prediction Division, Japan Meteorological
ENSO Cycle: Recent Evolution, Current Status and Predictions. Update prepared by Climate Prediction Center / NCEP 11 November 2013
 ENSO Cycle: Recent Evolution, Current Status and Predictions Update prepared by Climate Prediction Center / NCEP 11 November 2013 Outline Overview Recent Evolution and Current Conditions Oceanic Niño Index
Saharan Dust Induced Radiation-Cloud-Precipitation-Dynamics Interactions
 Saharan Dust Induced Radiation-Cloud-Precipitation-Dynamics Interactions William K. M. Lau NASA/GSFC Co-authors: K. M. Kim, M. Chin, P. Colarco, A. DaSilva Atmospheric loading of Saharan dust Annual emission
Pathways in the ocean
 Pathways Pathways in the in the ocean by Sybren Drijfhout Introduction The properties of water masses in the ocean are set by air-sea interactions at the surface and convective overturning. As direct transfer
1. The figure shows sea surface height (SSH) anomaly at 24 S (southern hemisphere), from a satellite altimeter.
 anomaly at 24 S (southern hemisphere), from a satellite altimeter.") SIO 210 Problem Set 3 November 16, 2015 1. The figure shows sea surface height (SSH) anomaly at 24 S (southern hemisphere), from a satellite altimeter. (a) What is the name of this type of data display?_hovmöller
SIO 210 Problem Set 3 November 16, 2015 1. The figure shows sea surface height (SSH) anomaly at 24 S (southern hemisphere), from a satellite altimeter. (a) What is the name of this type of data display?_hovmöller
Madagascar: A pacemaker for the Agulhas Current system?
 Click Here for Full Article GEOPHYSICAL RESEARCH LETTERS, VOL. 33, L17609, doi:10.1029/2006gl026854, 2006 Madagascar: A pacemaker for the Agulhas Current system? P. Penven, 1,2 J. R. E. Lutjeharms, 3 and
Lecture 5: Atmospheric General Circulation and Climate
 Lecture 5: Atmospheric General Circulation and Climate Geostrophic balance Zonal-mean circulation Transients and eddies Meridional energy transport Moist static energy Angular momentum balance Atmosphere
Dynamics and Kinematics
 Geophysics Fluid Dynamics () Syllabus Course Time Lectures: Tu, Th 09:30-10:50 Discussion: 3315 Croul Hall Text Book J. R. Holton, "An introduction to Dynamic Meteorology", Academic Press (Ch. 1, 2, 3,
ENSO Cycle: Recent Evolution, Current Status and Predictions. Update prepared by Climate Prediction Center / NCEP 24 September 2012
 ENSO Cycle: Recent Evolution, Current Status and Predictions Update prepared by Climate Prediction Center / NCEP 24 September 2012 Outline Overview Recent Evolution and Current Conditions Oceanic Niño
MERIDIONAL OVERTURNING CIRCULATION: SOME BASICS AND ITS MULTI-DECADAL VARIABILITY
 MERIDIONAL OVERTURNING CIRCULATION: SOME BASICS AND ITS MULTI-DECADAL VARIABILITY Gokhan Danabasoglu National Center for Atmospheric Research OUTLINE: - Describe thermohaline and meridional overturning
CAIBEX workshop Mesoscale experiments and modelling Cape Ghir
 CAIBEX workshop Mesoscale experiments and modelling Cape Ghir C. Troupin 1, P. Sangrà 2, J. Arístegui 2 1 GHER-MARE, AGO Department, University of Liège, Belgium 2 Facultad de Ciencias del Mar, Universidad
Geophysics Fluid Dynamics (ESS228)
") Geophysics Fluid Dynamics (ESS228) Course Time Lectures: Tu, Th 09:30-10:50 Discussion: 3315 Croul Hall Text Book J. R. Holton, "An introduction to Dynamic Meteorology", Academic Press (Ch. 1, 2, 3, 4,
Geophysics Fluid Dynamics (ESS228) Course Time Lectures: Tu, Th 09:30-10:50 Discussion: 3315 Croul Hall Text Book J. R. Holton, "An introduction to Dynamic Meteorology", Academic Press (Ch. 1, 2, 3, 4,
Effect of ocean surface currents on wind stress, heat flux, and wind power input to the ocean
 GEOPHYSICAL RESEARCH LETTERS, VOL. 33,, doi:10.1029/2006gl025784, 2006 Effect of ocean surface currents on wind stress, heat flux, and wind power input to the ocean Jordan T. Dawe 1 and LuAnne Thompson
CHAPTER 8 NUMERICAL SIMULATIONS OF THE ITCZ OVER THE INDIAN OCEAN AND INDONESIA DURING A NORMAL YEAR AND DURING AN ENSO YEAR
 CHAPTER 8 NUMERICAL SIMULATIONS OF THE ITCZ OVER THE INDIAN OCEAN AND INDONESIA DURING A NORMAL YEAR AND DURING AN ENSO YEAR In this chapter, comparisons between the model-produced and analyzed streamlines,
Development of a High-Resolution Coupled Atmosphere-Ocean-Land General Circulation Model for Climate System Studies
 Chapter 1 Earth Science Development of a High-Resolution Coupled Atmosphere-Ocean-Land General Circulation Model for Climate System Studies Project Representative Tatsushi Tokioka Frontier Research Center
Large-Eddy Simulations of Tropical Convective Systems, the Boundary Layer, and Upper Ocean Coupling
 DISTRIBUTION STATEMENT A. Approved for public release; distribution is unlimited. Large-Eddy Simulations of Tropical Convective Systems, the Boundary Layer, and Upper Ocean Coupling Eric D. Skyllingstad
(chose the sign to ensure that it is evaporative)
") SIO 210 (2-3:20 class) Problem Set 2 ANSWER KEY October 17, 2016 Due October 31, 2016 (10 points) 1. The salinity of the inflow to the Mediterranean Sea at the Strait of Gibraltar is about 36.1. The salinity
SIO 210 (2-3:20 class) Problem Set 2 ANSWER KEY October 17, 2016 Due October 31, 2016 (10 points) 1. The salinity of the inflow to the Mediterranean Sea at the Strait of Gibraltar is about 36.1. The salinity
Arctic Atmospheric Rivers: Linking Atmospheric Synoptic Transport, Cloud Phase, Surface Energy Fluxes and Sea-Ice Growth
 Arctic Atmospheric Rivers: Linking Atmospheric Synoptic Transport, Cloud Phase, Surface Energy Fluxes and Sea-Ice Growth Ola Persson Cooperative Institute for the Research in the Environmental Sciences,
Impact of Eurasian spring snow decrement on East Asian summer precipitation
 Impact of Eurasian spring snow decrement on East Asian summer precipitation Renhe Zhang 1,2 Ruonan Zhang 2 Zhiyan Zuo 2 1 Institute of Atmospheric Sciences, Fudan University 2 Chinese Academy of Meteorological
ENSO Cycle: Recent Evolution, Current Status and Predictions. Update prepared by Climate Prediction Center / NCEP 15 July 2013
 ENSO Cycle: Recent Evolution, Current Status and Predictions Update prepared by Climate Prediction Center / NCEP 15 July 2013 Outline Overview Recent Evolution and Current Conditions Oceanic Niño Index
Comparison Figures from the New 22-Year Daily Eddy Dataset (January April 2015)
") Comparison Figures from the New 22-Year Daily Eddy Dataset (January 1993 - April 2015) The figures on the following pages were constructed from the new version of the eddy dataset that is available online
Comparison Figures from the New 22-Year Daily Eddy Dataset (January 1993 - April 2015) The figures on the following pages were constructed from the new version of the eddy dataset that is available online
APPENDIX B PHYSICAL BASELINE STUDY: NORTHEAST BAFFIN BAY 1
 APPENDIX B PHYSICAL BASELINE STUDY: NORTHEAST BAFFIN BAY 1 1 By David B. Fissel, Mar Martínez de Saavedra Álvarez, and Randy C. Kerr, ASL Environmental Sciences Inc. (Feb. 2012) West Greenland Seismic
Agulhas Current Dynamics from Coastal Altimetry
 Agulhas Current Dynamics from Coastal Altimetry Konstantina Rizopoulou 1,2, * Paolo Cipollini 2, Helen Snaith 3, Graham Quartly 4 Luis Guimaraes Gallisa 1 1 Universidade Federal de Rio de Janeiro PEnO
Deep flow and mixing in the Indian Ocean
 Deep flow and mixing in the Indian Ocean MacKinnon Pinkel Johnston Deep Mixing: Southwest Indian Ocean Evidence of elevated turbulence above the Southwest Indian Ridge Kunze et al 06 (+ correction Dec
Lecture 4:the observed mean circulation. Atmosphere, Ocean, Climate Dynamics EESS 146B/246B
 Lecture 4:the observed mean circulation Atmosphere, Ocean, Climate Dynamics EESS 146B/246B The observed mean circulation Lateral structure of the surface circulation Vertical structure of the circulation
Pacific HYCOM. E. Joseph Metzger, Harley E. Hurlburt, Alan J. Wallcraft, Luis Zamudio and Patrick J. Hogan
 Pacific HYCOM E. Joseph Metzger, Harley E. Hurlburt, Alan J. Wallcraft, Luis Zamudio and Patrick J. Hogan Naval Research Laboratory, Stennis Space Center, MS Center for Ocean-Atmospheric Prediction Studies,
Wind Gyres. curl[τ s τ b ]. (1) We choose the simple, linear bottom stress law derived by linear Ekman theory with constant κ v, viz.
![Wind Gyres. curl[τ s τ b ]. (1) We choose the simple, linear bottom stress law derived by linear Ekman theory with constant κ v, viz.](/thumbs/88/117265944.jpg "Wind Gyres. curl[τ s τ b ]. (1) We choose the simple, linear bottom stress law derived by linear Ekman theory with constant κ v, viz.") Wind Gyres Here we derive the simplest (and oldest; Stommel, 1948) theory to explain western boundary currents like the Gulf Stream, and then discuss the relation of the theory to more realistic gyres.
Wind Gyres Here we derive the simplest (and oldest; Stommel, 1948) theory to explain western boundary currents like the Gulf Stream, and then discuss the relation of the theory to more realistic gyres.
The Ocean-Atmosphere System II: Oceanic Heat Budget
 The Ocean-Atmosphere System II: Oceanic Heat Budget C. Chen General Physical Oceanography MAR 555 School for Marine Sciences and Technology Umass-Dartmouth MAR 555 Lecture 2: The Oceanic Heat Budget Q
Recent warming and changes of circulation in the North Atlantic - simulated with eddy-permitting & eddy-resolving models
 Recent warming and changes of circulation in the North Atlantic - simulated with eddy-permitting & eddy-resolving models Robert Marsh, Beverly de Cuevas, Andrew Coward & Simon Josey (+ contributions by
Structure and origin of the subtropical South Indian Ocean Countercurrent
 GEOPHYSICAL RESEARCH LETTERS, VOL. 33, L24609, doi:10.1029/2006gl027399, 2006 Structure and origin of the subtropical South Indian Ocean Countercurrent Gerold Siedler, 1 Mathieu Rouault, 2 and Johann R.
Comparison of temperature data. a mesoscale eddy dominated environment
 omparison of temperature data collected by XBT and TD instruments in a mesoscale eddy dominated environment Morris T. 1, Ternon J F. 2 and Roberts M.J. 1,3 1 Bayworld entre for Research and Education,
Tropical Meteorology. Roger K. Smith INDO IR
 Tropical Meteorology Roger K. Smith INDO IR 01010510 1 GMS IR 01022621 GOES IR 00112909 2 Introduction to the tropics The zonal mean circulation (Hadley circulation) The data network in the tropics (field
Indian Ocean dipole mode events in a simple mixed layer ocean model
 Indian Journal of Marine Sciences Vol. 32(4), December 2003, pp. 294-304 Indian Ocean dipole mode events in a simple mixed layer ocean model C. Gnanaseelan, J. S. Chowdary, A. K. Mishra & P. S. Salvekar
Flow structure and variability in the Subtropical Indian Ocean
 Chapter 4 Flow structure and variability in the Subtropical Indian Ocean 4.1 Introduction It is well known from satellite altimetry that the variability of the South Indian Ocean comprises a range of frequencies
On Surface fluxes and Clouds/Precipitation in the Tropical Eastern Atlantic
 On Surface fluxes and Clouds/Precipitation in the Tropical Eastern Atlantic Chris Fairall, NOAA/ESRL Paquita Zuidema, RSMAS/U Miami with contributions from Peter Minnett & Erica Key AMMA Team Meeting Leeds,