Arctic Atmospheric Rivers: Linking Atmospheric Synoptic Transport, Cloud Phase, Surface Energy Fluxes and Sea-Ice Growth
|
|
|
- Andrew Lane
- 5 years ago
- Views:
Transcription


 Link Arctic ARs to mid-latitude ones extension of mid-latitude ARs")
 Detailed")
1 Arctic Atmospheric Rivers: Linking Atmospheric Synoptic Transport, Cloud Phase, Surface Energy Fluxes and Sea-Ice Growth Ola Persson Cooperative Institute for the Research in the Environmental Sciences, University of Colorado, Boulder, Colorado, USA; NOAA/ESRL/PSD, Boulder, Colorado, USA Contributions from: M. D. Shupe, D. Perovich, and A. Solomon 2233 UTC Sep 23 (YD266) Winds: 12.2 m/s, 208 1) Link Arctic ARs to mid-latitude ones extension of mid-latitude ARs through Arctic gateways 2) Characteristics comparison: moisture content/transport 3) Impact comparison: surface precipitation, radiation, SEB, ice growth 4) Detailed examples SHEBA midwinter; SHEBA spring; ACSE summer

2 Moisture Transport by Atmospheric Rivers (Zhu and Newell 1998) River fluxes (kg m -1 s -1 ) for January 1992, 1995, and Sample vector magnitude illustrated in upper-right corner. Northward moisture flux by rivers, broad fluxes, and their totals. Rivers, thin solid line; broad fluxes, dashed line; and total flux, thick solid line. Units are 10 8 kg s -1. (Top panel) January 1992, 1995, and 1996; (second panel) zonal scale of rivers for January 1992, 1995, and 1996; (Zhu and Newell,1998).

 x x x x x x Dec 2015 Sea Ice")
3 The Arctic Sep 2015 Sea Ice Extent Typical Temperature Profiles Over Arctic Sea Ice (Persson and Vihma 2016) x x x x x x Dec 2015 Sea Ice Extent x x x x x x
 Labrador")


4 SLP Associated with Moisture Pathways into the Arctic (Woods et al 2013; ERA-I) Labrador Barents/Kara Composites of sea level pressure at the time of maximum intensity for intrusions occurring within each of the four sectors. Black lines show the sector boundaries. Dashed black lines indicate the median location of the intrusions at maximum intensity. Dotted circles show latitude lines at 70 N and 80 N. Atlantic Pacific
proportion of total poleward moisture transport across 70 N from 1990 to 2010 contributed by vertically integrated moisture fluxes in 75 Tg d 1 deg 1 by 5 longitude bins.")
5 Moisture Pathways into the Arctic Woods et al 2013; GRL; ERA-I (a)zonal cross section along 70 N showing the climatological poleward moisture flux during winter from 1990 to (b)proportion of total poleward moisture transport across 70 N from 1990 to 2010 contributed by vertically integrated moisture fluxes in 75 Tg d 1 deg 1 by 5 longitude bins. Dashed and solid black lines mark the 50th and 90th percentile values of vertically integrated poleward fluxes, respectively. Solid red line indicates the threshold value of flux used to detect intrusions in the algorithm.


.")

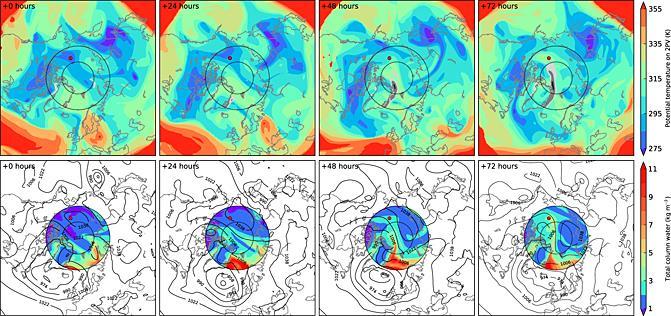
6 Moisture Intrusion Example Atlantic Sector Jan 1, 1998 Jan 2, 1998 Case study of an intrusion beginning at 00 UTC Jan 1,1998 and followed for subsequent 3 days. Total column water over ocean (color shading) and sea level pressure (black contours every 16 hpa). Red dot denotes approximate location of SHEBA at this time. Dotted circles show latitude lines at 70 N and 80 N. Jan 3, 1998 Jan 4, 1998 (Woods et al 2013; GRL)
")
7 ERA-40: Water Vapor Mixing Ratio, winds at 1500 m; Jan 2-5, 1998 (Persson et al 2016)


8 Moisture Intrusion from Atlantic Gateway Moisture Intrusion from Pacific Gateway

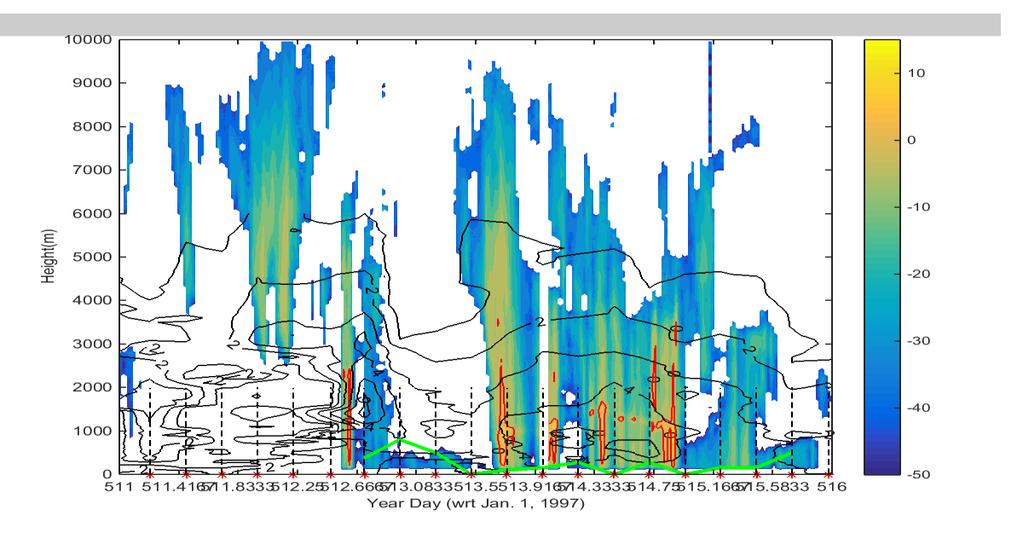
9 Moisture Intrusions Reaching SHEBA Observation Site - early Jan suite of in-situ and remote sensors, including 2-4X daily rawinsondes Persson et al (2016)
 have strong impact on LW d, F net, and T s 3) Thermal structure in snow and ice respond strongly to synoptic/mesoscale atmospheric")
10 1) Long-distance free tropospheric (above AI) advection of heat and moisture 2) Associated clouds (esp. with liquid) have strong impact on LW d, F net, and T s 3) Thermal structure in snow and ice respond strongly to synoptic/mesoscale atmospheric events and presence of liquid water in clouds
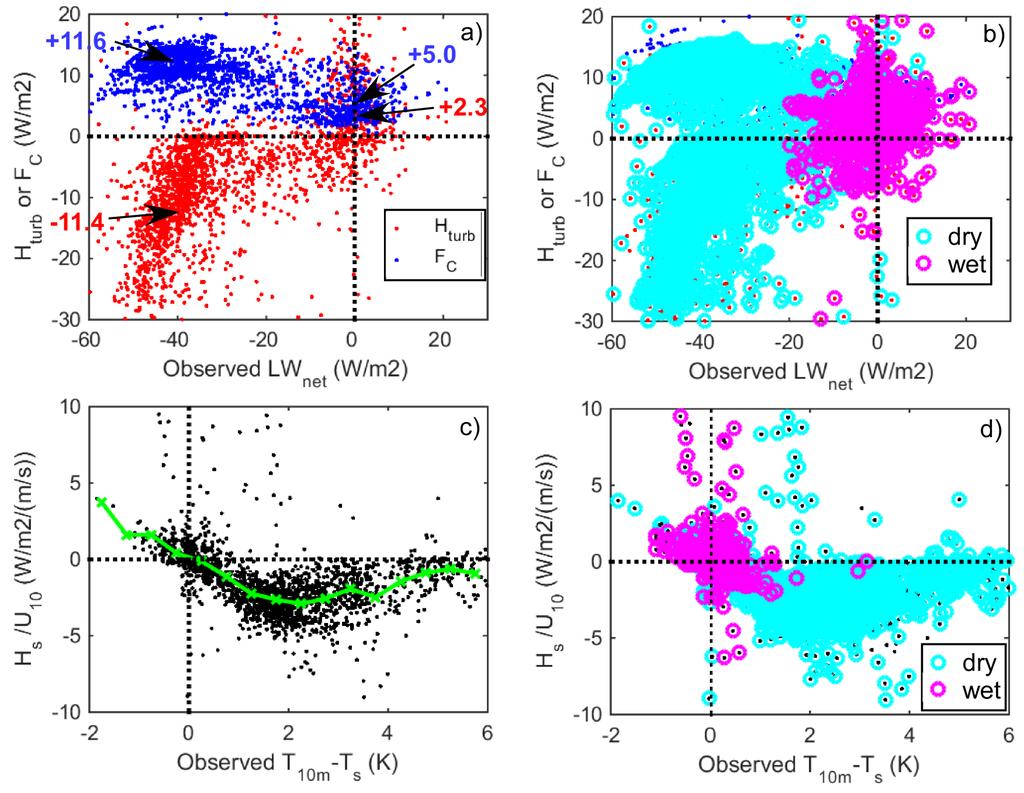
 Beaufort Sea Multi-year Arctic sea ice Observations clearly show clouds and CLW also impact H s + H l and F 0 Process Relationships: F net LW net (H s + H l ) + C; H s +")
11 C (W m -2 ) Observed Responses to Radiation Changes over Arctic Sea Ice SHEBA Polar Night (Nov. 7, 1997 Feb. 2, 1998; No solar radiation) Beaufort Sea Multi-year Arctic sea ice Observations clearly show clouds and CLW also impact H s + H l and F 0 Process Relationships: F net LW net (H s + H l ) + C; H s + H l vs LW net, C vs LW net Clear skies - surface warmed by both H s +H l and C - F net ~ W m -2

12 Sea-Ice Heat Conduction SHEBA Observations (Nov 16, Feb 28, 1998; Persson et al 2016)
13 How Arctic Moisture Intrusions Impact Sea Ice Growth (Persson et al 2016) Cloud liquid water path Surface net energy flux Snow surface conductive energy flux In-ice conductive energy flux Ice growth rates flux estimates Ice growth rates observed
, ice outlines Perovich et al (2003) Impact on all")

 Summer Season (T s fixed at melting point) - Can enhance")
 Increasing/decreasing number of events b) Increasing/decreasing")
14 Impacts of Moisture/Heat Intrusions over Sea Ice Snow cover, ice temperatures (color), ice outlines Perovich et al (2003) Impact on all SEB terms, but particularly LW d Non-Summer Seasons (T s can vary) - Large near-surface T a increases - Can trigger onset of summer melt 3-day running means of SEB terms, ice-surface melt, albedo, sfc T Persson (2012) Summer Season (T s fixed at melting point) - Can enhance surface melt Intrusions have potential significant impact on annual F tot : a) Increasing/decreasing number of events b) Increasing/decreasing F tot amplitudes of events
15 CONCLUDING REMARKS Mid-latitude Atmospheric Rivers continue as moisture intrusions into the Arctic - several gateways, but esp. Atlantic (Svalbard area) - moisture content less (often significantly) (1-11 g/kg; < 3 cm IWV) - airflow weaker - hence moisture transport significantly weaker Atmospheric Creeks? Arctic ACs have major impacts on sea-ice surface, primarily through LW d - large near-surface temperature increases (non-summer seasons) - trigger melt-season onset; enhance melt during melt-season - near-surface meteorology (e.g., fog, precipitation) Changes in frequency/strength of Arctic moisture intrusions potential major impact on near-surface climatology and sea-ice evolution Atmospheric river system flows opposite to the analogous terrestrial river system - terrestrial system has many small creeks feeding rivers, which eventual feed the large global water reservoir (oceans) - atmospheric system has moisture flow from the large global reservoir (tropical troposphere) into large atmospheric rivers, which are then depleted and eventually form a similar number of Arctic atmospheric creeks - terrestrial system primarily driven by gravity and earth s topography; atmospheric system driven by global general circulation and Clausius-Clapyron equation
 Radar reflectivity, q e,")


16 Melt Onset Triggered by Heat/Moisture Intrusion May 26-30, 1998; Persson (2012) Radar reflectivity, q e, T, q v, and frontal analysis > 4 g/kg Eddy on 500 mb circumpolar flow provides intrusion meridional flow Surface met and SEB evolution Synoptic storm & associated fronts pass over SHEBA site, bringing warm, moist air
 Select R/V Oden Observations Variables related to clouds and daily averaged surface energy fluxes.")
; Positive energy fluxes are downward. Upwelling and net solar radiation and total energy flux assume an albedo of 60%; dotted lines indicate ±10% about this.")
17 Very Strong Arctic Moisture and Heat Intrusion E. Siberian Sea; 1-7 Aug, 2014 (Tjernström et al 2015) Select R/V Oden Observations Variables related to clouds and daily averaged surface energy fluxes. Top: PWV (cm); Middle: horizontal visibility (km); Bottom: net longwave (red) and solar (blue) radiation, and sum of turbulent sensible and latent heat fluxes (green), and total energy flux (black); Positive energy fluxes are downward. Upwelling and net solar radiation and total energy flux assume an albedo of 60%; dotted lines indicate ±10% about this. Shaded region indicates period with positive surface net longwave radiation. R/V Oden 850 mb airflow R/V Oden Serial 6-h Rawinsondes Temperature (deg C) Absolute Humidity (g/kg) F net
 Aug 12 00Z Canadian Weather Service sea-level")
 12 UTC Aug. 13. The Oden is the reporting station at 87.5 N, 2 W.")


18 Moisture Intrusion with Storm/Precipitation Near North Pole, ASCOS, Aug 12-13, 2008; Persson (2010) Aug 12 00Z Canadian Weather Service sea-level pressure analyses at a) 00 UTC Aug. 12, b) 12 UTC Aug. 12, c) 00 UTC Aug. 13, and d) 12 UTC Aug. 13. The Oden is the reporting station at 87.5 N, 2 W. Aug UTC Aug UTC Aug 13 00Z Sequence of AVHRR satellite images showing the synoptic evolution. The satellite-derived winds and the surface frontal features are shown in each image. The tracks of the DC-8 (green) and Oden (yellow) are shown in b) using a system phase velocity of 14.5 m s -1 from 81.
 temperature (deg C) and S-band vertical velocity; and c) mixing ratio (g kg -1 ) and S-band spectral width.")
19 Moisture Intrusion with Storm/Precipitation: Thermodynamic/Kinematic Structure Near North Pole, ASCOS, Aug 12-13, 2008; Persson (2010) Time-height cross section of a) q e (deg C), wind barbs, and S- band SNR; b) temperature (deg C) and S-band vertical velocity; and c) mixing ratio (g kg -1 ) and S-band spectral width. a) q e (deg C), wind barbs, and S-band SNR; Each panel is overlaid with a frontal analysis based primarily on q e (heavy red, blue, and purple lines), thedc-8 flight track data (heavy black line), radiosondes (red stars on abscissa & vertical dashed lines), and dropsondes (vertical dashed blue lines). The heavy red isopleth in b) is the 0 C isotherm, and the heavy magenta line shows the location of a strong inversion. Main Points 1) Classical occluded frontal system, with warm/moist advection in narrow warm sector above surface inversion 2) Post-frontal warm air separated from surface by inversion 3) Deep clouds and precipitation primarily associated with warm-front 4) Elevated warm-air advection producing period of surface freezing rain and sleet 5) Turbulence near top of warm-frontal clouds likely producing convective generating cells for warm-frontal precipitation and possibly supercooled liquid water 6) Classical occluded frontal structure (except low-level inversion); clouds dynamically forced b) T (deg C) and S-band vertical velocity (m/s) c) mixing ratio (g kg -1 ) and S-band spectral width
20 Clouds Triggering Melt Observed and simulated temporal evolution of the July 2012 surface melting event at Summit. Clouds need to have: a) Sufficiently large LWP to provide significant increase in LW d b) Sufficiently small LWP to allow significant SW d i.e., hit LWP sweet spot for maximizing surface radiative fluxes, where thin, liquidbearing clouds are defined as clouds in the range of 10 g m 2 < LWP < 60 g m 2 R Bennartz et al. Nature 496, (2013) doi: /nature12002

21
; Figure 6d shows horizontal visibility (km); Figure 6e downwelling (solid) and upwelling (dashed) longwave (red) and solar (blue) radiation; Figure 6f shows net longwave")
; and Figure 6h shows the net solar (blue), longwave (red), and turbulent (green) heat fluxes as fractions of the total surface energy flux.")
22 Time series of (a d) variables related to the clouds and (e h) daily averaged surface energy fluxes: Figure 6a shows cloud base heights and vertical visibility (m); Figure 6b shows LWP (kg m 2 ); Figure 6c shows PWV (cm); Figure 6d shows horizontal visibility (km); Figure 6e downwelling (solid) and upwelling (dashed) longwave (red) and solar (blue) radiation; Figure 6f shows net longwave (red) and solar (blue) radiation, and sum of turbulent sensible and latent heat fluxes (green), and total energy flux (black); Figure 6g shows net clear sky longwave (dashed) and surface cloud radiation effect (solid); and Figure 6h shows the net solar (blue), longwave (red), and turbulent (green) heat fluxes as fractions of the total surface energy flux. All energy fluxes are in Wm 2, and except in (e), positive fluxes are downward. Upwelling and net solar radiation and total energy flux assume an albedo of 60%; dotted lines indicate ±10% about this. In Figure 6a, multiple values of cloud base height are given when lowest layers cover less than 100% of the sky: lowest cloud base in blue and second lowest in green, while vertical visibility (red) is only indicated for dense fog. The shaded region indicates the period with positive surface net longwave radiation.
23


 Associated clouds")
")

24 SHEBA Jan. 1-12, 1998; Beaufort Sea T (isopleths), wind barbs, reflectivity IR satellite images Fram Strait SHEBA Barrow 1) Long-distance free tropospheric advection of heat and moisture significant 2) Associated clouds (esp. with liquid) have strong impact on LW d, F net, and T s 3) Thermal structure in snow and ice respond strongly to synoptic/mesoscale atmospheric events and presence of liquid water in clouds Persson et al 2015
25
26 Arctic Moisture Intrusions Doyle JG, Lesins G, Thackray CP, Perro C, Nott GJ, Duck TJ, Damoah R, Drummond JR (2011) Water vapor intrusions into the high Arctic during winter. Geophys. Res. Lett., 38, L12806, doi: /2011gl Persson, P. O. G., M. Shupe, D. Perovich, and A. Solomon, 2016: Linking atmospheric synoptic transport, cloud phase, surface energy fluxes, and sea-ice growth: Observations of midwinter SHEBA conditions. Clim. Dyn., In Review. Woods C, Caballero R, Svensson G (2013) Large-scale circulation associated with moisture intrusions into the Arctic during winter. Geophys. Res. Lett., 40, , doi: /grl.50912

27 Neiman et al 2008

28
29 Atmospheric Rivers: Newel et al (1992); Zhu and Newell (1998) (Using ECMWF gridded data) - water vapor transport in the troposphere is characterized by a filamentary structure, called tropospheric rivers - the moisture flux in a typical tropospheric river is about 1.6 X 10 8 kg s -1, which is similar to the flux in the Amazon River - four or five atmospheric rivers in each hemisphere may carry the majority of the meridional fluxes over the globe - for meridional transport at middle latitudes, the rivers account for substantially all of the transport
30
31
The Arctic Energy Budget
 The Arctic Energy Budget The global heat engine [courtesy Kevin Trenberth, NCAR]. Differential solar heating between low and high latitudes gives rise to a circulation of the atmosphere and ocean that
Outline: 1) Extremes were triggered by anomalous synoptic patterns 2) Cloud-Radiation-PWV positive feedback on 2007 low SIE
 Extremes were triggered by anomalous synoptic patterns 2) Cloud-Radiation-PWV positive feedback on 2007 low SIE") Identifying Dynamical Forcing and Cloud-Radiative Feedbacks Critical to the Formation of Extreme Arctic Sea-Ice Extent in the Summers of 2007 and 1996 Xiquan Dong University of North Dakota Outline: 1)
Identifying Dynamical Forcing and Cloud-Radiative Feedbacks Critical to the Formation of Extreme Arctic Sea-Ice Extent in the Summers of 2007 and 1996 Xiquan Dong University of North Dakota Outline: 1)
Extratropical and Polar Cloud Systems
 Extratropical and Polar Cloud Systems Gunilla Svensson Department of Meteorology & Bolin Centre for Climate Research George Tselioudis Extratropical and Polar Cloud Systems Lecture 1 Extratropical cyclones
Global Atmospheric Circulation
 Global Atmospheric Circulation Polar Climatology & Climate Variability Lecture 11 Nov. 22, 2010 Global Atmospheric Circulation Global Atmospheric Circulation Global Atmospheric Circulation The Polar Vortex
Radiative Climatology of the North Slope of Alaska and the Adjacent Arctic Ocean
 Radiative Climatology of the North Slope of Alaska and the Adjacent Arctic Ocean C. Marty, R. Storvold, and X. Xiong Geophysical Institute University of Alaska Fairbanks, Alaska K. H. Stamnes Stevens Institute
Transient and Eddy. Transient/Eddy Flux. Flux Components. Lecture 3: Weather/Disturbance. Transient: deviations from time mean Time Mean
 Lecture 3: Weather/Disturbance Transients and Eddies Climate Roles Mid-Latitude Cyclones Tropical Hurricanes Mid-Ocean Eddies Transient and Eddy Transient: deviations from time mean Time Mean Eddy: deviations
Boundary layer equilibrium [2005] over tropical oceans
![Boundary layer equilibrium [2005] over tropical oceans](/thumbs/96/128963638.jpg "Boundary layer equilibrium [2005] over tropical oceans") Boundary layer equilibrium [2005] over tropical oceans Alan K. Betts [akbetts@aol.com] Based on: Betts, A.K., 1997: Trade Cumulus: Observations and Modeling. Chapter 4 (pp 99-126) in The Physics and Parameterization
Boundary layer equilibrium [2005] over tropical oceans Alan K. Betts [akbetts@aol.com] Based on: Betts, A.K., 1997: Trade Cumulus: Observations and Modeling. Chapter 4 (pp 99-126) in The Physics and Parameterization
Interannual variability of top-ofatmosphere. CERES instruments
 Interannual variability of top-ofatmosphere albedo observed by CERES instruments Seiji Kato NASA Langley Research Center Hampton, VA SORCE Science team meeting, Sedona, Arizona, Sep. 13-16, 2011 TOA irradiance
Chapter 12: Meteorology
 Chapter 12: Meteorology Section 1: The Causes of Weather 1. Compare and contrast weather and climate. 2. Analyze how imbalances in the heating of Earth s surface create weather. 3. Describe how and where
GEO1010 tirsdag
 GEO1010 tirsdag 31.08.2010 Jørn Kristiansen; jornk@met.no I dag: Først litt repetisjon Stråling (kap. 4) Atmosfærens sirkulasjon (kap. 6) Latitudinal Geographic Zones Figure 1.12 jkl TØRR ATMOSFÆRE Temperature
Extreme, transient Moisture Transport in the high-latitude North Atlantic sector and Impacts on Sea-ice concentration:
 AR conference, June 26, 2018 Extreme, transient Moisture Transport in the high-latitude North Atlantic sector and Impacts on Sea-ice concentration: associated Dynamics, including Weather Regimes & RWB
General Circulation. Nili Harnik DEES, Lamont-Doherty Earth Observatory
 General Circulation Nili Harnik DEES, Lamont-Doherty Earth Observatory nili@ldeo.columbia.edu Latitudinal Radiation Imbalance The annual mean, averaged around latitude circles, of the balance between the
Modeling the Arctic Climate System
 Modeling the Arctic Climate System General model types Single-column models: Processes in a single column Land Surface Models (LSMs): Interactions between the land surface, atmosphere and underlying surface
Satellites, Weather and Climate Module??: Polar Vortex
 Satellites, Weather and Climate Module??: Polar Vortex SWAC Jan 2014 AKA Circumpolar Vortex Science or Hype? Will there be one this year? Today s objectives Pre and Post exams What is the Polar Vortex
Observational Needs for Polar Atmospheric Science
 Observational Needs for Polar Atmospheric Science John J. Cassano University of Colorado with contributions from: Ed Eloranta, Matthew Lazzara, Julien Nicolas, Ola Persson, Matthew Shupe, and Von Walden
Arctic Clouds and Radiation Part 2
 Arctic Clouds and Radiation Part 2 Glen Lesins Department of Physics and Atmospheric Science Dalhousie University Create Summer School, Alliston, July 2013 No sun Arctic Winter Energy Balance 160 W m -2
Topic # 11 HOW CLIMATE WORKS continued (Part II) pp in Class Notes
 pp in Class Notes") Topic # 11 HOW CLIMATE WORKS continued (Part II) pp 61-67 in Class Notes To drive the circulation, the initial source of energy is from the Sun: Not to scale! EARTH- SUN Relationships 4 Things to Know
Topic # 11 HOW CLIMATE WORKS continued (Part II) pp 61-67 in Class Notes To drive the circulation, the initial source of energy is from the Sun: Not to scale! EARTH- SUN Relationships 4 Things to Know
Chapter 1 Anatomy of a Cyclone
 Chapter 1 Anatomy of a Cyclone The Beast in the East 15-17 February 2003 Extra-tropical cyclone an area of low pressure outside of the tropics Other names for extra-tropical cyclones: Cyclone Mid-latitude
Meteorology Unit Study Guide
 Name: Key Pd. Date: 1. Define meteorology Meteorology Unit Study Guide Study of the atmosphere including weather and weather patterns 2. The most abundant gas in the atmosphere by volume is. This gas comprises
Arctic Boundary Layer
 Annual Seminar 2015 Physical processes in present and future large-scale models Arctic Boundary Layer Gunilla Svensson Department of Meteorology and Bolin Centre for Climate Research Stockholm University,
Figure 1: Two schematic views of the global overturning circulation. The Southern Ocean plays two key roles in the global overturning: (1) the
 the") Figure 1: Two schematic views of the global overturning circulation. The Southern Ocean plays two key roles in the global overturning: (1) the Antarctic Circumpolar Current connects the ocean basins, establishing
Figure 1: Two schematic views of the global overturning circulation. The Southern Ocean plays two key roles in the global overturning: (1) the Antarctic Circumpolar Current connects the ocean basins, establishing
Assessing the impact of Arctic sea ice variability on Greenland Ice Sheet surface mass and energy exchange
 Assessing the impact of Arctic sea ice variability on Greenland Ice Sheet surface mass and energy exchange J. Stroeve, L. Boisvert, J. Mioduszewski, T. Komayo Enhanced Greenland Melt and Sea Ice Loss R=
Arctic climate projections and progress towards a new CCSM. Marika Holland NCAR
 Arctic climate projections and progress towards a new CCSM Marika Holland NCAR The Arctic is changing! Loss of Sept Arctic Sea Ice 2002 Loss of about 8% per decade Or >20% since 1979 (Courtesy I. Rigor
The Role of Post Cold Frontal Cumulus Clouds in an Extratropical Cyclone Case Study
 The Role of Post Cold Frontal Cumulus Clouds in an Extratropical Cyclone Case Study Amanda M. Sheffield and Susan C. van den Heever Colorado State University Dynamics and Predictability of Middle Latitude
Characterization of the Present-Day Arctic Atmosphere in CCSM4
 Characterization of the Present-Day Arctic Atmosphere in CCSM4 Gijs de Boer 1, Bill Chapman 2, Jennifer Kay 3, Brian Medeiros 3, Matthew Shupe 4, Steve Vavrus, and John Walsh 6 (1) (2) (3) (4) ESRL ()
Lecture 8. Monsoons and the seasonal variation of tropical circulation and rainfall
 Lecture 8 Monsoons and the seasonal variation of tropical circulation and rainfall According to the second hypothesis, the monsoon is a manifestation of the seasonal variation of the tropical circulation
SUPPLEMENTARY INFORMATION
 Figure S1. Summary of the climatic responses to the Gulf Stream. On the offshore flank of the SST front (black dashed curve) of the Gulf Stream (green long arrow), surface wind convergence associated with
The Atmospheric Boundary Layer. The Surface Energy Balance (9.2)
") The Atmospheric Boundary Layer Turbulence (9.1) The Surface Energy Balance (9.2) Vertical Structure (9.3) Evolution (9.4) Special Effects (9.5) The Boundary Layer in Context (9.6) What processes control
The Atmospheric Boundary Layer Turbulence (9.1) The Surface Energy Balance (9.2) Vertical Structure (9.3) Evolution (9.4) Special Effects (9.5) The Boundary Layer in Context (9.6) What processes control
Page 1. Name:
 Name: 1) As the difference between the dewpoint temperature and the air temperature decreases, the probability of precipitation increases remains the same decreases 2) Which statement best explains why
Interhemispheric climate connections: What can the atmosphere do?
 Interhemispheric climate connections: What can the atmosphere do? Raymond T. Pierrehumbert The University of Chicago 1 Uncertain feedbacks plague estimates of climate sensitivity 2 Water Vapor Models agree
The Atmospheric Circulation
 The Atmospheric Circulation Vertical structure of the Atmosphere http://www.uwsp.edu/geo/faculty/ritter/geog101/textbook/atmosphere/atmospheric_structure.html The global heat engine [courtesy Kevin Trenberth,
Meteorology 311. General Circulation/Fronts Fall 2017
 Meteorology 311 General Circulation/Fronts Fall 2017 Precipitation Types Rain Snow growth of ice crystals through deposition, accretion, and aggregation. Freezing Rain Rain freezes when it hits the surface.
 http://www.ssec.wisc.edu/data/composites.html Red curve: Incoming solar radiation Blue curve: Outgoing infrared radiation. Three-cell model of general circulation Mid-latitudes: 30 to 60 latitude MID-LATITUDES
25.1 Air Masses. Section 25.1 Objectives
 Section 25.1 Objectives Explain how an air mass forms. List the four main types of air masses. Describe how air masses affect the weather of North America. Air Masses 25.1 Air Masses Differences in air
Microphysical Properties of Single and Mixed-Phase Arctic Clouds Derived From Ground-Based AERI Observations
 Microphysical Properties of Single and Mixed-Phase Arctic Clouds Derived From Ground-Based AERI Observations Dave Turner University of Wisconsin-Madison Pacific Northwest National Laboratory 8 May 2003
A R C T E X Results of the Arctic Turbulence Experiments Long-term Monitoring of Heat Fluxes at a high Arctic Permafrost Site in Svalbard
 A R C T E X Results of the Arctic Turbulence Experiments www.arctex.uni-bayreuth.de Long-term Monitoring of Heat Fluxes at a high Arctic Permafrost Site in Svalbard 1 A R C T E X Results of the Arctic
Introduction to Climate ~ Part I ~
 2015/11/16 TCC Seminar JMA Introduction to Climate ~ Part I ~ Shuhei MAEDA (MRI/JMA) Climate Research Department Meteorological Research Institute (MRI/JMA) 1 Outline of the lecture 1. Climate System (
Lecture 1. Amplitude of the seasonal cycle in temperature
 Lecture 6 Lecture 1 Ocean circulation Forcing and large-scale features Amplitude of the seasonal cycle in temperature 1 Atmosphere and ocean heat transport Trenberth and Caron (2001) False-colour satellite
Transient/Eddy Flux. Transient and Eddy. Flux Components. Lecture 7: Disturbance (Outline) Why transients/eddies matter to zonal and time means?
 Why transients/eddies matter to zonal and time means?") Lecture 7: Disturbance (Outline) Transients and Eddies Climate Roles Mid-Latitude Cyclones Tropical Hurricanes Mid-Ocean Eddies (From Weather & Climate) Flux Components (1) (2) (3) Three components contribute
Lecture 7: Disturbance (Outline) Transients and Eddies Climate Roles Mid-Latitude Cyclones Tropical Hurricanes Mid-Ocean Eddies (From Weather & Climate) Flux Components (1) (2) (3) Three components contribute
Arctic Climate Change. Glen Lesins Department of Physics and Atmospheric Science Dalhousie University Create Summer School, Alliston, July 2013
 Arctic Climate Change Glen Lesins Department of Physics and Atmospheric Science Dalhousie University Create Summer School, Alliston, July 2013 When was this published? Observational Evidence for Arctic
IMPACT OF GROUND-BASED GPS PRECIPITABLE WATER VAPOR AND COSMIC GPS REFRACTIVITY PROFILE ON HURRICANE DEAN FORECAST. (a) (b) (c)
 (b) (c)") 9B.3 IMPACT OF GROUND-BASED GPS PRECIPITABLE WATER VAPOR AND COSMIC GPS REFRACTIVITY PROFILE ON HURRICANE DEAN FORECAST Tetsuya Iwabuchi *, J. J. Braun, and T. Van Hove UCAR, Boulder, Colorado 1. INTRODUCTION
9B.3 IMPACT OF GROUND-BASED GPS PRECIPITABLE WATER VAPOR AND COSMIC GPS REFRACTIVITY PROFILE ON HURRICANE DEAN FORECAST Tetsuya Iwabuchi *, J. J. Braun, and T. Van Hove UCAR, Boulder, Colorado 1. INTRODUCTION
ESS 111 Climate & Global Change. Week 1 Weather vs Climate Structure of the Atmosphere Global Wind Belts
 ESS 111 Climate & Global Change Week 1 Weather vs Climate Structure of the Atmosphere Global Wind Belts Weather is the state of the atmosphere at a given place and time. For example, right now, the temperature
The ozone hole indirect effect: Cloud-radiative anomalies accompanying the poleward shift of the eddy-driven jet in the Southern Hemisphere
 GEOPHYSICAL RESEARCH LETTERS, VOL. 4, 388 392, doi:1.12/grl.575, 213 The ozone hole indirect effect: Cloud-radiative anomalies accompanying the poleward shift of the eddy-driven jet in the Southern Hemisphere
Module 11: Meteorology Topic 5 Content: Weather Maps Notes
 Introduction A variety of weather maps are produced by the National Weather Service and National Oceanographic Atmospheric Administration. These maps are used to help meteorologists accurately predict
Large-Eddy Simulations of Tropical Convective Systems, the Boundary Layer, and Upper Ocean Coupling
 DISTRIBUTION STATEMENT A. Approved for public release; distribution is unlimited. Large-Eddy Simulations of Tropical Convective Systems, the Boundary Layer, and Upper Ocean Coupling Eric D. Skyllingstad
Chapter 3- Energy Balance and Temperature
 Chapter 3- Energy Balance and Temperature Understanding Weather and Climate Aguado and Burt Influences on Insolation Absorption Reflection/Scattering Transmission 1 Absorption An absorber gains energy
Lecture 9: Climate Sensitivity and Feedback Mechanisms
 Lecture 9: Climate Sensitivity and Feedback Mechanisms Basic radiative feedbacks (Plank, Water Vapor, Lapse-Rate Feedbacks) Ice albedo & Vegetation-Climate feedback Cloud feedback Biogeochemical feedbacks
Topic # 12 How Climate Works
 Topic # 12 How Climate Works A Primer on How the Energy Balance Drives Atmospheric & Oceanic Circulation, Natural Climatic Processes pp 63-68 in Class Notes How do we get energy from this........ to drive
CLIMATE AND CLIMATE CHANGE MIDTERM EXAM ATM S 211 FEB 9TH 2012 V1
 CLIMATE AND CLIMATE CHANGE MIDTERM EXAM ATM S 211 FEB 9TH 2012 V1 Name: Student ID: Please answer the following questions on your Scantron Multiple Choice [1 point each] (1) The gases that contribute to
Use the terms from the following list to complete the sentences below. Each term may be used only once.
 Skills Worksheet Directed Reading Section: Air Masses Use the terms from the following list to complete the sentences below. Each term may be used only once. high pressure poles low pressure equator wind
Mid-Latitude Cyclones and Fronts. Lecture 12 AOS 101
 Mid-Latitude Cyclones and Fronts Lecture 12 AOS 101 Homework 4 COLDEST TEMPS GEOSTROPHIC BALANCE Homework 4 FASTEST WINDS L Consider an air parcel rising through the atmosphere The parcel expands as it
Supplementary Figure 1. Summer mesoscale convective systems rainfall climatology and trends. Mesoscale convective system (MCS) (a) mean total
 (a) mean total") Supplementary Figure 1. Summer mesoscale convective systems rainfall climatology and trends. Mesoscale convective system (MCS) (a) mean total rainfall and (b) total rainfall trend from 1979-2014. Total
Supplementary Figure 1. Summer mesoscale convective systems rainfall climatology and trends. Mesoscale convective system (MCS) (a) mean total rainfall and (b) total rainfall trend from 1979-2014. Total
The meteorology of monsoons
 978--521-84799-5 - The Asian Monsoon: Causes, History and Effects 1 The meteorology of monsoons 1.1 Introduction Monsoon circulations are major features of the tropical atmosphere, which, primarily through
777 GROUNDSCHOOL Temperature, Stability, Fronts, & Thunderstorms
 777 GROUNDSCHOOL 2018 Temperature, Stability, Fronts, & Thunderstorms The Atmosphere Heating Transfer of heat occurs thru Radiation Advection Convection Matter changes states due to the amount of heat
The Atmosphere. Importance of our. 4 Layers of the Atmosphere. Introduction to atmosphere, weather, and climate. What makes up the atmosphere?
 The Atmosphere Introduction to atmosphere, weather, and climate Where is the atmosphere? Everywhere! Completely surrounds Earth February 20, 2010 What makes up the atmosphere? Argon Inert gas 1% Variable
Changes in seasonal cloud cover over the Arctic seas from satellite and surface observations
 GEOPHYSICAL RESEARCH LETTERS, VOL. 31, L12207, doi:10.1029/2004gl020067, 2004 Changes in seasonal cloud cover over the Arctic seas from satellite and surface observations Axel J. Schweiger Applied Physics
Topic # 11 HOW CLIMATE WORKS PART II
 Topic # 11 HOW CLIMATE WORKS PART II The next chapter in the story: How differences in INSOLATION between low and high latitudes drive atmospheric circulation! pp 64 in Class Notes THE RADIATION BALANCE
EAS270, The Atmosphere Mid-term Exam 27 Oct, 2006
 EAS270, The Atmosphere Mid-term Exam 27 Oct, 2006 Professor: J.D. Wilson Time available: 50 mins Value: 20% Instructions: For all 32 multi-choice questions, choose what you consider to be the best (or
Mid-Latitude Dynamics and Atmospheric Rivers
 Mid-Latitude Dynamics and Atmospheric Rivers Session: Theory, Structure, Processes 1 Wednesday, 10 August 2016 Contribution from: Heini Werni Peter Knippertz Harold Sodemann Andreas Stohl Francina Dominguez
CHAPTER 8 NUMERICAL SIMULATIONS OF THE ITCZ OVER THE INDIAN OCEAN AND INDONESIA DURING A NORMAL YEAR AND DURING AN ENSO YEAR
 CHAPTER 8 NUMERICAL SIMULATIONS OF THE ITCZ OVER THE INDIAN OCEAN AND INDONESIA DURING A NORMAL YEAR AND DURING AN ENSO YEAR In this chapter, comparisons between the model-produced and analyzed streamlines,
The North Atlantic Oscillation: Climatic Significance and Environmental Impact
 1 The North Atlantic Oscillation: Climatic Significance and Environmental Impact James W. Hurrell National Center for Atmospheric Research Climate and Global Dynamics Division, Climate Analysis Section
An Introduction to Coupled Models of the Atmosphere Ocean System
 An Introduction to Coupled Models of the Atmosphere Ocean System Jonathon S. Wright jswright@tsinghua.edu.cn Atmosphere Ocean Coupling 1. Important to climate on a wide range of time scales Diurnal to
The impact of an intense summer cyclone on 2012 Arctic sea ice retreat. Jinlun Zhang*, Ron Lindsay, Axel Schweiger, and Michael Steele
 The impact of an intense summer cyclone on 2012 Arctic sea ice retreat Jinlun Zhang*, Ron Lindsay, Axel Schweiger, and Michael Steele *Corresponding author Polar Science Center, Applied Physics Laboratory
P R O L O G U E CORRELATION COEF. dsst/dt during wintertime (i.e., end of Feb. minus beginning of Dec, using 11-day averaged climatology)
") P R O L O G U E dsst/dt during wintertime (i.e., end of Feb. minus beginning of Dec, using 11-day averaged climatology) Correlation between total precipitable water (from NVAP-M) and total cloud (from
P R O L O G U E dsst/dt during wintertime (i.e., end of Feb. minus beginning of Dec, using 11-day averaged climatology) Correlation between total precipitable water (from NVAP-M) and total cloud (from
2018 Science Olympiad: Badger Invitational Meteorology Exam. Team Name: Team Motto:
 2018 Science Olympiad: Badger Invitational Meteorology Exam Team Name: Team Motto: This exam has 50 questions of various formats, plus 3 tie-breakers. Good luck! 1. On a globally-averaged basis, which
Fluid Circulation Review. Vocabulary. - Dark colored surfaces absorb more energy.
 Fluid Circulation Review Vocabulary Absorption - taking in energy as in radiation. For example, the ground will absorb the sun s radiation faster than the ocean water. Air pressure Albedo - Dark colored
Torben Königk Rossby Centre/ SMHI
 Fundamentals of Climate Modelling Torben Königk Rossby Centre/ SMHI Outline Introduction Why do we need models? Basic processes Radiation Atmospheric/Oceanic circulation Model basics Resolution Parameterizations
SINGLE-COLUMN MODEL SIMULATIONS OF ARCTIC CLOUDINESS AND SURFACE RADIATIVE FLUXES DURING THE SURFACE HEAT BUDGET OF ARCTIC (SHEBA) EXPERIMENT
 EXPERIMENT") SINGLE-COLUMN MODEL SIMULATIONS OF ARCTIC CLOUDINESS AND SURFACE RADIATIVE FLUXES DURING THE SURFACE HEAT BUDGET OF ARCTIC (SHEBA) EXPERIMENT By Cécile Hannay RECOMMENDED: Advisory Committee Chair Department
SINGLE-COLUMN MODEL SIMULATIONS OF ARCTIC CLOUDINESS AND SURFACE RADIATIVE FLUXES DURING THE SURFACE HEAT BUDGET OF ARCTIC (SHEBA) EXPERIMENT By Cécile Hannay RECOMMENDED: Advisory Committee Chair Department
Eurasian Snow Cover Variability and Links with Stratosphere-Troposphere Coupling and Their Potential Use in Seasonal to Decadal Climate Predictions
 US National Oceanic and Atmospheric Administration Climate Test Bed Joint Seminar Series NCEP, Camp Springs, Maryland, 22 June 2011 Eurasian Snow Cover Variability and Links with Stratosphere-Troposphere
ENSO Outlook by JMA. Hiroyuki Sugimoto. El Niño Monitoring and Prediction Group Climate Prediction Division Japan Meteorological Agency
 ENSO Outlook by JMA Hiroyuki Sugimoto El Niño Monitoring and Prediction Group Climate Prediction Division Outline 1. ENSO impacts on the climate 2. Current Conditions 3. Prediction by JMA/MRI-CGCM 4. Summary
Wind: Global Systems Chapter 10
 Wind: Global Systems Chapter 10 General Circulation of the Atmosphere General circulation of the atmosphere describes average wind patterns and is useful for understanding climate Over the earth, incoming
Temperature (T) degrees Celsius ( o C) arbitrary scale from 0 o C at melting point of ice to 100 o C at boiling point of water Also (Kelvin, K) = o C
 degrees Celsius ( o C) arbitrary scale from 0 o C at melting point of ice to 100 o C at boiling point of water Also (Kelvin, K) = o C") 1 2 3 4 Temperature (T) degrees Celsius ( o C) arbitrary scale from 0 o C at melting point of ice to 100 o C at boiling point of water Also (Kelvin, K) = o C plus 273.15 0 K is absolute zero, the minimum
1 2 3 4 Temperature (T) degrees Celsius ( o C) arbitrary scale from 0 o C at melting point of ice to 100 o C at boiling point of water Also (Kelvin, K) = o C plus 273.15 0 K is absolute zero, the minimum
The assimilation of AMSU and SSM/I brightness temperatures in clear skies at the Meteorological Service of Canada
 The assimilation of AMSU and SSM/I brightness temperatures in clear skies at the Meteorological Service of Canada Abstract David Anselmo and Godelieve Deblonde Meteorological Service of Canada, Dorval,
Spectral Albedos. a: dry snow. b: wet new snow. c: melting old snow. a: cold MY ice. b: melting MY ice. d: frozen pond. c: melting FY white ice
 Spectral Albedos a: dry snow b: wet new snow a: cold MY ice c: melting old snow b: melting MY ice d: frozen pond c: melting FY white ice d: melting FY blue ice e: early MY pond e: ageing ponds Extinction
Chapter 7: Thermodynamics
 Chapter 7: Thermodynamics 7.1 Sea surface heat budget In Chapter 5, we have introduced the oceanic planetary boundary layer-the Ekman layer. The observed T and S in this layer are almost uniform vertically,
The Planetary Circulation System
 12 The Planetary Circulation System Learning Goals After studying this chapter, students should be able to: 1. describe and account for the global patterns of pressure, wind patterns and ocean currents
Insolation and Temperature variation. The Sun & Insolation. The Sun (cont.) The Sun
 The Sun") Insolation and Temperature variation Atmosphere: blanket of air surrounding earth Without our atmosphere: cold, quiet, cratered place Dynamic: currents and circulation cells June 23, 2008 Atmosphere important
Insolation and Temperature variation Atmosphere: blanket of air surrounding earth Without our atmosphere: cold, quiet, cratered place Dynamic: currents and circulation cells June 23, 2008 Atmosphere important
Science 1206 Chapter 1 - Inquiring about Weather
 Science 1206 Chapter 1 - Inquiring about Weather 1.1 - The Atmosphere: Energy Transfer and Properties (pp. 10-25) Weather and the Atmosphere weather the physical conditions of the atmosphere at a specific
TC/PR/RB Lecture 3 - Simulation of Random Model Errors
 TC/PR/RB Lecture 3 - Simulation of Random Model Errors Roberto Buizza (buizza@ecmwf.int) European Centre for Medium-Range Weather Forecasts http://www.ecmwf.int Roberto Buizza (buizza@ecmwf.int) 1 ECMWF
Electromagnetic Radiation. Radiation and the Planetary Energy Balance. Electromagnetic Spectrum of the Sun
 Radiation and the Planetary Energy Balance Electromagnetic Radiation Solar radiation warms the planet Conversion of solar energy at the surface Absorption and emission by the atmosphere The greenhouse
Challenges for Climate Science in the Arctic. Ralf Döscher Rossby Centre, SMHI, Sweden
 Challenges for Climate Science in the Arctic Ralf Döscher Rossby Centre, SMHI, Sweden The Arctic is changing 1) Why is Arctic sea ice disappearing so rapidly? 2) What are the local and remote consequences?
The Impact of the Extratropical Transition of Typhoon Dale (1996) on the Early Wintertime Stratospheric Circulation
 on the Early Wintertime Stratospheric Circulation") The Impact of the Extratropical Transition of Typhoon Dale (1996) on the Early 1996-97 Wintertime Stratospheric Circulation Andrea L. Lang 1, Jason M. Cordeira 2, Lance F. Bosart 1 and Daniel Keyser 1
The Impact of the Extratropical Transition of Typhoon Dale (1996) on the Early 1996-97 Wintertime Stratospheric Circulation Andrea L. Lang 1, Jason M. Cordeira 2, Lance F. Bosart 1 and Daniel Keyser 1
SUPPLEMENTARY INFORMATION
 SUPPLEMENTARY INFORMATION DOI: 1.138/NCLIMATE1884 SPRINGTIME ATMOSPHERIC ENERGY TRANSPORT AND THE CONTROL OF ARCTIC SUMMER SEA-ICE EXTENT Supplementary discussion In the main text it is argued that positive
Storm and Storm Systems Related Vocabulary and Definitions. Magnitudes are measured differently for different hazard types:
 Storm and Storm Systems Related Vocabulary and Definitions Magnitude: this is an indication of the scale of an event, often synonymous with intensity or size. In natural systems, magnitude is also related
Air Masses of North America cp and ca air masses Air mass characterized by very cold and dry conditions
 Chapter 8: Air Masses, Fronts, and Middle-Latitude Cyclones Air masses Fronts Middle-latitude cyclones Air Masses Air mass an extremely large body of air whose properties of temperature and humidity are
Connection between NAO/AO, surface climate over Northern Eurasia: snow cover force - possible mechanism.
 Connection between NAO/AO, surface climate over Northern Eurasia: snow cover force - possible mechanism. Krupchatnikov V., Yu. Martynova (Pr. Ac. Lavrentieva, 6, Novosibirsk, 630090, Russia; tel: 330 61-51;
HEAT, TEMPERATURE, AND ATMOSPHERIC CIRCULATION
 CHAPTER 4 HEAT, TEMPERATURE, AND ATMOSPHERIC CIRCULATION MULTIPLE CHOICE QUESTIONS 1. Heat is *a. the name given to the energy transferred between objects at different temperatures. b. the equivalent of
Final Exam Answers. b. List the assumptions you made. Steady state heat and uniform temperature
 Final Exam Answers 1. [4] A planet in a distant galaxy has a solar constant of 3000W/m2, a radius of 12,000km and an albedo of a=0.6. a. Estimate the surface temperature of the planet. b. List the assumptions
5. General Circulation Models
 5. General Circulation Models I. 3-D Climate Models (General Circulation Models) To include the full three-dimensional aspect of climate, including the calculation of the dynamical transports, requires
John Steffen and Mark A. Bourassa
 John Steffen and Mark A. Bourassa Funding by NASA Climate Data Records and NASA Ocean Vector Winds Science Team Florida State University Changes in surface winds due to SST gradients are poorly modeled
Middle-Latitude Cyclone
 Middle-Latitude Cyclone What is a mid-latitude cyclone? - The mid-latitude cyclone is a synoptic scale low pressure system that has cyclonic (counter-clockwise in northern hemisphere) flow that is found
The feature of atmospheric circulation in the extremely warm winter 2006/2007
 The feature of atmospheric circulation in the extremely warm winter 2006/2007 Hiroshi Hasegawa 1, Yayoi Harada 1, Hiroshi Nakamigawa 1, Atsushi Goto 1 1 Climate Prediction Division, Japan Meteorological
3. Midlatitude Storm Tracks and the North Atlantic Oscillation
 3. Midlatitude Storm Tracks and the North Atlantic Oscillation Copyright 2006 Emily Shuckburgh, University of Cambridge. Not to be quoted or reproduced without permission. EFS 3/1 Review of key results
Chapter 2 Solar and Infrared Radiation
 Chapter 2 Solar and Infrared Radiation Chapter overview: Fluxes Energy transfer Seasonal and daily changes in radiation Surface radiation budget Fluxes Flux (F): The transfer of a quantity per unit area
Lecture 7: The Monash Simple Climate
 Climate of the Ocean Lecture 7: The Monash Simple Climate Model Dr. Claudia Frauen Leibniz Institute for Baltic Sea Research Warnemünde (IOW) claudia.frauen@io-warnemuende.de Outline: Motivation The GREB
A Preliminary Assessment of the Simulation of Cloudiness at SHEBA by the ECMWF Model. Tony Beesley and Chris Bretherton. Univ.
 A Preliminary Assessment of the Simulation of Cloudiness at SHEBA by the ECMWF Model Tony Beesley and Chris Bretherton Univ. of Washington 16 June 1998 Introduction This report describes a preliminary
A. Weather - the conditions of the variables of the atmosphere for any short period of time
 WEATHER & THE ATMOSPHERE A. Weather - the conditions of the variables of the atmosphere for any short period of time Meteorology - the study of weather and weather related variables - the variables: Topic
The HIGHTSI ice model and plans in SURFEX
 Air Snow T in Ice with snow cover T sfc x T snow Q si F si h s h s The HIGHTSI ice model and plans in SURFEX Bin Cheng and Laura Rontu Water Ice T ice h i Finnish Meteorological Institute, FI-11 Helsinki,
over the Pacific and Atlantic basins
 7D.5 Meridional moisture transport by tropical synoptic scale disturbances over the Pacific and Atlantic basins Chia-chi Wang and Gudrun Magnusdottir University of California, Irvine, California 1. Introduction
Modeling Challenges At High Latitudes. Judith Curry Georgia Institute of Technology
 Modeling Challenges At High Latitudes Judith Curry Georgia Institute of Technology Physical Process Parameterizations Radiative transfer Surface turbulent fluxes Cloudy boundary layer Cloud microphysics