TRANSPORT AND DISTRIBUTION OF ATMOSPHERIC AEROSOLS AS INFERRED BY SATELLITE MEASUREMENTS
|
|
|
- MargaretMargaret Lynch
- 5 years ago
- Views:
Transcription
1 CHAPTER 3 TRANSPORT AND DISTRIBUTION OF ATMOSPHERIC AEROSOLS AS INFERRED BY SATELLITE MEASUREMENTS 3.1. Introduction The processes whereby air motions carry physical or chemical properties from one region of the atmosphere to another are collectively referred to as transport. Many of the particles in the atmosphere are emitted or produced at the surface. Transport of these aerosols begins in the atmospheric boundary layer (ABL), the dynamically variable layer just above the surface. Air within the ABL is characterised by horizontal winds having a high degree of turbulence. During intense convection air from the ABL moves vertically into the free troposphere. Dust aerosols are considered to be one of the major sources of tropospheric aerosol loading and constitute an important parameter in climate aerosol forcing studies (Kaufman et al., 2001; Slingo et al., 2006). These aerosols have a significant role in the earth system by altering the radiation balance in the atmosphere through the scattering and absorption of radiation (Tegen et al., 1997; Haywood and Boucher, 2000; Harrison et al., 2001; Sokolik et al., 2001) and suppressing precipitation (Rosenfeld, 2000). This property of dust aerosols has initiated research in the detection and mapping of dust aerosols and has become a subject of extensive study in several part of world (Moulin et al., 1998; Prospero, 1999; Li et al., 2008). The impact of these aerosols in the Earth system depends mainly on particle size, shape and mineralogy that are initially determined by their source (Mahowald et al., 2005). During transport, the size distribution of these dust particles shifts rapidly to smaller particles because of the rapid fallout of large particles (i.e., 5 10 μm diameter and greater); at distances of a few hundreds of kilometers or more from the
2 source, (e.g., Duce, 1995) although some very large particles can be carried great distances (Betzer et al., 1988; Carder et al.,1986). The smaller aerosol particles have higher lifetime in the atmosphere and influence the atmospheric conditions at distant locations away from its source. Observations and numerical models show that aerosol scattering of ultraviolet (UV) radiation in the boundary layer accelerate photochemical reactions and smog production, while the presence of UV-absorbing aerosols in the atmosphere affects the radiation balance (Haywood and Shine,1995; Ardanuy et al., 1992). The atmospheric loading of UV absorbing aerosols is the sum of several large annually cyclic sources of aerosols distributed over broad areas by tropospheric wind circulation. Satellite imagery shows that dust aerosols often cover very extensive areas are more persistent and occur more frequently than those associated with pollutant aerosols (Husar et al., 1997). In such a scenario, the use of satellite observations becomes the most efficient way to determine aerosol physical properties on the temporal and spatial scales needed to understand and monitor their effects on the earth atmosphere system. Continuous measurement of dust aerosols in the visible wavelength is challenging because of the intense surface reflection over deserts as well as arid regions. So, an approach to retrieve aerosol properties using measurements in the near-ultraviolet spectral region has emerged (Torres et al., 1998). The aerosol detection capability in the near UV became apparent with the development of the Total Ozone Mapping Spectrometer aerosol index (TOMS AI), as a by-product of the TOMS version 7 ozone algorithm (McPeters et al., 1996). The main advantages of the near-uv approach are the high sensitivity to particle absorption, and the capability of retrieving aerosol properties over most terrestrial surfaces including deserts. Therefore, one can clearly observe the occurrence of large dust events over the 69
3 continents and subsequently follow the movement of large-scale plumes (Herman et al., 1997). During the summer months, dust is observed daily for periods of a week to several months. The largest sources of UV absorbing aerosols in the atmosphere are from biomass burning and wind borne desert dust from events that last a week or longer. Every year large quantities of dust are injected into the atmosphere over the deserts during this time. Strong winds can blow sand from these desert regions into the free troposphere, from where then it is advected over large distances (e.g. Prospero and Carlson, 1972; Prospero et al., 2002; Israelevich et al., 2003; Kubilay et al., 2005). The majority of the desert dust originates at the latitude of the Sahara and Sahel regions (near 10 0 N 28 0 N) and is a belt stretching from the western coast of Africa passing through central Asia (Arabian Peninsula) to north-western India (Thar Desert). The prevailing upper level winds are favourable in bringing the dust laden air from arid locations in Africa, the Mediterranean and from the Thar Desert. Long-range transport of desert dust mainly takes place in the upper troposphere (e.g. Prospero and Carlson, 1972; Hamonou et al., 1999; Murayama et al., 2001, Amiridis et al., 2005), where the aerosol lifetime is of the order of two weeks. The Indian subcontinent which is bounded by Himalayan ranges and Tibetan plateau to its north creates a favourable condition for the conglomeration of aerosols. The dry conditions generally existing during the non-monsoon months helps in the piling up of dust aerosols. An increase in these aerosols can influence climate by modifying the concentration of climate influencing constituents Data and Analysis The present analysis is for 10 years for the years ranging from The decadal variability of aerosol loading is studied using the Aerosol Index (AI) dataset 70
4 obtained from the Earth Probe TOMS and Ozone Monitoring Instrument (OMI) onboard NASA s Aura satellite. The TOMS AI dataset is used for the years 2000 to For the remaining years OMI data sets are used. Both these sensors measure the backscattered UV radiance in three longest wavelength bands (340, 360 and 380 nm) where the gaseous absorption is weak. The net aerosol effects on back- scattered radiation are primarily governed by aerosol absorption of both Rayleigh and Mie scattered radiation as well as scattering and absorption of radiation reflected by underlying surface (Torres et al., 1998). The algorithm for detection of aerosol and clouds from backscattered UV radiance measurement is based on the residue theory described in Herman et al. (1997) and Torres et al. (1998). The residue method is based on the principle that for fixed 380 nm radiance the I 340 /I 380 spectral contrast is largest for non-absorbing aerosol and clouds and deceases with increasing absorption. From the backscattered radiance measurements in the UV region of the spectrum, the retrieval algorithm computes an absorbing AI which is a qualitative measure of the presence of UV absorbing aerosols, such as mineral dust and smoke. Desert dust has a direct effect on the AI because of its wavelength dependent imaginary part of the refractive index in the UV (de Graaf et al., 2005). The AI is positive for absorbing aerosols and negative for non-absorbing, while values of AI near zero indicate the presence of clouds. The wind speed at 700 hpa is obtained from NCEP/NCAR reanalysis data. The 700 hpa level was chosen due to the fact that the main dust activity is around this level. The aerosol pathway is determined using the Air Resources Laboratory s HYbrid Single-Particle Lagrangian Integrated Trajectory (HYSPLIT) analysis. It is a complete system for computing air parcel trajectories. The calculation method is based on Lagrangian approach, which uses a moving frame of reference as the air parcels move from their initial location. 71


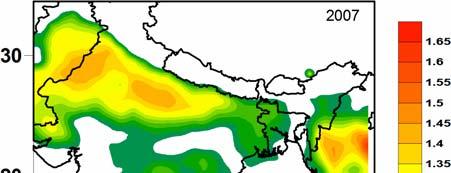
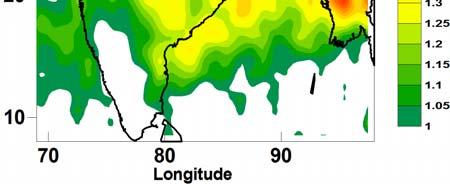
5 3.3. Results and Discussion Seasonal variation of Aerosol Index Fig. 3.1 shows the spatial plots of AI over the Indian subcontinent for the 10 years taken into consideration. The analysis is for the pre-monsoon and post-monsoon seasons for each year. From the figure, it can be seen that aerosol concentration is higher during the pre-monsoon season than during post-monsoon season. The area of highest loading is extended from North West India towards the IGP. A close scrutiny of figure shows that aerosol concentration is higher in the belt 70 0 E E and 21 0 N 29 0 N. Fig. 3.1(a). Aerosol Index during the pre-monsoon season over the Indian subcontinent 72
.")


6 Fig. 3.1(a). Aerosol Index during the pre-monsoon season over the Indian subcontinent (continued.) 73
7 Pre-monsoon season aerosol loading is characterised with a high aerosol loading in the magnitude between 1 and 1.65 over the region. Such an enormous accumulation of aerosols is seen in this region and analysis shows that such a large build up of aerosols occurs during most of the years compared to the surrounding regions. Absence of rainfall which is an effective removal process may one of the major reasons for the piling up of aerosols. Also, prevailing upper levels winds are westerlies bringing copious amount of dust aerosols from the Middle East (Prospero et al., 2002) and adjoining Thar Desert regions (Moorthy et al., 2007). These aerosols on reaching North Indian plains mixes with the anthropogenic aerosols produced from industries and incomplete combustion of fossil fuels and biomass (Habib et al 2006). Moreover, surface winds are very weak so that effective dispersion of aerosols in the location fails, increasing the surface concentration of aerosols. These aerosols are mainly confined over IGP probably due to the topography of the region. Therefore, the natural as well as the anthropogenic sources combined with the dry conditions that exist during the season enhances the buildup of absorbing aerosols. The influence of wind will be discussed in detail in final section of this chapter. Higher values of AI are seen in the even years of 2000, 2002, 2004, 2006, In the year 2003, aerosol concentrations were higher which may be possibly due to drought conditions existed in the year In the pre-monsoon season of the year 2002 a high AI value of about 1.6 existed in most parts of IGP and central India. The dry conditions that existed during the year enhance the production of absorbing aerosols, so that concentrations of these aerosols continued through the following year which is evident from the higher values in Except for the year 2003, it can be seen that a higher concentration of absorbing aerosols occur in every alternate years starting with the year


).")


8 A majority of the absorbing aerosols gets washed away in the monsoon season which spans for almost four months from June to September. As a result, during post monsoon season the AI value diminishes compared to pre-monsoon season. In the post-monsoon season also, the North Indian region and IGP have the most accumulation of absorbing aerosols compared to the surrounding regions (Fig. 3.1(b)). In the post-monsoon season, the AI values are higher in the odd years of 2001, 2005, 2007 and In the year 2003, AI values were very less throughout the country during the post-monsoon season. Fi g. 3.1(b). Aerosol Index during post-monsoon season over the Indian subcontinent 75
.")


9 Fig. 3.1(b). Aerosol Index during post-monsoon season over the Indian subcontinent (continued) 76
10 Influence of wind speed on Aerosol Index Prevailing winds at 700 hpa during pre-monsoon and post-monsoon seasons are illustrated in fig. 3.2(a) and 3.2(b) respectively. From the analysis of wind speed and direction for the pre-monsoon season, it is seen that strong and persistent winds are present at 700 hpa (~ 3km) over the region. Winds are westerlies at a magnitude of 8 12 ms -1 and have their pathways through major dust sources over the 30 0 latitude belt. Therefore, the dust aerosols present in the source region get transported by these upper level winds and get deposited in the north Indian region. These airmass are continental in nature and the absence of effective removal mechanisms (eg. rainfall) creates a favourable condition for their loading in the atmosphere. Also, the surface winds are weak that enables the deposition of aerosols. Therefore, absorbing aerosols resulting from long distance transport and anthropogenic sources (eg. combustion of fossil fuels and emission from industries) contribute to the large concentration of absorbing aerosols in the location. By the month of June, the prevailing winds shift its direction and become south westerlies and south easterlies which are predominantly composed of marine aerosols. As a result, the contribution of absorbing aerosols in the total aerosol loading decreases and gets replaced by maritime airmass. The intense wind associated with the monsoonal circulation along with the rainfall removes the aerosol content in the atmosphere. Therefore, the total aerosol concentration in the atmosphere decreases. During the post-monsoon season, the majority of winds are the North easterlies with a weak westerly component. Since there are no prominent dust sources towards the east of the study region, the concentration of aerosols remains low. 77

11 Fig. 3.2(a). Prevailing winds at 700 hpa during pre-monsoon season for the years 2000 to
 dominates the circulation system over the study region.")
12 Fig. 3.2(a). Prevailing winds at 700 hpa during pre-monsoon season for the years 2000 to 2009 (contd.) During the post-monsoon season (Fig.3.2 (b)), in contrast to pre-monsoon season the zonal winds at 700 hpa level gets weaker. The magnitude of winds is in range of 2 to 4 ms -1. At 700 hpa level, south westerly winds of greater intensity (> 4ms -1 ) dominates the circulation system over the study region. This high velocity wind obliterates the weaker westerly dust laden winds. Since, these westerly winds are coming from pristine oceanic regions and constitutes marine airmass results in the dilution of the concentration of absorbing aerosols over the study region. This may be the possible reason for a reduction in concentration of absorbing aerosols during the post-monsoon season. 79


13 Fig. 3.2(b). Prevailing winds at 700 hpa for post-monsoon season during the years 2000 to
 and 3.3(b).")
14 Fig. 3.2(b). Prevailing winds at 700 hpa for post-monsoon season during the years 2000 to 2009 (contd.) Back Trajectory Analysis Hysplit back trajectories are used to find the source of aerosols that reaches the Indian region. Back trajectories for both pre-monsoon and post-monsoon seasons are shown in figures 3.3(a) and 3.3(b). From the analysis it is found that during the premonsoon months the pathways of the trajectories are through the arid regions of Mediterranean, Arabian and Thar Desert regions. These are the major source of dust aerosols and contribute to the aerosol loading over the Indian regions. A major quantity of aerosols reaching the place is from desert locations in central Asia. 81


15 Fig 3.3(a). Back trajectories of aerosol particles reaching the location during the pre-monsoon season. Colour bar indicates altitude in meters. 82


16 Fig 3.3(a). Back trajectories of aerosol particles reaching the location during the pre-monsoon season. Colour bar indicates altitude in meters (Continued). From the above figures it can be seen that the aerosol transport occurs at 3 to 7 km above the surface and are advected towards the north Indian region by means of prevailing winds where they get blocked by Himalayan ranges and gets deposited. In the back trajectory analysis, it clearly shows that aerosol transport takes place in the Northerly direction. There is also a westerly component of the airmass during the time. Another importance feature is that most the transport occurs between 1.5 to 5 km levels, which are also another factor for the less aerosol concentration in the region. This is the characteristics of the airmass for almost all the years except for 2006, during which the airmass are predominantly easterlies. These results are in accordance with those reported by Herman et al. (1997) Gautam et al. (2009) in 83


17 which increased biomass burning and dust activity contributes to the aerosol loading in the Indian subcontinent. During the post monsoon season, winds are so weak and the trajectories are passing through the North western parts of India. These regions have no major sources of dust aerosols and thus, the loading of dust aerosols are less. During the post monsoon season of 2000 aerosols that reaches India is a result of long distance transport from locations as far as from the Sahara desert. From their source regions they reach an altitude of 9 km where they have a highest life time before depositing over India. Fig 3.3(b). Back trajectories of aerosol particles reaching the location during the post-monsoon season. Colour bar indicates altitude in meters. 84


18 Fig 3.3(b). Back trajectories of aerosol particles reaching the location during the post-monsoon season. Colour bar indicates altitude in meters (Continued). 85
19 Effect of El-Nino and La-Nina The El Niño Southern Oscillation (ENSO) is the largest known global climate variability signal on interannual time scales. It is a quasi-periodical fluctuation between warm El-Niño and cold La- Niña states of the Pacific sea surface temperatures and has a recurrence oscillation period of approximately 2 to 7 years (Philander, 1990). El Niño and La Niña events are denoted respectively by negative and positive trends in the Southern Oscillation Index (SOI). Whilst the largest ENSO signature exists in and over the tropical Pacific, it also affects global atmospheric circulation on a wider scale through the so-called teleconnection effects (Diaz and Kiladis, 1992; Xue and Shukla, 1997; Dawson and O Hare, 2000). It is well known that El-Nino and La-Nina oscillations contribute significantly to the climate variability throughout the globe with El-Nino being dry and warm and La-Nina generally wet and cool. Moreover, the regional temperature, precipitation and circulation patterns vary between El-Nino and La-Nina years. This in turn affects the production and propagation of dust aerosols as well as on the extent of biomass burning which are main sources of aerosols in the Indian region. The ENSO impact on the transport, deposition and variability of these aerosols over the Indian subcontinent is less understood. It is evident from figures 3.1(a) and 3.1(b) that it is during the years 2000, 2002, 2003, 2004, 2008 pre-monsoon season and 2009 post-monsoon season has a large concentration of absorbing aerosols. Moreover, the following monsoon seasons for and 2009 were drought years ( /Historical/air.html). Table 3.1 gives the warm (El-Nino) and cold (La-Nina) events during the years 2000 to The Oceanic Niño Index (ONI) has become the defacto standard that NOAA uses for identifying El Niño (warm) and La Niña (cool) events in the tropical Pacific (Trenberth, 1997). It is the running 3-month mean SST anomaly for the Niño 3.4 region (i.e., 5 o N-5 o S, 120 o -170 o W). Events are defined as 5 consecutive months at or above the +0.5 o anomaly for warm (El Niño) events and at or below the -0.5 anomaly for cold (La Niña) events. The threshold is further 86
20 broken down into Weak (with a 0.5 to 0.9 SST anomaly), Moderate (1.0 to 1.4) and Strong ( 1.5) events. For an event to be weak, moderate or strong it much have equaled or exceeded the threshold for at least 3 months. Based on these criteria, El- Nino and La-Nina events are classified into weak, moderate and strong phases and are given in Table 3.2. During the year 2002, ONI shifts from cold phase to warm phase in the premonsoon months. This warm phase became intense by post-monsoon season and it persisted till the pre-monsoon season of the year High positive ONI indicates a moderate El-Nino condition in those years. After a weak phase in the postmonsoon season of 2003, the warm phase again became active in the pre-monsoon season of 2004 which continued into the post-monsoon season of the same year. Years 2004 and 2006 are defined as weak El-Nino years. Cold phases of ONI are seen in the pre-monsoon season of the years 2000, 2001, 2008 and in the postmonsoon season of the year The year 2000 is a weak La-Nina year 2007 and 2008 are moderate La-Nina years. Table 3.1. Warm and cold phases of oceanic Nino Index Year DJF JFM FMA MAM AMJ MJJ JJA JAS ASO SON OND NDJ
21 Table 3.2. Intensity of El-Nino and La-Nina phases ( El-Nino La-Nina Weak Moderate Strong Weak Moderate Strong It is seen that during the El-Nino (2002, 2003, 2004, 2006, and 2009) events the region experiences an intense accumulation of absorbing aerosols. For the year 2009, the AI values are less (1.25 to 1.3) compared to other years because El-Nino intensifies after the pre-monsoon season. During El-Nino years generally dry and warm conditions prevail globally, while La-Nina years are characterized by unusually wet and cool conditions. Dry conditions create a positive feedback for the production and propagation of dust aerosols. These conditions also leads to increased biomass burning which further enhances the loading of absorbing aerosols in the atmosphere. But during La-Nina years (2000, 2007, 2008) the AI values exhibits lesser concentration as compared to El-Nino events. As mentioned before, AI values depend upon the presence of absorbing aerosols in the region. Most of the absorbing aerosols reaching the location are through long distant transport by zonal winds. Since, El-Nino and La-Nina events results in the modification of zonal winds in the equatorial regions, changes in the intensity of wind patterns will definitely influence the transport and deposition of these aerosols and in turn the concentration of absorbing aerosols in the study region. Fig 3.4 depicts the composite of prevailing zonal winds at 700 hpa during El-Nino and La-Nina years respectively. The figure clearly shows that winds at that level is stronger over the source locations in Arabian Peninsula during El-Nino events compared to La-Nina events. Strong winds are blowing eastwards towards the 88


22 Indian region during El-Nino years. High intensity of winds with a magnitude of 8 to 12 ms -1 is blowing eastwards during the time. The wind vectors are closely spaced signifying high intensity. These high velocity winds are spread across vast areas of Arabian Desert regions which is one the major source of dust aerosols. These intense zonal winds are capable of transporting aerosols in large quantities towards the study region. However, during La-Nina years winds are generally weaker with a magnitude of 6 to 10 ms -1. High velocity winds are confined to a small area and the weaker magnitude of upper level winds contribute to lesser quantity of aerosols transported eastwards towards the study region. Fig Composite of prevailing winds at 700 hpa during El-Nino and La-Nina years respectively Fig 3.5 illustrates composite of El-Nino and La-Nina years in the altitude longitude zonal wind (u) and vertical velocity (ω) averaged over the latitude (7 0 N 30 0 N). From the figure, it can be seen that an intense vertical motion exists over the Arabian Peninsula (35 0 E E) which is indicated by larger vertical wind velocity. The dust aerosol that moves along with these vertical winds reaches upper levels of the atmosphere and merges with the prevailing wind at 700 hpa level. As mentioned before winds at these levels are of prime importance as major dust 89

23 transport occurs at this level. Dust aerosols that reach this level moves eastwards along with the direction of the upper level winds towards the Indian region. Over the Indian region these winds gets subsided that results in the deposition of aerosols which is carried along with these winds. As a result, these absorbing aerosols get deposited in the region over IGP. Fig.3.5. Height-longitude plot of the u wind and omega averaged over the latitude (7 0 N 30 0 N) 90
24 The Fig.3.5 illustrates that the convergence of upper level wind starts from the 200 hpa level and the winds that are descending are so intense that along with these winds they brings down the aerosols to the surface level. The descending winds are stronger during El-Nino years in comparison to La-Nina years. Due to higher intensity of subsiding winds from upper levels, the aerosol reaches the lower atmosphere in larger quantities resulting in an increased aerosol concentration. This accumulation of aerosols is indicated by high AI values during the El-Nino years. However, circulations show a different characteristic during the La-Nina years. La- Nina composite plot shows that the even though upward circulation is strong over the dust aerosol source regions in Arabian Peninsula, when it reaches the 700 hpa level they weaken so that the quantity of dust transported eastwards is considerably less. This zonal circulation cell completes with the subsidence of upper level winds at 70 0 E 75 0 E longitude. But, the downward limb of the circulation is so weak over the Indian region in the longitudinal belt extending from 75 0 E to E, so that subsiding air becomes weak as it approaches 750 hpa levels. As the descending winds gets weaker the quantity of aerosols reaching the lower levels decreases. This explains the lower AI values over the North Indian region during La-Nina years. Also, a wet and cool condition that occurs during La-Nina years decreases the production and propagation of these absorbing aerosols. The effect of the convergence of upper levels winds and the consequent enhancement of AI can be seen in Fig 3.6. As illustrated in the figure high concentration of aerosols can be seen at Indian region during El-Nino years. During this time AI values ranges from 1.25 to 1.65 over most parts of India. Peak values of 1.65 are observed at North India especially over the IGP. A secondary maximum of 1.45 is seen over West Bengal region. Dry conditions that existed during El-Nino create a favourable condition for the enhancement of these aerosols. Convergence of upper level winds which is a main carrier of aerosols was very intense during the time. All these factors contribute to the high AI values during El-Nino years. As 91


25 mentioned before, La-Nina years are characterized by wet conditions. Wind system shows a weak downwelling of upper level winds over India. Therefore, aerosol loading in the regions becomes substantially less as indicated in the Fig 3.6. The AI values ranges from 1 to 1.45 over the central and north India. Very lower AI values (< 1) are seen in the peninsular India. Peak AI values of 1.45 are over North West India and IGP. Fig Aerosol Index composites for El-Nino years and La-Nina years over the Indian subcontinent Back trajectory analysis shows that major share of the aerosols that reaching the Indian region during La-Nina is from south westerly and northerly directions (Fig 3.7). Therefore the amount of UV absorbing aerosols will be significantly less quantity. But, during El-Nino conditions most of the aerosols reaching the location can be traced back from major source areas over the Arabian and African desert regions. These aerosols that get transported from source locations reaches up to an altitude level of 3 to 4 km from the surface. At these levels aerosols travel long distance without settling. Himalayan range acts as a barrier for these prevailing winds so that the air mass that carry aerosols get subsided over the region. 92


26 Fig 3.7 Back trajectory analysis for El-Nino and La-Nina composites The back trajectory analysis shows that aerosols that reaching this location has its origin in major arid zones in Arabian Peninsula and West Asia which are the major sources of dust aerosols. Most of the airmass has a westerly component indicates that dust sources in the adjacent locations influence the aerosol concentration over India. The other source location of aerosol is from the Thar Desert. The trajectory path way that takes place at 1 km and 1.5 km is due to the combustion of fossil fuels and biomass burning. Therefore, aerosols resulting from sources at distant locations as well as due to enhanced combustion of carbonaceous fuels and biomass burning contribute to higher aerosol loading in El-Nino conditions. The dry conditions prevailing during El-Nino favours the production of these types of aerosols. But, during La-Nina years the aerosol pathway is not along the major aerosol sources. Back trajectory analysis indicates that the components of aerosol pathways are in northerly and south westerly directions. Due to the weaker zonal winds, the long range transports of aerosols from desert locations are less. Most of the aerosols reaching the location are from nearby locations. Weaker westerly winds may have contributed to lesser quantity of aerosols reaching the place. Hence the transport of aerosols is marginal compared to El-Nino years. All these factors may have contributed to less concentration of aerosols in the region during La-Nina year. 93
27 3.4. Conclusions Transport and deposition of aerosols is more during the pre-monsoon season than in post-monsoon season for all the years taken into consideration. Aerosols reaches the Indian subcontinent as a result of long distance transport by mean of prevailing winds at 700 hpa (~ 3km). These aerosols get deposited in the longitudinal belt ranging from 70 0 E to 90 0 E. The piling up of aerosols increases the concentration in the atmosphere as indicated by higher values in AI during pre-monsoon season. The following monsoon season washes out the aerosols present in the atmosphere so that AI will be lower during the monsoon season. During post monsoon season, the prevailing westerlies are not stronger as in the case of pre-monsoon. The AI values were higher in the pre-monsoon season during the years of 2000, 2002, 2004, 2006 and 2008 with an exception of the year Since winds are one of the major factors for the transport and distribution of aerosols, weakening and strengthening of zonal winds has an influence in the concentration of aerosols in the region. It is during the El-Nino years the Indian subcontinent shows an enhancement of aerosol concentration. It is seen that during El-Nino years, the zonal winds are of higher intensity particularly over the source regions of Arabian Peninsula. These strong zonal winds carry aerosols eastwards towards Indian region and get subsided over the Indian subcontinent. The descending of upper level winds is so strong during those El-Nino years that most of the aerosols in the upper levels reach the lower atmosphere increasing the aerosol concentration. But during La-Nina events the situation reverses. The zonal wind at 700 hpa weakens and also the subsidence of upper levels winds are weakens there by less subsidence of upper level winds. Therefore, the aerosol concentration becomes decreased during La-Nina years. Aerosol Index composite during El-Nino years shows that higher aerosol concentrations over most parts of India, while La-Nina years are characterized by less AI values. 94
ENSO Cycle: Recent Evolution, Current Status and Predictions. Update prepared by Climate Prediction Center / NCEP July 26, 2004
 ENSO Cycle: Recent Evolution, Current Status and Predictions Update prepared by Climate Prediction Center / NCEP July 26, 2004 Outline Overview Recent Evolution and Current Conditions Oceanic NiZo Index
ENSO Cycle: Recent Evolution, Current Status and Predictions. Update prepared by Climate Prediction Center / NCEP 23 April 2012
 ENSO Cycle: Recent Evolution, Current Status and Predictions Update prepared by Climate Prediction Center / NCEP 23 April 2012 Outline Overview Recent Evolution and Current Conditions Oceanic Niño Index
ENSO Cycle: Recent Evolution, Current Status and Predictions. Update prepared by Climate Prediction Center / NCEP 15 July 2013
 ENSO Cycle: Recent Evolution, Current Status and Predictions Update prepared by Climate Prediction Center / NCEP 15 July 2013 Outline Overview Recent Evolution and Current Conditions Oceanic Niño Index
ENSO Cycle: Recent Evolution, Current Status and Predictions. Update prepared by Climate Prediction Center / NCEP 25 February 2013
 ENSO Cycle: Recent Evolution, Current Status and Predictions Update prepared by Climate Prediction Center / NCEP 25 February 2013 Outline Overview Recent Evolution and Current Conditions Oceanic Niño Index
ENSO Cycle: Recent Evolution, Current Status and Predictions. Update prepared by Climate Prediction Center / NCEP 24 September 2012
 ENSO Cycle: Recent Evolution, Current Status and Predictions Update prepared by Climate Prediction Center / NCEP 24 September 2012 Outline Overview Recent Evolution and Current Conditions Oceanic Niño
ENSO Cycle: Recent Evolution, Current Status and Predictions. Update prepared by Climate Prediction Center / NCEP 5 August 2013
 ENSO Cycle: Recent Evolution, Current Status and Predictions Update prepared by Climate Prediction Center / NCEP 5 August 2013 Outline Overview Recent Evolution and Current Conditions Oceanic Niño Index
ENSO Cycle: Recent Evolution, Current Status and Predictions. Update prepared by Climate Prediction Center / NCEP 11 November 2013
 ENSO Cycle: Recent Evolution, Current Status and Predictions Update prepared by Climate Prediction Center / NCEP 11 November 2013 Outline Overview Recent Evolution and Current Conditions Oceanic Niño Index
ENSO: Recent Evolution, Current Status and Predictions. Update prepared by: Climate Prediction Center / NCEP 9 November 2015
 ENSO: Recent Evolution, Current Status and Predictions Update prepared by: Climate Prediction Center / NCEP 9 November 2015 Outline Summary Recent Evolution and Current Conditions Oceanic Niño Index (ONI)
KUALA LUMPUR MONSOON ACTIVITY CENT
 T KUALA LUMPUR MONSOON ACTIVITY CENT 2 ALAYSIAN METEOROLOGICAL http://www.met.gov.my DEPARTMENT MINISTRY OF SCIENCE. TECHNOLOGY AND INNOVATIO Introduction Atmospheric and oceanic conditions over the tropical
How Patterns Far Away Can Influence Our Weather. Mark Shafer University of Oklahoma Norman, OK
 Teleconnections How Patterns Far Away Can Influence Our Weather Mark Shafer University of Oklahoma Norman, OK Teleconnections Connectedness of large-scale weather patterns across the world If you poke
Zambia. General Climate. Recent Climate Trends. UNDP Climate Change Country Profiles. Temperature. C. McSweeney 1, M. New 1,2 and G.
 UNDP Climate Change Country Profiles Zambia C. McSweeney 1, M. New 1,2 and G. Lizcano 1 1. School of Geography and Environment, University of Oxford. 2. Tyndall Centre for Climate Change Research http://country-profiles.geog.ox.ac.uk
Characteristics of Global Precipitable Water Revealed by COSMIC Measurements
 Characteristics of Global Precipitable Water Revealed by COSMIC Measurements Ching-Yuang Huang 1,2, Wen-Hsin Teng 1, Shu-Peng Ho 3, Ying-Hwa Kuo 3, and Xin-Jia Zhou 3 1 Department of Atmospheric Sciences,
The aerosol- and water vapor-related variability of precipitation in the West Africa Monsoon
 The aerosol- and water vapor-related variability of precipitation in the West Africa Monsoon Jingfeng Huang *, C. Zhang and J. M. Prospero Rosenstiel School of Marine and Atmospheric Science, University
ENSO: Recent Evolution, Current Status and Predictions. Update prepared by: Climate Prediction Center / NCEP 30 October 2017
 ENSO: Recent Evolution, Current Status and Predictions Update prepared by: Climate Prediction Center / NCEP 30 October 2017 Outline Summary Recent Evolution and Current Conditions Oceanic Niño Index (ONI)
Malawi. General Climate. UNDP Climate Change Country Profiles. C. McSweeney 1, M. New 1,2 and G. Lizcano 1
 UNDP Climate Change Country Profiles Malawi C. McSweeney 1, M. New 1,2 and G. Lizcano 1 1. School of Geography and Environment, University of Oxford. 2. Tyndall Centre for Climate Change Research http://country-profiles.geog.ox.ac.uk
lecture 10 El Niño and the Southern Oscillation (ENSO) Part I sea surface height anomalies as measured by satellite altimetry
 Part I sea surface height anomalies as measured by satellite altimetry") lecture 10 El Niño and the Southern Oscillation (ENSO) Part I sea surface height anomalies as measured by satellite altimetry SPATIAL STRUCTURE OF ENSO In 1899, the Indian monsoon failed, leading to drought
lecture 10 El Niño and the Southern Oscillation (ENSO) Part I sea surface height anomalies as measured by satellite altimetry SPATIAL STRUCTURE OF ENSO In 1899, the Indian monsoon failed, leading to drought
UPDATE OF REGIONAL WEATHER AND SMOKE HAZE (February 2018)
") UPDATE OF REGIONAL WEATHER AND SMOKE HAZE (February 2018) 1. Review of Regional Weather Conditions for January 2018 1.1 The prevailing Northeast monsoon conditions over Southeast Asia strengthened in January
UPDATE OF REGIONAL WEATHER AND SMOKE HAZE (February 2018) 1. Review of Regional Weather Conditions for January 2018 1.1 The prevailing Northeast monsoon conditions over Southeast Asia strengthened in January
Forecasting. Theory Types Examples
 Forecasting Theory Types Examples How Good Are Week Out Weather Forecasts? For forecasts greater than nine days out, weather forecasters do WORSE than the climate average forecast. Why is there predictability
Suriname. General Climate. Recent Climate Trends. UNDP Climate Change Country Profiles. Temperature. C. McSweeney 1, M. New 1,2 and G.
 UNDP Climate Change Country Profiles Suriname C. McSweeney 1, M. New 1,2 and G. Lizcano 1 1. School of Geography and Environment, University of Oxford. 2. Tyndall Centre for Climate Change Research http://country-profiles.geog.ox.ac.uk
TROPICAL-EXTRATROPICAL INTERACTIONS
 Notes of the tutorial lectures for the Natural Sciences part by Alice Grimm Fourth lecture TROPICAL-EXTRATROPICAL INTERACTIONS Anomalous tropical SST Anomalous convection Anomalous latent heat source Anomalous
UPDATE OF REGIONAL WEATHER AND SMOKE HAZE (September 2017)
") UPDATE OF REGIONAL WEATHER AND SMOKE HAZE (September 2017) 1. Review of Regional Weather Conditions in August 2017 1.1 Southwest Monsoon conditions continued to prevail in the region in August 2017. The
UPDATE OF REGIONAL WEATHER AND SMOKE HAZE (September 2017) 1. Review of Regional Weather Conditions in August 2017 1.1 Southwest Monsoon conditions continued to prevail in the region in August 2017. The
UPDATE OF REGIONAL WEATHER AND SMOKE HAZE (May 2017)
") UPDATE OF REGIONAL WEATHER AND SMOKE HAZE (May 2017) 1. Review of Regional Weather Conditions in April 2017 1.1 Inter monsoon conditions, characterised by afternoon showers and winds that are generally
UPDATE OF REGIONAL WEATHER AND SMOKE HAZE (May 2017) 1. Review of Regional Weather Conditions in April 2017 1.1 Inter monsoon conditions, characterised by afternoon showers and winds that are generally
Effects Of Aerosols On Indian Summer Monsoon Rainfall During El Niño
 International Workshop on Atmospheric Composition and the Asian Summer Monsoon Bangkok 8th-10th June 2015 Effects Of On Indian Summer Monsoon Rainfall During El Niño Suvarna Fadnavis, CHAITRI ROY, Ashok
UPDATE OF REGIONAL WEATHER AND SMOKE HAZE (December 2017)
") UPDATE OF REGIONAL WEATHER AND SMOKE HAZE (December 2017) 1. Review of Regional Weather Conditions for November 2017 1.1 In November 2017, Southeast Asia experienced inter-monsoon conditions in the first
UPDATE OF REGIONAL WEATHER AND SMOKE HAZE (December 2017) 1. Review of Regional Weather Conditions for November 2017 1.1 In November 2017, Southeast Asia experienced inter-monsoon conditions in the first
MPACT OF EL-NINO ON SUMMER MONSOON RAINFALL OF PAKISTAN
 MPACT OF EL-NINO ON SUMMER MONSOON RAINFALL OF PAKISTAN Abdul Rashid 1 Abstract: El-Nino is the dominant mod of inter- annual climate variability on a planetary scale. Its impact is associated worldwide
Climate and the Atmosphere
 Climate and Biomes Climate Objectives: Understand how weather is affected by: 1. Variations in the amount of incoming solar radiation 2. The earth s annual path around the sun 3. The earth s daily rotation
The seasonality of transportation in the Southern African subregion is considered. By
 CHAPTER 3 RESULTS AND DISCUSSION This Chapter discusses the findings of the research. A seasonal air transport climatology for southern Africa is presented. The months of February, April, July and October
Mozambique. General Climate. UNDP Climate Change Country Profiles. C. McSweeney 1, M. New 1,2 and G. Lizcano 1
 UNDP Climate Change Country Profiles Mozambique C. McSweeney 1, M. New 1,2 and G. Lizcano 1 1. School of Geography and Environment, University of Oxford. 2.Tyndall Centre for Climate Change Research http://country-profiles.geog.ox.ac.uk
Will a warmer world change Queensland s rainfall?
 Will a warmer world change Queensland s rainfall? Nicholas P. Klingaman National Centre for Atmospheric Science-Climate Walker Institute for Climate System Research University of Reading The Walker-QCCCE
Seasonal Persistence and Propagation of Intraseasonal Patterns over the Indian Monsoon Region
 Seasonal Persistence and Propagation of Intraseasonal Patterns over the Indian Monsoon Region V. Krishnamurthy and J. Shukla Center for Ocean-Land-Atmosphere Studies Institute of Global Environment and
3. Carbon Dioxide (CO 2 )
") 3. Carbon Dioxide (CO 2 ) Basic information on CO 2 with regard to environmental issues Carbon dioxide (CO 2 ) is a significant greenhouse gas that has strong absorption bands in the infrared region and
3. Carbon Dioxide (CO 2 ) Basic information on CO 2 with regard to environmental issues Carbon dioxide (CO 2 ) is a significant greenhouse gas that has strong absorption bands in the infrared region and
Cape Verde. General Climate. Recent Climate. UNDP Climate Change Country Profiles. Temperature. Precipitation
 UNDP Climate Change Country Profiles C. McSweeney 1, M. New 1,2 and G. Lizcano 1 1. School of Geography and Environment, University of Oxford. 2. Tyndall Centre for Climate Change Research http://country-profiles.geog.ox.ac.uk
Name: Date: Hour: Comparing the Effects of El Nino & La Nina on the Midwest (E4.2c)
") Purpose: Comparing the Effects of El Nino & La Nina on the Midwest (E4.2c) To compare the effects of El Nino and La Nina on the Midwest United States. Background Knowledge: The El Nino-Southern Oscillation
Purpose: Comparing the Effects of El Nino & La Nina on the Midwest (E4.2c) To compare the effects of El Nino and La Nina on the Midwest United States. Background Knowledge: The El Nino-Southern Oscillation
Seasonal Climate Outlook for South Asia (June to September) Issued in May 2014
 Issued in May 2014") Ministry of Earth Sciences Earth System Science Organization India Meteorological Department WMO Regional Climate Centre (Demonstration Phase) Pune, India Seasonal Climate Outlook for South Asia (June
Ministry of Earth Sciences Earth System Science Organization India Meteorological Department WMO Regional Climate Centre (Demonstration Phase) Pune, India Seasonal Climate Outlook for South Asia (June
World Geography Chapter 3
 World Geography Chapter 3 Section 1 A. Introduction a. Weather b. Climate c. Both weather and climate are influenced by i. direct sunlight. ii. iii. iv. the features of the earth s surface. B. The Greenhouse
Chapter outline. Reference 12/13/2016
 Chapter 2. observation CC EST 5103 Climate Change Science Rezaul Karim Environmental Science & Technology Jessore University of science & Technology Chapter outline Temperature in the instrumental record
The Planetary Circulation System
 12 The Planetary Circulation System Learning Goals After studying this chapter, students should be able to: 1. describe and account for the global patterns of pressure, wind patterns and ocean currents
ENSO, AO, and climate in Japan. 15 November 2016 Yoshinori Oikawa, Tokyo Climate Center, Japan Meteorological Agency
 ENSO, AO, and climate in Japan 15 November 2016 Yoshinori Oikawa, Tokyo Climate Center, Japan Meteorological Agency Aims of this lecture At the end of the yesterday s lecture, Hare-run said, - In the exercise
The North Atlantic Oscillation: Climatic Significance and Environmental Impact
 1 The North Atlantic Oscillation: Climatic Significance and Environmental Impact James W. Hurrell National Center for Atmospheric Research Climate and Global Dynamics Division, Climate Analysis Section
Implications of Sulfate Aerosols on Clouds, Precipitation and Hydrological Cycle
 Implications of Sulfate Aerosols on Clouds, Precipitation and Hydrological Cycle Source: Sulfate aerosols are produced by chemical reactions in the atmosphere from gaseous precursors (with the exception
Energy Systems, Structures and Processes Essential Standard: Analyze patterns of global climate change over time Learning Objective: Differentiate
 Energy Systems, Structures and Processes Essential Standard: Analyze patterns of global climate change over time Learning Objective: Differentiate between weather and climate Global Climate Focus Question
East-west SST contrast over the tropical oceans and the post El Niño western North Pacific summer monsoon
 GEOPHYSICAL RESEARCH LETTERS, VOL. 32, L15706, doi:10.1029/2005gl023010, 2005 East-west SST contrast over the tropical oceans and the post El Niño western North Pacific summer monsoon Toru Terao Faculty
2. Fargo, North Dakota receives more snow than Charleston, South Carolina.
 2015 National Tournament Division B Meteorology Section 1: Weather versus Climate Chose the answer that best answers the question 1. The sky is partly cloudy this morning in Lincoln, Nebraska. 2. Fargo,
North Pacific Climate Overview N. Bond (UW/JISAO), J. Overland (NOAA/PMEL) Contact: Last updated: August 2009
, J. Overland (NOAA/PMEL) Contact: Last updated: August 2009") North Pacific Climate Overview N. Bond (UW/JISAO), J. Overland (NOAA/PMEL) Contact: Nicholas.Bond@noaa.gov Last updated: August 2009 Summary. The North Pacific atmosphere-ocean system from fall 2008 through
North Pacific Climate Overview N. Bond (UW/JISAO), J. Overland (NOAA/PMEL) Contact: Nicholas.Bond@noaa.gov Last updated: August 2009 Summary. The North Pacific atmosphere-ocean system from fall 2008 through
Impact of the 2002 stratospheric warming in the southern hemisphere on the tropical cirrus clouds and convective activity
 The Third International SOWER meeting,, Lake Shikotsu,, July 18-20, 2006 1 Impact of the 2002 stratospheric warming in the southern hemisphere on the tropical cirrus clouds and convective activity Eguchi,
EVALUATION OF BROAD SCALE VERTICAL CIRCULATION AND THERMAL INDICES IN RELATION TO THE ONSET OF INDIAN SUMMER MONSOON
 INTERNATIONAL JOURNAL OF CLIMATOLOGY Int. J. Climatol. 22: 649 661 (2002) Published online in Wiley InterScience (www.interscience.wiley.com). DOI: 10.1002/joc.742 EVALUATION OF BROAD SCALE VERTICAL CIRCULATION
Wind: Global Systems Chapter 10
 Wind: Global Systems Chapter 10 General Circulation of the Atmosphere General circulation of the atmosphere describes average wind patterns and is useful for understanding climate Over the earth, incoming
Website Lecture 3 The Physical Environment Part 1
 Website http://websites.rcc.edu/halama Lecture 3 The Physical Environment Part 1 1 Lectures 3 & 4 1. Biogeochemical Cycling 2. Solar Radiation 3. The Atmosphere 4. The Global Ocean 5. Weather and Climate
Thai Meteorological Department, Ministry of Digital Economy and Society
 Thai Meteorological Department, Ministry of Digital Economy and Society Three-month Climate Outlook For November 2017 January 2018 Issued on 31 October 2017 -----------------------------------------------------------------------------------------------------------------------------
What a Hurricane Needs to Develop
 Massive Storms! Hurricanes What a Hurricane Needs to Develop Warm tropical water - at least 80 F High Humidity Light wind Low Pressure Area Form between 5 and 20 latitude Hurricane Ingredients Hurricane
African dust over the Canaries. Long term variability of the summer Saharan dust export
 African dust over the Canaries Long term variability of the summer Saharan dust export Sergio Rodríguez srodriguezg@aemet.es Izaña Atmospheric Research Centre, AEMET, Tenerife 1 Long term aerosols: Total
North Pacific Climate Overview N. Bond (UW/JISAO), J. Overland (NOAA/PMEL) Contact: Last updated: September 2008
, J. Overland (NOAA/PMEL) Contact: Last updated: September 2008") North Pacific Climate Overview N. Bond (UW/JISAO), J. Overland (NOAA/PMEL) Contact: Nicholas.Bond@noaa.gov Last updated: September 2008 Summary. The North Pacific atmosphere-ocean system from fall 2007
North Pacific Climate Overview N. Bond (UW/JISAO), J. Overland (NOAA/PMEL) Contact: Nicholas.Bond@noaa.gov Last updated: September 2008 Summary. The North Pacific atmosphere-ocean system from fall 2007
Cuba. General Climate. Recent Climate Trends. UNDP Climate Change Country Profiles. Temperature. C. McSweeney 1, M. New 1,2 and G.
 UNDP Climate Change Country Profiles Cuba C. McSweeney 1, M. New 1,2 and G. Lizcano 1 1. School of Geography and Environment, University of Oxford. 2. Tyndall Centre for Climate Change Research http://country-profiles.geog.ox.ac.uk
The regional distribution characteristics of aerosol optical depth over the Tibetan Plateau
 The regional distribution characteristics of aerosol optical depth over the Tibetan Plateau C. Xu, Y. M. Ma, CAS Center for Excellence in Tibetan Plateau Earth Sciences, Chinese Academy of Sciences xuchao@itpcas.ac.cn
Environmental Science Chapter 13 Atmosphere and Climate Change Review
 Environmental Science Chapter 13 Atmosphere and Climate Change Review Multiple Choice Identify the choice that best completes the statement or answers the question. 1. Climate in a region is a. the long-term,
Climate Outlook for December 2015 May 2016
 The APEC CLIMATE CENTER Climate Outlook for December 2015 May 2016 BUSAN, 25 November 2015 Synthesis of the latest model forecasts for December 2015 to May 2016 (DJFMAM) at the APEC Climate Center (APCC),
Introduction of climate monitoring and analysis products for one-month forecast
 Introduction of climate monitoring and analysis products for one-month forecast TCC Training Seminar on One-month Forecast on 13 November 2018 10:30 11:00 1 Typical flow of making one-month forecast Observed
WATER VAPOR FLUXES OVER EQUATORIAL CENTRAL AFRICA
 WATER VAPOR FLUXES OVER EQUATORIAL CENTRAL AFRICA INTRODUCTION A good understanding of the causes of climate variability depend, to the large extend, on the precise knowledge of the functioning of the
Science Results Based on Aura OMI-MLS Measurements of Tropospheric Ozone and Other Trace Gases
 Science Results Based on Aura OMI-MLS Measurements of Tropospheric Ozone and Other Trace Gases J. R. Ziemke Main Contributors: P. K. Bhartia, S. Chandra, B. N. Duncan, L. Froidevaux, J. Joiner, J. Kar,
the 2 past three decades
 SUPPLEMENTARY INFORMATION DOI: 10.1038/NCLIMATE2840 Atlantic-induced 1 pan-tropical climate change over the 2 past three decades 3 4 5 6 7 8 9 10 POP simulation forced by the Atlantic-induced atmospheric
ESS 111 Climate & Global Change. Week 1 Weather vs Climate Structure of the Atmosphere Global Wind Belts
 ESS 111 Climate & Global Change Week 1 Weather vs Climate Structure of the Atmosphere Global Wind Belts Weather is the state of the atmosphere at a given place and time. For example, right now, the temperature
Antigua and Barbuda. General Climate. Recent Climate Trends. UNDP Climate Change Country Profiles. Temperature
 UNDP Climate Change Country Profiles Antigua and Barbuda C. McSweeney 1, M. New 1,2 and G. Lizcano 1 1. School of Geography and Environment, University of Oxford. 2. Tyndall Centre for Climate Change Research
Introduction to Climate ~ Part I ~
 2015/11/16 TCC Seminar JMA Introduction to Climate ~ Part I ~ Shuhei MAEDA (MRI/JMA) Climate Research Department Meteorological Research Institute (MRI/JMA) 1 Outline of the lecture 1. Climate System (
surrounds Earth and protects it somewhat from solar radiation. Like all other matter, air has weight,
 The air that we breathe comes from the atmosphere, a thin gaseous layer that surrounds Earth and protects it somewhat from solar radiation. Like all other matter, air has weight, but this weight varies
The feature of atmospheric circulation in the extremely warm winter 2006/2007
 The feature of atmospheric circulation in the extremely warm winter 2006/2007 Hiroshi Hasegawa 1, Yayoi Harada 1, Hiroshi Nakamigawa 1, Atsushi Goto 1 1 Climate Prediction Division, Japan Meteorological
ENSO and April SAT in MSA. This link is critical for our regression analysis where ENSO and
 Supplementary Discussion The Link between El Niño and MSA April SATs: Our study finds a robust relationship between ENSO and April SAT in MSA. This link is critical for our regression analysis where ENSO
Global Wind Patterns
 Name: Earth Science: Date: Period: Global Wind Patterns 1. Which factor causes global wind patterns? a. changes in the distance between Earth and the Moon b. unequal heating of Earth s surface by the Sun
Possible Roles of Atlantic Circulations on the Weakening Indian Monsoon Rainfall ENSO Relationship
 2376 JOURNAL OF CLIMATE Possible Roles of Atlantic Circulations on the Weakening Indian Monsoon Rainfall ENSO Relationship C.-P. CHANG, PATRICK HARR, AND JIANHUA JU Department of Meteorology, Naval Postgraduate
Observation: predictable patterns of ecosystem distribution across Earth. Observation: predictable patterns of ecosystem distribution across Earth 1.
 Climate Chap. 2 Introduction I. Forces that drive climate and their global patterns A. Solar Input Earth s energy budget B. Seasonal cycles C. Atmospheric circulation D. Oceanic circulation E. Landform
Future extreme precipitation events in the Southwestern US: climate change and natural modes of variability
 Future extreme precipitation events in the Southwestern US: climate change and natural modes of variability Francina Dominguez Erick Rivera Fernandez Hsin-I Chang Christopher Castro AGU 2010 Fall Meeting
ATMOSPHERIC CIRCULATION AND WIND
 ATMOSPHERIC CIRCULATION AND WIND The source of water for precipitation is the moisture laden air masses that circulate through the atmosphere. Atmospheric circulation is affected by the location on the
Winter Steve Todd Meteorologist In Charge National Weather Service Portland, OR
 Winter 07-08 Steve Todd Meteorologist In Charge National Weather Service Portland, OR Overview Winter Weather Outlook How to stay informed Winter Outlook LaNina conditions are present across the tropical
Moist static energy budget diagnostics for. monsoon research. H. Annamalai
 Moist static energy budget diagnostics for monsoon research H. Annamalai JJAS Precipitation and SST Climatology I III II Multiple regional heat sources - EIO and SPCZ still experience high precipitation
The Global Monsoon Response to Volcanic Eruptions in the CMIP5 Past1000 Simulations and Model Simulations of FGOALS
 The Global Monsoon Response to Volcanic Eruptions in the CMIP5 Past1000 Simulations and Model Simulations of FGOALS Wenmin Man, Tianjun Zhou Email: manwenmin@mail.iap.ac.cn PAGES2k-PMIP3 Hydroclimate Workshop,
THE INFLUENCE OF CLIMATE TELECONNECTIONS ON WINTER TEMPERATURES IN WESTERN NEW YORK INTRODUCTION
 Middle States Geographer, 2014, 47: 60-67 THE INFLUENCE OF CLIMATE TELECONNECTIONS ON WINTER TEMPERATURES IN WESTERN NEW YORK Frederick J. Bloom and Stephen J. Vermette Department of Geography and Planning
Climate System. Sophie Zechmeister-Boltenstern
 Climate System Sophie Zechmeister-Boltenstern Reference: Chapin F. St., Matson P., Mooney Harold A. 2002 Principles of Terrestrial Ecosystem Ecology. Springer, Berlin, 490 p. Structure of this lecture
The PRECIS Regional Climate Model
 The PRECIS Regional Climate Model General overview (1) The regional climate model (RCM) within PRECIS is a model of the atmosphere and land surface, of limited area and high resolution and locatable over
Climate Forecast Applications Network (CFAN)
") Forecast of 2018 Atlantic Hurricane Activity April 5, 2018 Summary CFAN s inaugural April seasonal forecast for Atlantic tropical cyclone activity is based on systematic interactions among ENSO, stratospheric
Forecast of 2018 Atlantic Hurricane Activity April 5, 2018 Summary CFAN s inaugural April seasonal forecast for Atlantic tropical cyclone activity is based on systematic interactions among ENSO, stratospheric
GEO1010 tirsdag
 GEO1010 tirsdag 31.08.2010 Jørn Kristiansen; jornk@met.no I dag: Først litt repetisjon Stråling (kap. 4) Atmosfærens sirkulasjon (kap. 6) Latitudinal Geographic Zones Figure 1.12 jkl TØRR ATMOSFÆRE Temperature
7. Aerosols and Climate
 7. Aerosols and Climate I. Scattering 1. When radiation impinges on a medium of small particles, scattering of some of the radiation occurs in all directions. The portion scattered backward is called the
Name Date Class. growth rings of trees, fossilized pollen, and ocean. in the northern hemisphere.
 Lesson Outline LESSON 2 A. Long-Term Cycles 1. A(n) climate cycle takes much longer than a lifetime to complete. a. To learn about long-term climate cycles, scientists study natural records, such as growth
Weather & Ocean Currents
 Weather & Ocean Currents Earth is heated unevenly Causes: Earth is round Earth is tilted on an axis Earth s orbit is eliptical Effects: Convection = vertical circular currents caused by temperature differences
Saharan Dust Induced Radiation-Cloud-Precipitation-Dynamics Interactions
 Saharan Dust Induced Radiation-Cloud-Precipitation-Dynamics Interactions William K. M. Lau NASA/GSFC Co-authors: K. M. Kim, M. Chin, P. Colarco, A. DaSilva Atmospheric loading of Saharan dust Annual emission
Assessment of the Impact of El Niño-Southern Oscillation (ENSO) Events on Rainfall Amount in South-Western Nigeria
 Events on Rainfall Amount in South-Western Nigeria") 2016 Pearl Research Journals Journal of Physical Science and Environmental Studies Vol. 2 (2), pp. 23-29, August, 2016 ISSN 2467-8775 Full Length Research Paper http://pearlresearchjournals.org/journals/jpses/index.html
2016 Pearl Research Journals Journal of Physical Science and Environmental Studies Vol. 2 (2), pp. 23-29, August, 2016 ISSN 2467-8775 Full Length Research Paper http://pearlresearchjournals.org/journals/jpses/index.html
Evidence for Weakening of Indian Summer Monsoon and SA CORDEX Results from RegCM
 Evidence for Weakening of Indian Summer Monsoon and SA CORDEX Results from RegCM S K Dash Centre for Atmospheric Sciences Indian Institute of Technology Delhi Based on a paper entitled Projected Seasonal
St Lucia. General Climate. Recent Climate Trends. UNDP Climate Change Country Profiles. Temperature. Precipitation
 UNDP Climate Change Country Profiles St Lucia C. McSweeney 1, M. New 1,2 and G. Lizcano 1 1. School of Geography and Environment, University of Oxford. 2. Tyndall Centre for Climate Change Research http://country-profiles.geog.ox.ac.uk
Earth s Climate Patterns
 Earth s Climate Patterns Reading: Chapter 17, GSF 10/2/09 Also Jackson (linked on course web site) 1 What aspects of climate affect plant distributions? Climate: long-term distribution of weather in an
What is the Madden-Julian Oscillation (MJO)?
?") What is the Madden-Julian Oscillation (MJO)? Planetary scale, 30 90 day oscillation in zonal wind, precipitation, surface pressure, humidity, etc., that propagates slowly eastward Wavelength = 12,000 20,000
What is the Madden-Julian Oscillation (MJO)? Planetary scale, 30 90 day oscillation in zonal wind, precipitation, surface pressure, humidity, etc., that propagates slowly eastward Wavelength = 12,000 20,000
INVESTIGATION OF SAHARAN DUST TRANSPORT ON THE BASIS OF AEROLOGICAL MEASUREMENTS
 INVESTIGATION OF SAHARAN DUST TRANSPORT ON THE BASIS OF AEROLOGICAL MEASUREMENTS R. TÓTH 1, L. NYITRAI 1 ABSTRACT. Investigation of Saharan dust transport on the basis of aerological measurements. The
General Circulation. Nili Harnik DEES, Lamont-Doherty Earth Observatory
 General Circulation Nili Harnik DEES, Lamont-Doherty Earth Observatory nili@ldeo.columbia.edu Latitudinal Radiation Imbalance The annual mean, averaged around latitude circles, of the balance between the
University of Reading, Reading, United Kingdom. 2 Hadley Centre for Climate Prediction and Research, Meteorological Office, Exeter, United Kingdom.
 9.1 RUNNING A CLIMATE MODEL IN FORECAST MODE TO IDENTIFY THE SOURCE OF TROPICAL CLIMATE ERRORS: WITH SPECIFIC REFERENCE TO THE DRY BIAS OVER THE MARITIME CONTINENT IN AN ATMOSPHERE ONLY GCM 1 Jane Strachan,
On the Relationship between Western Maritime Continent Monsoon Rainfall and ENSO during Northern Winter
 1FEBRUARY 2004 CHANG ET AL. 665 On the Relationship between Western Maritime Continent Monsoon Rainfall and ENSO during Northern Winter C.-P. CHANG Department of Meteorology, Naval Postgraduate School,
Trends in the Saharan Air Layer Composition Observed at Izaña - Tenerife
 Izaña: 1916-2016 Trends in the Saharan Air Layer Composition Observed at Izaña - Tenerife Izaña Sergio Rodríguez srodriguezg@aemet.es Izaña Atmospheric Research Centre, Tenerife 1 -North Africa: 50-70%
ENSO Outlook by JMA. Hiroyuki Sugimoto. El Niño Monitoring and Prediction Group Climate Prediction Division Japan Meteorological Agency
 ENSO Outlook by JMA Hiroyuki Sugimoto El Niño Monitoring and Prediction Group Climate Prediction Division Outline 1. ENSO impacts on the climate 2. Current Conditions 3. Prediction by JMA/MRI-CGCM 4. Summary
UPDATE OF REGIONAL WEATHER AND SMOKE HAZE FOR MAY 2015
 UPDATE OF REGIONAL WEATHER AND SMOKE HAZE FOR MAY 2015 1. Review of Regional Weather Conditions in April 2015 1.1 Inter-Monsoon conditions prevailed over the ASEAN region in April 2015. The gradual northward
Global Weather Trade Winds etc.notebook February 17, 2017
 Global Weather 1 north pole northern hemisphere equator southern hemisphere south pole 2 We have seasons because of the Earth's tilt The seasons are opposite in the northern and southern hemispheres winter
Lecture 28: Observed Climate Variability and Change
 Lecture 28: Observed Climate Variability and Change 1. Introduction This chapter focuses on 6 questions - Has the climate warmed? Has the climate become wetter? Are the atmosphere/ocean circulations changing?
Fluid Circulation Review. Vocabulary. - Dark colored surfaces absorb more energy.
 Fluid Circulation Review Vocabulary Absorption - taking in energy as in radiation. For example, the ground will absorb the sun s radiation faster than the ocean water. Air pressure Albedo - Dark colored
Ocean Mixing and Climate Change
 Ocean Mixing and Climate Change Factors inducing seawater mixing Different densities Wind stirring Internal waves breaking Tidal Bottom topography Biogenic Mixing (??) In general, any motion favoring turbulent
A study of the impacts of late spring Tibetan Plateau snow cover on Chinese early autumn precipitation
 N U I S T Nanjing University of Information Science & Technology A study of the impacts of late spring Tibetan Plateau snow cover on Chinese early autumn precipitation JIANG Zhihong,HUO Fei,LIU Zhengyu