Caribbean Current Variability and the Influence of the Amazon and Orinoco Freshwater Plumes
|
|
|
- Paul Oliver
- 6 years ago
- Views:
Transcription
1 Caribbean Current Variability and the Influence of the Amazon and Orinoco Freshwater Plumes L.M. Chérubin 1 & P.L. Richardson 2 1 Rosenstiel School of Marine and Atmospheric Science, 4600 Rickenbacker Causeway, FL Miami, USA. 2 Department of Physical Oceanography, MS 29, Woods Hole Oceanographic Institution, 360 Woods Hole Road, Woods Hole, MA
2 Abstract The variability of the Caribbean Current is studied in terms of the influence on its dynamics of the freshwater inflow from the Orinoco and Amazon rivers. Sea-surface salinity maps of the eastern Caribbean and SeaWiFS color images show that a freshwater plume from the Orinoco and Amazon Rivers extends seasonally northwestward across the Caribbean basin, from August to November, 3 to 4 months after the peak of the seasonal rains in northeastern South America. The plume is sustained by two main inflows from the North Brazil Current and its current rings. The southern inflow enters the Caribbean Sea south of Grenada Island and becomes the main branch of the Caribbean Current in the southern Caribbean. The northern inflow (14 N) passes northward around the Grenadine Islands and St. Vincent. As North Brazil Current rings stall and decay east of the Lesser Antilles, between 14 N and 18 N, they release freshwater into the northern part of the eastern Caribbean Sea merging with inflow from the North Equatorial Current. Velocity vectors derived from surface drifters in the eastern Caribbean indicate three westward flowing jets: (1) the southern and fastest at 11 N; (2) the center and second fastest at 14 N; (3) the northern and slowest at 17 N. The center jet (14 N) flows faster between the months of August and December and is located near the southern part of the freshwater plume. Using the MICOM North Atlantic simulation, it is shown that the Caribbean Current is seasonally intensified near 14 N, partly by the inflow of river plumes. Three to four times more anticyclonic eddies are formed during August-December, which agrees with a pronounced rise in the number of anticyclonic looper days in the drifter data then. A climatology-forced regional simulation embedding only the northern (14 N) Caribbean Current (without the influence of the vorticity of the NBC rings), using the ROMS model, shows that the low salinity plume coincides with a negative potential vorticity anomaly that intensifies the center jet located at the salinity front. The jet forms cyclones south of the plume, which are moved northwestward as the anticyclonic circulation intensifies in the eastern Caribbean Sea, north of 14 N. Friction on the shelves of the Greater Antilles also generates cyclones, which propagate westward and eastward from 67 W. 2
3 1 Introduction River discharge plays an important role in the hydrological cycle and thermodynamic stability of the ocean. Knowledge of the variations in the extent and dispersal patterns of major river plumes and their mixing rates with oceanic water is critical in all aspects of continental shelf and regional oceanography. In particular, freshwater seasonally impinges on coral reef ecosystems, which affects the recruitment of larval reef fish (Kelly et al., 2000; Cowen and Castro, 1994) and fish mortality (Hu et al., 2004). The Caribbean Sea is influenced by the dispersal of the freshwater from the Amazon and Orinoco Rivers, which is discharged into the tropical Atlantic and advected into the Caribbean Sea (Fig. 1). The Caribbean Current is a major current, which transports South Atlantic water through the Caribbean and into the Florida Current and the Gulf Stream. It is an important conduit of the upper part of the northward-flowing meridional overturning circulation (Schmitz and Richardson, 1991; Schmitz and McCartney, 1993). South Atlantic water crosses the equator in the North Brazil Current (NBC) and flows northwestward along the continental margin of South America in the form of a coastal current (Candela et al., 1992; Dessier and Donguy, 1994), in NBC rings (Johns et al., 1990; Fratantoni et al., 1995; Goñi and Johns, 2001), and as Ekman transport in the ocean interior (Mayer and Weisberg, 1993). 3
4 During the summer and fall each year a major part of the NBC retroflects near 6 N and feeds into the eastward-flowing North Equatorial Countercurrent which is intensified then. In spring, the Countercurrent weakens and reverses at the surface as a result of westward Ekman flow. Occasionally, pieces of the NBC retroflection pinch of as large NBC rings (around 400 km in overall diameter), which translate northwestward toward the Caribbean Sea (Johns et al., 2003; Garzoli et al., 2003; Goñi and Johns, 2003; Fratantoni and Glickson, 2002; Ffield, 2005; Fratantoni and Richardson, 2006). Recent results from the NBC Rings Experiment suggest that 8-9 rings form per year transporting roughly 9 Sv (Johns et al., 2003) with no marked seasonal variability of the formation rate but with seasonal variations of ring structure (see Johns et al., 2003) and, possibly, significant year-to-year variability (Goñi and Johns, 2003). Some rings disappear after they collide with the continental margin and islands south of 14 N. Most rings translate northward as they approach the Lesser Antilles. They often interact and merge with each other around N, where they tend to stall and decay (modeling study by Garraffo et al., 2003; Fratantoni and Richardson, 2006). No ring has been observed to coherently enter the Caribbean through the island passages, although a modeling study by Simmons and Nof (2002) suggests that this is possible for large rings encountering the smaller islands to the north of the Grenadines. We infer from the available results that a main source of South Atlantic water flowing into the Caribbean Sea north of 14 N is carried to the islands by rings. Johns et al. (2002) showed that the overall distribution of the Atlantic inflow into the Caribbean is nearly evenly divided among three main groups of passages: the Windward 4
5 Islands passages, the Leeward Islands passages and the Greater Antilles passages. Most of the inflow through the Windward Islands passages occurs through the Grenada Passage located south of Grenada and near 11.5 N (Johns et al., 2002), forming the main Caribbean Current. Johns et al. (2002) report mean transports of 5.7 ± 0.8 Sv through Grenada Passage (11.7 N), 2.9 ± 0.8 Sv through St. Vincent Passage (13.5 N), and 1.5 ± 0.8 Sv through St Lucia Passage (14.3 N), where 1 Sv = 10 6 m 3 /s. The inflow is fed by the main NBC and from NBC rings that collide with the continental margin near Tobago (near 11.2N). Two bands of westward flow were observed by drifters in the southeastern Caribbean (61-64 W), one located near 11.5 N and the other farther north near 14 N (Centurioni and Niiler, 2003; Richardson, 2005). The northern band appears to originate in the flow through St. Vincent and St. Lucia Passages. The two bands merge downstream in the Caribbean Current near 66 W (Richardson, 2005). Intensification of the Caribbean Current associated with the Orinoco freshwater plume was shown by Hernandez-Guerra and Joyce (2000). In September 1997 they observed a fast (130 cm/s) westward jet centered at 13ºN and 66ºW near the southern edge of a mass of relatively freshwater with salinities around 34.5 located between 13-14ºN. The jet coincides with the salinity gradient region located between high salinity ~ 37.0 to the south and low salinity ~ 34.5 to the north. Low salinity values near 35.5 in the upper 50 m extended north to around 18ºN, indicating the freshwater plume passed northward through the eastern Caribbean at that time. Using the same Regional Ocean Modeling System (ROMS) simulation as in this study, Baums et al. (2006) showed that intensification of the jet south of the domain (14-15ºN) was followed by an increase of 5
6 the presence of mesoscale anticyclones south of Puerto Rico and Hispañola. Baums et al. (2006) focused on the impact on coral reef larvae of the seasonal changes of mesoscale and small scale eddy activity due to the presence of the freshwater plume. To do so, they defined two seasons, January-July (no freshwater advected into the Caribbean Sea) and August-December (plume of freshwater advected into the Caribbean Sea). They showed that, during the spawning season, in August, larvae would become trapped in small topographically steered eddies near the Mona island between Puerto Rico and Hispaniola (Fig. 1). No exchange of larvae would occur then between the eastern and western Caribbean. If larvae were released later in summer or fall, then dispersion would occur due to the presence of the anticyclones hugging the southern coast of Puerto Rico and Hispañola. Such dispersal variability was substantiated by genetic analysis of the coral larvae. This study focuses on how seasonal variations of the freshwater plume change the velocity structure and the meridional extent of the Caribbean Current in the eastern Caribbean Sea. We address the link between the seasonal supply of freshwater from the Orinoco and Amazon rivers and the two inflows, which transport this freshwater into the Caribbean Sea. We focus on the sources of the Caribbean Current that passes through the Windward Islands passages, south of Guadeloupe (16.3 N-61.5 W). We demonstrate that the intensification of the Caribbean Current near 14 N is correlated with the arrival of the freshwater plume as observed with sea surface salinity (SSS) maps, surface drifters and, Sea-viewing Wide Field-of-view Sensor (SeaWiFs) colored dissolved organic matter (CDOM) maps. In order to understand the intensification of the Caribbean Current by the 6
7 freshwater inflow and the origin of the Caribbean anticyclones, we used two numerical simulations. The first one is a realistic high-resolution (1/12, i.e ~ 6 km grid spacing) numerical simulation from 1979 to 1986 of the North Atlantic Ocean with the Miami Isopycnic Coordinate Ocean Model (MICOM, Bleck et al, 1992; Bleck and Chassignet, 1994), which has outputs available online at This simulation is used to verify and understand the links found in the observations between the freshwater plume and the changes of the Caribbean Current dynamics. In this simulation both the influence of the NBC rings and the freshwater plume are present. In order to test the unknown contribution of NBC rings and the influence alone of the freshwater plume to the Caribbean Current and anticyclones, a second regional simulation, without NBC rings is carried on with the Regional Ocean Modeling System (ROMS, Shchepetkin and McWilliams, 2005) model. This simulation encompasses only the northeastern Caribbean Sea so that NBC rings are not resolved, and it is forced by Levitus climatology (Da Silva, 1994). The freshwater plume is present and is shown to be the main source of negative potential vorticity anomaly in the northeastern Caribbean, which strengthens the Caribbean Current in that region. 2 Observations 2.1 Salinity maps The salinity maps were downloaded from the 2003 monthly climatology of the tropical Atlantic sea-surface salinity (40 S - 60 N) 3. The data used in the salinity maps were collected from ships of opportunity for the French Institute for Research and 3 7
8 Development (IRD) and from the World Ocean Database 2001 (WOD01) of the National Oceanographic Data Center (NODC). The monthly maps were generated from 1 x1 spatial averages and objective analysis of all the data. Further details on the data processing and analysis are given by Dessier and Donguy (1994). The salinity maps (Fig. 2) show seasonal variations of the two freshwater plumes that originate in the Amazon and Orinoco River discharges. The Amazon plume extends northwestward toward the Caribbbean during January-June while the salinities in the Caribbean remain fairly high then (~ 36.0). At the Amazon s maximum discharge in June (0.23 Sv, Muller-Karger et al., 1989; Hellweger and Gordon, 2002), its freshwater plume (< 34.0) covers a wide area of the tropical Atlantic from 0-15 N and W. Starting in July the main Amazon discharge appears to be advected eastward by the North Brazil Current retroflection and North Equatorial Countercurrent, leaving a remnant plume northwest of the retroflection. By December the eastward plume in the countercurrent has weakened and the earlier remnant plume northwest of the retroflection appears to have drifted into the Caribbean. In August at the time of the Orinoco s maximum discharge (0.07 Sv, Hellweger and Gordon, 2002), its freshwater plume extends northward and merges with the remnant Amazon plume. Between August and November the Orinoco plume appears to pass northwestward through the eastern Caribbean, contributing significant freshwater, which merges with Amazon water there. In the southeastern Caribbean salinities in the Orinoco plume drop below 34.0, reaching 33.0 in September. The seasonal variation of salinity in the eastern Caribbean near 15 N 65 W is shown in Figure 3. 8
9 Although the Amazon s mean discharge is around 6 times that of the Orinoco (Perry et al., 1996), the Amazon water is dispersed over a much larger area and travels nearly 2000 km to reach the Caribbean; the Orinoco River is only 300 km from the Caribbean and arrives there quickly (~ 10 days at an estimated 30 km/day), less diluted than the Amazon plume. Therefore, the Orinoco freshwater plume appears to be dominant in the eastern Caribbean during August to November and to cause the lowest salinities there. The evidence for this is that the Orinoco plume in Aug-Sep is separated from the main Amazon plume by a gap of higher salinities. However, the Orinoco plume is added to the remnant Amazon plume in the Caribbean and the seasonal pattern of Orinoco discharge is similar to the two-month lagged Amazon discharge, which makes it difficult to distinguish the relative contributions to the eastern Caribbean (Hellweger and Gordon, 2002). 2.2 Ocean color maps Hu et al. (2004) studied the correlation between colored dissolved organic matter (CDOM) and sea surface salinity comparing SeaWiFS CDOM maps with salinity profiler floats (S-PALACE). They showed monthly maps of ocean color, which can be interpreted to describe details of the freshwater plumes during five years (Fig. 4), and they indicated that most of the freshwater plume in the western tropical Atlantic originates from the discharge of the Amazon River. Moreover, they showed that the 9
10 freshwater plume in the Caribbean Sea originates from both the Amazon and the Orinoco rivers. In July-August, a mixture of the Amazon and Orinoco freshwater plumes extends northwestward across the eastern Caribbean. The CDOM distribution maps suggest that during summer and fall much of the Amazon River plume is entrained into the NBC and flows around the retroflection and into the North Equatorial Countercurrent (Muller-Karger et al., 1988). During this time, when a large part of the Amazon plume extends eastward as demonstrated by SSS maps (Fig. 2), NBC rings periodically pinch off from the NBC and carry entrained Amazon water northwestward toward the Caribbean (Fratantoni and Glickson, 2002). Therefore, rings contribute to a mean northwestward motion of the freshwater tongue east of the Lesser Antilles and contribute freshwater to the Caribbean between 14 and 18 N as they decay there (Fratantoni and Richardson, 2006). The ring contribution would be in addition to any freshwater from the Amazon dispersed into the North Equatorial Current and transported westward to the Caribbean. The CDOM and SSS maps also reveal that the Orinoco freshwater plume passes through the Grenada passage and northwestward in the Caribbean merging with the Amazon plume. Maps of CDOM distribution given by Hu et al. (2004; see also Muller-Karger et al., 1989) show very clearly the advection of the freshwater plume by NBC rings (Fig. 4). We compare here the maps of CDOM in May 1998 with the identification of NBC rings by Fratantoni and Glickson (2002). Their NBC ring D passed 55 W on May 4, 1998, 10
11 which corresponds to the patch of high CDOM concentration just east of the Lesser Antilles. Another ring passed 55 W in July 1998 according to Fratantoni and Glickson (2002) and is revealed by the CDOM patch southeast of the Lesser Antilles on the July map. With no other rings formed until after these two, the CDOM tongue dissipated east of the Lesser Antilles. This scheme is repeated for years 1999 and 2000 (Hu et al., 2004, their Figure 2). An inspection of the monthly maps shows blobs and filaments of higher and lower CDOM in the Caribbean. These are interpreted to have been caused by current filaments and eddies that advected the plume in complicated patterns. The smooth freshwater plume in Fig. 2 is an average of the filaments and blobs. This seasonality of freshwater plumes allowed us to determine heuristically two periods of time according to the salinity content of the surface water of the eastern Caribbean Sea as observed in the salinity and ocean color maps (Figs. 2 and 4). Lowest salinity in the eastern Caribbean is observed in August, September and October (Fig. 3). In winter there is little freshwater input from rivers so salinity remains high. In order to identify changes in the Caribbean Current dynamics we averaged quantities over two periods of time: the first one, of high salinity, is from January to July, and the second, of low salinity, from August to December. This choice will be confirmed a posteriori by the results of this study. Such seasonal grouping was done by Ffield (2005), who shows an increase of the historical surface temperature of 2.2 C in the Caribbean Sea along with the low salinity plume. 2.3 Surface Drifter data 11
12 Between 1996 and 2003, 212 satellite-tracked drifting buoys measured trajectories and over 73,000 6-hourly velocities in the Caribbean Sea (Richardson, 2005). The drifting buoy data were acquired from the Global Drifting Buoy Data Assembly Center at the NOAA Atlantic Oceanographic and Meteorological Laboratory in Miami, Florida. The majority of the drifters were similar to the WOCE-TOGA Lagrangian drifter described by Sybrandy and Niiler (1991). Drogues were attached below the surface float and centered at a depth of 15 m. The typical accuracy of a velocity measurement in 10 m/s wind is 0.01 m/s (Niiler et al., 1995). Following Richardson (2005) surface drifter velocity and eddy kinetic energy (EKE) were averaged in boxes by grouping all available 6-hourly drifter velocities into ½º by ½º bins for Jan-Jul and Aug-Dec. In each box, mean velocity was calculated as the sum of all u (v) velocity components in the x (y) direction divided by the number of observations. EKE was calculated by averaging the u and v velocity variances (variances about the mean velocities) in each box. The standard error of mean velocity 2st/N, where s is the variance of velocity about the mean velocity, N is the number of 6-hourly velocity observations divided by 4, and t is the integral time scale of the Lagrangian autocorrelation function, was estimated to be 2 days. The number of degrees of freedom, N/t, was calculated by summing the number of 2-day intervals spent by a drifter within a box. Further information about the data and calculation of velocities is given in Richardson (2005). Surface Drifter Velocity maps 12
13 The main Caribbean Current along the southern boundary of the Caribbean appears in both seasons as a band of red arrows indicating speeds greater than 25 cm/s (Fig. 5). Also in both seasons two bands of swift flow enter the southeastern Caribbean, a southern one south of 12 N and a northern one near 14 N. Between these two, inflow appears to be partially blocked by the line of islands extending northward from Grenada- Grenadines-St. Vincent, between 12.0 N and 13.3 N. During Aug-Dec the northern band near 14 N appears to be swifter than during Jan-Jul and flows westward across the eastern Caribbean, merging with the main boundary flow near 66 W. The northern inflow near 14 N is in the latitude range where NBC rings stall and decay, east of the islands, and thus rings contribute to this inflow. In both seasons part of the inflow near 14 N appears to be deflected northward (15-16 N) east of the Aves Ridge, which is located near 63.5 W. Caribbean jets The mean meridional structure of the Caribbean Current is revealed by averaging drifter velocities in half-degree latitude bins located in the eastern (61-64 W) and central (65-70W ) Caribbean (Fig. 6). In the eastern Caribbean, three jets are observed during both seasons. The swiftest is located farthest south near 11.3 N. It appears to be faster (81 ± 15 cm/s) during Jan-Jul (blue line) than during Aug-Dec (54 ± 8 cm/s) (red line), where the standard errors are given. It also shifts slightly north during Aug-Dec. A central jet 13
14 (21-35 cm/s) is located near 14 N, and a northern jet (10-15 cm/s) is located near 17 N with somewhat faster speeds during Aug-Dec (red line). Three similar jets have been observed in this region in an average of five meridional velocity sections along 63.5 W (Johns et al., 1999). In the central Caribbean (65-70 W) there are also 3 jets during Aug-Dec (red line) with the fastest (65 ± 14 cm/s) located in the south near 11.3 N. The central jet (13.8 N) is significantly faster (36 ± 5 cm/s) than the Jan-Jul (blue) velocities (24 ± 4 cm/s). During Jan-Jul there are only two jets as if the central (13.8 N) and southern (11.8 N) jets in the east (61-64 W) had merged into one near 12.5 N (46 ± 9 cm/s) in the central region. The main point is that the swift speeds in the central jet (13.8 N) during Aug-Dec coincide with the inflow of freshwater into the Caribbean, some of which comes from NBC rings that impinge on the islands near there and stall between 14 N and 18 N (section 2.2). This appears to cause a farther westward extension of the 14 N jet during Aug-Dec as the salinity front propagates westward. Intensification of the 14 N jet could be caused by the lower salinity and higher temperature carried by the freshwater plume. Both increase the speed of the density-driven flow by establishing a stronger density gradient at the southern part the freshwater plume where it lies adjacent to the Caribbean Sea water. Caribbean Anticyclones 14
15 Looping drifter trajectories in the Caribbean were used by Richardson (2005) to identify discrete eddies, to plot their trajectories, and to determine eddy characteristics. A looper was defined as a trajectory that contained two or more consecutive loops in the same direction. Box averages of drifter data in the central eastern Caribbean (65-75 W) revealed that of the 14,196 total number of observations, 25% were in loopers and 71% of these were anticyclonic, suggesting that anticyclones are the dominant eddies and make up 17.5% of the drifter data. If the percentage of anticyclonic looper data indicates the percentage of the area consisting of anticyclones and their typical overall diameter is 250 km, then there would be an average population of 2.2 anticyclones in the box. This agrees with two pairs of anticyclones tracked simultaneously with drifters. At their typical westward translation velocity of 13.4 cm/s, anticyclones translate through the box in around 3.0 months, which suggests a formation rate of around 8 anticyclones per year. Choosing a smaller diameter of 200 km results in around 12 anticyclones per year. The typical swirl velocities in the anticyclones are around 60 cm/sec, and their diameters are around 200 km, as indicated by looping drifters. The loopers and other complicated drifter trajectories give some insight into the current filaments and eddies that advect and stir the freshwater plumes in the Caribbean. The number of anticyclonic looper days per month in the W box varies seasonally, with high values reaching 115 days during October, and low values dropping to 34 days during March (Fig. 3). This suggests a seasonal variation in the number of Caribbean anticyclones that could be related to variations in the velocity of the Caribbean Current or variations in the structure of NBC rings, which collide with the Antilles (Richardson, 15
16 2005). However, Fig. 3 shows that the seasonal variation of anticyclonic looper days is negatively correlated (- 0.9) with the salinity in the eastern Caribbean, or positively correlated (0.9) with the amount of freshwater in the Caribbean. The implication is that more anticyclones are generated during the time of the freshest water, nearly twice as many during Aug-Dec (95 looper days per month) as during Jan-Jul (51 looper days per month). The modeling studies reported below suggest a dynamical connection between the freshwater plume and the anticyclones, which helps explain these results. 3 The Caribbean Current in numerical models In this section two numerical simulations are used to verify the links between the presence of the freshwater plumes, the intensification of the center jet of the Caribbean Current, and the presence of anticyclones in the northeastern Caribbean. First a North Atlantic global simulation is compared to previous observations. Then the mechanisms involved in the links are suggested. Finally the second simulation from a regional model sheds light on the role of the freshwater plume alone (without the effect of the NBC rings vorticity) on the dynamics of the northeastern Caribbean basin. 3.1 MICOM simulation This study uses the high-resolution North Atlantic MICOM simulation, with resolution of 1/12 (mesh size on the order of 6 km on average). The model domain is the North and Equatorial Atlantic (28 S to 70 N), including the Mediterranean Sea, with 20 layers in the vertical. The ocean boundaries at 28 S and 70 N were treated as closed but were 16
17 bordered by 3 buffer zones in which temperature and salinity are linearly relaxed toward their seasonally varying climatological values (Levitus, 1982). After a six-year spinup with monthly climatological forcing, the model was integrated using surface boundary conditions based on European Centre for Medium-Range Weather Forecasts (ECMWF) daily atmospheric data from 1979 to 1986 (Chassignet and Garraffo, 2001). The simulation reproduces the most important characteristics of flow in the Caribbean (Romanou et al., 2004). The total model transport into the Caribbean Sea through the Windward and Leeward Islands Passages is 25 Sv, well within the observational estimates of Sv. The mean Florida Straits transport in the model is 31.4 Sv; values peak in the summer months at the observed transport and with the correct seasonality, maximum in July and minimum in October (Richardson et al., 1969; Schott et al., 1988; Molinari, 2004; Hamilton et al., 2005). Model NBC rings provide 40% of the water for the Caribbean transport (Johns et al., 1998; Johns et al., 2002), and the simulated rings have three different structures as observed: some are surface intensified, some subsurface intensified with a surface signature and some subsurface intensified with no surface signature (Garraffo et al., 2003; Fratantoni and Richardson, 2006). The generation rate for simulated rings is 7-9 per year, of which 6 are surface-intensified, in good agreement with altimetry (Goñi and Johns, 2001). The model also displays strong mesoscale variability in inter-island passage transports with no clearly defined seasonality, in good agreement with observations. Furthermore, the model eddy kinetic energy (EKE) in the Caribbean during the six-year spinup period averaged 800 cm 2 s -2, ranging between 450 cm 2 s -2 and 1250 cm 2 s -2 (Garraffo et al., 2001); this agrees well with recent studies by Fratantoni (2001) and Richardson (2005), whose calculations using surface drifters 17
18 showed the Caribbean EKE to range from 500 cm 2 s -2 to 1500 cm 2 s -2. Therefore, we have some confidence that this basin-scale numerical simulation with high resolution reproduces the large scale variability as well as the mesoscale variability of the Caribbean Sea. Surface salinity in the MICOM simulation was relaxed to monthly surface salinity from Levitus climatology (Da Silva et al., 1994). Freshwater fluxes from the Amazon (0.19 Sv) and Orinoco (0.09 Sv) rivers were kept constant. Therefore, the MICOM simulation has the seasonal variation of the surface salinity driven by the Levitus climatology. However, the salinity variation range remains smaller than in the climatology itself. From the ECMWF MICOM simulation we computed the ½-degree latitude bin velocity averages in two meridional bands (66-70 W and W) for the two seasons, Jan-Jul and Aug-Dec (Fig. 7). The different meridional bands were chosen to recover the observed Caribbean current structure. In the MICOM simulation W zonal average the triple jet structure of the Caribbean Current is present (Fig 7b) in both seasons as in the observations. The southern jet at 12 N is faster than the central one at 15 N in both seasons. However, the swiftest velocities are obtained during the second season for both jets (45 cm/s for the southern jet and 26 cm/s for the center jet, which is faster by 6 cm/s then). From the drifter data, only the center jet is faster during the second season (Fig. 5b). In the western band (66-70 W, Fig. 7a), the northern jet centered at 17.5 N is faster (~15 cm/s) during the first season as in the drifter data. The center and southern jets merge into one jet centered at 14 N in both seasons. This is different from the 18
19 observations, which show such a merging only during Jan-Jul. An increase of the speed of O(standard deviation) of the center jet in Aug-Dec is obtained by calculating the velocity modulus instead of the zonal velocity as the center jet flows northwestward (Fig. 8b). Velocity vector map From the ECMWF MICOM simulation we also computed the average vector maps of the eastern Caribbean for the two seasons, Jan-Jul and Aug-Dec (Fig. 8). During the first season the swift velocities of the southern jet extend up to 14 N (Fig. 8a), whereas they are confined south of 13 N in the drifter data (Fig. 5a). A northwestward discontinuous flow starting at 14 N and 62 W is present in the drifter velocity vectors during Jan-Jul (red arrows). It forms an intense flow south of Puerto Rico, which is also present in the MICOM simulation (Fig. 8a). However, in the latter the flow at 14 N is directed more to the west and at 15 N and 65 W deviates to the north. It forms the northern jet depicted in the zonal average on Figure 5a and 7a. In the drifter data another secondary branch flowing northwestward separates from the weak center jet at 67 W and reinforces the northern jet to the west of the eastern basin. The northern jet flows from 64 W to 75 W in the drifter data and from 65 W to the end of the domain in the model data. This difference justifies the distinct averaging region used for the model and the observations, and as a result the same jet structure is seen in both the model and the observations. In the MICOM simulation the northern and southern jets are separated by a dipolar recirculation 19
20 cell not visible in the drifter data. The center jet in the MICOM simulation is better defined than in the drifter vectors. The vector map averaged over the second season (Aug-Dec) differs from the previous one through the northwestward orientation of the southern jet and the absence of an extended northern westward flowing swift jet south of Puerto Rico (Fig. 8b). In the drifter vectors, the northern westward jet is still present but is less intense. The center jet in the drifter data is also more intense and flows westward at 14 N all across the eastern Caribbean basin. Overall, the northwestward drift is emphasized in the MICOM simulation at 14 N, and the northern jet is weaker during the second season. This is due to the presence of anticyclones in the northeastern Caribbean, which sustain eastward currents just south of Hispañola and Puerto Rico. The anticyclone field We present in Figure 9 the rate per month of anticyclones in the MICOM simulation for both seasons. In the mid-caribbean, around 15 N and W, the number of anticyclones increases from 0.05 to 0.3 per month during Aug-Dec (Fig. 9a&b). In the eastern Caribbean, the eddy field is almost constant over the two seasons west (leeward side) of the Lesser Antilles. The westward paths of the anticyclones suggest the role of island wakes in the eddy formation. The number of anticyclones increases significantly south of Puerto Rico and Hispañola during Aug-Dec, which contributes to a slowing of the northern jet (17 N). More anticyclones are generated during the second season in the 20
21 model on the northern side of both the southern and center jets (Fig. 9b). This agrees well with the increase of the number of looper days in the drifter data (Fig. 3) during the second season, which double as in the MICOM simulation. In order to understand the influence of the freshwater on the dynamics of the Caribbean Current in the eastern Caribbean we averaged spatially the salinity and integrated spatially and vertically the kinetic energy of the mean flow (MKE), the eddy kinetic energy (EKE), and the available potential energy (APE) in the box W and N. MKE is obtained from the spatially weighted averaged flow field, EKE is made from the departure of the flow from the temporal average of the flow field, and APE is made from the departure of local layer thickness from the temporal local average of layer thickness. The respective time series are plotted in Figure 10 for the time of maximum EKE, July to December. The salinity varies in that region from a minimum of in September to in February-March (not shown) (Fig. 10). As the salinity decreases in July-September, the EKE and APE increase. This increase could be due to the intensification of the Caribbean Current at 14 N (Hernandez-Guerra and Joyce, 2000) as the horizontal shear increases as a result of the strengthening of the halocline front and the deepening of the upper layers as the freshwater plume replaces Caribbean waters. In September-October APE decreases while EKE remains high. This particular phase could correspond to the growth of baroclinic instability as APE is released. Strong anticyclones are then present in the northeastern Caribbean in November and December (Fig. 12). MKE increases at the end of September as the anticyclonic circulation, partly driven by the freshwater plume (subsection 3.2), increases the mean speed of the center jet and 21
22 yields a strong eastward jet just south of the islands (Fig. 11). Therefore, the presence of numerous anticyclones during Aug-Dec is likely to result from the instability fed by the freshwater plume s APE and EKE resulting from the southern halocline front. In the next subsection we isolate the effect of the salinity plume to understand its role in the circulation in the northeastern Caribbean without the influence of the vorticity shed by the NBC, which is seasonally accounted for in the MICOM simulation (Garraffo et al., 2003), in agreement with the observations (Fratantoni and Richardson, 2006). 3.2 Regional simulation of the Caribbean Current The northern branch (14ºN) of the Caribbean Current was studied using the Regional Ocean Modeling System (ROMS), which is discretized in coastline and terrain-following curvilinear coordinates (σ-coordinates model) and has appropriate boundary conditions for an irregular solid bottom and coastline, free upper surface, and open-ocean sides away from the coastline. The boundary conditions include the forcing influences of surface wind stress, heat and water fluxes, coastal river inflow, bottom drag, open-ocean outgoing wave radiation and nudging towards the specified basin-scale circulation from the climatology. For further information on the capability of the system see Shchepetkin & McWilliams (1998, 2003, 2004) and Marchesiello et al. (2001, 2003). The model domain is the northeastern Caribbean Sea and the southwestern Tropical Atlantic (14 N- 23 N, W), the horizontal resolution is 1/18 (~ 6 km), and the 22
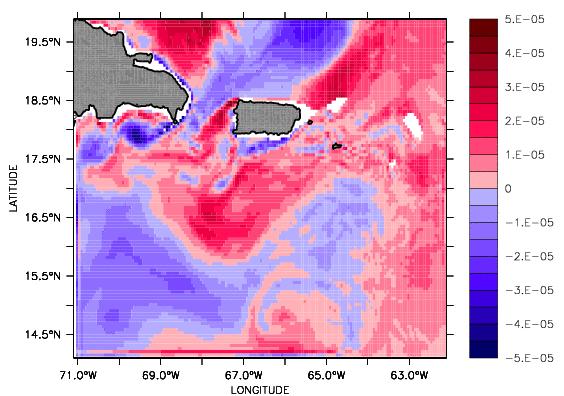
23 model has 25 layers in the vertical. The ocean boundaries were treated as open. Temperature and salinity were relaxed toward their monthly varying climatological values of the Levitus climatology (DaSilva et al., 1994). Surface fluxes were extracted from the Comprehensive Ocean Atmosphere Data Set (COADS) climatology. After a 6- month spinup, the model reached its energetic equilibrium. The model was integrated for another year, which was used in this analysis. As in the MICOM simulation the ROMS simulation exhibits the same periods of activities. In particular, as the salinity decreases during the summer, the Caribbean Current north of 14 is intensified, and the number of anticyclones increases during the fall. We present in Figure 11 a time series of zonally averaged flow in the surface layer and of the salinity between 62 and 71 W. As the salinity decreases, an anticyclonic circulation is established along with an increase of the westward speed of the center jet at 15 N (blue) of the Caribbean Current. The simulation shows very well the arrival of the freshwater plume in the northeastern Caribbean in Sep-Nov in agreement with both observations and the MICOM simulation. In order to understand the dynamical effect of the freshwater tongue, the potential vorticity anomaly (PVA) is calculated as the difference in PV between the other months (Aug, Sep, Oct, Nov,Dec) and July. The arrival of the pool of negative PVA into the basin in August (blue patch, Fig. 12b) is caused by the freshwater plume. The negative PVA then drives the anticyclonic circulation (Fig. 12a). In the southern part of the 23
24 domain, the negative PVA pool generates a PV front where the jet is intensified. Finally, as the salinity increases (Dec) the PVA is reduced. Hernandez-Guerra and Joyce (2000) found that the center jet at 14 N was at the southern edge of the freshwater plume and was enhanced geostrophically by the large salinity gradient there. Therefore, from the ROMS simulation, the low-salinity plume contributes to the intensification of the central jet of the Caribbean Current and generates an anticyclonic circulation through the negative PVA pool. The warmer temperature of the plume (Ffield, 2005), which decreases its density, must contribute to the strengthening of the central jet of the Caribbean Current. As seen in the drifter data, the central jet maximum speed is increased by 10 to 20 cm/s (Fig. 11) during the presence of the freshwater plume. The phase diagram of the meridional velocities at 17 N is shown in Fig. 13. Between 65 W and 68 W, two bands of northward velocities (yellow-red) move westward and surround a band of southward velocities (blue) in July, August, and Sept. This corresponds to the arrival of the plume front which is an anticylonic anomaly (Fig. 12b), yielding northward velocities on its leading edge. It is followed by a cyclone in September seen at 67 W (Fig. 12a). Meanders of positive PVA at the southern edge of the negative PVA (Fig 12b) suggest that the Caribbean jet at N becomes unstable as shown by the MICOM simulation energy budget (Fig. 10) in Sep-Oct. Cyclones are then formed on the southern side of the anticyclonic plume and are adevcted northwestward (Fig. 12a, Sep, Oct, Nov, Dec). The anticyclonic circulation extends farther west to 71 W in November (Fig. 12a). The interaction of the eastward jet with the shelves of the Greater Antilles generates cyclones by friction in November and December 24
25 (Fig. 12a; D Asaro, 1988). The cyclones interact with the anticyclonic circulation and break it into smaller anticyclones in November and December, between 67 W and 71 W (Fig.12a and b, Nov, Dec). Some of the cyclones on the eastern side of the anticyclonic circulation are advected eastward, between 62 W and 65 W during the same period (Fig. 13). This diagram shows a split in the cyclone advection at 67 W. West of 67 W, cyclones are advected westward; east of 67 W cyclones are advected eastward. Similar cyclones were observed by surface drifters to form as Caribbean anticyclones impinged on the northern Caribbean Islands (Richardson, 2005). In summary, Fig. 13 shows the increase of eddy activity starting at the end of September near 64 W and continuing until February in the west of the basin (not shown). The maximum of the eddy activity, which occurs in November, follows the arrival of the salinity minimum in October (Fig. 11). 4 Summary and conclusions The drifter velocities show that the eastern Caribbean Current (61-64 W) consists of three jets flowing westward at 11.5 N, 14 N and 16.8 N year around. The speeds of the three jets decrease with increasing latitude, the southern jet being the fastest. From August to December the same three jets are observed in the mid-caribbean (65-70 W), but during January-July the two southern jets (11.5 N, 14 N) in the east merge to become a single jet (12.5 N) in the mid-caribbean. The variability of speed and structure of the mid-caribbean Current jet is connected to the arrival of the freshwater flux from the Orinoco and Amazon rivers, which increases the speed of the mid-caribbean jet. The arrival of the freshwater coincides with an increase of the sea surface temperature (Ffield, 2005). The combination of relatively low salinity and warm temperatures contributes to a 25
26 sharpening of the density front south of the tongue, which intensifies the Caribbean current at 14 N as seen in the numerical simulations. Indeed, a few months after the peak seasonal rain in the Amazon and Orinoco river basins, a freshwater plume extends northwestward across the eastern Caribbean Sea, starting in July-August and continuing until October-November (Figs. 2 and 4; Muller-Karger et al., 1998; Hernandez-Guerra and Joyce, 2000; Hellweger and Gordon, 2002; Corredor et al, 2004). Two inflows of freshwater enter into the Caribbean Sea. The first is south of 12 N, where the Orinoco plume, some NBC water, and some NBC ring water enter the Caribbean through Grenada Passage and where the swiftest currents of the Caribbean Current are observed (Fig. 5). The second inflow of freshwater is between 14 and 18 N, partly provided by NBC rings, which stall and decay east of the Lesser Antilles, and partly by the North Equatorial Current, which advects water westward. The main contribution of Amazon water by rings is during the summer and fall when the most of the NBC retroflects into the countercurrent. During August-December, the season of maximum freshwater flux into the Caribbean Sea, the number of drifter anticyclonic looper days per month increases (Fig. 3), which suggests a dynamical link with the freshwater input. To understand this link we used the ECMWF daily wind-forced high resolution MICOM simulation, which simulates the triple-jet structure of the Caribbean Current, its variability seen in the drifter observations, and the contribution of NBC rings to the freshwater input between 14 and 18 N. North of 13 N, a salinity decrease in the MICOM simulation is associated with an increase of EKE and APE, which is later 26
27 released to EKE (Fig. 10). The center jet of the Caribbean Current intensifies as MKE increases and the number of anticyclones doubles over the Aug-Dec period as compared to Jan-July. The increase in EKE and APE suggests that the buoyant plume is a potential vorticity anomaly. The resulting PV gradients (horizontal and vertical) could results in both barotropic and baroclinic instabilities, which lead to the formation of cyclonic and anticyclonic eddies. It is commonly suggested that instability of the Caribbean current is driven by the potential vorticity fluxes of NBC rings through the island passages (e.g. Murphy et al., 1999; Carton and Chao, 1999; Johns et al., 2002; Centurioni and Niiler, 2003). In order to discriminate the role of the freshwater plume from the influence of the vorticity shed by NBC rings through the Lesser Antilles passages, we studied the circulation in the northeastern Caribbean influenced only by the freshwater using the ROMS model forced by the Levitus climatology. As the freshwater plume develops a salinity front at its southern edge, the anticyclonic flow is enhanced and sustained by the negative PVA of the freshwater plume: the center jet at 14 N is intensified (Fig ). It becomes unstable and generates cyclones on the southern side of the freshwater plume in Oct-Dec that are advected northward by the leading edge of the anticyclonic circulation. The latter could contribute to the northwestward drift of the freshwater plume. The friction of the anticyclonic flow on the shelves of the Greater Antilles and Virgin Islands generates both westward and eastward propagating cyclones with a separation line near 67 W (Fig. 13). The cyclones interact with the anticyclonic flow causing it to break into smaller anticyclones. Eddy activity is significantly increased after the arrival of the freshwater 27
28 plume. These results suggest that the freshwater plume in the eastern Caribbean, independent of the vorticity of NBC rings, is a main source of variability of the Caribbean Current, in addition to the wind and thermohaline-driven flows. As noted around Barbados Island by Cowen et al. (2003), the freshwater flux from NBC rings exerts a strong forcing on the reef ecosystem. In particular, Cowen et al. (2003) observed a strong biological response of the system as measured by recruitment of coral reef fishes. During the presence of rings, some events rapidly advected larval fish away from the island, resulting in a failure of larval settlement. Under other conditions larval retention was enhanced and was followed by a settlement pulse (see also Baums et al., 2006). Moreover, changes in the vertical distribution of fish larvae were observed simultaneous with the intrusion of freshwater. Larval fish encountering fresh NBC ring water grew more slowly and had longer larval periods, both potentially reducing survival and ultimately, recruitment success. Therefore, results by Cowen et al. (2003) demonstrate that the freshwater plume interferes with the island-scale flow dynamics and injects considerable variability in the local reef ecosystems. This study contributes to a better understanding of the seasonal variability of the Caribbean Current and its potential influence in the Caribbean Sea coastal ecosystems. 5 Acknowledgements 28
29 The study was supported by National Science Foundation grants OCE and OCE The authors thank Chris Wooding for processing the drifter data and creating some of the figures and Dr. M.P. Bacon for careful reading and editing of the manuscript. Terry Joyce discussed with one of us (PLR) the westward jet associated with the Orinoco River plume, which stimulated initial interest in this subject. The authors thank the anonymous reviewers for their careful reading and help in improving the manuscript. 6 References Baums, I.B., C. Paris, and L.M. Chérubin, A dynamical filter in larval dispersal in a reef building coral. Limnol. Oceanogr., 51(5), Bleck, R., and E.P. Chassignet, Simulating the oceanic circulation with isopycnic coordinates models, in The Oceans: Physiochemical Dyanmics and Resources, edited by S.K. Majumdar et al., pp , Penn. Acad. of Sci., Harrisburg. Bleck, R., C. Rooth, D. Hu, and L.T. Smith, Salinity-driven transients in a windand thermohaline-forced isopycnic coordinate model of the North Atlantic. J. Phys. Oceanogr., 22, Carton, J. A. and Y. Chao, Caribbean Sea eddies inferred from TOPEX/POSEIDON altimetry and 1/6 Atlantic Ocean model simulation. J. Geophys. Res., 104(C4),
30 Candela, J., R.C. Beardsley, and R. Limeburner, Separation of tidal and subtidal currents in ship mounted acoustic Doppler current profiler (ADCP) observations. J. Geophys. Res., 97(C1), Centurioni, L.R. and P.P. Niiler, On the surface currents of the Caribbean Sea. Geophys. Res, Lett., 30(6), 1279, doi: /2002gl Chassignet, E.P., and Z.D. Garraffoo, Viscosity parameterization and the Gulf Stream separation. From Stirring to Mixing in a Stratified Ocean: Proc. Aha Huliko a Hawaiin Winter Workshop, Honolulu, HI University of Hawaiian at Manoa, Corredor, J.E., Morell, J.M., Lopez, J.M., Capella, J.E., Armstrong, R.A., Cyclonic eddy entrains Orinoco River plume in eastern Caribbean. Eos, Transactions, American Geophysical Union, 85(20), pp 197, Cowen, R.K., and L.R. Castro, Relation of Coral reef fish larval distributions to island scale circulation around Barbados, West Indies. Bull. Mar. Sci., 54, Cowen R.K., S. Sponaugle, C.B. Paris, J.L. Fortuna, K.M.M. Lwiza, S. Dorsey, Impact of North Brazil Current rings on local circulation and coral reef fish recruitment to Barbados, West Indies. In: Interhemispheric water exchange, G.J. Goñi [ed.], Elsevier Oceanographic Series, Chap 17:
31 D'Asaro, E.A Generation of submesoscale vortices: a new mechanism. J. Geophys. Res. 93: Da Silva, A.M., C.C Young, S. Levitus, Atlas of surface marine data 1994, Vol. 1, algorithms and procedures, NOAA Atlas NESDIS 6, U. S. Department of Commerce, NOAA, NESDIS, USA, 74 pp. Dessier, A. and J.R. Donguy, The sea surface salinity in the Tropical Atlantic between 10 S and 30 N seasonal and interannual variations ( ). Deep-Sea Research I, 41, Fratantoni, D.M., North Atlantic surface circulation during the 1990s observed with satellite-tracked drifters. J. Geophys. Res., 106(C10), Fratantoni, D.M. and D.A. Glickson, North Brazil Current ring generation and evolution observed with Sea WiFS. J. Phys. Oceanogr., 32, Fratantoni, D.M., W.E. Johns, and T.L Townsend, Rings of the North Brazil Current: their strucuture and behavior inferred from observations and a numerical simulation. J. Geophys Res., 100(C6),
32 Frantantoni, D.M. and P.L. Richardson, The evolution and demise of North Brazil Current rings. J. Phys. Oceanogr., 36, pp Ffield, A., 2005, North Brazil current rings viewed by TRMM Microwave Imager SST and the influence of the Amazon Plume, Deep Sea Res. I, 52, Garraffo, Z.D., W.E. Johns, E.P. Chassignet, and G.J. Goñi, North Brazil Current rings and transport of southern waters in a high resolution numerical simulation of the North Atlantic. In: Goñi, G.J., Malanotte-Rizzoli, P. (Eds), Interhemispheric Water Exchange in the Atlantic Ocean. Elsevier Oceanographic Series 68, Elsevier, Amsterdam, Garraffo, Z.D., A.J. Mariano, A. Griffa, C. Veneziani and E.P. Chassignet, Lagrangian data in a high-resolution numerical simulation of the North Atlantic I, Comparison with in situ drifter data, J. Mar. Sys., 29, Garzoli, S.L., A. Ffield, and Q. Yao, North Brazil Current rings and the variability in the latitude of retroflection. In: Goñi, G.J., Malanotte-Rizzoli, P. (Eds), Interhemispheric Water Exchange in the Atlantic Ocean. Elsevier Oceanographic Series 68, Elsevier, Amsterdam,
33 Goñi, G.J., and W.E.Johns, A census of North Brazil Current rings observed from TOPEX/POSEIDON altimetry: Geophys. Res. Lett., 28(1), 1-4. Goñi, G.J., and W.E.Johns, Synoptic study of warm rings in the North Brazil Current retroflection region using satellite altimetry. In: Goñi, G.J., Malanotte-Rizzoli, P. (Eds), Interhemispheric Water Exchange in the Atlantic Ocean. Elsevier Oceanographic Series 68, Elsevier, Amsterdam, Hamilton P., Larsen J.C., Leaman, K.D., et al., Transports through the Straits of Florida. J. Phys. Oceanogr., 35 (3), Hellweger, F.L, and A. L. Gordon, Tracing Amazon River water into the Caribbean Sea. J. Mar. Res., 60(4), Hernandez-Guerra, A., and T.M. Joyce, Water masses and circulation in the surface layers of the Caribbean at 66 W. Geophys. Res. Lett., 27(21), Hu, C., E.T. Montgomery, R.W. Schmitt, and F.E. Muller-Karger, The dispersal of the Amazon and Orinoco River water in the tropical Atlantic and Caribbean Sea: observation from space and S-PALACE floats. Deep-Sea Res. II, 51,
34 Johns, E., W.D. Wilson, and R. Molinari, Direct observations of velocity and transport in the passages between the Intra-Americas Sea and the Atlantic Ocean, J. Geophys. Res., 104, C11, 25,805-25,820. Johns, W.E., T.N. Lee, R. Beardsley, J. Candela, and B. Castro, Annual cycle and variability of the North Brazil Current. J. Phys. Oceanogr., 28 (1), Johns, W.E., T.N. Lee, F.A. Schott, R.J. Zantopp, and R.H. Evans, The North Brazil Current retroflection: seasonal structure and eddy variability. J. Geophys. Res., 95(C12), Johns, W.E., T.L. Townsend, D.M. Fratantoni, and W.D. Wilson, On the Atlantic inflow into the Caribbean Sea. Deep-Sea Res. I, 49, Johns, W.E., R.J. Zantopp, and G.J. Goñi, 2003.Cross-gyre transport by North Brazil Current rings. In: Goñi, G.J., Malanotte-Rizzoli, P. (Eds), Interhemispheric Water Exchange in the Atlantic Ocean. Elsevier Oceanographic Series 68, Elsevier, Amsterdam, Kelly, P.S., K.M.M. Lwiza, and R.K. Cowen, Low-salinity pools at Barbados, West Indies: their origin, frequency, and variability. J. Geophys. Res., 105(C8), 19,699-19,
35 Levitus, S., Climatological Atlas of the World Ocean, NOAA/ERL GFDL Professional Paper 13, Princeton, N.J., 173 pp. (NTIS PB ). Marchesiello, P., J.C. McWilliams, A. Shchepetkin, Equilibrium structure and dynamics of the California Current System. J. Phys. Oceanogr., 33, Marchesiello, P., J.C. McWilliams, and A. Shchepetkin, Open boundary conditions for long-term integration of regional oceanic models. Ocean Modelling, 3, Mayer, D.A., and R.H. Weisberg, A description of COADS surface meteorological fields and the implied Sverdrup transports for the Altantic Ocean from 30 S to 60 N. J. Phys. Oceanogr., 23, Molinari, R.L., Annual and decadal variability in the western subtropical North Atlantic: signal characteristics and sampling methodologies. Prog. Oceanogr, 62 (1), Muller-Karger, F.E., C.R. McClain and P.L. Richardson The dispersal of the Amazon s water. Nature, 333, Muller-Karger, F.E., C.R McClain, T.R. Fisher, W.E. Esaias, R. Varela Pigment distribution in the Caribbean Sea: Observations from space. Prog. Oceanog. 23,
36 Murphy, S.J., H.E. Hurlburt, and J.J. O Brien The connectivity of eddy variability in the Caribbean Sea, the Gulf of Mexico, and the Atlantic Ocean. J. Geophys. Res., 98 (C5), Niiler, P.P., A. S. Sybrandy, K. Bi, P. M. Poulain, and D. Bitterman, 1995:Measurements of the water-following characteristics of Tristar and Holey-sock drifters. Deep-Sea Res., 42, Perry, G.D., P.B. Duffy, N.L. Miller An extended data set of river discharges for validation of general circulation models. J. Geophys. Res., 101, Richardson, P.L., Caribbean Current and eddies as observed by surface drifters. Deep-Sea Res. II, 52, Richardson, W.S., W.J. Schmitz, Jr., and P.P. Niiler, The velocity structure of the Florida Current from the Straits of Florida to Cape Fear. Deep-Sea Research, 16(Suppl), Romanou, A., E.P. Chassignet, and W. Sturges, The gulf of Mexico circulation within a high-resolution numerical simulation of the North Atlantic Ocean. J. Geophys. Res., 109, C01003, doi: /2003jc
37 Schmitz, W.J. and M.S. McCartney, On the North Atlantic circulation. Rev. Geophys., 31(1), Schmitz, W.J. and P.L. Richardson, On the sources of the Florida Current. Deep- Sea Res., 38(suppl. 1), Schott, F.A., T.N. Lee, and R. Zantopp, Variability of structure and transport of the Florida Current in the period range of days to seasonal. J. Phys. Oceanogr., 18, Shchepetkin, A.F., J.C. McWilliams, Quasi-monotone advection schemes based on explicit locally adaptive dissipation. Monthly Weather Review, 126, Shchepetkin, A.F., J.C. McWilliams, A method for computing horizontal pressuregradient force in an ocean model with a non-aligned vertical coordinate. J. Geophys. Res., 108, C3, 3090, doi: /2001jc Shchepetkin, A., and J.C. McWilliams, 2005: The Regional Oceanic Modeling System: A split-explicit, free-surface, topography-following-coordinate ocean model. Ocean Modelling, 9, Simmons, H.L., and D. Nof, The Squeezing of Eddies through Gaps. J. Phys. Oceanogr., 32(1), pp
38 Sybrandy, A.L. and P.P. Niiler, WOCE/TOGA Lagrangian drifter construction manual. SIO ref. 91/6, WOCE Rep. 63. Scripps Institution of Oceanography, La Jolla, CA, (58pp). 38
39 List of Figures Figure 1: Map of the Caribbean Sea and of the close tropical Atlantic showing the Amazon and Orinoco rivers along with the various groups of islands cited in the text. Figure 2: Monthly climatology surface salinity maps of the western tropical Atlantic and eastern Caribbean (Dessier, personal communication, 1991). Red, blue, and green contours show respectively the 35.0, 34.0, and 33.0 isohalines. Black open squares on the January map show the locations where the Amazon and Orinoco rivers flow into the ocean. The maximum discharge of the Amazon River (0.23 Sv) occurs, on average, in June; maximum Orinoco River discharge (0.07 Sv) is in August (Muller-Karger et al., 1989; Hellweger and Gordon, 2002). Figure 3: Seasonal variations of salinity in the eastern Caribbean. Salinity values were obtained from the salinity maps (Fig. 2) in the eastern mid-caribbean at 15 N-65 W. Maximum salinity ~ occurs in March and minimum ~ in September-October, a salinity range of 1.6. Salinity values in the southeastern corner of the Caribbean near Grenada Island, where the Orinoco plume enters, have a larger seasonal variation than this (~ 2.8). Also shown are seasonal variations of the number of monthly anticyclonic drifter looper days (65-75 W), which are interpreted to indicate the population of anticyclones as discussed later (from Richardson, 2005). The looper days were smoothed with a running three-month average. 39
40 Figure 4: Monthly composite maps of CDOM distribution estimated from Sea WiFS version 4 data for 1998 reproduced from Hu et al (2004) who showed five years ( ). Overlaid on the images as red crosses are concurrent S-PALACE float locations. Red and yellow show the high CDOM concentration advected along the Brazilian and Venezuelian shelves. The retroflection of the NBC and the formation and northwestward translation of NBC rings can be observed from May to December. In the eastern Caribbean the CDOM plume spreads northwestward between July and November corresponding to the low salinity in Figure 2. Figure 5: Mean surface velocity vectors calculated by grouping 6-hourly drifter velocity values into 1/2 by 1/2 bins (as in Richardson, 2005). Vectors are shown for two time periods, Jan-Jul (a) and Aug-Dec (b). Red arrows indicate speeds greater than 25 cm/s. Vectors are shown in bins that contained two or more degrees of freedom, based on a two-day integral time scale of the lagrangian autocorrelation function which was estimated from the drifter velocity series. Typical standard errors of the mean eastward velocity components are around 16 cm/s. Depth contours are 200 m (dashed) and 2000 m (dotted). Figure 6: Profiles of mean eastward velocity and standard error calculated by grouping surface drifter velocities in ½-degree latitude bins by season. (a) W zonal average velocity in the mid-caribbean. (b) W zonal average in the eastern Caribbean. Blue profiles are for Jan-Jul, and red profiles Aug-Dec. 40
41 Figure 7: Profiles of mean eastward surface velocities (solid line) by averaging velocities in ½-degree latitude bins by season from the MICOM simulation. (a) W zonal average velocity in the mid-caribbean. (b) W zonal average in the eastern Caribbean. Blue profiles are for Jan-Jul, and red profiles for Aug-Dec. Dashed lines show the standard deviation for each profile. Figure 8. Seasonal average of the surface velocity field of the MICOM simulation (cm/s). Vectors are plotted every third grid point. Grey areas show the topography mask of the model. (a) Jan-Jul. (b) Aug-Dec. Figure 9: map of the number of anticyclonic eddies per month in the MICOM simulation. Eddies are counted as they pass each grid point (a) Jan-Jul; (b) Aug-Dec. Figure 10: Time series in J/m 2, from the MICOM simulation, of the spatially and vertically integrated kinetic energy of the mean flow (solid line), of the eddy kinetic energy (dashed-dotted line) calculated as the departure of the temporal average of the flow, of available potential energy (dashed line) calculated as the departure from the temporal average of layer thickness and of the salinity (short dashed line) spatially averaged in the box 61-70ºW, 13-18ºN. Figure 11: Time-series from the ROMS simulation of the salinity (solid line) and the zonally averaged zonal velocity (m/s) in the surface layer between 62º-71ºW from July 41
42 of the first model year to January of the second model year. Dashed contours show the zero velocity. Blue color represents faster westward velocity and orange eastward. The combination of orange in the north and blue in the south (Oct-Dec) represents anticyclonic circulation. Figure 12: ROMS simulation snapshots of (a) current (m.s -1 ) vectors and salinity (blue indicates freshest water) and (b) potential vorticity anomaly (PVA) in m -1.s -1. From top to bottom in August, September, October, November, and December. The PVA is calculated as the PV difference between July and the other months. Figure 13: Phase diagram of meridional velocities at 17 N (m.s -1 ) from the ROMS simulation. Dashed contours show zero velocity. Yellow-red indicates northward velocities and blue-green southward velocities. 42

43 Figure 1 43


44 Jan Feb Mar Apr May Jun Jul Aug 44


45 Sep Oct Nov Dec Figure 2 45
46 Looper Days per Month Looper Salinity J F M A M J J A S O N D J Month Salinity Figure 3 46

47 Figure 4 47


48 (a) Jan-Jul (b) Aug-Dec Figure 5 48
49 (a) Figure 6 (b) 49
50 (a) 66-70ºW Figure 7 (b) 61-65ºW 50

")
51 (a) Jan-Jul Figure 8 (b) Aug-Dec 51
")
52 (a) Jan - Jul Figure 9 (b) Aug-Dec 52
53 Figure 10 53

54 Figure 11 54
 Aug")
 Sep")

55 (a) Aug (b) Aug (a) Sep (b) Sep Figure 12 55
 Nov Figure 12")
56 (a) Oct (b) Oct (a) Nov (b) Nov Figure 12 continued 56

57 (a) Dec (b) Dec Figure 12a continued 57

58 Figure 13 58
The Planetary Circulation System
 12 The Planetary Circulation System Learning Goals After studying this chapter, students should be able to: 1. describe and account for the global patterns of pressure, wind patterns and ocean currents
General Comment on Lab Reports: v. good + corresponds to a lab report that: has structure (Intro., Method, Results, Discussion, an Abstract would be
 General Comment on Lab Reports: v. good + corresponds to a lab report that: has structure (Intro., Method, Results, Discussion, an Abstract would be a bonus) is well written (take your time to edit) shows
Coastal Ocean Circulation Experiment off Senegal (COCES)
") DISTRIBUTION STATEMENT A. Approved for public release; distribution is unlimited. Coastal Ocean Circulation Experiment off Senegal (COCES) Pierre-Marie Poulain Istituto Nazionale di Oceanografia e di Geofisica
DISTRIBUTION STATEMENT A. Approved for public release; distribution is unlimited. Coastal Ocean Circulation Experiment off Senegal (COCES) Pierre-Marie Poulain Istituto Nazionale di Oceanografia e di Geofisica
Upper Ocean Circulation
 Upper Ocean Circulation C. Chen General Physical Oceanography MAR 555 School for Marine Sciences and Technology Umass-Dartmouth 1 MAR555 Lecture 4: The Upper Oceanic Circulation The Oceanic Circulation
Float trajectories in the deep western boundary current and deep equatorial jets of the tropical Atlantic
 Deep-Sea Research II 46 (1999) 305 333 Float trajectories in the deep western boundary current and deep equatorial jets of the tropical Atlantic Philip L. Richardson*, David M. Fratantoni Department of
Enhancing predictability of the Loop Current variability using Gulf of Mexico Hycom
 Enhancing predictability of the Loop Current variability using Gulf of Mexico Hycom Matthieu Le Hénaff (1) Villy Kourafalou (1) Ashwanth Srinivasan (1) Collaborators: O. M. Smedstad (2), P. Hogan (2),
Atmospheric driving forces for the Agulhas Current in the subtropics
 Click Here for Full Article GEOPHYSICAL RESEARCH LETTERS, VOL. 34, L15605, doi:10.1029/2007gl030200, 2007 Atmospheric driving forces for the Agulhas Current in the subtropics A. Fetter, 1 J. R. E. Lutjeharms,
Eddy-resolving Simulation of the World Ocean Circulation by using MOM3-based OGCM Code (OFES) Optimized for the Earth Simulator
 Optimized for the Earth Simulator") Chapter 1 Atmospheric and Oceanic Simulation Eddy-resolving Simulation of the World Ocean Circulation by using MOM3-based OGCM Code (OFES) Optimized for the Earth Simulator Group Representative Hideharu
Chapter 1 Atmospheric and Oceanic Simulation Eddy-resolving Simulation of the World Ocean Circulation by using MOM3-based OGCM Code (OFES) Optimized for the Earth Simulator Group Representative Hideharu
Ocean Mixing and Climate Change
 Ocean Mixing and Climate Change Factors inducing seawater mixing Different densities Wind stirring Internal waves breaking Tidal Bottom topography Biogenic Mixing (??) In general, any motion favoring turbulent
Physical factors driving the oceanographic regime around the Florida Keys. Villy Kourafalou. University of Miami/RSMAS
 Physical factors driving the oceanographic regime around the Florida Keys Villy Kourafalou University of Miami/RSMAS Oceanographic connectivity around the Florida Keys LC FC http://oceancurrents.rsmas.miami.edu/atlantic/loop-current_2.html
Lecture 1. Amplitude of the seasonal cycle in temperature
 Lecture 6 Lecture 1 Ocean circulation Forcing and large-scale features Amplitude of the seasonal cycle in temperature 1 Atmosphere and ocean heat transport Trenberth and Caron (2001) False-colour satellite
Interannual Variability of the Gulf of Mexico Loop Current
 Interannual Variability of the Gulf of Mexico Loop Current Dmitry Dukhovskoy (COAPS FSU) Eric Chassignet (COAPS FSU) Robert Leben (UC) Acknowledgements: O. M. Smedstad (Planning System Inc.) J. Metzger
A new global surface current climatology, with application to the Hawaiian Island region. Rick Lumpkin
 A new global surface current climatology, with application to the Hawaiian Island region Rick Lumpkin (Rick.Lumpkin@noaa.gov) Drogue presence reanalysis Left: time-mean zonal currents from drifters and
Non-linear patterns of eddy kinetic energy in the Japan/East Sea
 Non-linear patterns of eddy kinetic energy in the Japan/East Sea O.O. Trusenkova, D.D. Kaplunenko, S.Yu. Ladychenko, V.B. Lobanov V.I.Il ichev Pacific Oceanological Institute, FEB RAS Vladivostok, Russia
Deep flow variability in the vicinity of the Yucatan Straits from a high-resolution numerical simulation
 JOURNAL OF GEOPHYSICAL RESEARCH, VOL. 110,, doi:10.1029/2004jc002280, 2005 Deep flow variability in the vicinity of the Yucatan Straits from a high-resolution numerical simulation Laurent M. Chérubin Rosenstiel
SEAWIFS VALIDATION AT THE CARIBBEAN TIME SERIES STATION (CATS)
") SEAWIFS VALIDATION AT THE CARIBBEAN TIME SERIES STATION (CATS) Jesús Lee-Borges* and Roy Armstrong Department of Marine Science, University of Puerto Rico at Mayagüez, Mayagüez, Puerto Rico 00708 Fernando
SEAWIFS VALIDATION AT THE CARIBBEAN TIME SERIES STATION (CATS) Jesús Lee-Borges* and Roy Armstrong Department of Marine Science, University of Puerto Rico at Mayagüez, Mayagüez, Puerto Rico 00708 Fernando
Pacific HYCOM. E. Joseph Metzger, Harley E. Hurlburt, Alan J. Wallcraft, Luis Zamudio and Patrick J. Hogan
 Pacific HYCOM E. Joseph Metzger, Harley E. Hurlburt, Alan J. Wallcraft, Luis Zamudio and Patrick J. Hogan Naval Research Laboratory, Stennis Space Center, MS Center for Ocean-Atmospheric Prediction Studies,
SoFLA-HYCOM (South Florida HYCOM) Regional Model around Florida Straits, Florida Bay and the Florida Keys: An overview FLORIDA.
 Regional Model around Florida Straits, Florida Bay and the Florida Keys: An overview FLORIDA.") SoFLA-HYCOM (South Florida HYCOM) Regional Model around Florida Straits, Florida Bay and the Florida Keys: An overview SW Florida shelf FLORIDA Florida Current B A H A M A S 25N CUBA 83W 79W Villy KOURAFALOU
SoFLA-HYCOM (South Florida HYCOM) Regional Model around Florida Straits, Florida Bay and the Florida Keys: An overview SW Florida shelf FLORIDA Florida Current B A H A M A S 25N CUBA 83W 79W Villy KOURAFALOU
Table S1. Locations and dates of reported sightings of massive pelagic Sargassum strandings in the tropical North Atlantic in 2011.
 Supplemental Content for Franks et al. 2016. Franks, J.S., D.R. Johnson, and D.S. Ko. 2016. Pelagic Sargassum in the tropical North Atlantic. Gulf and Caribbean Research 27:S6-S12. DOI: 10.18785/gcr.2701.08
An Atlas of Oceanic Internal Solitary Waves (February 2004) by Global Ocean Associates Prepared for Office of Naval Research Code 322 PO
 by Global Ocean Associates Prepared for Office of Naval Research Code 322 PO") Overview is located in the western Equatorial Pacific Ocean. The Island is immediately north of Queensland Australia and adjacent to the Bismark Archipelago. (Figure 1). The region is influenced by the
Overview is located in the western Equatorial Pacific Ocean. The Island is immediately north of Queensland Australia and adjacent to the Bismark Archipelago. (Figure 1). The region is influenced by the
Impact of North Brazil Current rings on local circulation and coral reef fish recruitment to Barbados, West Indies
 Impact of North Brazil Current rings on local circulation and coral reef fish recruitment to Barbados, West Indies R.K. Cowen a, S. Sponaugle a, C.B. Paris a, J.L. Fortuna a, K.M.M. Lwiza b, and S. Dorsey
2013 ATLANTIC HURRICANE SEASON OUTLOOK. June RMS Cat Response
 2013 ATLANTIC HURRICANE SEASON OUTLOOK June 2013 - RMS Cat Response Season Outlook At the start of the 2013 Atlantic hurricane season, which officially runs from June 1 to November 30, seasonal forecasts
On the Atlantic inflow to the Caribbean Sea
 Deep-Sea Research I 49 (2002) 211 243 On the Atlantic inflow to the Caribbean Sea William E. Johns a, *, Tamara L. Townsend b, David M. Fratantoni c, W. Douglas Wilson d a Rosenstiel School of Marine and
3. Midlatitude Storm Tracks and the North Atlantic Oscillation
 3. Midlatitude Storm Tracks and the North Atlantic Oscillation Copyright 2006 Emily Shuckburgh, University of Cambridge. Not to be quoted or reproduced without permission. EFS 3/1 Review of key results
Western Boundary Currents. Global Distribution of Western Boundary Currents and their importance
 Western Boundary Currents In previous chapters you have learned about the processes that cause the intensification of currents along the western boundaries of the oceans. In this chapter we will examine
Characteristics of Sea Surface Circulation and Eddy Field in the South China Sea Revealed by Satellite Altimetric Data
 Journal of Oceanography, Vol. 56, pp. 331 to 344, 2000 Characteristics of Sea Surface Circulation and Eddy Field in the South China Sea Revealed by Satellite Altimetric Data AKIHIKO MORIMOTO 1 *, KOICHI
Seasonal and Interannual Variations in the Velocity Field of the South China Sea
 Journal of Oceanography, Vol. 54, pp. 361 to 372. 1998 Seasonal and Interannual Variations in the Velocity Field of the South China Sea CHAU-RON WU 1, PING-TUNG SHAW 1 and SHENN-YU CHAO 2 1 Department
Impact of frontal eddy dynamics on the Loop Current variability during free and data assimilative HYCOM simulations
 Impact of frontal eddy dynamics on the Loop Current variability during free and data assimilative HYCOM simulations Matthieu Le Hénaff (1) Villy H. Kourafalou (1) Ashwanth Srinivasan (1) George R. Halliwell
Evidence of a Barrier Layer in the Sulu and Celebes Seas
 3299 Evidence of a Barrier Layer in the Sulu and Celebes Seas PETER C. CHU Naval Ocean Analysis and Prediction Laboratory, Department of Oceanography, Naval Postgraduate School, Monterey, California QINYU
APPENDIX B PHYSICAL BASELINE STUDY: NORTHEAST BAFFIN BAY 1
 APPENDIX B PHYSICAL BASELINE STUDY: NORTHEAST BAFFIN BAY 1 1 By David B. Fissel, Mar Martínez de Saavedra Álvarez, and Randy C. Kerr, ASL Environmental Sciences Inc. (Feb. 2012) West Greenland Seismic
North Atlantic circulation in three simulations of 1/12, 1/25, and 1/50
 North Atlantic circulation in three simulations of 1/12, 1/2, and 1/ Xiaobiao Xu and Eric Chassignet Center for ocean-atmospheric prediction studies Florida State University Motivation Numerical models
CPTEC and NCEP Model Forecast Drift and South America during the Southern Hemisphere Summer
 CPTEC and NCEP Model Forecast Drift and South America during the Southern Hemisphere Summer José Antonio Aravéquia 1 Pedro L. Silva Dias 2 (1) Center for Weather Forecasting and Climate Research National
Cold air outbreak over the Kuroshio Extension Region
 Cold air outbreak over the Kuroshio Extension Region Jensen, T. G. 1, T. Campbell 1, T. A. Smith 1, R. J. Small 2 and R. Allard 1 1 Naval Research Laboratory, 2 Jacobs Engineering NRL, Code 7320, Stennis
THE BC SHELF ROMS MODEL
 THE BC SHELF ROMS MODEL Diane Masson & Isaac Fine, Institute of Ocean Sciences The Canadian west coast perspective (filling the gap ) AVISO, Eddy Kinetic Energy (cm 2 s -2 ) In this talk Model set-up and
Eddy Shedding from the Kuroshio Bend at Luzon Strait
 Journal of Oceanography, Vol. 60, pp. 1063 to 1069, 2004 Short Contribution Eddy Shedding from the Kuroshio Bend at Luzon Strait YINGLAI JIA* and QINYU LIU Physical Oceanography Laboratory and Ocean-Atmosphere
SIO 210 Introduction to Physical Oceanography Mid-term examination November 5, 2012; 50 minutes Answer key
 SIO 210 Introduction to Physical Oceanography Mid-term examination November 5, 2012; 50 minutes Answer key Closed book; one sheet of your own notes is allowed. A calculator is allowed. (100 total points.)
Influence of Topography on the Propagation of Isolated Eddies
 848 JOURNAL OF PHYSICAL OCEANOGRAPHY VOLUME 3 Influence of Topography on the Propagation of Isolated Eddies JOSSY P. JACOB AND ERIC P. CHASSIGNET Division of Meteorology and Physical Oceanography, Rosenstiel
Observed and modeled meridional overturning circulation related flow into the Caribbean
 Click Here for Full Article JOURNAL OF GEOPHYSICAL RESEARCH, VOL. 113,, doi:10.1029/2007jc004320, 2008 Observed and modeled meridional overturning circulation related flow into the Caribbean Kerstin Kirchner,
Pathways in the ocean
 Pathways Pathways in the in the ocean by Sybren Drijfhout Introduction The properties of water masses in the ocean are set by air-sea interactions at the surface and convective overturning. As direct transfer
On the world-wide circulation of the deep water from the North Atlantic Ocean
 Journal of Marine Research, 63, 187 201, 2005 On the world-wide circulation of the deep water from the North Atlantic Ocean by Joseph L. Reid 1 ABSTRACT Above the deeper waters of the North Atlantic that
Circulation in the South China Sea in summer of 1998
 Circulation in the South China Sea in summer of 1998 LIU Yonggang, YUAN Yaochu, SU Jilan & JIANG Jingzhong Second Institute of Oceanography, State Oceanic Administration (SOA), Hangzhou 310012, China;
Coastal Ocean Circulation Experiment off Senegal (COCES)
") DISTRIBUTION STATEMENT A: Approved for public release; distribution is unlimited. Coastal Ocean Circulation Experiment off Senegal (COCES) Pierre-Marie Poulain Istituto Nazionale di Oceanografia e di Geofisica
DISTRIBUTION STATEMENT A: Approved for public release; distribution is unlimited. Coastal Ocean Circulation Experiment off Senegal (COCES) Pierre-Marie Poulain Istituto Nazionale di Oceanografia e di Geofisica
ENSO Outlook by JMA. Hiroyuki Sugimoto. El Niño Monitoring and Prediction Group Climate Prediction Division Japan Meteorological Agency
 ENSO Outlook by JMA Hiroyuki Sugimoto El Niño Monitoring and Prediction Group Climate Prediction Division Outline 1. ENSO impacts on the climate 2. Current Conditions 3. Prediction by JMA/MRI-CGCM 4. Summary
Modeling of deep currents in the Japan/East Sea
 Modeling of deep currents in the Japan/East Sea Olga Trusenkova V.I.Il ichev Pacific Oceanological Institute, FEB RAS Vladivostok, Russia PICES 2014 Annual Meeting, 16-26 October 2014, Korea, Yeosu Deep
LAGRANGIAN MEASUREMENTS OF EDDY CHARACTERISTICS IN THE CALIFORNIA CURRENT
 LAGRANGIAN MEASUREMENTS OF EDDY CHARACTERISTICS IN THE CALIFORNIA CURRENT Robert C. Beardsley, Kenneth H. Brink, Richard Limeburner Clark Laboratory, Mail Stop 21 Woods Hole Oceanographic Institution Woods
Multi-decadal simulation of Atlantic Ocean climate variability driven by realistic high-frequency atmospheric reanalysis
 Multi-decadal simulation of Atlantic Ocean climate variability driven by realistic high-frequency atmospheric reanalysis Z. Garraffo, G.Halliwell, L. Smith, G. Peng, E. Chassignet Discussions with B. Molinari,
Ocean Surface Current Climatology in the Northern Gulf of Mexico
 Ocean Surface Current Climatology in the Northern Gulf of Mexico by Donald R. Johnson Center for Fisheries Research and Development Gulf Coast Research Laboratory University of Southern Mississippi Project
Gulf and Caribbean Research
 Gulf and Caribbean Research Volume 14 Issue 2 January 2003 The Role of Long Distance Dispersal Versus Local Retention in Replenishing Marine Populations Robert K. Cowen University of Miami Claire B. Paris
California 120 Day Precipitation Outlook Issued Tom Dunklee Global Climate Center
 California 120 Day Precipitation Outlook Issued 11-01-2008 Tom Dunklee Global Climate Center This is my second updated outlook for precipitation patterns and amounts for the next 4 s of the current rainy
Early Student Support for a Process Study of Oceanic Responses to Typhoons
 DISTRIBUTION STATEMENT A. Approved for public release; distribution is unlimited. Early Student Support for a Process Study of Oceanic Responses to Typhoons Ren-Chieh Lien Applied Physics Laboratory University
Eddy-induced meridional heat transport in the ocean
 GEOPHYSICAL RESEARCH LETTERS, VOL. 35, L20601, doi:10.1029/2008gl035490, 2008 Eddy-induced meridional heat transport in the ocean Denis L. Volkov, 1 Tong Lee, 1 and Lee-Lueng Fu 1 Received 28 July 2008;
Why the Atlantic was surprisingly quiet in 2013
 1 Why the Atlantic was surprisingly quiet in 2013 by William Gray and Phil Klotzbach Preliminary Draft - March 2014 (Final draft by early June) ABSTRACT This paper discusses the causes of the unusual dearth
Red Sea - Dead Sea Water Conveyance Study Program Additional Studies
 Red Sea - Dead Sea Water Conveyance Study Program Additional Studies Red Sea Study Final Report Annex 1 Field and laboratory activities carried out during the study and their results July 213 TABLE OF
Climate/Ocean dynamics
 Interannual variations of the East-Kamchatka and East-Sakhalin Currents volume transports and their impact on the temperature and chemical parameters in the Okhotsk Sea Andrey G. Andreev V.I. Il ichev
Depth Distribution of the Subtropical Gyre in the North Pacific
 Journal of Oceanography, Vol. 58, pp. 525 to 529, 2002 Short Contribution Depth Distribution of the Subtropical Gyre in the North Pacific TANGDONG QU* International Pacific Research Center, SOEST, University
Submesoscale Routes to Lateral Mixing in the Ocean
 DISTRIBUTION STATEMENT A. Approved for public release; distribution is unlimited. Submesoscale Routes to Lateral Mixing in the Ocean Amit Tandon Physics Department, UMass Dartmouth 285 Old Westport Rd
Arne Biastoch Helmholtz Centre for Ocean Research Kiel. Modelling the Agulhas Current and its Coupling with the Atlantic Circulation
 Arne Biastoch Helmholtz Centre for Ocean Research Kiel Modelling the Agulhas Current and its Coupling with the Atlantic Circulation The Agulhas System as a Key Region of the Global Oceanic Circulation
Life Cycle of Convective Systems over Western Colombia
 Life Cycle of Convective Systems over Western Colombia Meiry Sakamoto Uiversidade de São Paulo, São Paulo, Brazil Colombia Life Cycle of Convective Systems over Western Colombia Convective System (CS)
Salinity Processes in the Upper. Ocean Regional Study (SPURS) Ray Schmitt, WHOI
 Ray Schmitt, WHOI") Salinity Processes in the Upper Outgrowth of: Ocean Regional Study (SPURS) Ray Schmitt, WHOI CLIVAR Salinity Working Group (May 06 meeting and 07 report) Salinity issue of Oceanography (Mar. 08) NASA Workshop
Salinity Processes in the Upper Outgrowth of: Ocean Regional Study (SPURS) Ray Schmitt, WHOI CLIVAR Salinity Working Group (May 06 meeting and 07 report) Salinity issue of Oceanography (Mar. 08) NASA Workshop
PRMS WHITE PAPER 2014 NORTH ATLANTIC HURRICANE SEASON OUTLOOK. June RMS Event Response
 PRMS WHITE PAPER 2014 NORTH ATLANTIC HURRICANE SEASON OUTLOOK June 2014 - RMS Event Response 2014 SEASON OUTLOOK The 2013 North Atlantic hurricane season saw the fewest hurricanes in the Atlantic Basin
Optimal Spectral Decomposition (OSD) for Ocean Data Analysis
 for Ocean Data Analysis") Optimal Spectral Decomposition (OSD) for Ocean Data Analysis Peter C Chu (1) and Charles Sun (2) (1) Naval Postgraduate School, Monterey, CA 93943 pcchu@nps.edu, http://faculty.nps.edu/pcchu/ (2) NOAA/NODC,
Optimal Spectral Decomposition (OSD) for Ocean Data Analysis Peter C Chu (1) and Charles Sun (2) (1) Naval Postgraduate School, Monterey, CA 93943 pcchu@nps.edu, http://faculty.nps.edu/pcchu/ (2) NOAA/NODC,
The feature of atmospheric circulation in the extremely warm winter 2006/2007
 The feature of atmospheric circulation in the extremely warm winter 2006/2007 Hiroshi Hasegawa 1, Yayoi Harada 1, Hiroshi Nakamigawa 1, Atsushi Goto 1 1 Climate Prediction Division, Japan Meteorological
Monitoring and modeling the Eastern Mediterranean circulation and its climatic variability
 UNIVESRITY OF ATHENS, OCEAN PHYSICS AND MODELING GROUP Monitoring and modeling the Eastern Mediterranean circulation and its climatic variability S. Sofianos and OPAM group EastMed Symposium, November
CHAPTER IV THE RELATIONSHIP BETWEEN OCEANOGRAPHY AND METEOROLOGY
 CHAPTER IV THE RELATIONSHIP BETWEEN OCEANOGRAPHY AND METEOROLOGY THE relationship between oceanography and meteorology is of an order different from that between it and geology or biology, because meteorologic
Cruise Report R.V. Oceania, AREX2004
 Powstaców Warszawy, PL - 81-71 Sopot, P.O. Box 68 November 16. 4 Cruise Report R.V. Oceania, AREX4 Ship: Cruise: R.V. Oceania Arex4 Dates: 8.6.4 19.7.4 Port Calls: Sopot (Poland) Longyearbyen (Spitsbergen)
Homework 9: Hurricane Forecasts (adapted from Pipkin et al.)
") November 2010 MAR 110 HW9 Hurricane Forecasts 1 Homework 9: Hurricane Forecasts (adapted from Pipkin et al.) Movement of Hurricanes The advance of a tropical storm or hurricane is controlled by the prevailing
November 2010 MAR 110 HW9 Hurricane Forecasts 1 Homework 9: Hurricane Forecasts (adapted from Pipkin et al.) Movement of Hurricanes The advance of a tropical storm or hurricane is controlled by the prevailing
Ocean Dynamics. The Great Wave off Kanagawa Hokusai
 Ocean Dynamics The Great Wave off Kanagawa Hokusai LO: integrate relevant oceanographic processes with factors influencing survival and growth of fish larvae Physics Determining Ocean Dynamics 1. Conservation
f r o m a H i g h - R e s o l u t i o n I c e - O c e a n M o d e l
 Circulation and Variability in the Western Arctic Ocean f r o m a H i g h - R e s o l u t i o n I c e - O c e a n M o d e l Jeffrey S. Dixon 1, Wieslaw Maslowski 1, Jaclyn Clement 1, Waldemar Walczowski
Physical Oceanography of the Northeastern Chukchi Sea: A Preliminary Synthesis
 Physical Oceanography of the Northeastern Chukchi Sea: A Preliminary Synthesis I. Hanna Shoal Meltback Variability (causes?) II. Hydrography: Interannual Variability III. Aspects of Hanna Shoal Hydrographic
Nested Gulf of Mexico Modeling with HYCOM
 Nested Gulf of Mexico Modeling with HYCOM Patrick J. Hogan Alan J. Wallcraft Naval Research Laboratory Stennis Space Center, MS HYCOM Meeting December 6-8, 2005 University of Miami, Miami, FL 1/25 (~4
Analysis of Fall Transition Season (Sept-Early Dec) Why has the weather been so violent?
 Why has the weather been so violent?") WEATHER TOPICS Analysis of Fall Transition Season (Sept-Early Dec) 2009 Why has the weather been so violent? As can be seen by the following forecast map, the Fall Transition and early Winter Season of
WEATHER TOPICS Analysis of Fall Transition Season (Sept-Early Dec) 2009 Why has the weather been so violent? As can be seen by the following forecast map, the Fall Transition and early Winter Season of
What governs the location of the Southern Ocean deep winter mixing in CESM
 NSF NCAR WYOMING SUPERCOMPUTER CENTER DOE SCIDAC FUNDED PROJECT What governs the location of the Southern Ocean deep winter mixing in CESM Justin Small Dan Whitt Alice DuVivier Matt Long Acknowledging:
Variability and trend of the heat balance in the southeast Indian Ocean
 Variability and trend of the heat balance in the southeast Indian Ocean Ming Feng, CSIRO Marine & Atmospheric Research Arne Biastoch, Claus Böning, Leibniz-Institut für Meeresforschung Nick Caputi, Department
Impact of Alaskan Stream eddies on chlorophyll distribution in the central subarctic North Pacific* Hiromichi Ueno 1,
 October 23, 2009, 10:15-10:35 PICES 2009 Annual Meeting ICC, Jeju, Republic of Korea Impact of Alaskan Stream eddies on chlorophyll distribution in the central subarctic North Pacific* Hiromichi Ueno 1,
Buoyancy-forced circulations in shallow marginal seas
 Journal of Marine Research, 63, 729 752, 2005 Buoyancy-forced circulations in shallow marginal seas by Michael A. Spall 1 ABSTRACT The properties of water mass transformation and the thermohaline circulation
SIO 210 Problem Set 2 October 17, 2011 Due Oct. 24, 2011
 SIO 210 Problem Set 2 October 17, 2011 Due Oct. 24, 2011 1. The Pacific Ocean is approximately 10,000 km wide. Its upper layer (wind-driven gyre*) is approximately 1,000 m deep. Consider a west-to-east
South China Sea Circulation and Thermohaline Structure. Peter C Chu Naval Postgraduate School http//
 South China Sea Circulation and Thermohaline Structure Peter C Chu Naval Postgraduate School pcchu@nps.edu http//www.oc.nps.navy.mil/~chu Contributors NPS: C.P. Chang, J.M Chen, N. L. Edmon, C.W. Fan,
Verification of the Seasonal Forecast for the 2005/06 Winter
 Verification of the Seasonal Forecast for the 2005/06 Winter Shingo Yamada Tokyo Climate Center Japan Meteorological Agency 2006/11/02 7 th Joint Meeting on EAWM Contents 1. Verification of the Seasonal
SIO 210 Final examination Answer Key for all questions except Daisyworld. Wednesday, December 10, PM Name:
 SIO 210 Final examination Answer Key for all questions except Daisyworld. Wednesday, December 10, 2008 3-6 PM Name: This is a closed book exam. You may use a calculator. There are two parts: Talley (weighted
Generation and Evolution of Internal Waves in Luzon Strait
 DISTRIBUTION STATEMENT A. Approved for public release; distribution is unlimited. Generation and Evolution of Internal Waves in Luzon Strait Ren-Chieh Lien Applied Physics Laboratory University of Washington
Coastal Antarctic polynyas: A coupled process requiring high model resolution in the ocean and atmosphere
 Coastal Antarctic polynyas: A coupled process requiring high model resolution in the ocean and atmosphere Mike Dinniman and John Klinck Center for Coastal Physical Oceanography Old Dominion University
The Agulhas Current system: its dynamics and climatic importance
 The Agulhas Current system: its dynamics and climatic importance BJØRN BACKEBERG 1 NANSEN-TUTU CENTRE FOR MARINE ENVIRONMENTAL RESEARCH 2 DEPTARTMENT OF OCEANOGRAPHY, UNIVERSITY OF CAPE TOWN Nansen Centers
Variability in the Slope Water and its relation to the Gulf Stream path
 Click Here for Full Article GEOPHYSICAL RESEARCH LETTERS, VOL. 35, L03606, doi:10.1029/2007gl032183, 2008 Variability in the Slope Water and its relation to the Gulf Stream path B. Peña-Molino 1 and T.
Viscosity parameterization and the Gulf Stream separation
 Viscosity parameterization and the Gulf Stream separation Eric P. Chassignet and Zulema D. Garraffo Rosenstiel School of Marine and Atmospheric Science, University of Miami, Miami, Florida - USA Abstract.
Water Stratification under Wave Influence in the Gulf of Thailand
 Water Stratification under Wave Influence in the Gulf of Thailand Pongdanai Pithayamaythakul and Pramot Sojisuporn Department of Marine Science, Faculty of Science, Chulalongkorn University, Bangkok, Thailand
Coastal Ocean Circulation Experiment off Senegal (COCES)
") DISTRIBUTION STATEMENT A. Approved for public release; distribution is unlimited. Coastal Ocean Circulation Experiment off Senegal (COCES) Pierre-Marie Poulain Istituto Nazionale di Oceanografia e di Geofisica
DISTRIBUTION STATEMENT A. Approved for public release; distribution is unlimited. Coastal Ocean Circulation Experiment off Senegal (COCES) Pierre-Marie Poulain Istituto Nazionale di Oceanografia e di Geofisica
Journal of Coastal Develpopment ISSN :
 Volume 15, Number 1,October 2011 : 1-8 Original Paper INTRASEASONAL VARIATIONS OF NEAR-SURFACE ZONAL CURRENT OBSERVED IN THE SOUTH-EASTERN EQUATORIAL INDIAN OCEAN Iskhaq Iskandar Department of Physics,
FLORIDA CURRENT, GULF STREAM, AND LABRADOR CURRENT
 FLORIDA CURRET, GULF STREAM, AD LABRADOR CURRET P. L. Richardson, Woods Hole Oceanographic Institution, Woods Hole, MA, USA Copyright & 21 Elsevier Ltd. This article is reproduced from the 1st edition
Serial No. N4470 NAFO SCR Doc. 01/83 SCIENTIFIC COUNCIL MEETING SEPTEMBER 2001
 NOT TO BE CITED WITHOUT PRIOR REFERENCE TO THE AUTHOR(S) Northwest Atlantic Fisheries Organization Serial No. N7 NAFO SCR Doc. /8 SCIENTIFIC COUNCIL MEETING SEPTEMBER Sea-surface Temperature and Water
that individual/local amplitudes of Ro can reach O(1).
.") Supplementary Figure. (a)-(b) As Figures c-d but for Rossby number Ro at the surface, defined as the relative vorticity ζ divided by the Coriolis frequency f. The equatorial band (os-on) is not shown due
Supplementary Figure. (a)-(b) As Figures c-d but for Rossby number Ro at the surface, defined as the relative vorticity ζ divided by the Coriolis frequency f. The equatorial band (os-on) is not shown due
Wind Gyres. curl[τ s τ b ]. (1) We choose the simple, linear bottom stress law derived by linear Ekman theory with constant κ v, viz.
![Wind Gyres. curl[τ s τ b ]. (1) We choose the simple, linear bottom stress law derived by linear Ekman theory with constant κ v, viz.](/thumbs/88/117265944.jpg "Wind Gyres. curl[τ s τ b ]. (1) We choose the simple, linear bottom stress law derived by linear Ekman theory with constant κ v, viz.") Wind Gyres Here we derive the simplest (and oldest; Stommel, 1948) theory to explain western boundary currents like the Gulf Stream, and then discuss the relation of the theory to more realistic gyres.
Wind Gyres Here we derive the simplest (and oldest; Stommel, 1948) theory to explain western boundary currents like the Gulf Stream, and then discuss the relation of the theory to more realistic gyres.
CHAPTER 2 - ATMOSPHERIC CIRCULATION & AIR/SEA INTERACTION
 Chapter 2 - pg. 1 CHAPTER 2 - ATMOSPHERIC CIRCULATION & AIR/SEA INTERACTION The atmosphere is driven by the variations of solar heating with latitude. The heat is transferred to the air by direct absorption
Island Wakes in Shallow Water
 Island Wakes in Shallow Water Changming Dong, James C. McWilliams, et al Institute of Geophysics and Planetary Physics, University of California, Los Angeles 1 ABSTRACT As a follow-up work of Dong et al
Developing Coastal Ocean Forecasting Systems and Their Applications
 Developing Coastal Ocean Forecasting Systems and Their Applications Xiaochun Wang a,b LASG/IAP, CAS, July 23, 2010 Contributions from: JPL Yi Chao, John Farrara, Peggy Li, Zhijin Li, Quoc Vu, Hongchun
2/15/2012. Earth System Science II EES 717 Spring 2012
 Earth System Science II EES 717 Spring 2012 1. The Earth Interior Mantle Convection & Plate Tectonics 2. The Atmosphere - Climate Models, Climate Change and Feedback Processes 3. The Oceans Circulation;
Effect of ocean surface currents on wind stress, heat flux, and wind power input to the ocean
 GEOPHYSICAL RESEARCH LETTERS, VOL. 33,, doi:10.1029/2006gl025784, 2006 Effect of ocean surface currents on wind stress, heat flux, and wind power input to the ocean Jordan T. Dawe 1 and LuAnne Thompson
CHAPTER 7 Ocean Circulation Pearson Education, Inc.
 CHAPTER 7 Ocean Circulation 2011 Pearson Education, Inc. Types of Ocean Currents Surface currents Deep currents 2011 Pearson Education, Inc. Measuring Surface Currents Direct methods Floating device tracked
Average velocity and transport of the Gulf Stream near SSW
 Journal of Marine Research, 43,83-111, 1985 Average velocity and transport of the Gulf Stream near SSW by P. L. Richardson l ABSTRACT Long-term current measurements made with surface drifters, SO FAR floats
RECENT STUDIES OF THE SEA OF OKHOTSK
 RECENT STUDIES OF THE SEA OF OKHOTSK Masaaki Wakatsuchi Institute of Low Temperature Science, Hokkaido University, Sapporo, Japan ABSTRACT We recently have had a Japan-Russia-United States International
Capabilities of Ocean Mixed Layer Models
 Capabilities of Ocean Mixed Layer Models W.G. Large National Center for Atmospheric Research Boulder Co, USA 1. Introduction The capabilities expected in today s state of the art models of the ocean s