A Summary of Current Programs and Opportunities for Enhancements
|
|
|
- Brittney Gregory
- 6 years ago
- Views:
Transcription


1 INVENTORY AND ASSESSMENT OF COLORADO WEATHER MODIFICATION PROGRAMS A Summary of Current Programs and Opportunities for Enhancements October 1, 2015 Prepared For: Prepared by:
2 This page intended to be blank
3 Acknowledgements This report was prepared with significant input and assistance from a diverse group of experts in the field of weather modification. In particular, the guidance of Joe Busto and mapping expertise of Erik Skeie was invaluable. A special thank you is extended to the following individuals: Joe Busto, Colorado Water Conservation Board (staff) Erik Skeie, Colorado Water Conservation Board (staff) April Montgomery, Colorado Water Conservation Board (board member) Colorado Weather Modification Program Managers and Sponsors o Frank Kugel, Upper Gunnison River Water Conservancy District o Bruce Whitehead, Southwestern Water Conservation District o Pam Star, San Juan Resource Conservation and Development Council o Ken Curtis, Dolores Water Conservancy District o Slade Connell, Weather Enhancement Authority City of Grand Junction o Mark Ritterbush, Weather Enhancement Authority City of Grand Junction o Elizabeth Howe, Vail Resorts, Inc. o Maria Pastore, Grand River Consulting Colorado Weather Modification Program Contractors o Don Griffith, North American Weather Consultants Inc., with headquarters in Sandy, Utah o Larry Hjermstad, Mike Hjermstad, Eric Hjermstad, Alisa Hjermstad, Western Weather Consultants, LLC., with headquarters in Durango, Colorado o John Thompson, with headquarters in Montrose, Colorado Other Contributors to this Report o Tom Ryan, Metropolitan Water District of Southern California on behalf of the Lower Colorado River Basin entities o Barry Lawrence, Deputy Director of the Wyoming Water Development Office o Desert Research Institute, with headquarters in Reno, Nevada o Idaho Power Company, with headquarters in Boise, Idaho o Radiometrics Corporation, with headquarters in Boulder, Colorado 1
4 This page intended to be blank
5 Contents 1. INTRODUCTION Purpose Role of CWCB Abbreviated Summary of Science and Associated Policies Abbreviated Summary of Process and History SUMMARY OF EXISTING PROGRAMS Central Colorado Mountains River Basin Program Vail/Beaver Creek Program Grand Mesa Program Upper Gunnison River Basin Program Western San Juan Mountains Program Eastern San Juan Mountains Program West Dolores and Telluride Resort Ski Area Program CLOUD SEEDING EQUIPMENT OPPORTUNITIES Cloud Seeding Generators Meteorological Equipment SCIENTIFIC EVALUATION REQUIREMENTS AND OPPORTUNITIES Required Annual Scientific Reports/Target and Control Evaluations Recommended Periodic Weather Modification Scientific Evaluations FUNDING OPPORTUNITIES Program Sponsors CWCB Cost Share Grants Lower Colorado River Basin Entities FUTURE PROGRAM ENHANCEMENT GOALS RECOMMENDATIONS LIST OF REFERENCES Personal Communications (2015)
6 This page intended to be blank
7 List of Figures Figure 1. Description and Diagram of Winter Orographic Cloud Seeding... 7 Figure 2. Colorado Weather Modification Programs Figure 3. Colorado Weather Modification Programs with April 1 st Median SWE Figure Deployment of DRI Remote Generator in the GM Program Target Area Figure Deployment of IPC Remote Generator in the GM Program Target Area Figure 6. LP Dispenser Figure 7. Radiometrics Radiometer Figure 8. CWCB Radiometer Installed in CCMRB Program Target Area for Winter Season Figure 9. DRI Weather Station List of Tables Table 1. Preliminary List of Desired Future Program Enhancements List of Attachments Attachment 1: Colorado Cloud Seeding Frequently Asked Questions Attachment 2: Colorado Weather Modification Rules and Regulations Attachment 3: State of Colorado Weather Modification Permits Attachment 4A: Central Colorado Mountains River Basin Program Attachment 4B: An Evaluation of Seeding Effectiveness in the CCMRB Program, NCAR 2015 Attachment 5: Vail/Beaver Creek Program Attachment 6: Grand Mesa Program Attachment 7: Upper Gunnison River Basin Program Attachment 8: Western San Juan Mountains Program Attachment 9: Eastern San Juan Mountains Program Attachment 10: West Dolores and Telluride Ski Area Program Attachment 11: Idaho Power Company Cloud Seeding Program and Equipment Information Attachment 12: Desert Research Institute Cloud Seeding Research and Services Attachment 13: Radiometrics Corporation Radiometer Information; 2014 CWCB Purchase Quote Attachment 14: Draft Executive Summary Wyoming Weather Modification Pilot Program Level II Study Attachment 15: Potential Water Augmentation From Cloud Seeding in the Colorado River Basin 3
8 This page intended to be blank
9 1. INTRODUCTION 1.1 Purpose This report serves two primary purposes: I. Provide a comprehensive summary of all operational weather modification programs in Colorado II. Promote current opportunities to enhance Colorado weather modification programs with new technology, scientific evaluations, partnerships, and potential funding This report summarizes general information about the seven permitted weather modification programs in Colorado. All of these programs have been successfully, measurably, and economically working to increase the snowpack and associated water supply in the Upper Colorado River Basin without adverse impacts. To set the stage for continued program success and future enhancements, this report provides a foundational understanding of current program status and cloud seeding operations in Colorado. It is anticipated that this foundation will help the Colorado Water Conservation Board (CWCB) as the weather modification permitting agency within the Department of Natural Resources as well as the currently permitted cloud seeding program staff, program sponsors, and potential funders to evaluate needs and opportunities to assist with ongoing program growth and development. The time is ripe for program enhancements due to current opportunities in new meteorological technology, scientific evaluations, expanded partnerships, and potential funding sources. In fact, the strategic use of partnerships and modernized equipment will be increasingly important to effectively meet program objectives. This report seeks to encourage expanded coordination and communication between programs in Colorado which may provide new funding opportunities and economies of scale. Program enhancements can also build on the findings of recent scientific research referenced herein to maximize cloud seeding effectiveness and efficiency. Ultimately, the information in this report is intended to help spur the strategic evolution of programs in Colorado with state of the art equipment and technology to achieve the vision set forth by the CWCB. Along with the summary information provided in the report, a large amount of additional information is contained in the attachments and listed references. 1.2 Role of CWCB The CWCB is the weather modification permitting agency for the State of Colorado. Pusuant to the 2008 CWCB Board approved strategic plan, CWCB staff seeks to balance weather modification grants to program operators, for new equipment, and for scientific evaluations and studies. At the CWCB, Joe Busto serves as the CWCB Weather Modification Program Coordinator with over 15 years of experience managing various weather modification activities. Most of the permitted programs in Colorado currently utilize ground based operations with the goal of snowpack augmentation. Information about permits, grant funding, and weather modification rules and regulations is outlined below, with additional details available on the weather modification page of the CWCB website. Attachment 1 provides additional information on Colorado Cloud Seeding Frequently Asked Questions, 4
10 May 2014 prepared by Joe Busto (CWCB). Information from this fact sheet is referenced throughout the report. CWCB Vision. The CWCB vision is to bring existing weather modification programs up to the industry standard. To further that goal, the CWCB contracted with Reclamation in 2005 and hired two retired Reclamation employees, Dr. Arlin Super and James Heimbach, noted experts in weather modification research and evaluations. According to Joe Busto (CWCB), Super and Heimbach were involved with the NOAA and Reclamation federal research programs and represent decades of experience in research, development, and evaluating cloud seeding programs. The report provides an excellent resource for the science of cloud seeding and covers three main areas including (1) a discussion of super cooled liquid water moving over mountain barriers that is the fuel needed for cloud seeding (which is not a limiting factor in Colorado according to Joe Busto), (2) a comparison of low elevation manual generators with high elevation remote generators, and (3) detailed information about propane seeding and its uses (Super and Heimbach, 2005). According to Joe Busto (CWCB) this report provides a strong scientific basis to increase the use of higher elevation remotes in Colorado and further develop liquid propane seeding operations to benefit ski areas who want early skier days. Joe Busto urges weather modification program managers, program sponsors, and others to read the report since its findings are consistent with the State's ongoing efforts to deploy radiometers and high elevation remotes in existing Colorado programs. The report can be downloaded at: management/water projectsprograms/documents/weathermodification/silveriodidecomparisonpropanestudy.pdf Permits. In order to modify weather in Colorado, the CWCB requires the program cloud seeding manager and/or contractor to obtain a permit from the State. Once a permit application is submitted, the program contractors and/or program manager(s) must publish the permit application in local newspapers and participate in public hearings. Permit application comments (for and against) are a part of the record of decision, and are used to develop the terms and conditions for the permit and/or recommendations to approve or deny the permit. There are several requirements the State uses to determine the approval of a permit: 1. Public notice of intent in the target area and adjacent counties 2. Public hearing with the CWCB and Attorney General s Office 3. Qualifications adequate to conduct operations (e.g. qualified operator) 4. Proof of financial responsibility and general liability insurance (required for the project sponsors by the permit holder) 5. Operational plan detailing the operations and naming the sponsors 6. Safeguards in place by the contractor and state Permits allow for seeding operations during a period covering five months of the winter season, typically November 1 through March 31. If snowpack levels have not exceeded set thresholds, and avalanche hazard levels are not present, short extensions can be formally requested from the State for a few weeks into April each year provided adequate funding remains. Permits cover operations for five 5
11 consecutive years and are renewable. After two consecutive five year permits, a ten year permit can be requested. Rules and Regulations. Colorado s weather modification program has been delegated through administrative order to the CWCB since 1987 however the program authorities reside in the Executive Director s Office of the Department of Natural Resources (DNR). In 2012, on behalf of the DNR, the CWCB updated the 1987 Colorado Weather Modification Rules and Regulations (Attachment 2). Accordingly, under the new 2012 rules, Rule 13.B requires the permit holder to provide annual target/control evaluations of precipitation or snow water equivalent. Further, Rule 19 requires the permit holder to submit proposal to the program sponsors to complete periodic independent, peerreviewed scientific evaluations. The State strongly encourages independent evaluations as opposed to the program contractors or permit holders evaluating their own programs. This rule equates periodic to be at least once during a five year permit, or twice during a ten year permit. Rule 13.A and 13.B provide examples of accepted scientific evaluations. Grant Funding. State grants for operations and new equipment are available to permitted wintertime, ground based cloud seeding programs in Colorado that are managed by water providers and local governments. Evaluation proposals can be submitted to the State from any source. Ski areas and other interests are not currently eligible for cloud seeding grants. However, there are nine ski areas have been commonly partnering with water districts and local governments. Grant funding is provided to welldesigned programs to promote modernization efforts, the implementation of new technologies, and improved scientific evaluations. Grant funding examples include, but are not limited to, the following: (1) Enabling the full utilization of all winter months in weather modification permits (2) Purchasing or leasing equipment (e.g. weather stations, remote operated generators) (3) Scientific studies to evaluate the effectiveness of cloud seeding programs 1.3 Abbreviated Summary of Science and Associated Policies Outlined below is an abbreviated and bulleted summary of the science of winter orographic cloud seeding in Colorado, including associated standard policy statements and pertinent scientific literature. Please note that this is only a brief summary since this report is not intended to describe cloud seeding science in detail nor all related policies, rules, and regulations. Winter orographic cloud seeding in Colorado, a form of weather modification, includes the release of small amounts of silver iodide (AgI) in solution that is sprayed across a propane flame from a ground based generator unit and released into appropriate atmospheric conditions that include super cooled water droplets. The AgI particles nucleate with water vapor to form ice crystals that turn into snowflakes and fall out in the target area. Figure 1 illustrates the process of ground based cloud seeding in mountainous terrain. Winter time snowpack and summer time precipitation augmentation, two forms of weather modification technology, have been used around the world since the 1940s. In the western United States, the North American Weather Modification Council (NAWMC) was organized in January 2011 as a non profit 501(c)4 corporation to advance and promote the proper use of 6
12 weather modification technologies through education and research. Additional details, including current members and cloud seeding informational brochures, can be found at: Moist air rises as it flows over the mountains, cooling and creating clouds composed of supercooled water droplets. Minute amounts of silver iodide in solution are sprayed across a propane flame or released from an aircraft mounted flare. The air flow up the mountain barrier carries the particles into the clouds. The silver iodide crystals provide nuclei for the formation of ice crystals. By freezing of droplets and deposition of vapor, ice crystals form and grow progressively larger, forming snowflakes large enough to precipitate to the ground. Figure 1. Description and Diagram of Winter Orographic Cloud Seeding (Courtesy NAWMC) Ground based generators can be operated either manually or remotely, within or outside the target area. Historically, generators have been manually operated by local residents. Remotely operated generators, more recently on the rise in use in Colorado cloud seeding programs, typically use more modern technology (e.g. an internet management interface) and allow for seeding at higher elevations. Both types of operations have advantages and disadvantages. The advantages include accessing better locations to release silver and complete control of turning the remotes off and on at will. Aircraft operations are not used currently in the State of Colorado. The American Society of Civil Engineers (ASCE), Environmental and Water Resources Institute published a document entitled Standard Practice for the Design and Operation of Precipitation Enhancement Projects (ASCE 2004). This Standard contains a summary of different types of cloud seeding agents (e.g. AgI, dry ice, and liquid propane) (Griffith et al, 2006). Policy statements by the World Meteorological Organization related to cloud seeding effectiveness indicate that "glaciogenic seeding of clouds formed by air flowing over mountains 7
13 offers the best prospects for increasing precipitation in an economically viable manner (Huggins, 2009). In Colorado, the CWCB provides the following statement related to cloud seeding effectiveness: Colorado contractor annual reports typically estimate a magnitude of increase from welldesigned and properly conducted programs to range from 5 15% over mountainous terrain (CWCB FAQ 2014). Weather Modification Association (WMA) has similar policy statements: The seeding agents and methodologies used in present day cloud seeding projects have been developed and refined for over 60 years. There is some consensus that cold cloud seeding technologies can increase area wide seasonal precipitation by approximately 5 15% when the seeding is effectively applied to suitable clouds. The WMA s 2011 Capability Statement on Weather Modification provides additional details: Available scientific research has clearly documented that winter cloud seeding with AgI has no adverse environmental effects as it is currently being used in the conduct of cloud seeding programs (WMA FAQ 2015). Silver iodide in this form is a six sided particle and is optimal for cloud water vapor to bond to, but it is not freely available to bio accumulate in the environment. It is either part of the seeding process or is found in miniscule amounts in parts per trillion known as traces in soils and water. The WMA website provides a bibliography with additional detail: The common misconception that cloud seeding steals precipitation from one area to the benefit of another assumes that there is a very limited amount of moisture in the atmosphere. In fact, scientific research has shown that due to the large magnitude of atmospheric water vapor that passes over the United States on an annual basis, only a small fraction of the water balance is potentially impacted in a targeted area (approximately 1% if cloud seeding results in approximately a 10% increase over some limited geographical target area) (WMA FAQ 2015). Evidence of precipitation increases have scientifically proven methods through randomized experiments that provide statistically measurably increases in precipitation (Huggins et al, 2009). The current understanding of the science of weather modification has evolved, enabling associated technological advances. The most recent scientific research experiment providing new insights and verification of program efficacy is the Wyoming Weather Modification Pilot Project (WWMPP). The preliminary statistical results of the 10 year WWMPP imply a 3% increase in precipitation with a 28% probability that the result occurred by chance (NCAR 2014). It is important to qualify that these preliminary results are based on specific seeded events and not overall seasonal increases. It is also important to note that these preliminary results are specific to these mountain regions and cannot be applied to all western mountain ranges. It is conceivable that there are mountainous areas that would see more or less precipitation increases from seeding if this same randomized program design was conducted elsewhere. However, the National Center for Atmospheric Research (NCAR) states that when the preliminary results are combined from the physical, modeling, and statistical studies completed, this led to an accumulation of evidence from the statistical, modeling, and physical analysis which suggest a 8
14 positive seeding effect on the order of 5 to 15%. A phone interview with Barry Lawrence (Deputy Director of the Wyoming Water Development Office, Project Manager for the WWMPP) noted an important qualification of the preliminary results: only approximately 30% of the winter storms over the Medicine Bow and Sierra Madre Ranges had the necessary seedable conditions. Thus, the preliminary results indicating a 5 15% increase in seedable storms is based on post stratification of the data from the confirmatory experiment and also modeling. To determine increases in snowmelt driven streamflow for the season, daily percent increases in precipitation were determined by applying the range of possible seeding percent increase scenarios. The percent increases in precipitation were then applied to daily precipitation data for use in a hydrologic model which determined increases in snowmelt driven streamflow. These results were then aggregated to the seedable area in the basin to determine streamflow increases within the basin. In Colorado, a similar smaller scale effort was conducted to evaluate the seeding effectiveness of a portion of the Target Area for the largest cloud seeding program in the State (Central Colorado Mountains River Basin Program). The focus of this study was to use a nine year Weather Research Forecast model (WRF) climatology data set to go back in time and find when and where high seeding potential areas occurred. The high seeding potential areas are referred to as hot spots within a permitted target area, indicating where the seeding criteria were met most often. The results of the study provide a proof of concept in how to further evaluate the effectiveness of a cloud seeding program. While the model results tend to support the need for more remote controlled generators to maximize effective operations, the evaluation of additional test cases (i.e. model simulations) is needed to further validate the model results (NCAR 2015). NCAR recommends the modeling of several more simulations that represent different flow regimes, temperature changes, and stability profiles to begin to generalize results and to specify potential changes to operational programs. The next step is to model seeding generator output and its interaction with the identified seeding hotspots. 1.4 Abbreviated Summary of Process and History Outlined below is an abbreviated and bulleted summary of the history and process governing cloud seeding in Colorado. More detail can be found in the attachments and listed references (especially Attachment 2). Weather modification operations and research have been conducted in Colorado since the 1950s, including the Climax I and Climax II valuable seeding experiments in the 1960s, and the Colorado River Basin Pilot Project (aka Project Skywater ) as the first major effort, performed by the U.S. Bureau of Reclamation (Reclamation) from 1970 to 1974 (Reynolds, 2015). The CWCB is the weather modification permitting agency for the State of Colorado. Pursuant to the 2008 CWCB Board approved strategic plan, CWCB staff seeks to balance weather modification grants to program operators, for new equipment, and for scientific evaluations and studies. The first program in Colorado began at the Vail Ski area in the early 1970s. 9
15 There are an estimated 107 generators in operation in Colorado during the winter cloud seeding season, typically operating November through March or April (CWCB FAQ 2014). There are over forty diverse entities that participate in local cloud seeding programs, including towns, counties, water districts, and ski areas (CWCB FAQ 2014). Funding for the weather modification programs in Colorado has been fairly stable over the last five years at about $1M/year. Of this amount, about 65% is from local sources, 18% is contributed from the CWCB, and 17% is from the Lower Basin State donations (AZ, NV and CA) (CWCB FAQ 2014). The most recent State Weather Modification Rules and Regulations require annual target and control evaluations of precipitation and snow water equivalent (Rule 13.B.), adopted based on feedback from local program sponsors indicating that they wanted help in evaluating and refining their programs. The requirements also serve to provide documentation allowing snow totals to be tracked as a trend analysis over time where relationships between expected and actual snow totals in a seeded area and non seeded area that are similar are developed and reported annually by the permit holder. Further, Rule 19 requires the permit holder to submit proposals to project sponsors to complete periodic independent, peer reviewed scientific evaluations. This is an area where strong local leadership by the program sponsors is needed and will dictate the level and detail of analysis. Independent evaluations help to build confidence and credibility of these programs and therefore are strongly encouraged by the CWCB. 10
16 This page intended to be blank
17 2. SUMMARY OF EXISTING PROGRAMS There are seven weather modification programs currently operating in the State of Colorado as shown on the map in Figure 2. To demonstrate program and cloud seeding generator locations relative to snowpack, Figure 3 displays the program and generator location along with the median snow water equivalent (SWE) on April 1 st. Since 2003, the National Weather Service s (NWS) National Hydrologic Remote Sensing Center has been using an operational snowpack model called the Snow Data Assimilation System (SNODAS). The SNODAS model uses SNOTEL data and satellite imagery to accurately represent snowpack levels, including areas of high snowpack and SWE. All seven programs have obtained the required permits from the CWCB to operate cloud seeding activities for their respective target areas (Attachment 3). The current weather modification programs in Colorado include: Central Colorado Mountains River Basin Program (CCMRB Program) Vail/Beaver Creek Program (V/BC Program) Grand Mesa Program (GM Program) Upper Gunnison River Basin Program (UGRB Program) Western San Juan Mountains Program (WSJM Program) Eastern San Juan Mountains Program (ESJM Program) West Dolores and Telluride Resort Ski Area Program (WDTR Program) The individual weather modification program managers and respective contractors helped to develop a general informational fact sheet for their program that includes a brief program summary, overview of objectives, sponsors and funding, and proposed future program enhancements. The program fact sheets and associated maps are provided in Attachments There are two program maps included with each of the individual program fact sheets: (1) a map of the permitted target area, current location of manual and remote generators (if applicable), and proposed future locations of manual and remote generators (if applicable); and (2) a map of April 1 st median snow water equivalent (inches) from the SNODAS model for the permitted target area. Please note that for the CCMRB Program, two additional maps are included to illustrate the northern and southern permitted target areas (Target Areas 1 and 3). Seeding operations are not currently occurring in these two target areas but were requested as part of the geographically diverse set of program sponsors in this program. Further details about these two permitted areas are described in this section of the report. 11

18 Figure 2. Colorado Weather Modification Programs (Courtesy CWCB) 12


19 Figure 3. Colorado Weather Modification Programs with April 1 st Median SWE (Courtesy CWCB) 13
20 2.1 Central Colorado Mountains River Basin Program As summarized in Attachment 4A, the CCMRB Program includes a large, collaborative coalition of East and West Slope entities. The key program objective is to increase snowfall in the early season for the ski resort participants, and overall snow pack for the entire winter season throughout the target area. Program operations are performed by Western Weather Consultants (WWC), with required annual target and control evaluations performed by North American Weather Consultants (NAWC). In addition, Desert Research Institute (DRI) has been operating the existing two remote generators within the target area located near the Winter Park Ski Area since 2009, and provides separate annual operational summary reports. As noted previously, there are three permitted target areas however only one area is currently being targeted with seeding operations (Target Area 2). Specific future CCMRB Program enhancements include funding new meteorological instrumentation, additional remote generators, potential liquid propane (LP) generators, one radiometer, investigate opportunities to implement cloud seeding operations in the permitted Target Areas 1 and 3, and on going scientific evaluations of the seeding effectiveness of the CCMRB Program. In 2014, NCAR completed an independent evaluation of the seeding effectiveness within a portion of the CCMRB Program with the Phase 1 study results summarized in the April 2015 report (Attachment 4B). This was the first independent scientific evaluation completed of an ongoing operational weather modification program in the State of Colorado, providing a proof of concept in how to further evaluate the effectiveness of a cloud seeding program. The CCMRB Program Sponsors will next consider helping fund a Phase 2 high resolution modeling and plume dispersal study that builds off results from the NCAR Phase 1 Study to help evaluate the effectiveness of the existing manual generator locations and to help identify sites for new remote generators. The CWCB funded a portion of the Phase 1 study, and has plans to provide grant funding for the proposed Phase 2 study. 2.2 Vail/Beaver Creek Program As summarized in Attachment 5, the V/BC Program began in 1976 and is the first and oldest cloud seeding program in Colorado. The V/BC Program recently became encompassed by the CCMRB Program (since 2013), but is focused only on the ski areas of Vail and Beaver Creek and Vail Resorts, Inc. is the program manager. Program operations are performed by WWC. The program also shares some seeding equipment and operational management with the CCMRB Program, and in 2015 provided funding assistance for the required annual target/control evaluations. The V/BC Program seeks to increase early season snowfall to help with early opening dates, shorten the timeframe needed to make snow, and increase snowpack to lengthen the ski season. During the season the V/BC Program benefited from the use of a radiometer leased by the CWCB to help analyze suitable conditions for seeding operations. Specific future V/BC Program enhancements recommended by WWC for the V/BC Program Manager and Sponsors consideration include funding new meteorological instrumentation, one additional remote generator, up to two additional manual and LP generators, and on going scientific evaluations of the seeding effectiveness and generator location. 14
21 2.3 Grand Mesa Program As summarized in Attachment 6, the GM Program includes a large coalition of diverse entities to target weather modification activities on the Grand Mesa and surrounding areas. Unlike other programs that rely on contractors to perform cloud seeding operations and maintenance, the GM Program uses staff from sponsoring organizations (primarily the Water Enhancement Authority City of Grand Junction). Target and control evaluations of the program are performed by NAWC. The GM program seeks to increase natural snowpack, related streamflow, and reservoir storage in the Target Area. This program was recently approved for funding from the CWCB s Water Supply Reserve Account grant program to help with the purchase of two new remote generators from Idaho Power Company (IPC). The new IPC generators were deployed on September 15 and 16, 2015 at an elevation of about 9,500 feet, close to the targeted cloud bases, and upwind of most of the target area filling an important remaining gap in the program s coverage. Accordingly, it provides an important step in the modernization of the program s equipment. In addition, other specific future GM Program enhancements include funding new meteorological instrumentation, replacing manual generators with remotes over time and as funding is available, and on going scientific evaluations of the seeding effectiveness and generator location. The GM Program is also investigating opportunities to implement a new cloud seeding program in the Battlement Mesa area (Garfield County). 2.4 Upper Gunnison River Basin Program As summarized in Attachment 7, the UGRB Program includes a coalition of diverse entities to target the Upper Gunnison Basin. Program operations, as well as the required annual target/control evaluations, are performed by NAWC. The program seeks to increase natural snowpack, related streamflow, and reservoir storage in the Target Area. A ground based icing meter was installed in 2014 at the Crested Butte Ski Area to make observations of super cooled liquid water to assist with seeding decisions. An analysis and report of icing data collected from the season is currently being performed. In the upcoming season the program will also benefit from the use of the CWCB leased radiometer to make additional observations of super cooled liquid water, allowing for comparisons of observed data with the existing ground based icing meter. Specific future UGRB Program enhancements include funding new meteorological instrumentation, one or two new remote generators to target high yield areas, possibly two or three new manual generators, and on going scientific evaluations of the seeding effectiveness and generator location. Existing funding is currently not adequate to take advantage of all seeding potential and scientific evaluation opportunities. The UGRB Program is seeking opportunities for shared generator installations with neighboring basins. 15
22 2.5 Western San Juan Mountains Program As summarized in Attachment 8, the WSJM Program includes a coalition of local water districts and the Purgatory ski area, targeting the Western San Juan Mountains. Program operations are performed by the local company WWC, with required annual target/control evaluations performed by NAWC. The program seeks to increase natural snowpack in the Target Area for water supply and ski resort activities. Specific future WSJM Program enhancements include funding new meteorological instrumentation, new remote generators to maximize the effectiveness of seeding operations, new manual generators only if carefully reviewed and approved, and on going scientific evaluations of the seeding effectiveness and generator location/type. Existing funding is currently not adequate to take advantage of all seeding events, utilization of new technologies and equipment, and/or scientific evaluation opportunities. The WSJM Program is seeking opportunities for shared generator installations with neighboring basins. In addition, the program seeks to create a five year strategic work plan that recognizes needed program modernization as supported by the program costs and priorities reviewed and approved by participants. 2.6 Eastern San Juan Mountains Program As summarized in Attachment 9, the ESJM Program includes a coalition of local water districts and the City of Durango, targeting the Eastern San Juan Mountains. Program operations are performed by the local company WWC, with target/control evaluations performed by NAWC. The program seeks to increase natural snowpack, related streamflow, and reservoir storage in the Target Area. Specific future ESJM Program enhancements include funding new meteorological instrumentation, new remote generators to maximize the effectiveness of seeding operations, new manual generators only if carefully reviewed and approved, and on going scientific evaluations of seeding effectiveness and generator location/type. Existing funding is currently not adequate to take advantage of all seeding events, utilization of new technologies and equipment, and/or scientific evaluation opportunities. The ESJM Program is seeking opportunities for shared generator installations with neighboring basins. In addition, the program seeks to create a five year strategic work plan that recognizes needed program modernization as supported by the program costs and priorities reviewed and approved by participants. It is our understanding that there is also interest by the Rio Grande water users in the Conejos Basin to explore future collaboration opportunities with this program. 2.7 West Dolores and Telluride Resort Ski Area Program As summarized in Attachment 10, the WDTR Program includes a coalition of local water districts and the Telluride Resort ski area, targeting the upper regions of the West Dolores and San Miguel River drainage basins including the ski area. Program operations are performed by the local company WWC, with target/control evaluations performed by NAWC. The program seeks to increase natural snowpack in the Target Area for water supply and ski resort activities. 16
23 Specific future WDTR Program enhancements include funding new meteorological instrumentation, new remote generators to maximize the effectiveness of seeding operations, new manual generators only if carefully reviewed and approved, and on going scientific evaluations of seeding effectiveness and generator location/type. Existing funding is currently not adequate to take advantage of all seeding events, utilization of new technologies and equipment, and/or scientific evaluation opportunities. The WDTR Program is seeking opportunities for shared generator installations with neighboring basins. In addition, the program seeks to create a five year strategic work plan that recognizes needed program modernization as supported by the program costs and priorities reviewed and approved by participants. 17
24 This page intended to be blank
25 3. CLOUD SEEDING EQUIPMENT OPPORTUNITIES The technology of cloud seeding generators is constantly evolving. In addition, many different kinds of modern meteorological equipment can greatly assist with enhanced weather forecasting to provide for more accurate seed/no seed decisions. These new technologies, especially when combined, now provide numerous opportunities to improve the effectiveness of seeding operations. General information and examples of some currently available equipment are provided below to help inform potential program enhancement considerations. Please note that equipment capabilities, design, and costs are constantly changing. In general, the two most significant technological advancements to date in cloud seeding include the use of remote generators and radiometers. Remote generators enable strategic placement at high elevation locations that are commonly too inaccessible for manual operation. By seeding higher elevations remote generators are more effective at reaching seedable cloud formations that contain the necessary conditions of super cooled liquid water, and have a higher seeding rate than manual generators. Radiometers currently have the most advanced capabilities to detect super cooled liquid water with data that is updated continuously. Super cooled liquid water is the key to converting the liquid water content in a storm system into natural precipitation when AgI particles are added. There is new research and development work with IPC and NCAR to use radiometers and weather models to estimate gains from seeding, including utilizing the liquid water data from radiometers to enhance weather modeling efforts. 3.1 Cloud Seeding Generators The ground based generators that are utilized in typical winter orographic cloud seeding programs include manual generators, remote generators and liquid propane (LP) generators. A description of each is outlined below. Currently, manual generators are utilized in all seven Colorado weather modification programs. There are a limited number of remote generators utilized in two Colorado programs, and only the GM Program utilizes one LP generator in combination with other manuals and remotes. As outlined in Section 2, there is a desire to include additional remote and LP generators in most of the Colorado programs where appropriate and funding is available. Manual Generators. Ground based manual generators release microscopic particles of AgI into or below a cloud base to act as nuclei for ice crystals to form, thus stimulating precipitation development. As one of the original cloud seeding technologies (along with airborne seeding via aircraft), manual generators currently serve as the foundation of weather modification programs in Colorado. These generators can be cost effective, but have limitations related to available siting locations, staffing requirements, timely operation, impacts of thermal inversions, and monitoring. However, the use of manual generators will likely continue to fill an important role in Colorado s weather modification programs in conjunction with the increased use of remote generators as the demand increases and funding becomes available. 18

26 Manual generators are readily available from a number of manufacturers, including cloud seeding contractors operating in Colorado. Manual generators are the lowest cost seeding technology, generally costing in the range of $8,000 to $15,000. Remote Generators. Remote generators operate in a similar way to manual generators (release of AgI particles from ground based equipment) but use modern telecommunications technology with internet connectivity to enable seeding operations at strategic high elevation locations since they do not need someone present to operate the equipment. Due to the many benefits of remote generators many weather modification programs in the Western United States are increasingly relying on them. Remote generators enable strategic placement at high elevation locations that are too inaccessible for manual operation. By seeding higher elevations remote generators are more effective at reaching seedable cloud formations that contain the necessary conditions of super cooled liquid water, resulting in a higher seeding rate than manual generators. In addition, in many mountainous regions high elevation remote generators enable seeding above thermal inversions that can curb the efficacy of valley based manual generators. Remote generators can also allow for better monitoring through realtime operations, data management, and long term program analysis. Since remote generators don t rely on manual operation (often performed by volunteers) they usually enable more consistent and timely operation. Figure 4 illustrates a DRI remote generator deployed in the GM Program Target Area in Figure Deployment of DRI Remote Generator in the GM Program Target Area (Courtesy CWCB) As detailed in Attachments 11 and 12, remote generators are currently offered by IPC and DRI for purchase and/or lease. WWC is also in the process of developing remote generators for use in the Colorado programs which should be available in General purchase costs are currently in the range 19

27 of $35,000 to $60,000, with leasing options available for much less. As outlined in Section 2.3, two new IPC remotes were deployed in September 2015 in the GM Program target area. Figure 5 illustrates successful deployment of one of the IPC remote generators installed on the south side of the Grand Mesa near Cedaredge on September 16. Figure Deployment of IPC Remote Generator in the GM Program Target Area (Courtesy CWCB) Since remote generators typically require placement at high elevations on public land, environmental permitting of the siting locations is often necessary. A local Denver company, Heritage Environmental, has experience with permitting for equipment siting for the recently completed Wyoming Weather Modification Pilot Project. Their experience could be helpful for future permitting needs in Colorado. Liquid Propane (LP) Dispensers. Ground based LP generators work by harnessing the extremely cold temperature generated by the expansion of liquid propane when released. The LP generators will instantly condense and freeze liquid water droplets in super cooled clouds without the introduction of a substrate (i.e. AgI). Figure 6 illustrates a typical LP generator. As a result, propane seeding works at warmer temperatures than AgI seeding, and is therefore ideal for use early and late in the weather modification season. The ability to seed in warmer temperatures makes propane seeding particularly useful at ski resorts seeking to expand early season snow coverage and extend snowpack later into the spring. The CWCB is currently seeking to partner, import, and deploy more propane dispensers specific to Ski Area goals in Colorado. Propane generators also have the benefit of being relatively inexpensive, typically less than 20

28 $20,000. A disadvantage of propane dispensers is that they must be placed at very high elevations in order to get propane into the cloud bases, and they have a smaller plume where the precipitation falls out (approximately 2.5 miles downwind). Figure 6. LP Dispenser (Courtesy CWCB) 3.2 Meteorological Equipment Radiometers. Radiometers are small, mobile instruments (Figure 7) that measure vertical profiles of weather data to monitor atmospheric information, providing high resolution temperature, relative humidity, and water vapor profiles, along with low resolution liquid profiles. According to Radiometrics Corporation, headquartered in Boulder, Colorado, radiometers detect temperature, water vapor, and liquid in the atmosphere from the ground to an altitude of about six miles above ground. Radiometers have a broad utility in assisting weather forecasters by detailing incoming weather systems before typical radars. Radiometers currently have the most advanced capabilities to detect super cooled liquid water with continuously updated data. Super cooled liquid water is the key to converting the liquid water content in a storm system into natural precipitation when AgI particles are added. 21

 Attachment 13 provides more detail on radiometers currently available for sale from Radiometrics Corporation of Boulder, Colorado.")
29 In addition to serving as an important tool for weather modification forecasting by guiding cloud seeding decisions, they are also able to provide warnings far in advance of severe weather. In a brief phone interview with Barry Lawrence, he stated that the utilization of radiometers in the 10 year WWMPP was a critical tool to provide high resolution realtime data for the project, and bottom line: we would not have been able to complete the WWMPP seeding operations efficiently without this new equipment and technology. Figure 7. Radiometrics Radiometer (Courtesy Radiometrics) Attachment 13 provides more detail on radiometers currently available for sale from Radiometrics Corporation of Boulder, Colorado. A radiometer and necessary related equipment currently sells for around $180,000, however volume discounts on the purchase of multiple units may be available. CWCB Radiometer. In 2014, the CWCB leased to own a radiometer from Radiometrics, funded by the Department of Natural Resources through CWCB and the Lower Colorado River Basin States. The CWCB radiometer was deployed in the target area of the CCMRB Program in the winter of (Figure 8). The radiometer was useful in providing meteorological data for specific winter storms meeting certain criteria that passed through the Target Area to help assist Program contractors in distinguishing trends likely indicating that the seeding plumes from the ground based generators were covering the Target Area and a seeding effect was occurring (WWC, 2015). Figure 8. CWCB Radiometer Installed in CCMRB Program Target Area for Winter Season (Courtesy CWCB) 22

30 Review and evaluation of real time radiometer data allows cloud seeding operators to characterize proper storm conditions in order to assist with seed/no seed decisions. Judicious use of radiometers will help make programs more efficient and more cost effective, and may even lead to program sponsor rebates. After the winter season, the radiometer was moved to the Rio Grande Basin for the 2015 irrigation season to assist local water providers with obtaining valuable weather data. The CWCB next plans to move the leased radiometer to a location within the Target Area of the UGRB Program in the fall of 2015 for the duration of the winter season. Weather Stations. The benefit of including weather stations in cloud seeding programs is to provide important meteorological data to assist with seed/no seed decisions (Figure 9). Though the array of instrumentation can vary, weather stations typically include: air temperature, relative humidity, icing, solar radiation, barometric pressure, wind speed (average and gusts), wind direction, and precipitation. A number of technological advances have resulted in improved instrumentation, particularly for snow water equivalent (SWE) sensors (non contact electromagnetic), snow depth sensors (optoelectronic), freezing rain sensors, and icing meters. Depending on the type of instrumentation selected for a weather station, costs can vary greatly. DRI has provided several cost estimates for the purchase of weather stations and/or sensor packages outlined in Attachment 12. Figure 9. DRI Weather Station (Courtesy DRI) Icing Meters. Icing meters are particularly helpful in assisting with seed/no seed decisions by detecting super cooled liquid water. The GM Program currently has a weather station with an icing meter located at Whitewater Creek on the Grand Mesa. The Whitewater Creek Weather Station (Grand Mesa) is available on the internet ( Key features of this specialized location include providing continuously updated data, an archive of all the data, and data graphing capabilities. An icing meter was also installed in the fall of 2014 in the UGRB Program Target Area to assist with seed/no seed decisions. As outlined in Attachment 7, planned future enhancements potentially include the installation of additional icing meters at different locations within the UGRB Program Target Area. 23
31 Precipitation Gauges. High intensity precipitation gauges are also particularly helpful for weather modification programs when used at key locations within the Target Area to more accurately measure precipitation and correlate observations with frequently used SNOTEL data sites. Precipitation gauges use a precision vibrating wire transducer to weigh and calculate the precipitation collected. Cost information is for gauges developed by DRI are provided in Attachment 12. Ceilometers. Similar to radiometers, ceilometers can be extremely useful to help determine appropriate meteorological conditions conducive to cloud seeding. These instruments measure cloud height and vertical visibility using lidar (light detecting and ranging) technology. Celiometers can be included in a weather station package. DRI has provided a cost estimate for a celiometer outlined in Attachment 12. More detailed information can be found on the Campbell Scientific, Inc. website ( 24
32 This page intended to be blank
33 4. SCIENTIFIC EVALUATION REQUIREMENTS AND OPPORTUNITIES Under the 2012 Colorado Weather Modification Rules and Regulations, specific scientific evaluations of permitted cloud seeding programs are required to analyze and document the seeding efficacy of the program. Further, several advancements in the field of winter orographic cloud seeding provides new opportunities to scientifically evaluate the effectiveness weather modification programs. A few examples of required and recommended scientific evaluations outlined in the new 2012 rules and regulations are briefly described below. 4.1 Required Annual Scientific Reports/Target and Control Evaluations Pursuant to Rule 13 of the 2012 Colorado Weather Modification Rules and Regulations: The permit holder must compile annual reports in accordance with section (3), C.R.S. (2011). Annual reporting for ground based winter operations shall include, at a minimum, target versus control analysis of precipitation or snow water equivalent. The permit holder must provide the Director with a written annual report that evaluates the weather modification operation within 90 days of concluding its operations season. Target/control evaluations are important to build scientific understanding and operate effective programs. These evaluations provide useful methods to quantify estimates of potential increases in precipitation or snow water equivalent, and over the long term, can assist with monitoring the success of operational cloud seeding programs. NAWC has strongly advocated for target/control evaluations of operational could seeding programs, and currently provides this analysis for all seven permitted programs in Colorado. 4.2 Recommended Periodic Weather Modification Scientific Evaluations Pursuant to Rule 19 of the 2012 Colorado Weather Modification Rules and Regulations: The Director desires to promote continuous research, development, and evaluation of permitted programs. Permit holders shall submit periodic evaluation proposals to the Project Sponsors. Periodic is defined as at least once during a five year permit or twice during a ten year permit. A periodic evaluation should be outside of the normal annual reporting methods. Evaluations that are peer reviewed and published in journals can count as independent evaluations. A few recommended examples of types of scientific studies are outlined below. Please reference Rule 19 in Attachment 2 for the full suite of approved scientific evaluations. Numerical Modeling. The ASCE standards and practices document for precipitation enhancement (Standard 42, 2004) state that plume dispersion modeling studies should be used to evaluate and site cloud seeding generators. Numerical and plume dispersion modeling provides a tool to help determine if seeding material is being transported to the target area of interest, and also helps provide direction on decisions regarding where to site new generators and/or relocate existing generators if warranted. Two examples of numerical modeling studies are provided. 25
34 CAIC Projects. In 2011, the Colorado Avalanche Information Center (CAIC) developed Weather Research and Forecasting numerical modeling (WRF) displays for the parameters useful for cloud seeding forecasting. These CAIC forecast points provide contractors and program sponsors a forecast of cloud water, cloud temperature, precipitation totals, and duration data to help with seed/no seed decisions. In 2015, the CWCB funded a project working with the CAIC to create 88 new model soundings or computer simulated weather balloon launches. This will result in an important new tool to help observe atmospheric conditions including inversions, saturated atmosphere, wind direction, etc. These new sounding forecasts will complement existing data from radiometers and weather balloon launches by the NWS. The 2015 project builds off the 2011 project, with both projects taking advantage of weather modeling and providing forecasting displays specific to cloud seeding. The new products can be found on the CAIC website: ( forecasts/). In order to access the forecasting data, navigate to Forecasts/Weather/Point forecasts and view the two columns on far right for the specific zone of interest. NCAR Phase 1 Seeding Effectiveness Study for the CCMRB Program. According to the NCAR, with headquarters in Boulder, Colorado, the first step in evaluating the effectiveness of an operational cloud seeding program is to determine when seedable conditions exist, and another important step is to assess the likelihood that seeding plumes are reaching seedable conditions and affecting snowfall in the areas of interest (i.e., target areas) (NCAR, April 2015). In order to help further the science of cloud seeding in Colorado, the Front Range Water Council and the CWCB funded a small scale modeling effort in 2014 to evaluate the seeding effectiveness of the CCMRB Program s ground based generators in storm conditions most common or optimal for seeding throughout the Target Area. The first task of the NCAR Phase 1 study was to develop a climatology of seeding conditions in the CCMRB Program Target Area to assess a number of seeding criteria or conditions for comparison (such as opportunities for seeding with northwest winds versus southwest winds or at different temperature ranges) (NCAR, 2015). The second major task was to complete high resolution NCAR Weather Research and Forecasting numerical modeling (NCAR WRF) to better capture fine scale topography and flow fields for assessing seeding generator effectiveness (NCAR 2015). The NCAR WRF model helps design, guide, and evaluate cloud seeding efforts to enhance snowpack in mountainous terrain (Breed et al., 2013; Xue et al., 2013a and 2013b). Due to study constraints, a community trajectory model called HYSPLIT, a transport and diffusion modeling tool, was used with the WRF output (NCAR 2015). According to NCAR, the HYSPLIT model was utilized in the study to investigate plume behavior for ten seeding generators close to Winter Park, not all of which were used in the modeled seeding event. Thus, the model based climatology identified seeding potential (i.e. hot spots ) for one quadrant of wind direction, consistent with seeding the Winter Park ski area. The results of the NCAR Phase 1 study provide a proof of concept in how to further evaluate the effectiveness of a cloud seeding program. Due to scope and budget limitations the modeling effort was 26
35 limited to simulating one storm period targeting only the Winter Park ski area. While the model results tend to support the need for more remote controlled generators to maximize effective operations, the evaluation of additional test cases (i.e. model simulations) is needed to further validate the model results (NCAR 2015). The full report is provided in Attachment 4B. The CCMRB Program Sponsors will next consider helping fund a Phase 2 high resolution modeling and plume dispersal study that builds off results from the NCAR Phase 1 Study and helps to identify sites for new remote generators. Trace Chemistry Analysis in Snowpack. Trace chemistry analyses are used to detect AgI in snowpack through site specific studies. One example of this type of analysis was funded by the Winter Park Ski Area and the CWCB in the winter of The study was conducted by DRI and included only one snow sampling event. Results indicated that AgI was found around mid mountain in the snowpack at Winter Park. There are two high elevation remotes on a ridge 5 7 miles upwind of the predominant storm track for Winter Park. According to Joe Busto (CWCB),.anyone reviewing storm snow totals over the last five years has noticed that the Winter Park Ski Area ranks high in totals per storm and this could be random chance or may be due to these new high elevation remotes. This data is reported on the CAIC website as 24 hour storm totals by region, providing a helpful tracking tool for project sponsors. Randomized Experiments. Randomized experiments fall under Rule 19 (8) as other types of evaluations that can be performed: Analysis of precipitation from existing projects that employ a randomized design in their seeding operations. The Wyoming Weather Modification Pilot Project (WWMPP) is an excellent example of a randomized experiment evaluation. As described in Attachment 14, the Wyoming Water Development Commission funded the 10 year study as a research project to determine whether seeding in Wyoming is a viable technology to augment existing water supplies, and if so, by how much, and at what cost. The WWMPP established three orographic cloud seeding research programs in Wyoming mountain ranges considered to have significant seeding potential including (1) the Medicine Bow, (2) the Sierra Madre, and (3) the Wind River Ranges. NCAR and Weather Modification, Inc. (WMI) were the selected contractors to complete the WWMPP study. Additional contributors to the WWMPP are outlined in Attachment 14. As outlined in Attachment 14, the evaluation of the WWMPP was based on two analyses: (1) a statistical experiment to collect a randomized set of seeded and unseeded cases, and (2) exploratory observations to investigate the different physical processes in cloud seeding to show that the seeding hypothesis is physically based. The results of the WWMPP study include an overview of the cost effectiveness of cloud seeding, streamflow impacts, and potential next steps (Attachment 14). The preliminary statistical results of the 10 year WWMPP imply a 3% increase in precipitation with a 28% probability that the result occurred by chance (NCAR 2014). It is important to qualify that these preliminary results are based on specific seeded events and not overall seasonal increases. However, NCAR states that when the preliminary results are combined from the physical, modeling, and statistical studies completed, this led to an accumulation of evidence from the statistical, modeling, and physical analysis which suggest a positive seeding effect on the order of 5 to 15%. A phone interview with Barry Lawrence noted an important 27
36 qualification of the preliminary results: only approximately 30% of the winter storms over the Medicine Bow and Sierra Madre Ranges had the necessary seedable conditions. Thus, the preliminary results indicating a 5 15% increase in seedable storms is based on post stratification of the data from the confirmatory experiment and also modeling. To determine increases in snowmelt driven streamflow for the season, daily percent increases in precipitation were determined by applying the range of possible seeding percent increase scenarios. The percent increases in precipitation were then applied to daily precipitation data for use in a hydrologic model which determined increases in snowmelt driven streamflow. These results were then aggregated to the seedable area in the basin to determine streamflow increases within the basin. SNODAS Modeling Evaluations. These modeling evaluations provide an opportunity to utilize the National Weather Service s Snow Data Assimilation System (SNODAS), which consists of a spatiallydistributed energy and mass balance snow model updated with available snow water equivalent (SWE) and related snow data (snow depth, snow cover) (Hunter, 2006), in order to estimate or quantify the potential water yield from cloud seeding programs. Such an evaluation was completed by Steven M. Hunter, sponsored by a grant from the CWCB, and published in the Journal of Weather Modification in April 2006 (Attachment 15). Hunter estimated the water augmentation potential from all Colorado River Basin cloud seeding programs (at the time of the study) in dry, average and wet years. While several uncertainties were acknowledged in the methodology to calculate the water yield potential, Hunter estimated that in an average precipitation year about one million acre feet of additional snowpack water could be produced by cloud seeding. Estimates for wet years were more than one million acre feet (but the potential water yield could be limited by seeding suspension criteria), and about 500,000 acre feet in a dry year. This analysis included existing operational programs and considered other potential target areas that could be developed Updated SNODAS modeling evaluations may be warranted since additional cloud seeding programs have been implemented after the Hunter 2006 study was completed. Further, any potential SNODAS model updates that have been completed to date may help refine or confirm Hunter s previous water yield results. 28
37 5. FUNDING OPPORTUNITIES Weather modification programs in Colorado are typically funded from a number of different sources, including Program Sponsors, the State of Colorado, and entities from the Lower Basin States of the Colorado River Basin. As described below, existing funding and new opportunities are critical to assist with the enhancement, growth, and future development of existing cloud seeding programs in the State of Colorado. Program partnerships may also be increasingly beneficial to provide economies of scale in equipment purchasing and operations. In addition, other funding opportunities beyond those identified here may also be available. 5.1 Program Sponsors The cloud seeding Program Sponsors in the state of Colorado are critical funding sources for all existing programs. While the CWCB annually contributes as a coalition about 35% of the state wide funds to each program, local Program Sponsors are responsible for providing the majority of the funding needed to support the programs. As detailed in attachments 4 through 10, Program Sponsors include a diverse collection of water districts, providers, counties, cities, towns, and ski resorts. As identified by this report, most programs seek to enhance and upgrade existing operations with modern technology and enhanced scientific evaluations. Additional funds from Program Sponsors and other sources will be necessary to further develop and enact the preliminary prioritized list of technological upgrades and scientific studies specific to each program, as detailed in Section 6. Program Sponsors may wish to evaluate their current contributions with the Program Manager(s) and accordingly, identify a strategic plan for funding identified future program enhancements. 5.2 CWCB Cost Share Grants In addition to serving as the regulatory and permitting entity, the CWCB has provided grant funds to Colorado s weather modification programs since 2004 to assist with the growth and development of these programs. Cost share grant funding has primarily come directly from the State and Regional sources, though grant funding from the CWCB s Water Supply Reserve Account (WSRA) Program has been used more recently and could potentially serve as a source for future program enhancements. CWCB Weather Modification Program. Cost share grant funding is available from two primary state sources including (1) the CWCB Weather Modification Appropriation Funds and (2) the State s Watershed and Flood Section Severance Tax Allocation. In the past, the allocation of grant funding to each of the seven permitted cloud seeding programs has been based primarily on program need. In the future, funding will likely be allocated to strategically advance CWCB priorities for continued growth and development for these programs. The CWCB Weather Modification Program Coordinator (Joe Busto) also has the discretion to utilize available funding to purchase cloud seeding equipment for the State, which can then be leased and/or 29
38 rented by program managers for deployment during an operational winter season. In addition, the CWCB Coordinator may provide funding assistance for periodic independent scientific evaluations of the programs. As outlined in Attachment 1, the CWCB is currently seeking to target funding towards ongoing periodic evaluations and the strategic replacement of select manual seeding generators with high elevation remote generators to improve seeding effectiveness. CWCB Water Supply Reserve Account. The WSRA was established in conjunction with the creation of the Interbasin Compact Committee and basin roundtables to provide additional funding for critical water projects in Colorado. The program is split into nine separate basin accounts (one for each of the local roundtables in all of Colorado s major river basins and the Denver metro area) and one larger statewide account. Funding from either account requires approval from the local basin roundtable prior to being officially considered by the CWCB. The larger statewide account is much more competitive, including additional requirements (e.g. sponsor eligibility, project criteria, matching funds, etc.) and official approval by the CWCB. Applications for funding from a basin account are typically less than $100,000, while applications to the statewide account can be much larger. Competition for funding from both accounts has become increasingly competitive as water needs in the state grow. The first use of WSRA funds for a weather modification program was approved at the July 2015 CWCB Board meeting when the Water Enhancement Authority (WEA) received funding from the Colorado and Gunnison Basin Roundtables to assist with the purchase of two remote generators for the GM Program. As outlined in Section 2.3, the new IPC generators were deployed on September 15 and 16, Federal and Research Grant Sources. Although there is currently no Federal cloud seeding research and development program it is conceivable that this will change. There was a Federal research program in the early 2000s called the Weather Damage Mitigation Program that was operated for three years by Reclamation in Lakewood, Colorado. Further, a five year pilot program ( ) was funded by Reclamation authorities to cloud seed in Nevada. In addition, recent funding from The National Science Foundation assisted an effort to use the University of Wyoming s research aircraft to map seeding plumes to assist and leverage the efforts of the Wyoming Research Program. Reclamation is currently developing a policy in Washington D.C. on Reclamation s involvement in cloud seeding. For more information on the ongoing policy development, please contact Joe Busto (CWCB). 5.3 Lower Colorado River Basin Entities Through a base agreement with annual amendments, the three Lower Colorado River Basin entities (Lower Basin) and the New Mexico Interstate Stream Commission (NMISC) have provided supplemental regional funding to the CWCB for Colorado weather modification programs since The CWCB then distributes these supplemental funds to local project sponsors. The following Colorado River Water users are the Lower Basin funders: Southern Nevada Water Authority Central Arizona Water Conservation District Six Agency Committee (of California) 30
39 Typically, the Lower Basin entities provide funding leveraged with the appropriated CWCB funding in any given year for locally sponsored Colorado programs. The NMISC allocates small amounts of funding towards the programs in the Southern San Juan Mountains. However, there are some restrictions on funding from the Lower Basin. Provisions from the base agreement and annual amendments between the Lower Basin and the CWCB apply to both the CWCB and the permitted program entities in Colorado, with the CWCB and local entities making all operational decisions. The Lower Basin entities need to be named as an additional insured for any program that they fund, and various documentation must be provided annually. Accordingly, Lower Basin funding cannot be used for administrative fees or costs, and are provided solely for seeding operations, meteorological instrumentation, and/or scientific evaluations. Another requirement is that the CWCB and local sponsors must maintain their historic funding levels. Regional funding for this work is a collaborative, group effort and no single party may claim any water generated through winter time cloud seeding it becomes Colorado River system water. The amounts of funding and activities are based on an annual negotiation between the CWCB and Lower Basin entities. Proposals and ideas for funding should be channeled through the CWCB. 31
40 This page intended to be blank
41 6. FUTURE PROGRAM ENHANCEMENT GOALS As detailed in Section 2 and Attachments 4 through 10, each of the weather modification programs in Colorado is seeking to strategically enhance seeding operations, equipment, and engage in ongoing scientific evaluations of the seeding efficacy of the programs. This report and its related outreach efforts provide an initial opportunity to document desired program enhancements. Table 1 below summarizes a current snapshot of potential program enhancements sought by each of the programs. This preliminary list was developed in close coordination with each of the program managers and contractors. The list of actual program enhancements will continue to be refined pursuant to strategic planning, technological advancements, and available funding for each of the programs. This information will continue to be refined with input from program managers and sponsors as strategic plans evolve. Additional information on currently available equipment can be found in Section 3 and related attachments. Table 1. Preliminary List of Desired Future Program Enhancements Program Manual Generators Remote Generators Radiometer Weather Station Equipment Scientific Evaluations Liquid Propane Generators Central Colorado Mountains River Basin Program Vail/Beaver Creek Program* Use only if carefully reviewed and approved Use only if carefully reviewed and approved Yes Yes Yes Yes Yes, if feasible Yes Yes Yes Yes Yes, if feasible Grand Mesa Program No Yes Yes Yes Yes Yes Upper Gunnison River Basin Program Western San Juan Mountains Program Eastern San Juan Mountains Program West Dolores and Telluride Resort Ski Area Program Yes Yes Yes Yes Yes No Use only if carefully reviewed and approved Use only if carefully reviewed and approved Use only if carefully reviewed and approved Yes Yes Yes Yes Evaluate benefits Yes Yes Yes Yes N/A Yes Yes Yes Yes Evaluate benefits *WWC recommendations of future program enhancements for Vail/Beaver Creek Program consideration 32
42 This page intended to be blank
43 7. RECOMMENDATIONS As the first comprehensive inventory and assessment of weather modification programs in Colorado, this report serves as an initial foundation to strategically guide the future development and operation of cloud seeding programs in the state. While each program has unique components and issues, they share many of the same challenges and opportunities. Given the current environment of technological advancements, developments in research and scientific evaluations, funding opportunities, and potential large scale collaborative partnerships, the time is ripe to pursue the growth and enhancement of weather modification programs in the state. The recommendations of this report build on recent recommendations from Reclamation regarding the growth and development of cloud seeding programs in the western United States. Reclamation recently identified weather modification as one potential tool, in a portfolio of several other resources, to help increase water supply within the Colorado River Basin (Reclamation 2012). Reclamation recognizes that weather modification programs have been in effect for decades throughout the West, whether for winter or summer precipitation augmentation. Further, Reclamation acknowledges that due to the stable state of cloud seeding programs already in existence, cloud seeding is a highly ranked tool due to its operational flexibility (i.e. no additional time necessary for feasibility or permitting of smaller scale projects) and economic benefits when compared to other water supply options. Of greater significance on a basin wide scale, Reclamation opines: For the weather modification group of options, it is estimated that cloud seeding six major runoff producing areas could produce between 1.1 and 1.8 mafy in the Upper Basin and an additional 830,000 kafy in the Lower and adjacent basins. Of the total, it has been estimated that approximately 1.7 mafy would be available to reduce deficits or meet new demands. While Reclamation also points out that there may be some uncertainty and implementation risk related to the long term viability of weather modification programs, they note that there could be substantial regional opportunities and support for continued sustainable economic growth and development of well designed, effective weather modification programs in the West on an increased magnitude of scale. Based on observations during the course of this inventory and assessment, including extensive coordination and correspondence with the CWCB, program managers, sponsors, contractors, researchers, and vendors, the following recommendations are provided. Recommendations for the Strategic Enhancement of Colorado s Weather Modification Programs: Modernize Equipment Encourage the enhancement of all Colorado weather modification programs through the acquisition and operation of modern cloud seeding generators and meteorological instrumentation. Improved Scientific Evaluations Guide the development and use of improved scientific evaluations per the new 2012 weather modification rules and regulations. Continue to support 33
44 research that expands the understanding of cloud seeding science and promotes effective weather modification policies. Partnerships Continue to foster diverse and collaborative program sponsorship, while exploring and developing expanded regional and statewide partnerships. Develop additional new project sponsors to increase local funding and increased program support. For example, the Wyoming Water Development Office is seeking new funding partners for the next round of Wyoming s cloud seeding feasibility studies and may be interested in collaborative weather modification programs with large Colorado Basin wide watershed partners. After completion of the WWMPP, the Wyoming legislature allocated $1.4 million to fund final design and permitting for an operational program in the Medicine Bow/Sierra Madre Ranges (site of the randomized program), and new weather modification feasibility studies in the Big Horn and Laramie Ranges. Language from the recently passed legislation mandates that prior to commencing project operations, the Wyoming Water Development Office shall seek funding commitments from other water users that may benefit from the program. Communication Improve communication between programs to maximize efficiencies, learn from operational experiences, and build understanding of program benefits and successes. Funding Pursue new funding sources and build on the critical base of funding provided by project sponsors. Leverage partnerships with increased regional and statewide collaboration to benefit from economies of scale. Continue to leverage all available funding on a local, state and regional basis. Database Develop a comprehensive and publically available statewide database of program documentation including such things as weather modification permits, annual reports, target and control evaluations, maps, etc. Currently, CWCB hosts a Laserfiche Weblink application to access weather modification documents and reports, however the access and utility could be significantly upgraded for ease of use. Expand Reach Explore opportunities for potential new programs and/or target areas through feasibility studies. Potential new areas for winter time snowpack augmentation programs could include the Battlement Mesa, the Flat Tops Wilderness, the Uncompahgre River Basin, the Rio Grande Basin, and an expanded Target Area for the Arkansas Basin. Investigate opportunities to implement cloud seeding operations in the permitted Target Areas 1 and 3 of the CCMRB Program. Potential new Target Areas for summer time precipitation augmentation programs include the South Platte Basin. 34
45 8. LIST OF REFERENCES American Society of Civil Engineers. ASCE/EWRI Standard 42 Standard Practice for the Design and Operation of Precipitation Enhancement Projects Breed, Daniel, Duncan Axisa, Changhai Liu, and Xinyuan Feng., National Center for Atmospheric Research. An Evaluation of Seeding Effectiveness in the Central Colorado Mountains River Basin Program. February 4, Colorado Water Conservation Board. Colorado Cloud Seeding Frequently Asked Questions. May Griffith, Don, and Solak, Mark. The Potential Use of Winter Cloud Seeding Programs to Augment the Flow of the Colorado River: Prepared for the Upper Colorado River Commission. March Huggins, A.W., Journal of Weather Modification. Summary of studies that document the effectiveness of cloud seeding for snowfall augmentation 41, Hunter, Stephen M., Journal of Weather Modification. Potential Water Augmentation From Cloud Seeding In The Colorado River Basin. April National Center for Atmospheric Research. Wyoming Weather Modification Pilot Program Level II Study. December North American Weather Modification Council. Understanding Cold Season Cloud Seeding (brochure) Reynolds, David W., Cooperative Institute for Research in Environmental Sciences. Literature Review and Scientific Synthesis on the Efficacy of Winter Orographic Cloud Seeding: A Report to the U.S. Bureau of Reclamation. January Super, Arlin B., and Heimbach, James A. Jr. Feasibility of Snowpack Enhancement from Colorado Winter Mountain Clouds: Emphasis on Supercooled Liquid Water and Seeding with Silver Iodide and Propane. September 30, U.S. Bureau of Reclamation. Colorado River Basin Water Supply and Demand Study. December Western Weather Consultants, LLC. Final Cloud Seeding Summary Report 2015, Central Colorado Mountains River Basins Weather Modification Program. July Weather Modification Association. Weather Modification Association Position Statement on the Environmental Impact of Using Silver Iodide as a Cloud Seeding Agent. July
46 Weather Modification Association. Weather Modification Association Capabilities Statement on Weather Modification. September Personal Communications (2015) As outlined in the Acknowledgements section, this report was prepared with significant input and assistance from a diverse group of experts in the field of weather modification. We want to thank the following individuals for coordinating with us several times over the course of this inventory and assessment, providing invaluable information and feedback on weather modification programs in Colorado. Busto, Joe. Colorado Water Conservation Board (staff). Connell, Slade. Weather Enhancement Authority City of Grand Junction. Curtis, Ken. Dolores Water Conservancy District. Dean, Jeff. Desert Research Institute. Hjermstad, Alisa. Western Weather Consultants, LLC. Hjermstad, Eric. Western Weather Consultants, LLC. Hjermstad, Mike. Western Weather Consultants, LLC. Hjermstad, Larry. Western Weather Consultants, LLC. Howe, Elizabeth (via WWC). Vail Resorts, Inc. Griffith, Don. North American Weather Consultants Inc. Kugel, Frank. Upper Gunnison River Water Conservancy District. Lawrence, Barry. Wyoming Water Development Office. McDonough, Frank. Desert Research Institute. Montgomery, April. Colorado Water Conservation Board (board member). Nelson, Marta. Radiometrics Corporation. Patton, Dave. Radiometrics Corporation. Pitchford, Marc. Desert Research Institute. Ritterbush, Mark. Weather Enhancement Authority City of Grand Junction. Ryan, Tom. Metropolitan Water District of Southern California on behalf of the Lower Colorado River Basin entities. Skeie, Erik. Colorado Water Conservation Board (staff). Star, Pam. San Juan Resource Conservation and Development Council. Thompson, John. Chief Meteorologist; Weather Enhancement Authority City of Grand Junction. Whitehead, Bruce. Southwestern Water Conservation District. Parkinson, Sean (via Joe Busto). Idaho Power Company. 36
47 ATTACHMENT 1 COLORADO WATER CONSERVATION BOARD COLORADO CLOUD SEEDING FREQUENTLY ASKED QUESTIONS May 2014
48 This page intended to be blank

49 Colorado Water Conservation Board Colorado Cloud Seeding Frequently Asked Questions May 2014 What is Cloud Seeding? Silver Iodide (AgI) has water vapor bonding and attracting properties. It is sprayed across a flame from a ground based unit to release particles into the atmosphere. The AgI particles ride along in wind up into storms and nucleate with water vapor to make ice crystals that grow into snowflakes and fall out in the target area. How many states cloud seed? There are nine western states with programs. California, Idaho, Utah, Colorado, Wyoming, and Nevada have wintertime ground based cloud seeding programs. Kansas, North Dakota, and Texas have summer programs with aircraft to rain seed and also sometimes suppress hail under the right conditions. How many programs are in Colorado? There are seven permitted program in Colorado. The oldest program is Vail Ski area at 42 years. The Central Mountains program is supported by eight water suppliers and four ski areas that recently engulfed the Vail target area. This relatively new program is attributed to local water agencies and ski areas leveraging ongoing funding from the Lower Basin States and Colorado Water Conservation Board (CWCB). The Grand Mesa and the Gunnison Basin have cloud seeding programs. Telluride and the Dolores Water Conservancy District also share a program. The western half of the southern San Juan Mountains and the eastern half of the San Juan Mountains is a program. Orange triangles are the ground based ice nuclei generators in Colorado, and colored shapes are the target areas. How many generators are there in Colorado? There are currently an estimated 107 generators in operation in Colorado during the winter cloud seeding season, typically operating November through March or April. How many agencies participate in cloud seeding in Colorado? There are over forty entities from towns, counties, water districts, and ski areas that participate in local cloud seeding programs. How much money is spent on cloud seeding in Colorado? It has been relatively stable for the last five years at $1M/year. Of this amount, 65% is from local sources, 18% is from the CWCB and 17% is from the Lower Basin State donations. Page 1 of 6
50 Colorado Water Conservation Board Colorado Cloud Seeding Frequently Asked Questions May 2014 What are Colorado s New Weather Modification Rules? On behalf of the Executive Director s Office of the Department of Natural Resources (DNR), the CWCB updated the 1987 Colorado Weather Modification Rules and Regulations in This program has been delegated to the CWCB since Feedback from local sponsors was that they wanted help in evaluating and refining their programs. Annual target/control evaluations are now required to track snow totals and suggested evaluation methods are provided in the new rules. How effective is cloud seeding? Policy statements by the World Meteorological Association state that well designed and executed programs will have demonstrable results. Contractor annual reports typically estimate a magnitude of increase from well designed and properly conducted programs to range from 5 15% over mountainous terrain. For a general reference, Desert Research Institute (DRI) published a number of 0.05 millimeters per hour for 32 seeding events to estimate 16 inches, of the approximate 200 inches total, or 8% of the snowpack at Winter Park that was gained from cloud seeding last year using remote generators. CWCB tracks 24 hour snow totals as reported at several ski areas in this region. Generally, the snow has been very good at Winter Park ski area, and the Lower Basin States and CWCB helped develop this new program. Generators at an elevation of 9,560 feet on US Forest Service land, and on private property at an elevation of 8,900 feet north and northwest of the ski area, have been helpful for a more targeted approach since that is where significant storms systems track through the area. What is new in cloud seeding? Despite no current federal research and development program in the U.S., the field is making progress. The last federal program was the U.S. Bureau of Reclamation (USBR) Weather Damage Modification Program that ended in Much of the early work on weather modification by/for the USBR (166 reports from the USBR archives) were scanned by CWCB in 2008 and are available online through the CWCB website. A number of the previous experiments in the Rocky Mountains showed positive results. The most Snapshot of a model simulation over the Wind River Range of clouds and seeding plumes on 20 Feb View is from the south; the Green River drainage is on the left edge of the graphic. recent research experiment is the on going Wyoming Weather Modification Pilot Project. Results from that experiment should be available in early While the randomized seeding design should be able to quantify seeding effects, just as important are the new tools, models, and methods developed from Wyoming s project that can be applied to other areas. A snapshot example of modeling a storm and seeding event in the Wind River Range is demonstrated in the graphic. Page 2 of 6
 in Boulder to do an evaluation of the effectiveness of the Central Mountains cloud seeding program.")
 for a number of Colorado River Headwaters studies, including current water resource management, effects of land use changes and climate change scenarios.")
51 Colorado Water Conservation Board Colorado Cloud Seeding Frequently Asked Questions May 2014 NCAR Climatology & Modeling Study CWCB and the Front Range Water Council hired the National Center for Atmospheric Research (NCAR) in Boulder to do an evaluation of the effectiveness of the Central Mountains cloud seeding program. The study is using an 8 year climatology from a numerical model analyses developed by Ikeda et al (Atmos. Res., 2010) for a number of Colorado River Headwaters studies, including current water resource management, effects of land use changes and climate change scenarios. The model analyses have undergone extensive validation and are model analyses topographic map for (a) entire domain and (b) subset covering the Colorado Rockies. well suited for analyzing cloud seeding potential. While the evaluation study is still ongoing, early results using specific criteria (temperature, stability, winds) have shown some interesting spatial variability in seeding potential, i.e. hotspots. High resolution modeling of specific storms are planned to show how seeding plumes affect the hotspot climatology. Such studies can provide meaningful evaluations for planning and efficient execution of programs, and continuation of this methodology to evaluate other areas in Colorado is recommended. What is the vision for Colorado s programs? We are grateful to the Lower Basin States for the matching funds to assist in the growth and development of Colorado cloud seeding programs. CWCB would like to continue periodic evaluations for confidence. CWCB wants to replace some manual operated equipment with remote operated equipment at higher elevation generators for greater seeding effectiveness. DRI, City of Grand Junction, Ute Water Conservancy District, and CWCB deployed a remote cloud seeder in 2012 for the Grand Mesa program. Local involvement and ownership could help keep costs down and reduce reliance on contractors. Page 3 of 6


52 Colorado Water Conservation Board Colorado Cloud Seeding Frequently Asked Questions May 2014 How do Radiometers help cloud seeding? A radiometer is a small, powerful mobile instrument similar to radar that monitors atmospheric information, and helps build vertical profiles of useful information. It is very useful for cloud seeding. Radiometers see liquid water well, and radars do not, and they give the same temperature and humidity as weather balloons plus liquid water content with data that is updated continuously. The Idaho Power Seeding Program has six radiometers to help guide seed/no seed decisions. The conceptual model of seeding is that there is a natural efficiency in clouds but there is also often excess liquid water not being converted into natural precipitation and that is when additional AgI particles should be added. Without radiometers, oftentimes the whole storm will be seeded or infer cloud conditions from models and ground instruments. The CWCB has rented one for the Gunnison Program spring 2013 season, and for the San Juan Mountains in spring Purchasing The arrow is pointing to liquid water at Monarch Pass. and deploying radiometers in seeding target areas is recommended. Left in a region over winter, storm climatology can be developed and inform how and where liquid water tracks through the region. This data helps us understand where mountain meets cloud and how to get at the liquid water in a region when it comes from several different directions. The instrument can then be moved to other regions after that data set is built and shared among programs. A high output generator may use up to $10,000 in seeding solutions a year. A calculation by a contractor was that running the generator one hour longer than needed all season long could waste $4,000 in seeding solution. Radiometers will give greater confidence in our programs and save money by guiding operations to only seed when it will be effective. Radiometers cost about $175,000 and it would be beneficial for the CWCB and Lower Basin States to investigate lease and lease to own options. HDR Snow Data Study 2013 Snowing sensor data was documented and analyzed every twenty minutes for eight winters at Copper Mountain, Sunlight Mountain, Wolf Creek Pass, Mount Werner, and Monarch Pass. The goal was to look at seeding criteria for liquid propane seeding and 0 degrees C and colder, and AgI seeding at 5 degrees C and colder while it was snowing. In general the data showed that there are opportunities for propane seeding early and late in winter. It also showed that AgI criteria to seed were mostly met in December, January, and February at several stations. Clearly development of both technologies would effectively open up the window Page 4 of 6

53 Colorado Water Conservation Board Colorado Cloud Seeding Frequently Asked Questions May 2014 for opportunities each winter. It is also the most appropriate for our ski area partners that seek early Thanksgiving and Christmas skier days. The results from this data study verify well with the preliminary results from the recent NCAR study. Propane seeding is not new but was documented by the USBR researchers in 2004 to create 8% more precipitation. Propane works at warmer temperatures than AgI. There are only a handful of these in the Upper Colorado River Basin. It is the tool for early winter for the 28 ski areas in Colorado where good Thanksgiving and Christmas skier days are the goal. The State seeks to partner, import and deploy more propane dispensers at ski areas. The Lower Basin States and CWCB are also interested in partnering in the exploration of new target areas like northwestern Colorado and the Uncompahgre Plateau. Are there safeguards in place? Yes. In Colorado the State and permit holders and sponsors get daily mapping and data from the Colorado Avalanche Information Center (CAIS) and the National Resource Conservation Society (NRCS) Snow Survey Program. Data utilized from CAIS and NRCS include avalanche hazard levels, high SNOTEL readings, and periods of active snow removal to help inform mitigation work as triggers to temporarily suspend programs. The State has required liability insurance by permit holders for all project sponsors. Does cloud seeding have any significant negative environmental impacts? There is no evidence that suggests cloud seeding creates any significant negative environmental impacts to the environment. It is often difficult to detect any silver accumulation above the background amounts naturally present in the environment. An ecotoxicology monitoring network was set up in Australia and recent published papers concluded that their network is capable of detecting negative impacts from silver but the concentrations are far below levels of environmental or health concerns. These research papers are published in the Weather Modification Journals. How much money have the Lower Basin States spent and why are they helping us? The Lower Basin States have funded Colorado programs in the amount of approximately $1.3M since The CWCB has matched this with about $1.3M in that time frame. There is also an agreement between the New Mexico Interstate Commission (NMISC) and the CWCB to provide funding for the Southern San Juan program that began in The concept of working collaboratively is that a rising tide helps float all boats. Water supply shortages in the Lower Basin States are not their issue alone, and we hope to increase Colorado s involvement with solutions to Colorado River Basin water supply shortages. Page 5 of 6
54 Colorado Water Conservation Board Colorado Cloud Seeding Frequently Asked Questions May 2014 Relevant to Winter time Cloud Seeding Quality observations needed for cloud seeding is common to other resource management. Colorado is reliant on 110 SNOTEL to forecast water supply for 8 watersheds in a 104,000 square mile area. In general old statistical relationships are breaking down and less reliant to the current water year. The value of water, competition, and complex management scenarios make the common 20% volumetric error less palatable. More detailed hydrologic accounting methods are needed. In winter the CWCB, NCAR, and NOAA National Severe Storms Lab (NSSL) will converge on the Upper Rio Grande and explore using mobile radar precipitation estimates as new forcing data for emerging distributed modeling frameworks. The goal is a more accurate April 1 water supply forecast for a key index stream gauge to the Compact. NOAA NSSL is the nation s leader in R&D and forecast products for the National Weather Service (NWS) River Basin Forecast Centers. The CWCB, NCAR and NOAA hope to build on what they have done with radar science in the warm season for cold season precipitation products, however it will be difficult. Other opportunities include bringing in the NASA JPL Aerial Snow Observatory to this project which is another form of gridded SWE estimates for model forcing. Working with NOAA NSSL on a back of the envelop analysis has shown that five new mountain radars would help cover about 80% of the snowpack areas in Colorado. Gap filling radars will be rented in the Rio Grande during summer 2014 for flash flood prediction near fire burn areas, and possibly in Durango for cloud seeding operations in winter The door has been cracked for this much needed observational tool in headwaters areas. Similarly, the CWCB funds the Colorado Center for Snow & Avalanche Studies Dust on Snow Program as it is also another quality data set available to monitor snowpack and become a data set to adjust volume and timing of runoff. The NRCS Snow Survey Program has scheduled discontinuance of 47 manually measured snowcourse sites in Colorado. As a coalition, we should seek to preserve this long term data set and convert them to automated SNOTEL sites as appropriate. Where can I get more information? The North American Weather Modification Council is comprised of the nine states and more information and reports about weather modification programs are available at: The CWCB is the cloud seeding permitting agency for the State of Colorado and the main administrator and funding entity for weather modification activities. For more information: (Home > Water Management > Water Projects & Programs) Created by Joe Busto, CWCB, ; ext 3209, joe.busto@state.co.us Page 6 of 6
55 ATTACHMENT 2 DEPARTMENT OF NATURAL RESOURCES COLORADO WEATHER MODIFICATION RULES AND REGULATIONS June 30, 2012
56 This page intended to be blank

57 DEPARTMENT OF NATURAL RESOURCES COLORADO WEATHER MODIFICATION RULES AND REGULATIONS June 30, 2012
58 RULES AND REGULATIONS FOR COLORADO WEATHER MODIFICATION DEPARTMENT OF NATURAL RESOURCES TABLE OF CONTENTS Rule Title Pages 1 Title 3 2 Authority 3 3 Purpose and Scope 3 4 Definitions 3 5 Application for a Permit Required Information and Proof 4-6 of Financial Responsibility 7 Publication of Legal Notice of 6 Intent 8 Evaluating Permit Applications 6 9 Hearing Required 6 10 Duration of Permits 6 11 Target area Notification 6 Required 12 Yearly Operational Plan 7 Required 13 Reports Weather Modification Activities 8 Subject to Applicable Permitting and Regulation 15 Modification of a Permit and 8 Best Management Practices 16 Compliance with American 8 Society of Civil Engineers Standards Practices 17 Suspension of Weather 8-9 Modification Operations 18 Suspension of Weather 9 Modification Activities by Emergency Managers 19 Weather Modification 9-10 Evaluations 20 Weather Modification Advisory 10 Committee 21 Procedure for granting Emergency Permits 22 Severability Effective Date 11 2
59 RULES AND REGULATIONS FOR COLORADO WEATHER MODIFICATION Rule 1. Rule 2. Rule 3. Title: The previous Colorado Weather Modification Rules and Regulations were adopted August 1, 1986, and are amended here under the same title (referred to herein collectively as the Rules or individually as Rule ). These Rules supersede the August 1, 1986 Rules. Authority: Section (1), C.R.S. (2011), empowers the Executive Director of the Department of Natural Resources ( Director ) to promulgate rules necessary to effectuate the purposes of the Weather Modification Act of 1972 (the Act ). Section (3)(a), C.R.S. requires the Director to ensure that the Rules are up to date and consistent with the Act. The Director may delegate to the Director of the Colorado Water Conservation Board, or another designee, the authority to administer the Act, to issue permits, and to regulate weather modification activities permitted pursuant to the Act pursuant to section (3)(b) C.R.S. (2011). Purpose and Scope: A. Purpose. The purpose of these Rules is to provide regulation of and standards for weather modification in Colorado in accordance with the legislative declaration provided by the Act, section , C.R.S. (2011), and pursuant to the legislative direction provided by section (3)(a). Rules for regulation of weather modification operations are of statewide concern to the state of Colorado and the Department of Natural Resources. The state of Colorado, through the Colorado General Assembly, recognizes the economic benefits that can be derived for the people of Colorado from weather modification, while minimizing possible adverse effects through implementation of proper safeguards and collection of accurate information. The Colorado General Assembly authorized the Director to issue permits applicable to weather modification operations pursuant to the Act, section (1), C.R.S. (2011). This direction is intended to ensure that weather modification operations implement proper safeguards and provide accurate information on operations. B. Scope. These Rules apply to all weather modification operations in the state of Colorado, including, but not limited to, those by individuals, corporations, local government agencies, regional government agencies, state government agencies, and federal government agencies. Rule 4. Rule 5. Definitions: These Rules adopt the defined terms provided by section , C.R.S. (2011) of the Act. Further terms are defined as provided herein. Application for a Permit: A. Application for Permit. An application for a weather modification permit must be submitted at least 45 days before the beginning date of proposed weather modification operation. 3
60 B. Requirements for Operator. The qualifications, education, and experience of any prospective Operator to engage in weather modification operations must be demonstrated to the Director pursuant to section (1)(g), C.R.S. (2011). An application for a permit must therefore include evidence of one of the following: (1) A minimum of four years of field experience in the management and control of weather modification operations or research; and (2) A degree in engineering, the physical sciences, or meteorology; or (3) Certification by the Weather Modification Association as a Certified Operator; or (4) Other training and relevant experience that the Director accepts as indicative of sufficient competence in the field of weather modification to engage in weather modification activities. At least one such Operator shall be available at all times and days during weather modification activities for immediate consultation by the Director. C. Modification, Suspension or Revocation of Permit. The Director may revise the terms of a permit if the operator is first given notice and opportunity for a hearing on the need for a revision and the Director determines the revision is necessary to protect the health or property of any person or to protect the environment. The Director may suspend or revoke a permit if it appears that the operator no longer has the qualification necessary for the issuance of the permit or has violated any provision of the Act after giving the operator notice and opportunity for a hearing pursuant to sections and , C.R.S. (2011). While the Director may only issue one active permit for activities in any geographic area if two or more projects may adversely interfere with each other, the Director may issue more than one permit for activities in any geographic area if one of the permits becomes inactive due to a project sponsor s termination of a contract with a permit holder and the cessation of weather modification operations. D. Permit Fee. A permit application or renewal must include the appropriate application or renewal fee designated by the Director pursuant to section , 114, C.R.S. (2011), as set forth in a policy discussed at a Board meeting and published on the Board website. The application fee is required of all applicants; including persons employed by commercial firms, government and non-profit agencies and should be sufficient to pay the direct costs of reviewing the permit application, holding public hearings and monitoring the Permitting Program. E. Commercial Fee. Applicants for commercial weather modification operations must also pay a Commercial Fee. The amount of this Commercial Fee is 2% of the yearly contract between the permit holder and the operation sponsors. If the permit holder and operation sponsor are the same, then the Commercial Fee is 2% of the operation s yearly budget. The Commercial Fee shall be paid at the beginning of each operational season, or may be prorated to be paid half at the beginning of the operational season and half at the end of the season at the discretion of the Director. The Commercial Fee compensates for permitting, regulatory compliance and environmental monitoring functions performed by 4
61 the Director or his or her designee. The Director may waive the Commercial Fee in extraordinary circumstances. Rule 6. Required Information and Proof of Financial Responsibility: A. Required Information. The weather modification permit application must include the following information: (1) A description of the objectives of the proposed weather modification operation; and (2) The specific time period for the operation; and (3) A written description and map identifying the specific target area and the area reasonably expected to be affected by the operation; and (4) A description of how the operation will be carried out, including, but not limited to, the location of the office, weather data used, aircraft types, seeding devices and material, seeding rates; and (5) How the proposed operation is designed to provide economic benefit to the target area (applicable to commercial operations only); and (6) How the proposed operation is reasonably expected to benefit both persons living in the target area and the people of Colorado; and (7) How the proposed operation is scientifically and technically feasible; and (8) How the proposed operation is designed for developing the knowledge and technology of weather modification (applicable to research and development operations only); and (9) The potential risks that the proposed operation could cause, such as harm to land, water, people, health, safety, property and the environment, and the adequate safeguards proposed for use by the operator to prevent harm; and (10) How other weather modification operations and research projects (if any) could be affected adversely by the proposed operation; and (11) Any significant expected negative ecological impacts that may result from the operation, such as how precipitation patterns could be altered, how increased runoff would affect erosion, and the environmental impacts of any chemicals utilized in the operation; and (12) Provide scientific literature and documentation that the proposed form of weather modification is viable and likely to produce the intended effect. B. Proof of Financial Responsibility. The application must also furnish proof of financial responsibility adequate to meet obligations reasonably likely to be attached to, or 5
62 result from, the proposed weather modification operation as required by section (c), C.R.S. (2011). Proof of financial responsibility may be shown by evidence of a liability policy of at least $1 million, or three times the value of the weather modification operation, whichever is greater, including proof that the insuring company is authorized to do business in Colorado, and a cancellation clause with a 30-day notice to the Director. Above these minimum requirements above, Applicants should consider maintaining liability insurance against the effects of weather modification operations, also called consequential loss insurance, which is not normally a part of ordinary liability insurance. Rule 7. Rule 8. Rule 9. Publication of Legal Notice of Intent: Applicants for a weather modification permit must publish a legal notice or notices of intent to modify weather in the counties to be affected by the weather modification operations, and/or any other newspapers required by the Director, including regional newspapers, pursuant to section (e), C.R.S. (2011) and in accordance with the timeline provided by section (7). The target area is defined as the area in which the operator desires to produce effects. Counties which may reasonably be expected to be affected by the operation include, at a minimum, those counties that are adjacent to the county (or counties) containing the target area. Applicants must use a form for legal notices approved by the Director. Affidavits provided by newspaper publishers, radio or television station managers, or sheriffs are sufficient proof of publication. Evaluating Permit Applications: The Director shall evaluate applications for compliance with the criteria provided by section , C.R.S. (2011). The decision made will be to grant, deny, or grant the permit with additional terms and conditions. Hearing Required: Hearing Prior to Permit Issuance or Renewal. A public hearing is required prior to issuance or renewal of a weather modification permit pursuant to section (e), C.R.S. (2011) and held in accordance with section (3)(b). The Director or his or her designee will record the hearing, and will consider public input, as well as all other information presented at the hearing to evaluate applications. Rule 10. Duration of Permits: Permits shall be granted for a maximum of one calendar year, except for ground-based winter cloud seeding, which may have a duration of five years, and may be renewed for five years or ten years, pursuant to section (1), C.R.S. (2011). Consistent with section (2), permits granted for one calendar year may be renewed on an annual basis for four additional calendar years without a public hearing providing the permitted weather modification operation has not materially changed and the permit holder has satisfied all record keeping and reporting requirements. Rule 11. Target Area Notifications Required: The permit holder must notify the local National Weather Service weather forecast office, Colorado Avalanche Information Center ( CAIC ), the County emergency managers, and the CSU Colorado Climate Center, unless otherwise requested by the Director prior to each season of weather modification operations. The permit holder must document notification in annual reports. 6
63 Rule 12. Yearly Operational Plan Required: The permit holder must submit an annual Operational Plan to the Director. The Operational Plan must include the following information: (1) A map depicting the target area and weather modification equipment locations; and (2) An unlocked spreadsheet including the latitude and longitudinal directions of each weather modification equipment location; and (3) Evidence of compliance with the notifications required by Rule 11; and (4) The Operator s current contact information; and (5) Declaration of the weather modification operational suspension criteria; and (6) Acknowledgement of the Director s suspension criteria to be followed during the year. Rule 13. Reports: The Director requires the permit holder to maintain and submit the following reports pursuant to section , C.R.S. (2011): A. Daily Log: The permit holder must maintain a current, daily log at the operation office which is available for inspection by the public. The daily log must include the date, time of each period of operations, rate of dispersion of seeding agent and total amount of seeding agent dispersed. The Director encourages automated logging of operations over manual logging of operations. B. Annual Reports: The permit holder must compile annual reports in accordance with section (3), C.R.S. (2011). Annual reporting for ground-based winter operations shall include, at a minimum, target versus control analysis of precipitation or snow water equivalent. The permit holder must provide the Director with a written annual report that evaluates the weather modification operation within 90 days of concluding its operations season. C. Additional Record-Keeping for Aircraft-Based Operations: In addition to the above record-keeping requirements, any person conducting a weather modification operation with an operational target area that includes any part of Colorado that employs aircraft must record and maintain the following information: (1) The date; and (2) Time period (in minutes); and (3) Rates of dispersion for seeding agent for each flight; and (4) Total amount of seeding agent dispensed; 7
64 (5) Description of each flight track logged in such a manner as to allow a complete and accurate reconstruction of the run and identified at the beginning and ending of each flight by radial and distance from a standard reference point, ground fixes in statute miles from a nearby town or landmark, or geostationary positioning system ( GPS ) location; and (6) Other information required by the Director. Rule 14. Weather Modification Activities Subject to Applicable Permitting and Regulation: Permit holders are subject to all applicable local, state, and federal permitting and regulation. Permit holders should be aware that all cloud seeding operations must be reported to the National Oceanic and Atmospheric Administration (Public Law ). Rule 15. Modification of a Permit and Best Management Practices: The Director may revise a weather modification permit in accordance with section , C.R.S. (2011), including the addition or a revision based on best management practices, operational criteria, or as otherwise necessary to protect the health or property of any person or to protect the environment. The permit holder may request a hearing regarding permit revisions pursuant to section (e), C.R.S. and held in accordance with section (3)(b). Rule 16. Compliance with American Society of Civil Engineers Standard Practices: The Director may require permit holders to comply with applicable American Society of Civil Engineers Standard Practices documents to design, operate, and evaluate weather modification operations. Rule 17. Suspension of Weather Modification Operations: A. Ground-Based Winter Cloud Seeding: The permit holder must suspend ground-based winter cloud seeding operations when the following conditions are in the target area: (1) Snow Water Equivalent Thresholds. Weather modification operations must be suspended at any time the snowpack water equivalents exceed the following: 175% of average on December 1st, 175% of average on January 1st, 160% of average on February 1st, 150% of average on March 1st and 140% of average on April 1 st. The Director or his or her designee will determine where and how snowpack water equivalents are to be measured, including at selected SNOTEL sites. The Director or his or her designee may permit weather modification operations to continue in a portion of the operation target area where snowpack water equivalents are below these suspension criteria percentages, if the operation will not impact the area where snowpack water equivalents are above these suspension criteria percentages. These thresholds are designed to keep the seeding effect to within the realm of natural variability of the local climate as measured at each SNOTEL station. (2) Avalanche Hazard Levels. Weather modification operations may be suspended by the Director due to high avalanche hazard levels, and must be suspended by the permit holder due to extreme avalanche hazard levels for highway corridors, as 8
65 determined by the Colorado Avalanche Information Center (CAIC). The CAIC works in coordination with the Department of Transportation and National Weather Service to determine avalanche hazard levels. The permit holder must monitor CAIC avalanche hazard levels, and coordinate with the Director and CAIC to determine whether suspension of operations is warranted by high avalanche hazard levels. (3) National Weather Service Hazardous Weather Statements. The permit holder must suspend all weather modification operations whenever one of the following is issued that impacts any part of the target area: a. An urban or small stream flood advisory; b. A blizzard warning; c. A flash flood warning; or d. A severe thunderstorm warning. Operations may resume after these statements expire. B. Aerial Summer Cloud Seeding: The permit holder must suspend aerial summer cloud seeding operations when the National Weather Service has issued a flash flood warning, storms are producing a funnel cloud or tornado, or the operational meteorologist observes any condition that warrants temporary suspension of the program. The permit holder must suspend winter aerial cloud seeding operations according to the suspension criteria of Rule 17.A. C. Other Weather Modification Operations: The Director may determine and implement suspension criteria for other types of weather modification operations, as necessary. For example, hail cannon weather modification operations must be confined to a small localized area directly over the target area, and limited to periods of heavy rain and hail tracking directly toward and over the target area. Rule 18. Suspension of Weather Modification Operations by Emergency Managers: Emergency managers may require the immediate temporary suspension of weather modification operations for any reason. Rule 19. Weather Modification Evaluations: The Director desires to promote continuous research, development, and evaluation of permitted programs. Permit holders shall submit periodic evaluation proposals to the Project Sponsors. Periodic is defined as at least once during a five-year permit or twice during a ten-year permit. A periodic evaluation should be outside of the normal annual reporting methods. Evaluations that are peer reviewed and published in journals can count as independent evaluations. The Director recommends the following list of data and types of studies for use in the evaluation. A. The following are examples of data for evaluations: 9
66 (1) Standard meteorological data from surface weather stations; (2) Radar and other remote sensing data, cloud physics data; (3) Streamflow data; (4) SNOTEL and snow course data; (5) Hail pad data, upper air data; (6) Upper air data; (7) Precipitation gauge; (8) Modeling simulations; (9) Trace chemistry data from snow sampling; or (10) Ice nucleus data. B. The following are examples of types of evaluations: (1) Predictive and/or diagnostic cloud modeling; (2) Modeling of transport and diffusion of seeding material; (3) Airflow, temperature, and liquid water measurements in the target area; (4) Trace chemistry analysis in snowpack to assess targeting; (5) Precipitation gauges comparisons; (6) Aircraft cloud microphysical studies; (7) Plume tracking of cloud seeding aerosols or tracers; (8) Analysis of precipitation from existing projects that employ a randomized design in their seeding operations; or (9) Other evaluations outlined in various published documents related to the conduct of weather modification projects. Rule 20. Weather Modification Advisory Committee. A. Formation of Weather Modification Advisory Committee: Pursuant to section , C.R.S. (2011) the Director may create a weather modification advisory committee. Members of this committee shall be appointed by the Director, and serve for a period of time as determined by the Director. B. Duties of the Weather Modification Advisory Committee: (1) Advise the Director on applications for weather modification permits; and (2) Advise and make recommendations concerning legislation, policies, administration, research, and other matters related to cloud seeding and weather modification activities to the Director; and (3) Other duties as determined by the Director. Rule 21. Procedure for granting emergency permits. Notwithstanding the foregoing, the Director may exempt weather modification operations from these requirements, and others, as provided by section , C.R.S. (2011), including for activities of an emergency nature for protection against fire, frost, hail, sleet, smog, fog, or drought. The procedure for issuing an emergency permit is as follows. 10
67 A. A permit may be granted on an emergency basis through the waiving of one or more of these rules when evidence is presented that clearly defines the situation as an emergency. B. Upon presentation of evidence satisfactory to the Director that an emergency condition exists or may reasonably be expected to exist in the very near future that may be alleviated or overcome by weather modification activities, the Director shall issue a permit for those activities. C. Within 10 days after the granting of an emergency permit, and if the permittee desires to continue the permitted weather modification activities, the permittee shall publish a legal notice of intent to modify weather as provided by Rule 7 herein. In addition to the requirements of Rule 7, the permittee shall describe the objectives of the emergency action, the success to date, and the future plans under the permit. The Director will evaluate whether to revoke the emergency permit, modify it, or permit its continued operations as soon as is practical after the public hearing on the weather modification activities. Rule 22. Severability: If any portion of these Rules is found to be invalid, the remaining portion of the Rules shall remain in force and in effect. Rule 23. Effective Date: June 30,
68 This page intended to be blank
69 ATTACHMENT 3 STATE OF COLORADO WEATHER MODIFICATION PERMITS
70 This page intended to be blank

71

72

73


74
75
76
77
78
79
80

81 State of Colorado Weather Modification Permit Permit No PERMIT HOLDER: PERMITTED PROJECT: John R. Thompson, Operational Meteorologist Grand Mesa Water Enhancement Authority 1405 Dover Road Montrose, CO Commercial seeding of winter storm clouds from cloud nuclei generators from November 1 through April 30 with up to 16 ground-based ice nuclei generators to augment mountain snowpack. This permit request is to operate a program to increase snowpack snow water equivalent to benefit natural habitat, agriculture, municipal water, stock growers, recreational interests, and the local economy. PERIOD OF PERMIT: Approval is hereby given for operations from the date of this permit through April 30, 2011, with conditional approval given for future years operations from November 1 through March 31 of through the same operational seasons for up to ten years through the operational year This permit is subject to the permit renewal requirements of section (2), C.R.S. (2010), and of the Colorado Weather Modification Rules and Regulations, 2 CCR This permit shall automatically terminate on April 30,
82
83
84
85
86


87

88

89


90
91
92
93
94
95
96
97
98
99
100
101
102
103


104

105

106


107
108 This page intended to be blank
109 ATTACHMENT 4A CENTRAL COLORADO MOUNTAINS RIVER BASIN PROGAM
110 This page intended to be blank
111 Central Colorado Mountains River Basin Operational Weather Modification Program Highlights 2015 Program Summary: Manager: Grand River Consulting Corporation (Key contact: Maria Pastore) Contractor: Western Weather Consultants, LLC. (WWC), with headquarters in Durango, Colorado, is the contractor for the operational seeding activities of the program, and holds the permit for the Program (Key contact: Larry Hjermstad) Sub Contractor: Desert Research Institute (DRI), with headquarters in Reno, Nevada, is the subcontractor for the operational seeding activities within a portion of the program target area, operating the two DRI remote generators near the Winter Park Ski Area, authorized under the permit held by WWC (Key contact: Frank McDonough) Target Area: The Upper Colorado River basin, generally above elevation 8,500 feet, in Pitkin, Eagle, Summit, Chaffee and Grand counties, with some exclusion areas Seeding Equipment and Instrumentation: Up to 25 cloud seeding manual generators, and 2 remote generators Season: Up to 5 months (November through March/April) History: Smaller variations of the current Program originated in 2002 with Denver Water and Colorado Springs Utilities. In 2012, a larger collaborative coalition of East and West Slope entities continued those initial efforts and in 2014, the permit for the Program was renewed to also include additional watershed areas north (Target Area 1) and south (Target Area 3) of the existing Target Area (Target Area 2) as shown on the Program map attached. Cloud seeding operations are not currently occurring in Target Areas 1 and 3 however the potential exists to target these areas in the future as the Program grows. Permit: State of Colorado Weather Modification Permit No through March 31, 2013, with conditional approval given for the next five winters through operational season Scientific Evaluations: Pursuant to the 2012 State of Colorado Weather Modification Rules and Regulations, North American Weather Consultants, Inc., with headquarters in Sandy, Utah, has completed a target/control evaluation of the Program since In 2015, the National Center for Atmospheric Research (NCAR) completed an independent evaluation of the seeding effectiveness within a portion of the CCMRB Program. Program Objectives: Increase snowfall in the early season for the ski resort participants (November through January) and overall snowpack for the entire winter season throughout the Target Area Increase supplemental funding each year to pursue new technologies including updating equipment Increase water supply within the upper Colorado River basin Improve the science and techniques in cloud seeding operations in Colorado Increase Colorado's involvement with solutions to Colorado River Basin water supply shortages Page 1
112 Program Sponsors: Front Range Water Council (Voluntary assoc. of East Slope water providers whose members own and operate the major transbasin diversions from the Colorado River Basin including Aurora Water, Denver Water, Colorado Springs Utilities, Northern Colorado Water Conservancy District, Twin Lakes Reservoir & Canal Company, Southeastern Colorado Water Conservancy District, and Pueblo Board of Water Works) Colorado River Water Conservation District Breckenridge and Keystone Ski Areas (Vail Resorts) Winter Park Ski Area Colorado Water Conservation Board (CWCB) and the Lower Basin States (Metropolitan Water District of Southern California, Southern Nevada Water Authority, Central Arizona Water Conservation District, and California Six Agency Committee) Program Funding: Funding may change from year to year, but the overall program purpose and objectives are expected to persist Funding provided by ski areas will be used to target their individual ski areas November through January Funds will be used to seed the most productive storms in the remaining portions of the Target Area from December through March/April for all program sponsors Existing annual funding is not adequate to take advantage of all seeding events, utilization of new technologies and equipment, and/or scientific evaluation opportunities Future Program Enhancements: Instrumentation: Essential to include new meteorological instrumentation in the Program where necessary to assist with seed/no seed decisions o WWC recommends requesting shared use of one Radiometer in order to provide an additional resource to document suitable conditions for seeding operations o WWC recommends requesting the continued funding to NOAA for use of the FX NET forecasting workstation o WWC recommends two high intensity precipitation gauges at key locations to better measure and correlate observations at frequently used SNOTEL data sites o When new equipment is incorporated into the program it is essential that ongoing funding or maintenance agreements are provided to operate, maintain and supply the new equipment Remote Generators: Essential to include additional remote generators in the Program to maximize effectiveness of seeding operations o As the program continues to grow, WWC and DRI recommends remote generators to be installed in key locations where manual generators would be in operable and the best seeding responses tend to occur o DRI submitted a proposal dated June 30, 2015 to the CCMRB Program Manager and the CWCB for the installation of one new remote generator and one weather station in the Page 2
113 Program target area. This proposal will be considered for funding by the CCMRB Program Sponsors. Manual Generators: As the program continues to grow, WWC recommends manual generators to be installed to fill voids within the network of existing generators, or to create the base of a new network as more areas become available for seeding. Use only if carefully reviewed and approved. Liquid Propane (LP) Generators: Evaluate the benefits of LP generators at specific sites specifically for early ski area benefits o If feasible, WWC recommends to site one generator at each of the three ski areas Scientific Evaluations: Ongoing scientific evaluations of the seeding effectiveness of the entire seeding program o In 2015, NCAR completed an independent evaluation of the seeding effectiveness within a portion of the CCMRB Program. This was the first independent scientific evaluation completed of a weather modification program in the State of Colorado and provides a first phase evaluation or proof of concept in how to further evaluate the effectiveness of a cloud seeding program. o Continue to evaluate current generator locations and relocate if necessary to maximize seeding potential DRI submitted a proposal dated June 5, 2015 to the CCMRB Program Manager and CWCB for consideration of a Phase 2 high resolution modeling and plume dispersal study that builds off results from the NCAR Phase 1 Study, and will help to identify sites for new remote generators. This proposal will be considered for funding by the CCMRB Program Sponsors. Target Other Permitted Areas: Investigate opportunities to implement cloud seeding operations in the 2012 permitted Target Areas 1 and 3 within the CCMRB Program Permit New Target Area: Investigate opportunities to implement a new cloud seeding program in the Flat Tops area (Garfield County) Collaboration: Seek continued opportunities for shared generator installations with neighboring basins Strategic Planning: Create a 5 year strategic work plan that recognizes needed program modernization as supported by the program costs and priorities reviewed and approved by CCMRB Program Sponsors Page 3
114 Central Colorado Mountains River Basin, Vail, and Beaver Creek Weather Modification Programs 014B A «131 McCoy «131 Eagle 70 Snowmass Gypsum Creek «91 Leadville « Aspen Eagle River Cross Creek Fryingpan River Colorado River Minturn Kremmling «9 24 Gore Creek Williams Fork Blue River Dillon 40 Breckenridge Fairplay 70 Winter Park « «9 A Miles Potential Remote Generators Manual Generators Remote Generators Cities Beaver Creek Vail CCMRB Target Areas Highways Ski Resort Boundaries ARAPAHOE BASIN ASPEN HIGHLANDS ASPEN MOUNTAIN BEAVER CREEK BRECKENRIDGE 285C BUTTERMILK COPPER MOUNTAIN KEYSTONE LOVELAND SKI COOPER SNOWMASS VAIL WINTER PARK ES NAD 1983 Transverse Mercator Data Provided by CWCB
115 April 1 Median SWE for the Central Colorado Mountains River Basin, Vail, and Beaver Creek Weather Modification Programs 014B A «131 McCoy «131 Colorado River Kremmling «9 Williams Fork 40 Winter Park Eagle 70 Gypsum Creek Eagle River Minturn Gore Creek Blue River Dillon 70 SWE (in) Snowmass «91 Leadville « Aspen Cross Creek Fryingpan River 24 Breckenridge Fairplay « «9 A ES Miles Manual Generators Remote Generators Cities Beaver Creek Vail CCMRB Target Areas Highways NAD 1983 Transverse Mercator Data Provided by CWCB
116 Central Colorado Mountains River Basin (Target Area 2), Vail, and Beaver Creek Weather Modification Programs 134A Colorado River 40 Kremmling Williams Fork 40 McCoy «131 Twin Lakes «9 Green Mountain Reservoir Winter Park Eagle 70 Eagle River Minturn Gore Creek Blue River Dillon Dillon Reservoir A B Gypsum Creek Snowmass Ruedi Reservoir «« Turquoise Lake Aspen Cross Creek Fryingpan River Breckenridge Leadville Fairplay ES «82 Twin Lakes « Miles Potential Remote Generators Manual Generators Remote Generators Cities Highways CCMRB Target Area Beaver Creek Vail Ski Resort Boundaries ARAPAHOE BASIN ASPEN HIGHLANDS ASPEN MOUNTAIN BEAVER CREEK BRECKENRIDGE BUTTERMILK COPPER MOUNTAIN KEYSTONE LOVELAND SKI COOPER SNOWMASS VAIL WINTER PARK 285D NAD 1983 Transverse Mercator Data Provided by CWCB
117 April 1 Median SWE for the Central Colorado Mountains River Basin (Target Area 2), Vail, and Beaver Creek Weather Modification Programs 134A Colorado River 40 Kremmling Williams Fork 40 McCoy «131 «9 Green Mountain Reservoir Winter Park Twin Lakes Eagle 70 Eagle River Minturn Gore Creek Blue River Dillon Dillon Reservoir A Gypsum Creek Cross Creek Breckenridge B Snowmass Ruedi Reservoir «« Turquoise Lake Fryingpan River Leadville Fairplay Aspen 285 «82 Twin Lakes ES Miles «9 SWE (in) Manual Generators Remote Generators Cities Highways CCMRB Target Area Beaver Creek Vail NAD 1983 Transverse Mercator Data Provided by CWCB
118 This page intended to be blank
119 ATTACHMENT 4B NATIONAL CENTER FOR ATMOSPHERIC RESEARCH AN EVALUTION OF SEEDING EFFECTIVENESS IN THE CENTRAL COLORADO MOUNTAINS RIVER BASINS WEATHER MODIFICATION PROGRAM APRIL 15, 2015
120 This page intended to be blank


121 An Evaluation of Seeding Effectiveness in the Central Colorado Mountains River Basins Weather Modification Program Submitted to Grand River Consulting Corporation by Research Applications Laboratory of the National Center for Atmospheric Research (RAL/NCAR) Contributors: Daniel Breed, Duncan Axisa, Changhai Liu, and Xinyuan Feng 15 April 2015 (Northerly view from Berthoud Pass) i
122 ii
123 Executive Summary Introduction Cloud seeding of winter orographic storms follows a conceptual model that was established in the mid 1950 s. The concept is based on the fact that the development of snow is hindered or delayed, under certain cloud conditions, by the lack of natural ice nuclei (IN). IN are those atmospheric particles onto which water vapor condenses and subsequently freezes to start the growth into ice particles and snow. Natural IN that activate or start the freezing process in layer clouds at temperatures warmer than about -15 C (+5 F) are sparse. Introducing large numbers of artificial IN (i.e., cloud seeding) that activate at warmer temperatures can jump start the snow growth process and presumably make it more efficient. The conceptual model of seeding winter orographic clouds has been refined over several decades as our understanding of the complexities of mountain flows and precipitation processes advanced. In simplified terms, the following chain of events is hypothesized for seeding from the ground. Seeding material, usually in the form of silver iodide (AgI) particles, is released from a groundbased generator and carried by the wind toward the target area. The plume of AgI rises and disperses such that it can effectively mix into cloudy air. The AgI particles nucleate ice in cloudy conditions at temperatures colder than about 5 C (+23 F) but are much more effective as temperatures cool to about -8 C (+18 F). The ice crystals then grow, forming precipitation-sized particles and falling to the ground as snow. One of the critical steps necessary for cloud seeding to be effective, and one of the most difficult to assess, is getting the seeding material into cloud conditions susceptible to seeding. These conditions are the regions in clouds where liquid cloud droplets exist at sub-freezing temperatures (super-cooled liquid water) warmer than about -15 C (+5 F). Seeding plumes in the Colorado programs are generated by ground-based generators. Therefore, the first step in evaluating the effectiveness of an operational cloud seeding program is to determine when seedable conditions exist, and another important step is to assess the likelihood that seeding plumes are reaching seedable conditions and affecting snowfall in the areas of interest (i.e., target areas). There are currently seven wintertime cloud seeding programs in Colorado spanning the state from the San Juan s in the southwest to the Winter Park area of the central Rockies. These programs involve more than 100 ground-based generators. The focus of this study was limited to Target Area 2, shown in Figure A, of the Central Colorado Mountains River Basins program (CCMRB), which includes 27 ground-based generators. Several avenues of study were to be addressed in this work, much of which included numerical modeling efforts. As the study evolved however, two major tasks were identified and completed as a proof-of-concept in evaluating the effectiveness of the CCMRB program: Task 1. Develop a climatology of conditions relevant to seeding, using criteria such as temperature, cloud water content, and winds at various levels, liquid water path, stability, and snow water equivalent or snowfall, for precipitation events across Target Area 2. The climatology iii
124 utilized numerical model output (re-analysis of actual conditions) from eight winter seasons ( ) at points every 4-km. Task 2. Simulate conditions during a seeding case to assess the utility and improvement of using a higher resolution model ( 1-km grid spacing) to simulate seeding events compared to the 4-km model output. The high-resolution model run was used to assess seeding plumes using a transport and diffusion modeling tool called HYSPLIT. Figure A. Plot of terrain height over the numerical model domain. All cloud seeding generator locations identified by the CWCB are indicated by the gray dots, but not all of them are part of the CCRMB program. The highlighted polygon denotes Target Area 2. A selection of SNOTEL sites are identified by black square symbols (abbreviations: SR - Summit Ranch, CM - Copper Mountain). This report includes background on potential extra-area effects and on operational seeding criteria to provide context for the CCMRB programs. A detailed climatology of winter conditions in Target Area 2 is presented and combined with seeding criteria to highlight areas of seedable conditions, specific during northwesterly flow. A high-resolution model simulated one storm period known to meet operational seeding criteria, targeting the Winter Park area, and was compared to the coarser 4-km WRF model simulation. HYSPLIT was used to investigate plume behavior for ten seeding generators close to Winter Park, not all of which were used in this seeding event. Results from past studies and the limited results of this study led to preliminary recommendations on generalized seeding generator locations and operations, and outlined the next steps to better assess the seeding assumptions and operations in the CCMRB program. iv
125 Background Extra-area Effects and Seeding Criteria A potential change in precipitation due to seeding in regions outside of primary target areas or during periods beyond what might be expected from seeding operations is an issue frequently raised by water users, stakeholders, and the general public. These potential extra-area effects are also important scientifically in evaluating seeding projects. Here we focus on two approaches to address potential extra-area effects: 1) water balance estimates in the hydrologic cycle, which is a large-scale approach; and 2) a review of past studies concentrating on winter orographic storm projects. During storm passage over a mountain, the vast majority of the total water in the atmosphere (water vapor, cloud water-ice, precipitation) remains in the water vapor state. Typically, only about 20% of the water is converted into cloud. Generally, about 30% of the cloud gets converted into precipitation, or 6% of the total atmospheric water (0.2 times 0.3). If cloud seeding enhanced precipitation by 15% in the storm, that equates to converting an additional 0.9% of the total atmospheric water (0.15 times 0.06) into precipitation. In terms of extra-area effects, the approximate 1% change in atmospheric water components (vapor to cloud condensate to precipitation) due to precipitation increases from seeding is negligible and impossible to measure at the time scales and areal scales covered by standard observations. Hence, in this context the argument that increased precipitation due to seeding measurably decreases precipitation downwind is without merit. However, over short time periods or small areas, precipitation changes or re-distribution due to seeding may have enhanced effects that reach measurable amounts. Typical cloud-seeding efforts focus on increasing the precipitation efficiency in seeded clouds such that their precipitation falls within a target area. However, even for mountain clouds, which dissipate downwind of the barrier, the plume of seeding material will advect some distance beyond the target area. Therefore, seeded precipitation could conceivably fall beyond the boundaries of the target area, and the seeding material (usually silver iodide) could also advect beyond the target so-called extra-area effects. Several studies have documented seeding material or tracer concentrations, released with seeding material, being transported downwind of seeding sites many tens of kilometers (60 miles or more). There have also been many studies that looked at precipitation data downwind of target areas. While these studies have generally shown a positive impact on precipitation downwind of target areas, the results have not been statistically significant because of the small impact and large natural variability in precipitation. Nonetheless, a comprehensive summary of studies on extra-area effects has shown fairly consistent evidence of downwind effects of precipitation enhancement by cloud seeding. The spatial extent of the positive extra-area seeding effects may extend to a hundred miles. The extra-area effects did not appear to produce regional impacts on the water balance, nor on the natural precipitation on a regional scale. However, the results require more verification, which is not likely to come from observations but may benefit from numerical modeling studies. v
126 Criteria for seeding wintertime orographic clouds can be simplified to just three conditions, according to the seeding conceptual model: super-cooled liquid water (SLW), cold-enough cloud temperatures for the seeding material to be effective, and a form of delivery that puts sufficient seeding material into the seedable parts of clouds. Corollary conditions are that the cloud is not naturally efficient, which is akin to requiring seedable conditions, and that precipitation trajectories impact the desired target, which is an extension of the delivery requirement. The seeding criteria are best determined from direct observations of SLW, temperature, winds, and possibly precipitation. Recent programs in Australia, Idaho, and Wyoming have demonstrated the utility of radiosondes, microwave radiometers, icing meters, and numerical models in directly determining seeding conditions. Advances in remote sensing technology, such as wind profilers, acoustic sounders, cloud-sensing radars, as well as microwave radiometers, allow for better determination of seeding criteria than in past programs. Making direct measurements is highly recommended for operational programs, but some of these instruments are economically or logistically impractical for some operations. Hence, proxies for many of these observations/criteria are generally used in determining when to seed. One of the challenges for both direct observations and particularly for proxy variables is determining a value or a threshold for a seeding criterion. Climatology of Seeding Conditions The model data used in the climatology study were output from numerical model runs at a 4-km grid spacing from October 2000 through September These output data were generated as part of another NCAR project called the Colorado Headwaters Program, which covered a large area of the Rocky Mountain region. A subset of the data covering the CCRMB area (see Figure A) at specific altitude levels were used in the climatology to make the analysis more tenable. The seeding criteria used by operators in the CCMRB program are heavily weighted toward the use of proxy variables. For the climatology, the numerical model output was formulated or translated into proxy variables that mimicked the criteria for seeding decisions. This was done to provide continuity in the climatology compared to seeding criteria used in practice. Seeding conditions were analyzed two ways: by periods or time-steps during which seeding criteria were met over Target Area 2, and by sub-areas within Target Area 2 where seedable conditions occurred. The latter also required a wind direction criterion, and for this initial analysis, a NW wind was chosen since it was one of the seeding criteria used by DRI in the Winter Park area. Seedable periods were stratified by monthly and seasonal time frames and by each seeding criterion. These helped assess whether 1) the eight-year model data actually represented a climatology, 2) there were consistent monthly differences, and 3) certain seeding criteria were limiting the determination of seedable conditions. A summary of the overall frequency of seedable conditions is graphically displayed in Figure B. The month with the lowest frequency of seeding conditions is April and the highest is February, with a mean over all seasons of 20%. Other analysis show that temperature is the most limiting criterion, which is evident in the graph with April being the warmest month and hence meeting seeding conditions less often. The frequency or percentage is in relation to the total time in a month. vi
127 Figure B. Percentage of time during each month that seeding criteria are met, plotted by season. The spatial analysis of the seeding criteria was done by applying the criteria at each grid point, allowing for a comparison of sub-areas within the target area. Regions of higher frequencies of seedable conditions can be further normalized by the presence of snowfall, representing an enhanced potential for seeding. We combined these conditions into a variable called seed potential. The frequency distribution for plotted in Figure C shows relative hot spots of seed potential in and around Target Area 2. While the higher seed potential frequencies roughly correspond to areas of higher snowfall, which in turn are related to higher terrain, there are differences in the areas and their frequencies that could be important for targeting. Bear in mind however that the seeding conditions are only for NW winds, and a range of wind regimes would better highlight regions of significant seed potential. Overall, the formulation of the seed criteria and seed potential provide an opportunity to confirm that existing target areas have good seeding opportunities and to identify new target areas. vii
 allowed for only one high-resolution numerical model simulation in the CCMRB area.")
128 Figure C normalized distribution of seed potential. Symbols for SNOTELs and seeding generators are denoted. The NW wind criterion is also noted. Numerical Model Results Resources (time and computer availability) allowed for only one high-resolution numerical model simulation in the CCMRB area. Seeding events when the DRI remote generators operated were examined because of the additional observations at Winter Park. The January 2013 period was chosen for the model simulation since it included a major snow event and two closely spaced seeding periods. The focus of the model-observational comparisons has been on the first seeding period (~ UTC), because both DRI remotely-operated generators ran during that period and the snow rate was greatest during that period. A plot of the model output and observational data near Winter Park is shown in Figure D. Without going into details, the model generally simulated the trends and changes in most variables reasonably well for such a small time period and small area. However, a critical difference was in the modeled wind direction, which was consistently southwesterly versus the mostly northwesterly observed flow. Therefore, the model does not adequately represent the wind criteria for seeding with the DRI remotely-operated generators. But, the seeding trajectories would be applicable to a southwesterly flow event, with the variations in speed and direction that were modeled during this period. This flow regime is fairly typical for the Winter Park target area, although the speeds are slightly weaker than average. viii
129 Figure D. Time-series plots of observational data from the Winter Park sites: Jane, Rock and Cone, and WRF model data from the nearest gridpoints to these sites. Each panel has a legend for observations and model data. Rock and Cone model data are often from the same gridpoint and hence not distinguishable from each other. Not all parameters were observed at the three sites. The circled area on the top plot denotes the seeding period and the difference between modeled and observational wind direction. Locations of ten ground-based generators, two of which were the remotely-controlled generators operated by DRI and closest to the target area, were input into the HYSPLIT model - a transport and diffusion model developed and distributed by NOAA s Air Resources Laboratory. Six-hour trajectories were calculated from each generator during the UTC seeded period. The first 2-3 hours of the trajectories are the most applicable for interpreting the potential path of the seeding plume. The example output in Figure E shows that three of the generator trajectories are clearly impacted by valley flows, with one or two others stagnant during the 1-2 hours. The general path of the trajectories show the predominance of southwesterly flow, contrary to the NW flow that actually occurred during this period. Consequently, the trajectory results indicate that ix
130 southwesterly flow does not target the Winter Park area very well (with the ten chosen generators), nor was it expected to. Figure E. HYSPLIT trajectories from the WRF model output, starting at 2300 UTC, 28 January Plan view showing 6-hr trajectories (dot at each hour) from 10 nearby generators to Winter Park marked as a red circle. Background shows the topography with color code at the bottom. The results of the modeling portion of the study show its utility in assessing seeding trajectories from generator sites. For example, several of the lower elevation generators clearly showed funneling in valley flows. There is also a high sensitivity to the elevation or location of the various generators, and several observational studies have found that high elevation releases are regularly effective in transporting seeding material into orographic clouds. Past studies have criticized the use of valley-placed generators, and emphasized the need for remote-controlled generators for effective operations. As mentioned earlier, the transport and diffusion characteristics of the seeding plumes are difficult to assess, and the modeling study is extremely limited. Nonetheless, the trajectory model results, while still uncertain, tend to support these past studies. x
131 Recommendations The following recommendations, based on this study, should not be considered wellestablished. The climatology work, while fairly comprehensive, would benefit from more extensive analysis of various seeding criteria. The modeling work can best be described as proof of concept, and several more simulations representing different flow regimes, temperature ranges, and stability profiles are needed to begin to generalize results and to specify potential changes to operational programs (i.e., generator locations, seeding criteria). Therefore, the following points should be viewed cautiously, knowing that further study is generally required. Studies of extra-area or downwind seeding effects tend to show enhanced precipitation but the results are generally negligible, to the point of being unmeasurable. Operational seeding criteria are heavily reliant on proxy variables, those not directly measuring the relevant seeding conditions according to the seeding conceptual model. Using observations, such as from rawinsonde releases, microwave radiometric sensing, a ceilometer (measuring cloud base), and/or strategically-placed surface observations (including high-resolution precipitation gauges), is highly recommended. Regular seeding evaluation also relies on observational data, some of which is similar to that needed operationally. In particular, cloud/precipitation radar and high-resolution precipitation gauges or snow-depth sensors would be useful and are recommended. Leveraging this instrumentation with other weather programs may be possible. Stability layers in valleys during storm events that limit seeding material from being transported into cloud are still not well-documented. Yet they are very important to locating effective generator sites and ensuring proper targeting. There are past studies and examples from this study that show valley floor generators can be affected by such conditions. One season of measuring temperature profiles over a valley would go a long way toward settling this issue. Such measurements can be made by radiosondes or remote sensors (e.g., acoustic sounder, radiometric retrievals). Running a high-resolution numerical forecast model could provide consistent and objective seeding periods. The model-derived seeding conditions and trajectories would need to be verified with observations to instill confidence in the results. The month with the lowest frequency of seeding conditions is April and the highest is February, with a mean over all seasons of 20%. This frequency is related to total time, which includes clear-skies and other non-storm periods. Several iterations of varying seeding conditions, determining frequencies compared to snowing periods (versus total time), mapping seed potential for different flow regimes, and other climatological-based results are needed. To facilitate the multiple scenarios and to allow third-party users to conduct their own analysis, combining the climatological data with GIS tools should be investigated. A more comprehensive map of seeding potential should guide future seeding operations new target areas and generator locations. xi
132 Several more model simulations, based on general climatological results, are needed to specify potential seeding impacts under different storm conditions. Running a specialized version of HYSPLIT or possibly another transport and dispersion model is needed to characterize the plume dispersion and hence effectiveness of each current generator. This study provided a proof-of-concept in the use of model-derived re-analysis data for a climatological seeding-conditions assessment and in the application of a high-resolution numerical model for simulating seeding conditions and assessing plume behavior. While the initial project scope was overly ambitious, being based on its feasibility without a good estimate of the amount of work entailed, the ground-work has been laid for a second phase that is better defined in its goals and the work required to achieve them. Instrument deployment and observational studies recommended above would require additional planning and funding. xii
133 Contents Executive Summary... iii 1 Introduction Background Conceptual model Randomized experiments Physical studies Numerical modeling - targeting Extra-area seeding effects Atmospheric water balance in the hydrologic cycle Past studies of AgI persistence and extra-area effects Operational seeding criteria Climatology of seeding conditions in CCMRB target area Objective Methodology Colorado Headwaters WRF data set Formulating seed criteria Implementing the seed criteria Example model comparison with one SNOTEL site Climatology of seedable and non-seedable periods Climatology of seedable and non-seedable areas Seedability and seeding potential WRF model simulation at 800-m resolution one example Choice of storm event Model setup and simulations Comparisons of model output with observations HYSPLIT model results Trajectories from all generators near Winter Park target Relative concentrations from the DRI remotely-operated generators Conclusions and Recommendations Climatology results WRF (800-m) model results Recommendations...47 xiii
134 REFERENCES...48 Appendix A: WRF model configuration and data set...53 Appendix B: Text output data of seed times Appendix C: Climatology plots and statistics...57 Appendix D: High-resolution WRF Model Setup...73 xiv
.")
135 1 Introduction Cloud seeding of winter orographic storms fundamentally follows a conceptual model that was established in the mid 1950 s by Ludlum (1955) and others. The concept is based on the fact that the development of snow is hindered or delayed, under certain cloud conditions but over extended periods of time, by the lack of natural ice nuclei (IN). IN are those atmospheric particles onto which water vapor condenses and subsequently freezes to start the growth into ice particles and snow. Natural IN that activate or start the freezing process in layer clouds at temperatures warmer than about -15 C (+5 F) are sparse. Introducing large numbers of artificial IN that activate at warmer temperatures can jump start the snow growth process and presumably make it more efficient. The conceptual model of seeding winter orographic clouds has been refined over several decades as our understanding of the complexities of mountain flows and precipitation processes advanced. In simplified terms, the following chain of events is hypothesized for seeding from the ground. Artificial IN in the form of silver iodide (AgI) particles are released from a ground-based generator and carried by the wind toward the target area. The plume of AgI rises and disperses such that it can effectively reach a relatively large volume of cloudy air. The AgI particles nucleate ice in cloudy conditions at temperatures colder than about 5 C (+23 F) but with a nucleation efficiency increasing by orders of magnitude as temperatures cool to -8 C (+18 F). The ice crystals then grow by vapor deposition, riming, and/or aggregation in cloudy regions where supercooled water droplets exist, forming precipitation-sized particles. These larger particles fall to the ground as snow, enhanced in number, size, and/or density from what would have fallen naturally. This process is shown schematically in Figure 1.1. Figure 1.1 Relevant seeding processes labelled on a photograph of a precipitating orographic storm over the Medicine Bow Range in Wyoming see inset in the upper right. Conceptual location of supercooled liquid water (SLW) is shaded in green. Temperature levels are approximate and applicable over the central part of the figure. The dashed line schematically represents the seeding plume, which would end with precipitation (snow over the higher terrain into the page and not visible in the photograph). Close generators are those closest to the target area and on higher terrain; distant generators are farther from the target area and at lower elevations. 1
136 One of the critical steps necessary for cloud seeding to be effective, and one of the more difficult to assess, is the transport of seeding material into cloud conditions susceptible to seeding. These conditions are the regions in clouds where liquid cloud droplets exist at sub-freezing temperatures - supercooled liquid water (SLW) warmer than about -15 C. Seeding plumes can be generated by ground-based generators or through airborne seeding, although all of the Colorado programs utilize ground-based generators. Therefore, the first step in evaluating the effectiveness of an operational cloud seeding program is to create a climatology of seedable conditions and then to assess the dispersion of seeding plumes from the ground-based generators during the subsequent snowfall events. Such an analysis is needed to determine: 1) the frequency and duration of seedable conditions; 2) the percentage of time such conditions exist in relation to all snowfall events; 3) if seeding plumes are consistently affecting the target areas; 4) the potential effects of seeding on other areas such as downwind of the target areas; 5) if there are ineffective ground-based generators; and 6) if it makes sense economically and logistically to move generators or deploy additional generators. There are currently seven wintertime cloud seeding programs in Colorado spanning the state from the San Juan s in the southwest to the Winter Park area of the central Rockies. These programs involve more than 100 ground-based generators. The focus of this study was limited to Target Area 2, shown in Figure 1.2, of the Central Colorado Mountains River Basins program (CCMRB), which include 27 ground-based generators. Two major tasks were proposed and completed as a proof-of-concept in evaluating the effectiveness of the CCMRB program: Task 1. Develop a climatology of conditions relevant to seeding, using criteria such as temperature, cloud water content, and winds at various levels, liquid water path, stability, and snow water equivalent or snowfall, for precipitation events across Target Area 2. The climatology utilized output from eight winter seasons ( ) of Weather Research and Forecast (WRF) model runs at 4-km resolution. Task 2. Simulate a seeding case to assess the utility and improvement of using a higher resolution model ( 1-km grid spacing) to simulate seeding events compared to the 4-km WRF runs. The high-resolution model run was then used to assess seeding plumes using the HYSPLIT transport and diffusion modeling tool. This report includes background on the conceptual seeding model, extra-area effects, and operational seeding criteria to provide context for the CCMRB programs. A detailed climatology of winter conditions in Target Area 2 is presented and combined with seeding criteria to highlight areas of seedable conditions, specific during northwesterly flow. A high-resolution model simulated a seeded storm, targeting the Winter Park area, and was compared to the coarser 4- km WRF model simulation. HYSPLIT was used to investigate plume behavior for ten seeding generators close to Winter Park, not all of which were used in this seeding event. Results from past studies outlined in the background and the results of this study led to preliminary recommendations on generalized seeding generator locations and operations, and outlined the next steps in better assessing the seeding assumptions and operations in the CCMRB program. 2

137 Figure 1.2 Map of the Central Colorado Mountains River Basins Weather Modification area and various facilities (generators, SNOTELs, Metar sites). See legend for details. Blue-hatched area Target Area 2 is the focus of this study. (Map generated by CWCB, 2012.) 3
138 2 Background 2.1 Conceptual model Since the seminal work on glaciogenic seeding in the late 1940 s (Schaefer 1946; Vonnegut 1947; Kraus and Squires 1947; Langmuir 1948; Coons et al. 1948; Bergeron 1949), a number of programs have investigated precipitation processes and seeding effects to determine if AgI seeding could produce additional snow from winter orographic clouds. Evaluation of this hypothesis has been attempted over the last half century using randomized statistical experiments, observational studies, and numerical modeling of both natural and seeded clouds. Huggins (2009) summarized physical studies and some randomized experiments that included strong physical evidence that verified aspects of the conceptual model. Recently, winter orographic seeding experiments in Australia (Manton et al. 2011) and Wyoming (Breed et al 2014) have contributed to the body of work documenting evidence that wintertime cloud seeding is effective when cloud conditions specified in the conceptual model exist Randomized experiments Noteworthy randomized studies include the Climax experiments in the central Colorado mountains (Mielke et al. 1981; Grant 1986), the Bridger Range Experiment (BRE) in southwestern Montana (Super and Heimbach 1983), the Snowy Precipitation Enhancement Research Program (SPERP) in the Snowy Mountains of Australia (Manton et al. 2011), and the recently completed Wyoming Weather Modification Pilot Project (WWMPP) in southern Wyoming (Breed et al. 2014). The Climax Experiments (Climax I, , and Climax II, ) were exploratory and confirmatory randomized seeding experiments that used existing instruments and observations as covariates and for ancillary (ex post facto) studies. Both Climax I and Climax II reported precipitation increases with high statistical confidence (Mielke et al. 1981). A reanalysis of the complete Climax data set (I and II) showed that for warm 500 hpa temperatures, precipitation increases of 25% were realized. However, the validity of the experiments was questioned on the basis of the experimental execution and evaluation methodology (Rangno and Hobbs 1987, 1993), and the continuing debate left the results unresolved. The BRE was conducted in the Bridger Mountains of southwest Montana from 1969 to 1972 (Super 1974; Super and Heimbach 1983). Randomized experiments were conducted during the winters of and , and follow-on physical measurements were later made (Super and Heimbach 1988). This project produced statistical evidence of seeding effects and considerable documentation of the physical chain-of-events that began with seeding and led to the observed precipitation changes. An estimate of ~15% more seasonal target-area precipitation than predicted on nonseeded days resulted, while a target-control analysis of independent snowcourse data showed that seeding enhanced the seasonal snowpack more than 15%. A strong recommendation was made for placing ground-based generators more than midway up the western or upwind side of the barrier. This was supported, for example, by airborne plume-tracing observations which provided evidence of effective targeting of the AgI seeding. The Australian experiment, SPERP, has provided recent evidence of an increase in precipitation due to AgI seeding of winter orographic clouds based on a 5-year statistical program (Manton and 4
139 Warren 2011). Precipitation increases of 14% were established, at a 3% significance level, after thresholding the cases according to generator hours indicating sufficient AgI coverage of the target area. Physical studies included silver-in-snow measurements, which showed effective targeting of the AgI seeding agent. The results of the Wyoming project, WWMPP, have recently been summarized in an executive report (WWDC 2014) and included statistical, physical, and modeling analyses. The accumulation of evidence from these analyses suggests that cloud seeding is a viable technology to augment existing water supplies, for the Medicine Bow and Sierra Madre Ranges. The primary statistical analysis implied a 3% increase in precipitation with a 28% probability that the result occurred by chance, which does not meet the acceptable level of significance. While this primary statistical analysis did not show a significant impact of seeding, statistical analysis stratified by generator hours, similar to the SPERP analyses, showed increases of 3-17% for seeded storms. Furthermore, high-resolution modeling studies that simulated three of the experimental seasons, or about half of the total number of seeding cases, showed positive seeding effects of 10-15%. The physical evidence from radiometer measurements taken during the WWMPP showed that ample SLW existed at temperatures conducive to generating additional snow by AgI seeding over the ranges studied. High-resolution and quality-controlled snow gauges were critical in evaluating the effectiveness of cloud seeding and validating the performance of the numerical model used during the WWMPP. A climatology study based on high-resolution model data showed that ~30% of the wintertime precipitation over the Medicine Bow and Sierra Madre Ranges fell from storms that met the WWMPP seeding criteria. Ground-based silver iodide measurements indicated that ground-based seeding reached the intended target, and in some cases, well downwind of the target. So, in spite of the result of no seeding effect from the primary randomized statistical experiment, ancillary studies, using physical considerations to stratify the WWMPP precipitation data, and modeling studies over three full winter seasons, led to an accumulation of evidence from the statistical, modeling, and physical analysis which suggest a positive seeding effect on the order of 5 to 15%. Based on the results of the WWMPP, the recommendation was made to consider implementing the cloud-seeding technology in Wyoming by carefully addressing each of five components: 1) Barrier identification, 2) Program design, 3) Operational criteria, 4) Program evaluation, and 5) Program management. These were further detailed in the executive report Physical studies Although several of the randomized seeding experiments included physical studies aimed at verifying the seeding conceptual model, other cloud seeding research programs that did not include randomized seeding have also attempted to clarify the seeding conceptual model. The Colorado Orographic Seeding Experiment in the northern Colorado mountains (Rauber and Grant 1986) employed airborne and ground-based observations to elucidate the characteristics and evolution of SLW in orographic storms, focusing on how the distribution of SLW impacts precipitation development and the implications for cloud seeding. Through detailed case studies using observations and modeling, the Sierra Cooperative Pilot Project showed that dry ice and AgI seeding likely caused additional precipitation over the Sierra 5
140 Nevada Range of California (Deshler et al. 1990; Reynolds 1988). This well-controlled field experiment suggested that orographic seeding has the potential to enhance precipitation under certain conditions. The Colorado River Augmentation Demonstration Program (CRADP) was conducted over the Grand Mesa of Western Colorado from (Holroyd et al. 1988; Super and Boe 1988). The CRADP conducted a series of physical experiments that included airborne plume mapping over the mesa top, and extended the chain-of-events from seeding from precipitation development aloft to increased precipitation at the surface. The Utah Atmospheric Modification Program was composed of a series of physical experiments conducted from 1984 through 1998, initially over the Tushar Mountains of southwestern Utah, and later (beginning in early 1990) over the Wasatch Plateau of northeastern Utah. For the Wasatch experiment, instrumented mobile platforms collected observations in canyons and along the winter-maintained highway atop the plateau. The program included both ground-based measurements with remote-sensing equipment and aircraft observations (e.g. Long et al. 1990; Sassen et al. 1990; Campistron et al. 1991; Huggins 1995; Heimbach et al. 1997, 1998; Huggins 2007). Super (1999) summarizes the efforts of the Utah studies, which collectively substantiated many of the processes in the orographic seeding concept, and recommended ways to improve Utah s operational seeding program at that time. These studies and evidence from randomized seeding experiments provide a detailed physical picture of AgI plume transport, ice nucleation, and snow development. More sophisticated measurements and improved numerical models over the last decade continue to refine and validate the seeding conceptual model. For example, recent fine-scale radar measurements from an aircraft documented differences between seeded and unseeded clouds, verifying steps in the conceptual model that describe increased snowfall rate due to seeding (Geerts et al, 2010). Likewise, recent modeling studies incorporating AgI seeding into the processes that lead to precipitation have shown promise in simulating seeding effects (Xue et al, 2013a, b) Numerical modeling - targeting The transport and diffusion of AgI material from ground-based generators is critical to assessing whether cloud seeding impacts the desired target areas. Many observational and modeling studies have documented seeding plume behavior as well as the uncertainty of plume dispersion in complex terrain (e.g., Hill 1980, Super and Heimbach 1988, Holroyd et al. 1988, Griffith et al. 1992, Heimbach et al. 1998). Although a number of observational techniques, such as silver-insnow detection, tracer experiments, and ice nuclei measurements, can provide important details on plume dispersion and seeding effectiveness, they are generally cost prohibitive and limited to a few cases or specific sites. Thus, using numerical models provides a more economical and comprehensive analysis as long as there is confidence in the model through validation with observations. Several types of weather numerical models can be used for plume tracking and general evaluation of winter cloud seeding programs. Two discussed here are plume models and mesoscale models. Plume models are single-purpose and hence relatively simple models that calculate the transport and spread of airborne material, such as might arise from accidental spills, pollution sources, dust 6
141 events, volcanic eruptions, intentional chemical/biological releases, and others. Various plume modeling approaches have been successfully applied to winter orographic cloud seeding conditions, based on spot observations for model verification. Plume models depend on input from observations or more often a three-dimensional weather model to drive the plume model with winds, temperature, pressure, underlying topography and land-use. The advantage of using plume models is the ability to include many simulations with these relatively simple models (e.g., SCIPUFF Sykes and Gabruk 1997, HYSPLIT 1, Lagrangian particle models). However, the simplifying assumptions in such models as well as their coarse resolution when driven by typical forecast models of order 20-km grid are disadvantages, and the results should reference some type of benchmark. A high-resolution model or detailed observations could be used to provide such a benchmark to assess their applicability. Therefore, careful analysis and validation is required to gain confidence that such models faithfully portray seeding plumes. Mesoscale models are complex three-dimensional models that can be used to forecast fine details of the weather (prognostic) or reproduce weather events in greater detail than observations alone (diagnostic). These models generally cover spatial scales of several states down to the scale of a single watershed or basin. In order to efficiently use computer resources, a mesoscale model is often nested from coarser resolution (order of 20-km grids) to finer resolution (1- to 4-km grids) to capture the areas of interest in sufficient detail. An early attempt to apply a mesoscale model, the CSU Regional Atmospheric Modeling System or RAMS model, during seeding operations in the central Colorado Rockies demonstrated the evolving capabilities of detailed numerical models to assess cloud seeding effectiveness (CWCB 2005). More recently, the Weather Research and Forecast (WRF) model (Skamarock et al. 2008) has been used in a number studies on winter snowpack and cloud seeding evaluation that have verified the model s ability to accurately simulate plume transport and snowfall over a variety of time and space scales. For example, the WRF model was used to simulate eight seasons of snowfall in the Rocky Mountains, covering all of Colorado and parts of adjacent states (Ikeda et al. 2010). The model runs at various resolutions were compared to SNOTEL data, and grid resolutions of 6 km at a minimum were needed for reasonable agreement. Although 6-km resolution was adequate, the model run at 2-km grid resolution was best at capturing local topographic forcing on regional snowfall. On a smaller scale, the WRF model can be configured at very high resolution, called a large eddy simulation or LES. The LES model was run on a case in the Medicine Bow Range of southern Wyoming at 100-m resolution and proved to be successful in simulating details of the airflow and plume dispersion for that case, validated by results of airborne mapping of the seeding plumes (Xue et al. 2014). Model resolution is clearly a major factor in accurately simulating seeding plumes, as demonstrated in the studies mentioned above and others. A very high-resolution model such as 1 HYbrid Single-Particle Lagrangian Integrated Trajectory ( 7
142 the LES would be useful in mapping the seeding plumes of ground-based AgI generators such as those deployed in the CCMRB program. Unfortunately, an LES simulation requires vast computer resources and is impractical for a long-term or large-scale study. However, running WRF at high-resolution (~1-km) but coarser than the LES can provide a detailed mapping of variables that drive a plume model. The WRF model alone may also generate good simulations of plume transport and diffusion and consequently effects on precipitation. There is evidence that this might be practical, based on an LES model comparison in the Medicine Bow Range of Wyoming. A part of this study would be to determine the effect of nesting down to a relatively high resolution, from 4-km to ~1-km for example, over the CCMRB seeding areas to assess the simulation of the seeding plumes as well as variations in snowfall over the complex terrain. 2.2 Extra-area seeding effects A potential change in precipitation due to seeding in regions outside of primary target areas or during periods beyond what might be expected from seeding operations is an issue frequently raised by water users, stakeholders, and the general public. These potential extra-area effects are also important scientifically in evaluating seeding projects. The background on this issue is focused on two areas: 1) water balance estimates in the hydrologic cycle, which is a large-scale approach; and 2) a review of past studies concentrating on winter orographic storm projects Atmospheric water balance in the hydrologic cycle In the hydrologic cycle, atmospheric water is generally in balance, at least over time periods or at scales sufficiently large to neglect short-term variations. This means that under such conditions the total column moisture flux is balanced by evapotranspiration and evaporation, precipitation, and atmospheric moisture storage. Large amounts of atmospheric water in the form of water vapor pass over a region every day. Some of it condenses forming clouds, and a portion of the condensed or frozen cloud water forms precipitation. As the moist flow encounters orography, it is forced upward. As it rises, it cools, and clouds and precipitation form over the mountains. Typically just over 20% of the total water vapor in a column of air condenses into cloud water, although the exact amount depends on a number of variables often revealed in thermodynamic profiles (e.g., Braham 1952; Gao and Li 2008; Trenberth et al. 2007; Li et al. 2011). The other 80% of the total moisture remains uncondensed in vapor form, because the air containing it never gets cold enough to condense it all. The efficiency of orographic clouds at converting cloud water into precipitation the precipitation efficiency is highly variable and depends on stability profiles, mountain characteristics, microphysical conditions, and other factors (e.g., Colle 2004; Jiang 2003; Houze and Medina 2005; Smith and Barstad 2004). If we use a 30% estimate of storm precipitation efficiency and the 20% estimate of atmospheric water vapor to cloud water, then about 6% of the total atmospheric moisture falls out naturally as precipitation. If cloud seeding is successful in increasing the natural precipitation by 15%, then 15% of the 6% is 0.9% more of the total atmospheric water vapor that might fall as precipitation when seeding is conducted. A pie chart of these estimates is provided in Figure 2.1 (WMI 2005). 8
 due to precipitation increases from seeding is negligible and nearly")
143 Figure 2.1 Pie-chart of the distribution of atmospheric water vapor assuming a cloud seeding impact of a 15% increase in precipitation from a storm (from WMI 2005). In terms of extra-area effects, the approximate 1% change in atmospheric water components (vapor to condensate to precipitation) due to precipitation increases from seeding is negligible and nearly impossible to measure at the time scales and areal scales covered by standard rawinsonde and satellite observations. Hence, in this context the argument that increased precipitation due to seeding measurably decreases precipitation downwind is weak. However, at shorter temporal and spatial scales, precipitations changes or re-distribution due to seeding may have enhanced effects that reach measurable amounts Past studies of AgI persistence and extra-area effects Typical cloud-seeding efforts focus on increasing the precipitation efficiency in seeded clouds such that their precipitation falls within a target area. A seeded cloud or cloud system often moves with the wind, implying its precipitation may fall over an extended ground area. Even for orographically-induced clouds, which dissipate downwind of the barrier, the plume of seeding material will advect some distance beyond the target area. Therefore, seeded precipitation could conceivably fall beyond the boundaries of the target area, and the AgI could also advect beyond the target so-called extra-area effects. Reinking (1972), Boucher (1956), and Grant (1963) suggest that a fraction of the released nuclei do not immediately reach the cloud and are not used. These nuclei are available to be transported out of the seeded area or to remain trapped in the target area. Reinking s (1972) study in the Colorado mountains suggested that IN concentrations were approximately five times above background for two days after seeding. Rottner et al. (1975) summarized a study of persistence from two projects, the Colorado River Basin Pilot Project and the Jemez Atmospheric Water Resources Research Project. Using the NCAR acoustic ice nucleus counter, they found concentrations of AgI IN on the order of 100 to 1000 times higher for several hours after seeding. According to Super et al. (1975), AgI can remain active as an ice nucleant for a considerable time (> 5 hr) and distance (> 100 km). Therefore, it is reasonable to expect seeding effects beyond the primary target. The estimation of extra-area effects due to cloud seeding depends on how well dynamical and ensuing microphysical effects are characterized during the extra-area transport of the seeding material. Thus, representative cloud-scale measurements are needed to quantify effects due to cloud seeding and the weaker extra-area effects. These effects are functions of a complex set of processes and their interactions: a) persistence and effectiveness of seeding material; b) dispersion (transport and diffusion); c) seeding agent concentration; d) background cloud microstructure (hydrometeors and natural IN); and e) the air-mass characteristics, including 9
144 state parameters and aerosols, in which the cloud was formed. Observations relevant to some of these processes have been reported (Deshler and Reynolds 1990; Hill 1980; Holroyd et al. 1988; Orr and Klimowski 1996; Rosenfeld and Woodley 2003; Rosenfeld et al. 2005; Warburton et al. 1995), but none have comprehensively covered all the processes. Transport and diffusion of seeding material has also been verified using tracer measurements of SF 6, IN and ice crystal concentrations, trace chemical analyses of silver and background or tracer elements in snow samples, and trajectory models. In the case of winter orographic clouds, analyses suggest that seeding effects are detectable in the target area and as far as a few hundred kilometers beyond the target area, with nearly all such studies indicating an increase in precipitation (Long 2001; Silverman 2001; Solak et al. 2003; Griffith et al. 2005; Wise 2005). However, the database is still small and equivocal, such that doubt remains about the validity of such positive extra-area seeding effects as well as the precipitation increase in the target areas. The climatological distribution of precipitation indicates that any extra-area effects will be quite variable, and are likely to be quite small for more isolated mountain ranges. Precipitation downwind of a mountain barrier is often a factor of ten less than that on the upwind side. Huggins (1995) described the rapid decrease in SLW in the region downwind of the primary upslope region of a mountain barrier. Warburton and Wetzel (1992) documented similar liquid water patterns over the SPERP target area in Australia in Therefore, the detection of seeding effects in downwind regions will be much less likely than in the main upwind target area. Overall, the comprehensive summaries by Long (2001) and more recently by DeFelice et al. (2014) showed fairly consistent evidence of downwind effects of precipitation enhancement by cloud seeding. The spatial extent of the positive extra-area seeding effects may extend to a couple hundred kilometers. The extra-area effects did not appear to produce regional impacts on the water balance, nor on the natural precipitation on a regional scale. However, the results require more verification. The NRC (2003) report supports these conclusions, suggesting that extendedarea effects will become better defined as seeding impacts in target areas are more carefully quantified and new tools enable better understanding of clouds and their response to seeding. 2.3 Operational seeding criteria The conceptual model for seeding wintertime orographic clouds requires just three criteria: supercooled liquid water, effective cloud temperatures for the seeding material used, and a form of delivery that puts sufficient seeding material into the seedable cloud. Corollary conditions are that the cloud is not naturally efficient, which is akin to requiring seedable conditions, and that precipitation trajectories impact the desired target, which is an extension of the delivery requirement. Super and Heimbach (2005) provides a thorough and still relevant summary of studies that have identified or listed seeding criteria, which address the following basic steps: 1. Seeding material must be successfully and reliably produced. 2. Seeding material must be transported into a region of cloud that has SLW. 3. Seeding material must be dispersed sufficiently in the SLW cloud, so that a significant volume is affected by the desired concentration of IN and a significant number of ice crystals (IC) are formed. 10
145 4. The temperature must be low enough, depending on the seeding material used, for substantial IC formation. 5. ICs formed by seeding must remain in an environment suitable for growth long enough to enable them to fall into the target area. The first three steps are related to the type of generator used, its location, and the spacing of multiple generators. In terms of seeding material release rate, g h -1 has been shown to be effective, depending on generator spacing, and is commonly used (ASCE 2004). Remotelyoperated AgI generators are typically designed to release ~25 g h -1 of seeding material. Manuallyoperated AgI generators are capable of releasing 5-25 g h -1 of seeding material, although many operational programs use an average release rate of about 10 g h -1, which is likely to be inadequate alone. Under most operational scenarios, operating manual generators at the higher release rates or, if mechanically limited (e.g., nozzles, flow rates), co-locating two generators may be more effective depending on their elevation. As mentioned earlier, the transport and diffusion characteristics of the seeding plumes are difficult to assess. However, many observational studies have found that high elevation releases are regularly effective in transporting seeding material into orographic clouds (e.g., Super and Heimbach 2005). High-elevation generator sites are usually much closer to the target area, which feeds back into step 5 above, depending on the mountain and orographic cloud configuration. The seeding criteria are best determined from direct observations of SLW, temperature, winds, IN concentrations, and possibly precipitation. Recent programs in Australia, Idaho, and Wyoming have demonstrated the utility of radiosondes, microwave radiometers, icing meters, and numerical models in directly determining seeding conditions. Advances in remote sensing technology, such as wind profilers, acoustic sounders, cloud-sensing radars, as well as microwave radiometers, allow for better determination of seeding criteria than in past programs. Making direct measurements is highly recommended for operational programs, but some of these instruments are economically or logistically impractical for some operations. Hence, proxies for many of these observations/criteria are generally used in decision-making when to seed. One of the challenges for both direct observations and particularly for proxy variables is determining a value or a threshold for a seeding criterion. Many proxy variables have been identified, used, and refined by cloud seeding operators over many decades. Those proxies determined to be most useful or threshold values that best characterize seedable conditions are geographically dependent and often based on experience. Some of the more common proxy variables used are: cloud-top temperatures, cloud cover, temperatures at standard levels such as 850 mb, 700 mb, and 500 mb, cloud-base height referenced to a mountain crest or a particular mountain feature, maximum wind speeds, lack of inversions which in turn are determined a number of ways, humidity or precipitable water, and the start or existence of precipitation. The seeding criteria used by operators in the CCMRB program are heavily weighted toward the use of proxy variables. For this study, numerical model output is formulated or translated into proxy variables that mimic the criteria for seeding decisions. This was done to provide continuity in the climatology compared to seeding criteria used in practice. Although verification of the numerical model output is not extensive, demonstrating the utility of using high-resolution 11
146 numerical models for refining seeding criteria and making seeding decisions is an auxiliary goal of this study, bolstered by the results of the Idaho and Wyoming programs. 12
147 3 Climatology of seeding conditions in CCMRB target area 3.1 Objective The objective of this task was to develop a climatology of conditions relevant to established seeding or seed criteria for precipitation events across Target Area 2 of the CCMRB region. The climatology utilizes output from the winter seasons of WRF model runs at 4-km resolution. A cursory model validation has been done using data from one SNOTEL site. 3.2 Methodology Colorado Headwaters WRF data set The model data used in this study were output from WRF model runs at 4-km grid spacing. These output data were generated as part of another NCAR project called the Colorado Headwaters Program. The simulation start date was 1 October 2000 and end date 30 September The model was configured for a single domain of km 2 with 45 vertical levels. The details of the simulations are given in Ikeda et al. (2010) and a description of the model configuration and data set is given in Appendix A. The data cover a longitude range of to degrees and a latitude range of to degrees. Figure 3.1 shows a terrain height plot of this domain. The Colorado Headwaters domain created a data set too large to analyze using a desktop computer. So each file was resampled into a smaller domain, centered geographically over the CCMRB Target Area 2, with a longitude range of to degrees and a latitude range of to degrees. This re-sampled domain is shown in Figure 3.2. The pressure levels were also reduced from 15 to 4 750, 700, 650 and 600 mb. The re-sampled WRF data, hereafter data, consists of 24 meteorological variables deemed necessary for calculating parameters used as seed criteria in the CCMRB programs. A list of the variables is given in Appendix A. Since the cloud seeding operations are conducted using ground generators, it was important to analyze the data at the pressure levels closest to the ground. The 750, 700, 650 and 600 mb isobaric levels were analyzed. Figure 3.3 shows an example of temperature field plots at each of these isobaric levels for 1 November 2000 at 0000 UTC. The colored contours show where data are present while the white patches represent missing data. When the geopotential height is below the terrain height, the data are missing. In Figure 3.3, (a) 57% of the data within the domain are missing at 750 mb, (b) 20% missing at 700 mb, (c) 2% missing at 650 mb, and (d) 0% missing at 600 mb. Due to the variation in geopotential height across the domain, the total number of missing data points varies. The fraction of missing data inside just Target Area 2 is approximately 97%, 66%, 7% and 0% at 750, 700, 650 and 600 mb. These missing data imposed constraints on formulating seed criteria for the target area. 13


148 Figure 3.1 Plot of terrain height covering the full WRF domain. All cloud seeding generator locations identified by the CWCB are indicated by the gray dots, but not all of them are part of the CCRMB program. Target Area 2 is identified by the black trace, and the re-sampling domain is denoted by the red polygon. Figure 3.2 Plot of terrain height over the re-sampled WRF domain, similar to Figure 3.1. A selection of SNOTEL sites are identified by black square symbols (abbreviations: SR - Summit Ranch, CM - Copper Mountain). 14
 750 mb, (b) 700 mb, (c) 650 mb, and")
 on right of each panel. 3.2.")


149 Figure 3.3 WRF temperature field at: (a) 750 mb, (b) 700 mb, (c) 650 mb, and (d) 600 mb, on 1 November 2000 at 0000 UTC. Temperature color scale (deg K) on right of each panel Formulating seed criteria In order to establish seed criteria for Target Area 2, the operational criteria for seeding were considered. These criteria vary slightly from one operator to another. The two operators for Target Area 2 are Western Weather Consultants (WWC) and Desert Research Institute (DRI), and the various criteria are summarized in Table
150 Table 3.2 Summary of seeding criteria utilized in Target Area 2 by each operator Operational Criteria WWC DRI 1a. Cloud base heights are below the mountain barrier crest 1b. Cloud cover 50% to 100% over the target 1c. Temperatures at 10,000 ft are -5 C 1d. Temperatures below mountain crest are -5 C 1e. Winds from the surface to cloud base favor movement toward target 1f. Wind direction 280 through 341 and speed 40 mph (17.9 m/s) 1g. No stable layers or inversions between the surface and -5 C level 1h. Temperature at 10,000 ft (700 mb level) > -15 C 1i. The occurrence of precipitation Two approaches were taken in formulating seed criteria for the re-sampled WRF domain. (i) Target area analysis (criteria 2a-2c) The first approach taken in establishing periods when seed criteria are met was to treat the target area separately. The WRF data were reduced by drawing a polygon around Target Area 2 and data points within the polygon were treated as the dataset. Statistics for WRF variables at points inside the target area were produced. These statistics include minima, maxima, mean and standard deviation values for variables in the re-sampled data set (Appendix A, Table A1). Using the criteria in Table 3.2, the following conditions were imposed on the resulting statistics to define a seedable event: 2a) mean temperature at 700 mb between 268 K (-5 C ) and 258 K (-15 C) 2b) maximum cloud water mixing ratio at 650 and 600 mb > 0.05 g kg -1 2c) environmental lapse rate < moist adiabatic lapse rate These criteria are suitable if the target area is treated as its own dataset. If an attempt is made to analyze seed criteria spatially, the above criteria would have to be modified due to a possible bias that would result from missing data at 750, 700 and 650 mb. Therefore the criteria were changed so that a spatial analysis of seeding opportunity could also be performed. (ii) Re-sampled domain spatial analysis (criteria 3a-3e) The second approach taken was to run the seed criteria for every point within the domain to identify spatial variability in seeding opportunity inside and outside the target area. For the spatial analysis, the WRF criteria for seedable events were: 16
151 3a) temperature at 600 mb between K (-16.6 C) and K (-26.7 C) 3b) cloud water mixing ratio at 650 or 600 mb > 0.05 g kg -1 3c) environmental lapse rate < moist adiabatic lapse rate 3d) horizontal wind direction at 10 m between 280 and 341 degrees 3e) horizontal wind speed at 10 m < 17.9 m/s (40 mph) The spatial analysis complements the target area analysis in various ways. The target area approach is an area analysis where a single statistic (e.g., mean, maximum, minimum) is calculated on the value of each grid point and integrated within the target area polygon. The result is a single value that describes the entire target area. The spatial analysis produces statistics at each grid point that are presented spatially allowing for the comparison of sub-areas within the target area Implementing the seed criteria The operational seed criteria (criteria 1a-1i) were formulated for the WRF target area (criteria 2a- 2c) and the spatial analysis approach (criteria 3a-3e). Criterion 1a was represented by implementing criteria 2b and 3b in WRF. The difference between 2b and 3b is that in 2b, the and condition requires that cloud be present at both 650 and 600mb while in 3b, the or criteria is satisfied if cloud is present at either 650 or 600 mb. Criterion 3b is formulated using the or condition due to missing data at 650 mb. In addition, the maximum cloud water mixing ratio within the target area is used in 2b. Criteria 1a and 1b could be more accurately represented in WRF by ensuring that cloud at 650 mb, which is below some of the mountain crests, is present and covers at least 50% of the points within the target area. This is a suggestion for future implementation and has not been done in this work. Criteria 1c and 1h were represented in WRF by criteria 2a and 3a. In 2a, the minimum temperature within the target area is used, while in 3a, the temperature at each time step is used. In 3a, the temperature at 600 mb is used because of missing data at 700 mb. In this case a dry adiabatic lapse rate (DALR) was used to formulate the temperature criteria of 3a. For example, based on the DALR of 9.8 C per km, -5 C at 700 mb (~3000 m) would correspond to C at 600 mb (~4200 m). Consistent with criteria 1e and 1f, a wind condition was added as an example of favorable seeding conditions occurring in northwesterly flow. The DRI criteria for wind speed and direction (criteria 1f) in the DW-WP target area were used and adopted across Target Area 2 (criteria 3d and 3e). In future implementations, the wind criteria could be represented more accurately by considering mean wind direction at each generator site in relation to the target area. This is also a suggestion for improvement in the technique, but could prove to be quite complicated to implement. Criterion 1g was represented in WRF by ensuring that the environmental lapse rate (ELR) was smaller than the moist adiabatic lapse rate (MALR) at each pressure level. This is called the condition of absolute stability where the DALR > MALR > ELR. In criterion 3c, the MALR is calculated at each pressure level by using the WRF temperature and water vapor mixing ratio. The ELR is calculated by subtracting the temperature at a higher pressure level from that of a lower pressure level. In criterion 2c, the mean temperature and maximum water vapor mixing ratio in the target area at each time step are used. In criterion 3c, the WRF temperature and water 17
152 vapor mixing ratio at each time step are used. If MALR < ELR at any level, then the stability criteria are not met at that time step. Figure 3.4 shows plots of mean temperature for the month of January 2001 in the target area at each pressure level for out of cloud and in-cloud data points where condition 2a is satisfied. In this case, 510 hours data points out of 744 hours satisfied condition 2a. Out of these 510 hours, 277 hours were out of cloud and 233 hours were in-cloud at 650 mb. Of the in-cloud fraction, 17 hours (data points) did not satisfy criteria 2c at 650 mb. If the stability criterion was not met at any level, then that time-step failed the stability criterion. In this case the 17 time-steps that fail the criteria at 650 mb would cause those same time-steps to fail the stability criterion at each level. This ensures that no stable layers are present at any particular time as identified in criteria 1g. This measure of stability or more specifically inversions is admittedly coarse and probably unrepresentative of stability closer to the altitudes of the generators. Further work is needed to establish a reasonable stability parameter from model data that addresses the trapping potential of inversions on seeding material. Figure 3.4 January 2001 mean temperature in the target area at each pressure level for out of cloud (left) and in-cloud (right) data points where the 700 mb temperature is between -5 C and -15 C. To compare temperature ranges between pressure levels, adiabatic lapse rates are indicated. Once each of the conditions 2a-2c and 3a-3e are formulated, the seed criteria are then calculated at each time-step by calculating the logical and operation between each of the conditions. This implies that for the seed criteria to be met, each of the conditions would need to be met. Describing this formulation in logical terms, for the seed criteria to equal seed, each of 2a, 2b and 2c would have to be equal seed. The same applies for criteria 3a-3e. There is some variability in the number of seed time-steps or hours that satisfy the criteria as formulated from the model. In order to explore the variability in the number of seed hours that satisfy each condition, slight variations in condition 2b were tested while 2a and 2c were kept constant. The variations tested for 2b are shown in Table 3.3. As expected, the number of seed hours decreased as the criteria became more stringent. The most stringent condition (4d) was adopted and implemented as the cloud criterion Time periods when seed criteria were met resulted in a text file that was used to generate the statistics for the monthly, seasonal, and eight-year periods. An example is given in Appendix B. 18
153 Table 3.3 Variations in cloud conditions (2b) and percentage of the time condition was seed Variation in criterion 2b % time seed 4a) cloud water mixing ratio at 650 mb > 0.01 g kg b) cloud water mixing ratio at 650 mb > 0.05 g kg c) cloud water mixing ratio at 650 and 600 mb > 0.01 g kg d) cloud water mixing ratio at 650 and 600 mb > 0.05 g kg Example model comparison with one SNOTEL site Model validation was performed using one month of SNOTEL data from one site as an example. Data from the Summit Ranch SNOTEL (39.72 N, W) was used for this analysis. The Summit Ranch (SR) SNOTEL is located in the north central section of Target Area 2 at an altitude of 2865 m (9400 ft). Three WRF data points closest to SR were used for the comparison. These points were all located within 10 m elevation and 4.7 km distance from SR. The mean values of these three points were then compared with SR SNOTEL. There was an insignificant difference between the mean value of the three points and the value at the point closest to SR (39.72 N, W). Comparing means and trends in the data provides an indication of how well the model performed. A common measure of the difference between values predicted by a model and the values actually observed is the root mean square error (RMSE). The bias between modeled and measured data is also used as a measure of model prediction error. Figure 3.5 shows plots of WRF and SR SNOTEL data for November As might be expected given the model resolution, the temperature trace is dampened for the model values, leading to an elevated RMSE of 3.06 C for the whole month. But the observed temperature bias over the whole month is only C. The traces of bias and RMSE are shown in the second panel of Figure 3.5. The bias and RMSE are printed on the subsequent traces for snow depth and snow water equivalent. The SR SNOTEL data were not quality controlled and there are some obvious spikes and inconsistencies in the snow measurements. Although the model generally underestimates snowfall, the comparisons are reasonable once the data problems with the SNOTEL observations are taken into account. A potential problem with this comparison is evident in the location of SR. It is located in close proximity to the base of a valley that is only about 15 km wide. Since the WRF model resolution is 4-km, simulating the strong gradients likely to be present between the valley and local mountain tops would tax the resolution of the model. Diurnal temperatures and precipitation amounts in particular would be damped. 19
154 Figure 3.5 Summit Ranch SNOTEL-WRF comparison for November The bias (blue) and RSME (red) values are listed in the bottom three plots. 20
155 A thorough WRF-SNOTEL evaluation of this dataset has already been done by Ikeda et al. (2010) showing that for a wide range of monthly precipitation totals the model agrees within 15-20% from November through March. The largest contribution to the differences tend to be due to an outlier storm that the model grossly under- or over-predicted. The large-scale agreement between the model and the SNOTEL precipitation provides confidence that the high-resolution WRF model can properly simulate snowfall over the domain. Other detailed comparisons, such as with radiometer-derived liquid water path, have shown very good agreement between the WRF model and observations (e.g. results of the Wyoming Weather Modification Pilot Program, final report in preparation). 3.4 Climatology of seedable and non-seedable periods The first step in compiling a climatology of seed and non-seed periods across Target Area 2 entailed running each time-step of the WRF data through the 2a-2c seed criteria as described in Section (i). This process identified the time-steps when the seed criteria were met. The timeseries plots in Figure 3.6 show traces of mean temperature, maximum cloud water mixing ratio, maximum snow mixing ratio, maximum ice mixing ratio, 1-hour precipitation and mean wind direction for Target Area 2 during the season as an example. Other examples are shown in Appendix C. The red portion of each trace indicates time segments when the seed criteria were met. For example, in the season, 1039 hours satisfied the seed criteria, 23% of the time, while 3305 hours did not. Another way to compare no-seed and seed conditions is to use histogram plots. For example, histogram data are shown for mean temperature within Target Area 2 at each pressure level for non-seed segments (Figure 3.7) and seed segments (Figure 3.8). The minimum, mean and maximum temperatures at each level are displayed in the upper right corner of each panel. These statistics were produced for each month and each season starting November 2000 and ending April A table of statistics for several variables during the and seasons and example plots for the season are given in Appendix C. Clearly the results of the climatology are dependent on the formulation of the seed criteria. For example, the effect of the temperature criteria is apparent in the WRF data plotted in Figures 3.7 and 3.8. Seed cases are colder at 700 mb with a mean temperature of -8.5 C. Nonseed cases had a mean temperature of -6.1 C. The same is true for all seasons (shown in Appendix C) with an overall mean of -6.1 C, a mean for seed cases of -9.0 C, and a mean for non-seed cases of -5.3 C. Due to the temperature criterion 2a and the stability criterion 2c, the mean temperature for seed cases has a narrow distribution around the mean. Examination of the stability criterion 2c shows that it does not affect a large number of cases. For example, Figure 3.9 shows that out of a total of 3881 data points in-cloud, only 258 cases or 6.6% were stable during the season. The implementation of seed criteria 2a-2c for the entire Target Area 2 has been demonstrated through frequency distributions and time-series plots. The frequency distributions show how the seed criteria variables fluctuated at each pressure level and between seed and non-seed cases. The time-series presentations provide information on the intermittent duration of seed events and describes how specific variables, such as temperature, impact the duration of each event. 21
156 Figure 3.6 Mean temperature, maximum cloud water mixing ratio, maximum snow mixing ratio, maximum ice mixing ratio, 1-hour precipitation and mean wind direction for Target Area 2 during the season. The red trace indicates that the seeding criteria 2a-2c were met. 22


157 Figure 3.7 Mean temperature at 750, 700, 650 and 600 mb for no-seed cases during the season. The minimum, mean and maximum temperatures of the distribution are printed in the upper right corner. Figure 3.8 Mean temperature at 750, 700, 650 and 600 mb for seed cases during the season. The minimum, mean and maximum temperatures of the distribution are printed in the upper right corner. 23
158 Figure season mean temperature in the target area at each pressure level for in-cloud data points where the 700 mb temperature is between -5 C and -15 C. 3.5 Climatology of seedable and non-seedable areas A spatial analysis of seeding criteria was done by applying seed criteria 3a-3e at each grid point allowing for the comparison of sub-areas within the target area. The first step was to grid the WRF variables spatially within the re-sampled domain. An example is given in Figure 3.10 where (a) shows the cloud water mixing ratio at 600 mb, (b) cloud water mixing ratio at 650 mb, (c) 10-m mean wind direction, (d) 10 m-mean wind speed, and (e) 600 mb mean temperature. The next step was to populate a gridded data set of binary values for each time step to indicate which grid points satisfied criteria 3a-3e. Since the binary value assigned to a grid point for each 1-hour timestep that satisfied the criteria was 1 (0 was assigned if criteria not satisfied), the addition of the binary values for each grid point over a period of a month amounted to the time in hours when seeding criteria were met. Figure 3.11 shows an example of this step where each criteria or a set of criteria are used to produce the frequency of hours that satisfies the condition. Figure 3.11 (e) is a composite of Figures 3.11 (a-d) where all the criteria are used to produce final seed criteria. Figure 3.11 (e) shows that for the month of January 2008 there was a maximum of 150 hours (20%) out of 744 hours when seeding criteria 3a-3e were met. This maximum was in the northern part of Target Area 2. The spatial analysis produces statistics at each grid point. These statistics were produced for each month and each season starting November 2000 and ending April Appendix C elaborates on these statistics and shows plot examples. 24
 cloud water mixing ratio at 600 mb, (b) cloud water")
 The gray circles indicate the location of all cloud seeding")
159 a) b) c) d) Figure 3.10 Jan 2008 maps of variables: (a) cloud water mixing ratio at 600 mb, (b) cloud water mixing ratio at 650 mb, (c) 10-m mean wind direction, (d) 10-m mean wind speed, (e) mean temperature at 600 mb e) The gray circles indicate the location of all cloud seeding generators in Colorado (per CWCB). Only 27 of them are in the CCRMB program. 25
 frequency of criteria")
 frequency of criteria 3d-3e, (e)")

160 a b c d Figure 3.11 Jan 2008 maps of criteria: (a) frequency of criteria 3a, (b) frequency of criteria 3b, (c) frequency of criteria 3c, (d) frequency of criteria 3d-3e, (e) frequency of criteria 3a-3e. e The gray circles indicate the location of all cloud seeding generators in Colorado (per CWCB). Only 27 of them are in the CCRMB program. 26
161 The spatial analysis allows for the observation of meteorological features relevant to the seed criteria within the target area as well as outside the target area. Figure 3.10 shows mean values for each variable for January Figure 3.10 a) and 3.10 b) show the mean spatial distribution of cloud water at 600 and 650 mb respectively. The cloud water mixing ratio shows a maximum along the Front Range and north of Winter Park, just north of the target area. This area is identified as sub-area 1 in Figure 3.10 a). Wind speeds along this area and to the east along the Divide are a maximum reaching 14 m s -1. Temperatures along this section of the Divide are also the coldest during January Another area that shows similar meteorological features extends from Copper Mountain to the south along the Mosquito Range. This area, identified as sub-area 2, falls on higher terrain reaching heights greater than 3.5 km MSL. Cloud water mixing ratio is high and temperatures low compared to surrounding areas. Sub-areas 3 and 4 also have the same meteorological features. Area 3 in the Vail/Battle Mountain area and area 4 in the Eagles Nest Wilderness area are at the same elevation range, with equally high mean cloud water mixing ratio, similar wind direction and speed, and a similar temperature range. Figure 3.11 shows the frequency in hours that seed criteria are met for temperature at 600 mb (a), cloud at 650 or 600 mb (b), instability (c), and wind direction and speed (d). Figure 3.11 e) shows the frequency when all the seed criteria (3a-3e) are met. The higher frequency contours coincide with the sub-areas defined in Figure 3.10 a), within and outside the target area where seed criteria are satisfied more frequently. Temperature criteria are met more frequently along the Front Range in sub-area 1. This is also where the frequency of clouds at 650 or 600 mb is the highest, making this area favorable for seeding. The instability is highest along the Plains, but some areas (e.g. sub-area 2) show pockets of high instability. Wind criteria 3d and 3e are satisfied at high frequency in sub-area 2 and along the eastern edge of the target area in sub-area 5. In this case, the seeding conditions during January 2008 were most favorable in the southern portion of area 1 and in each of areas 2-5. All these sub-areas are within Target Area 2 except for the southern tip of area 1. The spatial mean values for cloud water, wind and temperature for all seasons ( ) are shown in Appendix C, and have similar contour patterns to the January 2008 example in Figure This suggests that the meteorological fields are strongly correlated with terrain features. Although this is not investigated further, future work could focus on studying this observation and its relevance to seedability. 3.6 Seedability and seeding potential In Section 3.5, the seedability using criteria 2a-2c was discussed. This analysis identified time segments when seeding criteria were met for the target area. Table 3.4 summarizes these monthly results. The seedability varies from 2% of the time in April 2002 to 44% of the time in February The month with the lowest mean seedability is April and the highest is February. The mean seedability for all seasons was 20%. These results are shown graphically in Figure

162 Table 3.4 Percentage of time 2a-2c seed criteria are met Season Mean % Nov % Dec % Jan % Feb % Mar % Apr % Mean % Figure 3.12 Percentage of time during each season that 2a-2c seed criteria are met 28
163 The climatology analysis also uses a spatial analysis of seeding criteria by applying criteria 3a-3e to each grid point. Figures show the results of the spatial distribution of each of these criteria and Figure 3.17 shows the aggregation of each of these into a composite seed criterion. Figure 3.17 highlights the variation in frequency of seedability. The target area encompasses subregions where the frequency of seedability exceeds 5% while surrounding areas have a very low seedability. Regions of high seedability present true potential for seeding if the snowfall is sufficient to warrant seeding activity. In order to investigate this more thoroughly, a variable called seed potential was formulated. Seed potential is the normalized product of seed frequency and snow gain. Snow gain is the snow water equivalent at the beginning of the day subtracted from that at the end of the day, which is essentially the daily snow water equivalent. By relating the snowfall to the seedability, it is possible to determine the best opportunity for seeding. Figure 3.18 shows the spatial distribution of snow water gain accumulated through all eight seasons. Snow gain is the highest in the Park Range near Steamboat Springs and is quite high in other regions along the Front Range. The frequency distribution of seed potential for is shown in Figure The plot shows that the distribution of seed potential follows the snow gain but not precisely. Eight regions have been identified where the seed potential exceeds 50%. These areas are identified as sub-areas 1-8 and are located along the Front Range, Bull Mountain, Burro Mountain, Flattop Mountain on the Continental Divide and the Elk Mountains. Four of these areas lie within the target area. The highest potential lies just outside and to the north of the target area in the Indian Peaks Wilderness. The seed potential spatial distribution provides a climatologically-based analysis of the true seeding potential derived from operational seed criteria and snow water equivalent. The formulation of the seed criteria and seed potential provide an opportunity to either identify new target areas or to confirm that existing target areas have good seeding opportunities. 29
 Figure 3.")
164 Figure frequency of criteria 3a (-16.7 C > temperature > C) Figure frequency of criteria 3b (cloud at 650 or 600 mb) 30


165 Figure frequency of criteria 3c (instability) Figure frequency of criteria 3d-3e (wind speed and direction) 31

166 Figure frequency of criteria 3a-3e (all criteria) Figure snow gain 32
167 Figure normalized distribution of seed potential 33

168 4 WRF model simulation at 800-m resolution one example 4.1 Choice of storm event For the initial high-resolution WRF model simulation in the CCMRB area, a seeding case with supporting observations was desirable. Ideally, a case from a day(s) used in the climatology analyses would allow for some direct comparisons. However, the observational data set did not include days from the period, so a recent seeding event was chosen. Seeding events when the DRI remote-controlled generators operated were examined because of the additional observations at Winter Park. The January 2013 period was chosen for the model simulation since it included a major snow event and two closely spaced seeding periods. A figure from the DRI 2013 report to CWCB (Figure 4.1) shows seeding periods at the end of January, along with observations. The January seeding periods are marked as grey bars straddling 1/29/13 in the figure. Figure 4.1 Observational data and seeding events (grey bars) for 21Jan 1 Feb 2013 at the Winter Park target area. Model simulation included the two seeding events on January. (From DRI 2013 report.) 34
169 4.2 Model setup and simulations The WRF model was nested from the 32-km grid spacing of the NARR data set to a 4-km grid, and then nested again to an 800-m grid. A map of the topography on the 4-km and nested 800- m domains (Figure 4.2) shows the region covered by the smaller grid spacing and the change in resolution of the topography. The model was initialized at 0000 UTC on 28 January The 800-m grid model was also initialized at 0600 UTC for a comparison test run, but the results presented here are for the 0000 UTC run. Details of the model setup are listed in Appendix D. Other than the nested grid spacing, the other general point to be made is that the model ran for 36 hours, beginning hours before seeding started. The first 6 hours or so of such simulations usually involve spin-up errors, as the model comes into balance, so sufficient time for model stability was planned. Figure 4.2 Topographical map of the 4-km grid domain and nested 800-m grid domain (white rectangle). Elevation color code is in meters above mean sea level. 35
170 4.3 Comparisons of model output with observations Hourly data from three sites at Winter Park were made available (Lochridge 2014, personal communication) and compared to model output data. Data from the closest model grid point to each data site were plotted along with available parameters from each data site. Unfortunately, because of the staggered WRF grid for other than the temperature parameter, the same grid point was used for the Rock and Cone observation sites, resulting in only one modeled data point for the comparison. Figure 4.3 shows a 36-hr time series of hourly data from the observations and the modeled data. The parameters of most interest are the wind direction, wind speed, and temperature. The WRF model simulates the wind direction fairly well until about 1500 UTC when it fails to capture the variability in the observations. Outside of about one hour with higher wind speeds, the directional variability coincides with light winds, less than about 5 m s -1 (~10 mph). From 2100 UTC (28 Jan) to 0200 UTC (29 Jan), which is during the first seeding period, the modeled wind direction is consistently southwesterly versus the observed flow which is mostly northwesterly but variable between northerly and westerly. Therefore, the model does not adequately represent the wind criteria for seeding with the DRI remotely-operated generators. Temperature comparisons show that the modeled temperatures are biased cold by about 2 C, except for the period between 1800 UTC (28 Jan) and 0100 UTC (29 Jan). During this period, it appears that the model does not capture or adjust quickly to the momentarily strong westerly flow that warms and dries the Winter Park area. Web cameras and nearby precipitation sites indicate that snow falls shortly after that event and is well captured in the model, but without quantitative observations for comparison. The focus of the comparisons has been on the first seeding period (~ UTC), because both DRI remotely-operated generators ran during that period and the snow rate was greatest during that period, as opposed to the later UTC (29 Jan) seeding period. In general, the model simulated the trends and changes reasonably well for such a small time period and small area. However, it demonstrated a cold bias that has been found in other WRF simulations (e.g., Ritzman et al 2015). More importantly, for simulating seeding trajectories, the wind direction had a more southerly component than the actual case. This suggests that seeding trajectories modeled from the WRF output would not accurately reflect the actual trajectories for this event. But, the seeding trajectories would be applicable to a southwesterly flow event, with the variations in speed and direction that were modeled during this period. This flow regime is fairly typical for the Winter Park target area, although the speeds are slightly weaker than average. 36
171 Figure 4.3 Time-series plots of observational data from the Winter Park sites: Jane, Rock and Cone, and WRF model data from the nearest gridpoints to these sites. Each panel has a legend for observations and model data. Rock and Cone model data are often from the same gridpoint and hence not distinguishable from each other. Not all parameters were observed at the three sites. 37
172 4.4 HYSPLIT model results Trajectories from all generators near Winter Park target HYSPLIT is a transport and diffusion model developed and distributed by NOAA s Air Resources Laboratory. HYSPLIT uses gridded data (i.e., model output) to derive dispersion parameters, leading to hourly trajectories and concentrations in the online version of the model. The advantage of using HYSPLIT in general is its availability and ease of use. Options in choosing the gridded data on which HYSPLIT operates are also readily available. Limitations in using HYSPLIT include its reliance on gridded data that is often too coarse to adequately simulate dispersion in a regional setting and in complex terrain, the underestimation of dispersion in the initial grid box, especially vertical dispersion, and the coarse time resolution in the online version. These limitations can be overcome with high-resolution gridded output, such as the WRF run in this study, and by applying more specialized parameterizations and time resolution than the HYSPLIT version available online. In this application, the online version was used to depict trajectories and concentration plots derived for ground-based generators near the Winter Park target area. Locations of ten ground-based generators, two of which were the remotely-controlled generators operated by DRI and closest to the target area, were input into the HYSPLIT model. Six-hour trajectories were calculated from each generator for three different start times covering the UTC seeded period. The first 2-3 hours of the trajectories are the most applicable for interpreting the potential path of the seeding plume. Figures show the resulting HYSPLIT trajectories for 2100, 2300, and 0100 UTC start times. The general path of the trajectories show the predominance of southwesterly flow (contrary to the NW flow that actually occurred during this period), although there is a more westerly component for the 0100 UTC start time. The trajectories beginning at 2100 UTC (Figure 4.4) appear to be influenced by slightly stronger wind speeds, carrying them farther downwind than the other start-time trajectories. An accelerated vertical dispersion, shown in the time-height plot of Figure 4.4, may have exposed the simulated plumes to higher above-ground speeds. Also four of the trajectories show air parcels lofting quite high, probably due the influence of a gravity wave in the lee of the Indian Peaks. But, in general, the trajectories do not show rapid plume transport during the first hour or so. The 2300 UTC start-time trajectories (Figure 4.5) reflect weaker, variable winds as observed at the Winter Park meteorological sites. There is slightly less vertical dispersion and only the two southern trajectories encounter gravity waves in the lee of the mountains. Three of the generator trajectories are clearly impacted by valley flows, with one or two others stagnant during the first hour. The 0100 UTC trajectories (Figure 4.6), as well as their vertical dispersion, are similar to the 2300 UTC trajectories except more are subject to valley flows and stagnant conditions over the first 1-2 hours. No trajectories are lofted sufficiently in the lee of the mountains to encounter gravity waves. The overall conclusion from the trajectory results indicate that southwesterly flow does not target the Winter Park area very well (with the ten chosen generators), nor was it expected to. The coverage improves as the winds/trajectories shift more westerly. In spite of the crosswind component to the mountain ridges, valley flow dominates some of the generator locations, creating uncertain trajectories and targeting. Re-running HYSPLIT at higher time resolution than 38

173 1-hr would help verify these general results and specify potential problem locations under southwesterly flow. a) b) Figure 4.4 HYSPLIT trajectories from the WRF model output, starting at 2100 UTC, 28 January a) Plan view showing 6-hr trajectories (dot at each hour) from 10 nearby generators to Winter Park marked as a red circle. Background shows the topography with color code at the bottom. b) Time-height plot of each generator trajectory same color as in a). Elevation is AGL (above ground level). 39

174 a) b) Figure 4.5 HYSPLIT trajectories from the WRF model output, starting at 2300 UTC, 28 January All else is the same as Figure


175 a) b) Figure 4.6 HYSPLIT trajectories from the WRF model output, starting at 0100 UTC, 29 January All else is the same as Figure

176 4.4.2 Relative concentrations from the DRI remotely-operated generators The online version of the HYSPLIT model includes an option to calculate concentrations and ground deposition from mass releases at single locations. The model was run, driven by the 800- m WRF run, for the DRI generators with a start time appropriate for each generator 2032 UTC for the eastern generator ( DW ) and 2142 UTC for the western generator ( USFS ). The domain of the HYSPLIT plots is replicated in the WRF model domain shown in Figure 4.7. This can be used for reference when interpreting the HYSPLIT plots. Figure 4.7 Topographical map of the 800-m grid WRF model domain with the DRI generators denoted by black stars and the Winter Park area denoted with the red circle. For scale, the distance from the generators to the eastern edge of the Rocky Mountain Foothills (dark blue shading) is about 60 km. Elevation color code is in meters MSL. Plots of ground deposition and integrated concentration between 100m and 1000m AGL for the 6-hr run of the HYSPLIT model are given in Figure 4.8 for the eastern DRI generator (Denver Water site). The plume reflects the southwesterly flow and stays fairly narrow. There is some horizontal dispersion to the southeast but not sufficient to impact the target area in this run. The 42
177 ground deposition plot (Figure 4.8 a) also shows the narrow plume and the impact of the plume on the high mountains (e.g. Indian Peaks) NNE of Winter Park. Although the concentration plot is a different color scale, the HYSPLIT run for the western USFS generator shows a significant southeasterly spread of the plume, just impacting the Winter Park area (Figure 4.9 b). The ground deposition plot also shows the greater plume spread for this generator and this time period (Figure 4.9 a), and the displaced deposition locations along the higher elevations E to NNE of Winter Park. The two concentration/deposition plots from the online interface of the HYSPLIT model run show the general plume patterns under southwesterly flow. There is significant variability between the two locations and the one-hour difference in time period, and it is not clear which is the most important. Running HYSPLIT with a higher time resolution (needing interpolation of WRF model output) or trying another transport and diffusion model are the next steps in resolving the uncertainties. The plots also highlight the fact that the online version of HYSPLIT, while useful, needs customizing to adequately assess plumes from individual generator locations. Also, the relative mass concentrations need to be put into context with IN concentrations appropriate to seeding plumes. 43
 Ground deposition of mass (mg m -2 ). Color changes every two orders of magnitude. b) Concentration of mass (mg m -3 ) integrated over 100-1000 m AGL.")
178 a) b) Figure 4.8 HYSPLIT model results for 6-hr run beginning at 2000 UTC 28 January 2013 with mass release (seeding) starting at 2032 UTC. Source is the DRI generator at the DW site. a) Ground deposition of mass (mg m -2 ). Color changes every two orders of magnitude. b) Concentration of mass (mg m -3 ) integrated over m AGL. Color changes every one order of magnitude. 44
 Ground deposition of mass (mg m -2 ). Color changes every two orders of magnitude. b) Concentration of mass (mg m -3 ) integrated over 100-1000 m AGL.")
179 a) b) Figure 4.9 HYSPLIT model results for 6-hr run beginning at 2100 UTC 28 January 2013 with mass release (seeding) starting at 2142 UTC. Source is the DRI generator at the USFS site. a) Ground deposition of mass (mg m -2 ). Color changes every two orders of magnitude. b) Concentration of mass (mg m -3 ) integrated over m AGL. Color changes every one order of magnitude (different than Figure 4.8 b). 45
180 5 Conclusions and Recommendations 5.1 Climatology results An eight-year climatology of winter weather conditions over the Central Colorado Mountain River Basins (CCMRB) program area was performed using 4-km WRF numerical model output. This model has been well-verified for seasonal studies, and in many cases, for daily values and trends. A numerical model is needed to capture all the variables used in deciding whether to seed winter storms or not the seeding criteria. The seeding criteria of the two operators were used to assess seeding conditions over the entire Target Area 2 of the CCMRB program. This approach provided an estimate of the time seeding conditions occurred over Target Area 2, being about 20% of the total winter season period (Figure C1). The next logical step is to relate this frequency to the frequency of snow occurring in Target Area 2. While the time-series plots indicate that about 50% of the total snowfall fell during seedable conditions, further analysis is required to specifically quantify this percentage and also to reveal monthly trends, identifying which month is likely to be higher or lower than the seasonal average. Analyses of the model output was further refined to allow gridpoint estimates of the seeding conditions, using the additional constraint of wind direction ( ) and speed (<18 m s -1 or 40 mph). Spatial patterns over the modeled domain were revealed with this approach. When combined with snowfall patterns, a plot of seeding potential resulted. Maximum frequencies ranged from 4-7%, but this is in relation to total hours in a season. Local maxima of seeding potential could be used to refine targets or define new target areas. This preliminary look at seeding potential needs further refinement though. For example, only one wind quadrant was attempted in this proof of concept approach, and the seeding potential was weighted by snowfall amount rather than just the occurrence of snowfall, which may be more appropriate or useful. 5.2 WRF (800-m) model results One storm case (28-29 January 2013) was simulated using a 4-km resolution model nested down to 800-m resolution. The 800-m model was run with two different start times, both prior to the storm event. These model runs showed a small sensitivity of the output to initial conditions and we concentrated on the 0000 UTC 28 January 2013 initialization time for further analyses. The output of the 800-m model run was used to drive the community dispersion/trajectory model called HYSPLIT. Three time periods, concentrated on the UTC seeding event in the two-day storm period, were run to assess targeting and plume extent from 10 nearby generators. The resulting modeled trajectories suffered from coarse time resolution (1-hr time-steps) and modeled winds that were more southwesterly than the W-NW winds observed. However, the overall conclusion from the trajectory results indicate that southwesterly flow does not target the Winter Park area very well, but the coverage improves as the winds/trajectories shift more westerly. This is consistent with the wind criterion established for operating the DRI remote generators. In spite of the crosswind component to the mountain ridges, valley flow dominates some of the manual generator locations, creating uncertain trajectories and targeting. A more sophisticated use of the HYSPLIT model or a better-resolved trajectory model would help verify these general results and specify potential problem locations under southwesterly flow. 46
181 The results of the modeling portion of the study show its utility in assessing seeding trajectories from generator sites. For example, several of the lower elevation generators clearly showed funneling in valley flows. There is also a high sensitivity to the elevation or location of the various generators. Past studies have criticized the use of valley-placed generators, and emphasized the need for remote-controlled generators for effective operations. The trajectory model results, while still uncertain, tend to support these past studies. 5.3 Recommendations Operational seeding criteria are heavily reliant on proxy variables, those not directly measuring the relevant seeding conditions according to the seeding conceptual model. Using observations if at all possible, such as from rawinsonde releases, microwave radiometric sensing, and strategically-placed surface observations (including high-resolution precipitation gauges), is highly recommended. Formulating seeding criteria from model output could be improved to generate a more consistent climatology of seeding conditions. These include specifying cloud coverage at appropriate pressure levels, partitioning data using the modeled wind at specific generator locations, and refining the stability parameter to identify potential inversions. While the climatological analyses demonstrated the utility and potential of using areal and timeresolved approaches, recommendations for completing a seeding climatology include: 1) specifying the percentage of total winter snowpack associated with seedable conditions; 2) examining the spatial distributions and changes associated with varying wind directions and speeds; and 3) facilitating this additional work through the use of GIS tools. The third point is necessary to provide the flexibility in specifying seeding criteria for investigating the additional scenarios, and to allow third parties to investigate their own scenarios. The 800-m resolution WRF model simulation needs some obvious extensions that would address more specifics, particularly when focused by a clearer climatology of seeding conditions and times. These include running several more cases over a range of storm directions and possibly stability criteria. These would drive a more customized application of the HYSPLIT model, aimed at addressing plume behavior and targeting, the effectiveness of current generators, and potential changes in or additions to generator locations. These recommendations would constitute a second phase of the current work, which established the analysis concept and provided the framework for further study. 47
182 REFERENCES American Society of Civil Engineers, 2004: Standard practice for the design and operation of precipitation enhancement projects. ASCE/EWRI 42-04, ASCE, Reston, Virginia, 63 pp. Bergeron, T., 1949: The problem of artificial control of rainfall on the globe. I. General effects of ice-nuclei in clouds. Tellus, 1, Boucher, R.J., 1956: Operation Overseed. Final Report to the Advisory Committee on Weather Control, December 1955-January 1956, Mount Washington Observatory, 88 pp. Braham, R.R., 1952: The water and energy budgets of the thunderstorm and their relation to thunderstorm development. J. Meteor., 9(4), Breed, D., R. Rasmussen, C. Weeks, B. Boe, and T. Deshler, 2014: Evaluating winter orographic cloud seeding: Design of the Wyoming Weather Modification Pilot Project (WWMPP), J. Appl. Meteor. Climatol., 53, Campistron, B.A., A.W. Huggins, A.B. Long, 1991: Investigations of a winter mountain storm in Utah. Part III: Single-Doppler radar measurements of turbulence. J. Atmos. Sci., 48, Colle, B.A., 2004: Sensitivity of orographic precipitation to changing ambient conditions and terrain geometries: An idealized modeling perspective. J. Atmos. Sci., 61, Coons, R.D., R.C. Gentry, and R. Gunn, 1948: First partial report on the artificial production of precipitation: Stratiform clouds, Ohio. Bull. Amer. Met. Soc., 29, CWCB, Colorado Department of Natural Resources, 2005: Numerical Simulations of Snowpack Augmentation for Drought Mitigation Studies in the Colorado Rocky Mountains, Final Report to the USBR Weather Damage Modification Program, 186 pp. (available at DeFelice, T.P, J. Golden, D. Griffith, W. Woodley, D. Rosenfeld, D. Breed, M. Solak, and B. Boe, 2014: Extra area effects of cloud seeding An updated assessment, Atmos. Res., 135, Deshler, T., and D.W. Reynolds, 1990: The persistence of seeding effects in a winter orographic cloud seeded with silver iodide burned in acetone, J. Appl. Meteor., 29, Deshler, T., D.W. Reynolds, and A.W. Huggins, 1990: Physical response of winter orographic clouds over the Sierra Nevada to airborne seeding using dry ice or silver iodide, J. Appl. Meteor., 29, Gao, S., and X. Li, 2008: Cloud-Resolving Modeling of Convective Processes. Springer, New York, 210 pp. Geerts, B., Q. Miao, Y. Yang, R. Rasmussen, and D. Breed, 2010: An airborne profiling radar study of the impact of glaciogenic cloud seeding on snowfall from winter orographic clouds. J. Atmos. Sci., 67, Grant, L.O., 1963: Indication of residual effects from silver iodide released into the atmosphere. Proceedings of the Western Snow Conference 1963,
183 Grant, L.O., 1986: Hypotheses for the Climax wintertime orographic cloud seeding experiments. Precipitation Enhancement A Scientific Challenge, Meteor. Monogr., No. 43, R. Braham, Jr., Ed., Amer. Meteor. Soc., Griffith, D.A., G.W. Wilkerson, W.J. Hauze, and D.A. Risch, 1992: Observations of ground released sulfur hexafluoride tracer gas plumes in two Utah winter storms. J. Wea. Modif., 24, Griffith, D.A., M.E. Solak, R.D. Almy, and D. Gibbs, 2005: The Santa Barbara cloud seeding project in Southern California, Summary of results and their implications. J. Wea. Modif., 37, Heimbach, J.A., W.D. Hall, and A.B. Super, 1997: Modeling and observations of valley-released silver iodide during a stable winter storm over the Wasatch Plateau of Utah. J. Wea. Modif., 29, Heimbach, J.A., A.B. Super, and W.D. Hall, 1998: Modeling AgI targeting effectiveness for five generalized weather classes in Utah. J. Wea. Modif., 30, Hill, G.E., 1980: Dispersion or airborne-released silver iodide in winter orographic clouds. J. Appl. Meteor., 19, Holroyd, E.W., J.T. McPartland, and A.B. Super, 1988: Observations of silver iodide plumes over the Grand Mesa of Colorado. J. Appl. Meteor, 27, Houze, R.A., Jr. and S. Medina, 2005: Turbulence as a mechanism for orographic precipitation enhancement. J. Atmos. Sci., 62, Huggins, A.W, 1995: Mobile microwave radiometer observations: Spatial characteristics of supercooled cloud water and cloud seeding implications. J. Appl. Meteor., 34, Huggins, A.W. 2007: Another wintertime cloud seeding case study with strong evidence of seeding effects. J. Wea. Modif., 39, Huggins, A.W. 2009: Summary of studies that document the effectiveness of cloud seeding for snowfall augmentation. J. Wea. Modif., 41, Ikeda, K., R. Rasmussen, C. Liu, D. Gochis, D. Yates, F. Chen, M. Tewari, M. Barlage, J Dudhia, W. Yu, K. Miller, K. Arsenault, V. Grubisic, G. Thompson, and E. Guttman, 2010: Simulation of seasonal snowfall over Colorado. Atmos. Res., 97, Jiang, Q., 2003: Moist dynamics and orographic precipitation. Tellus, 55, Kraus, E.B., and P. Squires, 1947: Experiments on the simulation of clouds to produce rain. Nature, 159, Langmuir, I., 1948: The growth of particles in smokes and clouds and the production of snow from supercooled clouds. Proc. Am. Philos. Soc., 92, 167. Li, X., X. Shen, and J. Liu, 2011: A partitioning analysis of tropical rainfall based on cloud budget. Atmos. Res., 102, Long, A.B., B.A. Campistron, and A.W. Huggins, 1990: Investigations of a winter mountain storm in Utah. Part I: Synoptic analyses, mesoscale dynamics, and water release rates. J. Atmos. Sci., 47,
184 Long, A.B., Review of downwind extra-area effects of precipitation enhancement, J. Wea. Modif., 33, Ludlum, F.H., 1955: Artificial snowfall from mountain clouds. Tellus, 7, Manton, M.J., L. Warren, S. L. Kenyon, A.D. Peace, S.P. Bilish, and K. Kemsley, 2011: A confirmatory snowfall enhancement project in the Snowy Mountains of Australia. Part I: Project design and response variables. J. Appl. Meteor. Climatol., 50, Manton, M.J., and L. Warren, 2011: A confirmatory snowfall enhancement project in the Snowy Mountains of Australia. Part II: Primary and associated analyses. J. Appl. Meteor. Climatol, 50, Mielke, P.W. Jr., G.W. Brier, L.O. Grant, G.J. Mulvey, and P.N. Rosenweig, 1981: A statistical reanalysis of the replicated Climax I and II wintertime orographic cloud seeding experiments. J. Appl. Meteor., 20, National Research Council, 2003: Critical Issues in Weather Modification Research. National Academies Press, Washington, D.C., 123 pp. Orr, B.W., and B.A. Klimowski, 1996: Dispersion characteristics of ground-based cloud seeding in mountainous terrain. Preprints 13 th AMS Conf. on Planned and Inadvertent Weather Modification. Atlanta, Amer. Meteorol. Soc., Boston, Rangno, A.R., and P.V. Hobbs, 1987: A reevaluation of the Climax cloud seeding experiments using NOAA published data. J. Appl. Meteor. and Climatol., 26, Rangno, A.R., and P.V. Hobbs, 1993: Further analysis of the Climax cloud seeding experiments. J. Appl. Meteor., 32, Rauber, R.M., and L.O. Grant, 1986: The characteristics of cloud water over the mountains of northern Colorado during wintertime storms. Part II: Spatial distribution and microphysical characteristics. J. Climate Appl. Meteor., 25, Reinking, R.P., 1972: Target area persistence of cloud seeding material. Preprints 3 rd AMS Conf. on Weather Modification. Rapid City, S.D., Amer. Meteorol. Soc., Boston, Reynolds, D.W, 1988: A report on winter snowpack augmentation. Bull Amer. Meteor. Soc., 69, Ritzman, J., T. Deshler, K. Ikeda, and R. Rasmussen, 2015: Estimating the fraction of winter orographic precipitation that is produced under conditions meeting the seeding criteria from the Wyoming weather modification pilot project. J. Appl. Meteor. Climatol., Accepted January Rosenfeld, D., and W. L. Woodley, 2003: Closing the 50-year circle: From cloud seeding to space and back to climate change through precipitation physics. Cloud Systems, Hurricanes, and the Tropical Rainfall Measuring Mission, Meteor. Monogr., No. 51, Amer. Meteor. Soc., Rosenfeld, D., Y. Xing, and J. Dai, 2005: Satellite retrieved microstructure of AgI seeding tracks in supercooled layer clouds. J. Appl. Meteor., 44, Rottner, D., S.R. Brown, and O.H. Foehner, 1975: The effect of persistence of AgI on randomized 50
185 weather modification experiments. J. Appl. Meteor., 14, Sassen, K., A.W. Huggins, A.B. Long, J.B. Snider, and R.J. Meitín, 1990: Investigations of a winter mountain storm in Utah. Part II: Mesoscale structure, supercooled water development, and precipitation processes. J. Atmos. Sci., 47, Schaefer, V.J., 1946: The production of ice crystals in a cloud of supercooled water droplets. Science, 104, Silverman, B.A., 2001: A critical assessment of glaciogenic seeding of convective clouds for rainfall enhancement, Bull. Amer. Meteor. Soc., 82, Skamarock, W. C., Klemp, J. B., Dudhia, J., Gill, D. O., Barker, D. M., 2008: A description of the Advanced Research WRF version 3. NCAR Tech. Note NCAR/TN-475+STR Smith, R.B., and I. Barstad, 2004: A linear theory of orographic precipitation. J. Atmos. Sci., 61, Solak, M.E., D.P. Yorty, D.A. Griffith, 2003: Estimations of downwind cloud seeding effects in Utah. J. Wea. Modif., 35, Super, A.B., 1974: Silver iodide plume characteristics over the Bridger Mountain Range, Montana. J. Appl. Meteor., 13, Super, A.B., J.T McPartland, and J.A. Heimbach, Jr., 1975: Field observations of the persistence of AgI-NH 4 I-acetone ice nuclei in daylight. J. Appl. Meteor., 14, Super, A.B., and J.A. Heimbach, Jr., 1983: Evaluation of the Bridger Range winter cloud seeding experiment using control gauges. J. Appl. Meteor., 22, Super, A.B., and J.A. Heimbach, Jr., 1988: Microphysical effects of wintertime cloud seeding with silver iodide over the Bridger Range, Montana. J. Appl. Meteor., 27, Super, A.B., and J. A. Heimbach, Jr., 2005: Feasibility of snowpack enhancement from Colorado winter mountain storms: Emphasis on supercooled liquid water and seeding with silver iodide and propane. Final Report to Technical Services Center, Bureau of Reclamation, Denver, CO, 13 November 2005, 73 pp. (available at Super, A.B., and B.A. Boe, 1988: Microphysical effects of wintertime cloud seeding with silver iodide over the Rocky Mountains, Part III: Observations over the Grand Mesa, Colorado. J. Appl. Meteor., 27, Super, A.B., 1999: Summary of the NOAA/Utah Atmospheric Modification Program: J. Wea. Modif., 31, Sykes, R. I., and R. S. Gabruk, 1997: A second-order closure model for the effect of averaging time on turbulent plume dispersion. J. Appl. Meteor., 36, Trenberth, K.E., L. Smith, T. Qian, A. Dai, and J. Fasullo, 2007: Estimates of the global water budget and its annual cycle using observational and model data. J. Hydrometeorology Special Section, 8, Vonnegut, B., 1947: The nucleation of ice formation by silver iodide. J. Appl. Phys., 18, Warburton, J.A., R.H. Stone, and B.L. Marler, 1995: How the transport and dispersion of AgI 51
186 aerosols may affect detectability of seeding effects by statistical methods. J. Appl. Meteor., 34, Warburton, J.A., and M.A. Wetzel, 1992: Field study of the potential for winter precipitation enhancement in the Australian Snowy Mountains. Atmos. Res., 28, WWDC, 2014: The Wyoming Weather Modification Pilot Program Level II Study, Draft Executive Summary, 15 pp. (available at WMI, 2005: Level II Weather Modification Feasibility Study, Report to the Wyoming Water Development Commission by Weather Modification, Inc., Fargo, ND, March pp. Wise, E.A., 2005: Precipitation Evaluation of the North Dakota Cloud Modification Project (NDCMP). MS Thesis, University North Dakota, Grand Forks, ND, 63pp. Xue, L., and Coauthors, 2013a: AgI cloud seeding effects as seen in WRF simulations. Part I: Model description and idealized 2D sensitivity tests. J. Appl., Meteor. Climatol., 52, Xue, L., S. Tessendorf, E. Nelson, R. Rasmussen, D. Breed, S. Parkinson, P. Holbrook, and D. Blestrud, 2013b: AgI cloud seeding effects as seen in WRF simulations. Part II: 3D real case simulations and sensitivity tests. J. Appl. Meteor. Climatol., 52, Xue, L., X. Chu, R. Rasmussen, D. Breed, B. Boe, and B. Geerts, 2014: The dispersion of silver iodide particles from ground-based generators over complex terrain, Part 2: WRF largeeddy simulations vs. observations. J. Appl. Meteor. Climatol., 53,
187 Appendix A: WRF model configuration and data set The model data used in this study was output from WRF version model runs at 4-km grid spacing. The model configuration, from the Colorado Headwaters study, includes the following parameterizations: The Mellor Yamada Janjic (MYJ) Planetary Boundary Layer scheme Noah land-surface model with new enhanced snow albedo The NCAR Community Atmosphere Model (CAM) longwave and shortwave schemes Thompson cloud microphysics scheme The WRF data was stored in Network Common Data Form (netcdf) format. Each file of 1.4 Gigabytes contained WRF output data for one day (24 hours). Each of these files had maximum dimensions [317, 263, 15, 24], which are 317 data points in the west-east direction, 263 data points in the south-north direction, 15 pressure levels and 24 time steps, for a total of 30,013,560 data points in one day. The Colorado Headwaters domain was too large to operate on using a desktop computer so each file was re-sampled to trim the maximum dimensions to [75, 85, 4, 24], which reduced the file size to 35.1 Megabytes (612,000 data points). The trimmed netcdf files, with 75 data points in the west-east direction, 85 data points in the south-north direction, 4 pressure levels and 24 time steps, were centered geographically over Target Area 2 of the CCMRB with a longitude range of to degrees and a latitude range of to degrees. The pressure levels were also reduced from 15 to 4 and include 750, 700, 650 and 600 mb. The re-sampled WRF data, hereafter data, consists of 24 meteorological variables. These variables exist at each data coordinate for each time step. A summary of all the variables is shown in Table A1. These data consist of temperature, humidity, geopotential height, water vapor mixing ratio, condensed water (cloud, rain, snow, graupel and ice) mixing ratio and 3-D winds at each pressure level. Surface variables such as snow water equivalent, snow depth and accumulated precipitation were also sampled. 53
188 Table A1. Description of WRF output data variables Name Description Units Dimensions Qv water vapor mixing ratio at constant pressure levels kg kg -1 [75, 85, 4, 24] Qc cloud water mixing ratio at constant pressure levels kg kg -1 [75, 85, 4, 24] Qr rain water mixing ratio at constant pressure levels kg kg -1 [75, 85, 4, 24] Qs snow mixing ratio at constant pressure levels kg kg -1 [75, 85, 4, 24] Qg graupel mixing ratio at constant pressure levels kg kg -1 [75, 85, 4, 24] Qi ice mixing ratio at constant pressure levels kg kg -1 [75, 85, 4, 24] TK_p temperature at constant pressure levels K [75, 85, 4, 24] RH_p RH at constant pressure levels % [75, 85, 4, 24] U_p x-component wind at constant pressure levels m s -1 [75, 85, 4, 24] V_p y-component wind at constant pressure levels m s -1 [75, 85, 4, 24] W_p z-component wind at constant pressure levels m s -1 [75, 85, 4, 24] GHT geopotential heights at constant pressure levels gpm [75, 85, 4, 24] SLP sea level pressure mb [75, 85, 24] Q2 QV at 2 m kg kg -1 [75, 85, 24] T2 temperature at 2 m K [75, 85, 24] U10 U at 10 m m s -1 [75, 85, 24] V10 V at 10 m m s -1 [75, 85, 24] SNOW snow water equivalent kg m -2 [75, 85, 24] SNOWH physical snow depth m [75, 85, 24] RAINNC accumulated total grid scale precipitation mm [75, 85, 24] SNOWNC accumulated total grid scale snow and ice mm [75, 85, 24] GRAUPELNC accumulated total grid scale graupel mm [75, 85, 24] ACSNOW accumulated snow kg m -2 [75, 85, 24] ACSNOM accumulated melted snow kg m -2 [75, 85, 24] 54
189 Appendix B: Text output data of seed times. Example of text output for time steps when seed criteria 2a-2c are met. The first column is the date in format YYYYMMDD and the second column is the hour (GMT). The example shown below is for November Seeding criteria were satisfied for 40 hours on 6 days, 5.6 % of the time, and on 14 November and 24 November, only one hour met the seed criteria. The data files have the filename format YYYY-YYYY_MM_seedcases.txt where YYYY-YYYY is the season (in this case )
190
191 Appendix C: Climatology plots and statistics Climatology of seedable and non-seedable periods Table C1 shows a list of plots produced by this analysis. Twenty-four plots were produced for each month, totaling 192 plots for eight seasons and 1152 plots for 48 months. Tables C2 and C3 lists the statistics for seasons and as examples. The values in each of the columns represent the overall mean, the non-seed mean, and the seed mean. The seeding criteria are used to separate the non-seed from seed variables. Figure C1 shows the seed and non-seed cases for all eight seasons. The numbers on the right side of the figure panels show the mean, non-seed mean, and the seed mean values for each variable. Between November 2000 and April 2008, the seedable time segments amounted to 21% of the time. Figures C2-C5 show the frequency distribution of temperature, wind direction, wind speed and snow mixing ratio within the target area for during non-seed, seed and all time segments. Focusing on the season, shown in Section 3.4, and the season, shown here, the 700 mb mean temperatures were colder during these seasons than the 8-yr seasonal mean. Seasonal differences in seed and non-seed cases show that the seed mean temperature values are 2.5 to 4.5 C cooler than non-seed values. In general, mean temperatures seem to be normally distributed at all pressure levels (see Figure C2). The differences between seed and non-seed mean temperature tends to become colder at lower pressure. From month to month, this temperature structure becomes more complex. In the warm season of months November, March and April, the seed cases are much colder than the mean with the coldest being in November at 600 mb. Seed cases in November 2007 had the lowest temperatures at 600 and 650 mb. This does not come as a surprise as it is often too warm during these months for seed temperature criteria to be met. However, these November seed events are colder than the seasonal average seed case at lower pressure, meaning that cold air aloft is an important property that is characteristic of seedable conditions in warmer months. In the colder months of December, January and February, the seed cases are nearly the same or warmer at 750 and 700 mb but colder at 600 mb. In almost all months, the non-seed cases are warmer than the mean temperature of all cases. Very little structure is observed in wind speeds (Figure C4 for example). The seed cases tend to have slightly higher wind speeds at 750 and 700 mb. Wind direction is mostly southeasterly at 750 and 700 mb and westerly at 650 and 600 mb. Figure C3 shows a high frequency of northwesterly cases at 700 mb compared to non-seed cases. The high frequency of easterlies in seed cases is not present at 650 mb, indicating that westerly storm tracks are most seedable. Seed cases tend to have westerly winds during the warm months of November, March and April. In the cold months of December, January, and February, seed cases are more southeasterly at 750 and 700 mb becoming northwesterly at 650 and 600 mb. Snow mixing ratio is maximum at 650 mb with the highest mixing ratio observed in April followed by March. February is often the month with the least snow mixing ratio. In most cases, seed cases produce higher snow mixing ratios than non-seed cases. Figure C5 shows a trace of snow mixing ratios for the month of January The highest snow mixing ratio values occur at 600 mb. These snow events are not seedable during the whole duration of the event. Figure C7 is a time 57
192 series of temperature at 700, 650 and 600 mb. Figure C6 shows ~12 snow events with snow mixing ratio greater than 0.1 g/kg. It is apparent that in the big events, such as event 1 and 11, the start of the event is not seedable due to warm temperatures. In some cases, such as events 2, 6 and 7), snow events are not seedable as temperatures are too cold. As shown in Figure C8 for January 2008, the narrow distribution of temperature in seed cases imposes an intermittent duration in the seedability of snow events identified in Figure C6. Table C1. Plots produced by analysis of 2a-2c criteria for Target Area 2 Plot type for target area month season units 750 mb mean T, mac Qc, max Qs, max Qi, 1 hr precip, mean WD 700 mb mean T, mac Qc, max Qs, max Qi, 1 hr precip, mean WD as in 650 mb mean T, mac Qc, max Qs, max Qi, 1 hr precip, mean WD Fig mb mean T, mac Qc, max Qs, max Qi, 1 hr precip, mean WD Temperature stability profile out of cloud C Temperature stability profile in-cloud C Mean wind speed histogram seed ms -1 Mean wind speed histogram non-seed ms -1 Mean wind speed histogram all ms -1 Mean wind direction histogram seed deg Mean wind direction histogram non-seed deg Mean wind direction histogram all deg Mean temperature histogram seed C Mean temperature histogram non-seed C Mean temperature histogram all C Maximum snow mixing ratio histogram seed g kg -1 Maximum snow mixing ratio histogram non-seed g kg -1 Maximum snow mixing ratio histogram all g kg -1 Maximum ice mixing ratio histogram seed g kg -1 Maximum ice mixing ratio histogram non-seed g kg -1 Maximum ice mixing ratio histogram all g kg -1 Maximum cloud water mixing ratio histogram seed g kg -1 Maximum cloud water mixing ratio histogram non-seed g kg -1 Maximum cloud water mixing ratio histogram all g kg -1 58
193 Table C2. Mean values for variables produced by analysis of 2a-2c criteria for target area for season. The values in each of the columns in the format x1,x2,x3 represents the mean value (x1), the non-seed mean value (x2) and the seed mean value (x3). Units as in Table C season Season November December January February March April 600mb mean wind speed 14, 13, 16 9, 8, 13 16, 16, 17 12, 11, 14 17, 17, 16 11, 11, 14 15, 15, mb mean wind direction 222, 219, , 215, , 224, , 222, , 181, , 260, , 155, mb mean temperature -12.8,-11.8, , -7.2, , -12.9, , -12.8, , -13.2, , -11.4, , -8.3, mb max snow mr 0.16, 0.12, , 0.14, , 0.04, , 0.06, , 0.14, , 0.14, , 0.27, mb max ice mr 0, 0, 0 0, 0, 0 0, 0, 0 0, 0, 0 0, 0, 0 0, 0, 0 0, 0, 0 600mb max cloud water mr 0.12, 0.06, , 0.07, , 0.02, , 0.01, , 0.08, , 0.08, , 0.14, mb mean wind speed 10, 10, 12 7, 7, 10 12, 11, 13 9, 9, 11 12, 12, 12 9, 8, 11 11, 11, mb mean wind direction 207, 207, , 205, , 209, , 237, , 161, , 238, , 145, mb mean temperature -9.9, -9.1, , -3.9, , -10.7, , -10.5, , -10.5, , -8.4, , -4.2, mb max snow mr 0.17, 0.11, , 0.14, , 0.04, , 0.06, , 0.13, , 0.13, , 0.24, mb max ice mr 0, 0, 0 0, 0, 0 0, 0, 0 0, 0, 0 0, 0, 0 0, 0, 0 0, 0, 0 650mb max cloud water mr 0.17, 0.11, , 0.1, , 0.07, , 0.05, , 0.13, , 0.22, , 0.12, mb mean wind speed 6, 5, 8 4, 4, 6 6, 5, 9 4, 4, 7 7, 6, 7 5, 4, 7 7, 7, 8 700mb mean wind direction 166, 163, , 172, , 152, , 193, , 133, , 177, , 142, mb mean temperature -6.7, -6.1, , -0.7, , -8.3, , -8.2, , -7.5, -8-6, -5.2, , 0, mb max snow mr 0.12, 0.07, , 0.11, , 0.03, , 0.04, , 0.08, , 0.08, , 0.15, mb max ice mr 0, 0, 0 0, 0, 0 0, 0, 0 0, 0, 0 0, 0, 0 0, 0, 0 0, 0, 0 59
194 700mb max cloud water mr 0.06, 0.04, , 0.04, , 0.03, , 0.02, , 0.05, , 0.08, , 0.03, mb mean wind speed 3, 3, 5 3, 3, 4 3, 3, 5 3, 2, 4 4, 3, 4 3, 3, 4 5, 5, 5 750mb mean wind direction 148, 153, , 165, , 147, , 171, , 134, , 160, , 146, mb mean temperature -4.0, -3.7, , 2.2, , -6.4, , -6.5, , -5.2, , -2.5, , 3.8, mb max snow mr 0.04, 0.02, , 0.03, , 0.01, , 0.01, , 0.03, , 0.02, , 0.04, mb max ice mr 0, 0, 0 0, 0, 0 0, 0, 0 0, 0, 0 0, 0, 0 0, 0, 0 0, 0, 0 750mb max cloud water mr 0, 0, , 0, 0 0, 0, 0 0, 0, 0 0, 0, 0 0, 0, 0 0, 0, 01 60
195 Table C3. Mean values for variables produced by analysis of 2a-2c criteria for target area for season. The values in each of the columns in the format x1,x2,x3 represents the mean value (x1), the non-seed mean value (x2) and the seed mean value (x3). Units as in Table C season Season November December January February March April 600mb mean wind speed 16, 16, 17 15, 15, 13 17, 17, 17 18, 17, 20 16, 16, 17 16, 16, 15 16, 16, mb mean wind direction 219, 214, , 232, , 216, , 229, , 244, , 203, , 165, mb mean temperature -13.5, -12.4, , -7.4, , -14.9, , -16.3, , -13.8, , -13.3, , -9.9, mb max snow mr 0.16, 0.1, , 0.02, , 0.16, , 0.14, , 0.1, , 0.1, , 0.07, mb max ice mr 0, 0, 0 0, 0, 0 0, 0, 0 0, 0, 0 0, 0, 0 0, 0, 0 0, 0, 0 600mb max cloud water mr 0.11, 0.05, , 0.02, , 0.09, , 0.05, , 0.06, , 0.05, , 0.03, mb mean wind speed 12, 12, 12 11, 11, 10 13, 13, 13 13, 12, 15 12, 11, 13 11, 11, 11 11, 12, mb mean wind direction 202, 196, , 211, , 195, , 207, , 221, , 194, , 149, mb mean temperature -10.6, -9.7, , -4.5, , -12.7, , -14, , -11.6, , -10.5, , -6.5, mb max snow mr 0.17, 0.1, , 0.02, , 0.18, , 0.15, , 0.1, , 0.1, , 0.06, mb max ice mr 0, 0, 0 0, 0, 0 0, 0, 0 0, 0, 0 0, 0, 0 0, 0, 0 0, 0, 0 650mb max cloud water mr 0.15, 0.09, , 0.04, , 0.14, , 0.09, , 0.12, , 0.1, , 0.06, mb mean wind speed 7, 6, 8 6, 6, 7 7, 7, 8 7, 6, 10 7, 6, 8 6, 6, 7 6, 6, 7 700mb mean wind direction 162, 153, , 164, , 158, , 154, , 159, , 146, , 138, mb mean temperature -7.5, -6.7, , -1, , -9.9, , -11.4, , -9, , -7.4, , -3.2, mb max snow mr 0.13, 0.07, , 0.01, , 0.14, , 0.12, , 0.08, , 0.07, , 0.04, mb max ice mr 0, 0, 0 0, 0, 0 0, 0, 0 0, 0, 0 0, 0, 0 0, 0, 0 0, 0, 0 61
196 700mb max cloud water mr 0.06, 0.03, , 0.01, , 0.06, , 0.03, , 0.05, , 0.04, , 0.02, mb mean wind speed 4, 4, 5 4, 4, 5 4, 4, 6 4, 3, 6 4, 3, 5 4, 4, 5 4, 4, 4 750mb mean wind direction 140, 140, , 134, , 134, , 135, , 139, , 140, , 158, mb mean temperature -4.8, -4.2, , 2.4, , -7.6, , -9.4, , -6.9, , -5.1, , -0.6, mb max snow mr 0.05, 0.03, , 0, , 0.06, , 0.05, , 0.03, , 0.02, , 0.01, mb max ice mr 0, 0, 0 0, 0, 0 0, 0, 0 0, 0, 0 0, 0, 0 0, 0, 0 0, 0, 0 750mb max cloud water mr 0, 0, 0 0, 0, 0 0, 0, 0 0, 0, 0 0, 0.01, 0 0, 0, 0 0, 0, 0 62
.")
197 700 mb 700 mb 700 mb 700 mb 700 mb 700 mb Figure C1. Mean temperature, maximum cloud water mixing ratio, maximum snow mixing ratio, maximum ice mixing ratio, 1-hour precipitation and mean wind direction at 700 mb for all seasons (Nov 2000 Apr 2008). The numbers on the right side show the overall, non-seed, and seed mean values (top to bottom). The red trace indicates that the seeding criteria 2a-2c were met. 63


,")
 at,")


198 750 mb 700 mb 650 mb 600 mb Figure C2. Mean temperature plots during the season with non-seed cases (left), seed cases (middle), all days (right) at, top to bottom, 750, 700, 650, and 600 mb. The minimum, mean and maximum temperatures are printed in the upper right corner of each plot. 64


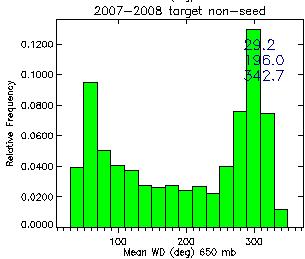


199 Figure C3. As in Figure C2 for wind direction during the season. 65


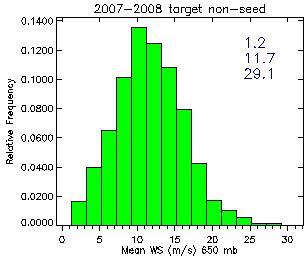


200 Figure C4. As in Figure C2 for wind speed during the season. 66
201 Figure C5. As in Figure C2 for snow mixing ratio during the season. 67
202 700 mb 650 mb 600 mb Figure C6. January 2008 maximum snow mixing ratio at 700, 650, and 600 mb. 68
203 Figure C7. January 2008 mean temperature at 700, 650, and 600 mb. 69


")


204 700 mb 650 mb 600 mb Figure C8. January 2008 histograms of mean temperature with non-seed cases (left), seed cases (middle) and all (right) days. The minimum, mean and maximum temperatures are printed on the upper right corner of each plot. 70
205 Climatology of seedable and non-seedable areas The spatial analysis produces statistics on each grid point over the re-sampled domain. These statistics were produced for each month and each season starting November 2000 and ending April Table C4 shows a list of plots produced by this analysis. In this case, 12 plots were produced for each month and 3 plots for each season totaling 600 plots. An example of spatial maps for the eight-year period ( ) is shown for select variables in Figure C9. All the plots except mean temperature at 600 mb, which is above all ground grid points, show strong correlations to the topography. Table C4. Plots produced by analysis of 3a-3e criteria for re-sampled domain Contour plot type for re-sampled domain month season units 10 m mean wind speed m/s 10 m mean wind direction degrees 600 mb mean temp C 600 mb mean cloud water mixing ratio g kg mb mean cloud water mixing ratio g kg -1 Snow water gain in Frequency when 10-m wind 280 < dir < 341 ; speed < 17.9 m s -1 hours Frequency with no stable layers (stability criterion 2c not met) hours Frequency when 600 mb C > temp > C hours Frequency when cloud present at 650 mb or 600 mb hours Frequency 3a-3e seed criteria satisfied hours Seed potential % 71
 cloud water mixing ratio at 600 mb, (b) cloud water")

206 a b c d Figure C maps of variables: (a) cloud water mixing ratio at 600 mb, (b) cloud water mixing ratio at 650 mb, (c) 10-m mean wind direction, (d) 10-m mean wind speed, (e) 600 mb mean temperature. e The gray circles indicate the location of all cloud seeding generators in Colorado (per CWCB). Only 27 of them are in the CCRMB program. 72
 51 vertical levels topped at 100 hpa (or mb) 36-hour simulation, starting from 28 January 2013, 0000 UTC Microphysics: Thompson scheme Convective scheme: none")
207 Appendix D: High-resolution WRF Model Setup WRF model setup WRF version Two one-way nested domains consisting of a 4-km grid ( grid points) and a 0.8- km grid ( grid points) 51 vertical levels topped at 100 hpa (or mb) 36-hour simulation, starting from 28 January 2013, 0000 UTC Microphysics: Thompson scheme Convective scheme: none (explicitly resolved) PBL (planetary boundary layer lowest levels): Yonsei University (YU) scheme Radiation: RRTMG scheme (a radiation transfer model) Surface layer: Revised MM5 surface layer scheme Land surface: Noah-MP land-surface model Forcing data: NARR (North American Regional Reanalysis data) Other features: MODIS (satellite) green fraction; terrain slope impact on radiation Figure D1. 4-km and nested 800-m domains same as Figure
208 This page intended to be blank
209 ATTACHMENT 5 VAIL / BEAVER CREEK PROGAM
210 This page intended to be blank
211 Vail/Beaver Creek Operational Weather Modification Program Highlights 2015 Program Summary: Manager: Vail Resorts, Inc. (Elizabeth Howe Senior Director of Mountain Operations) Contractor: Western Weather Consultants, LLC. (WWC), with headquarters in Durango, Colorado, is the contractor for the operational seeding activities of the program, and holds the permit for the Program (Key contact: Larry Hjermstad) Target Area: The ski areas of Vail and Beaver Creek above 8,500 feet mean sea level in Eagle County, and has an area of approximately 300 square miles Seeding Equipment and Instrumentation: Up to 25 cloud seeding manual generators; some of which are shared with the Central Colorado Mountains River Basin Program Season: Up to 5 months (November through March) History: Program began in 1976 Permit: State of Colorado Weather Modification Permit No through March 31, 2011, with conditional approval give for future years operations from through the same operational seasons for up to ten years through the operational year Scientific Evaluations: An independent evaluation was completed in 2009 (Seed vs. No Seed Analysis. Silverman Stream Flow Analysis.) Pursuant to the 2012 State of Colorado Weather Modification Rules and Regulations, North American Weather Consultants, Inc., with headquarters in Sandy, Utah, has completed a target/control evaluation of the Central Colorado Mountains River Basin Program (CCMRB Program), which encompasses the Vail/Beaver Creek Program since Vail is a funding partner with the CCMRB Program on the target/control study. In 2014, the National Center for Atmospheric Research (NCAR) completed an independent evaluation of the seeding effectiveness of the CCMRB Program, and the Phase 1 study results are available in the April 2015 report. Program Objectives: Increase early season snowfall at ski resorts to help with early opening dates, as well as, help the ski resort s snowmaking operations by shortening the timeframe needed to make snow Increase snowfall amounts at ski resorts to attract more skiers and lengthen the ski season Increase natural snowpack with the Target Area Improve the science and techniques in operation in Colorado Program Sponsors: Vail Associates Inc. Beaver Creek Associates Inc. Program Funding: Funding for this program has been evolving and has become consistent beginning in 2012 Funds are used to seed productive storms in the Target Area Page 1
212 WWC Recommendations of Future Program Enhancements for Vail/Beaver Creek Ski Area Consideration: Instrumentation: WWC recommends it is essential to include new meteorological instrumentation in the Program where necessary to assist with seed/no seed decisions o WWC recommends requesting shared use of one Radiometer currently leased by the CWCB in order to provide an additional resource to document suitable conditions for seeding operations o WWC recommends requesting the continued funding to NOAA for use of the FX NET forecasting workstation o WWC recommends requesting two high intensity precipitation gauges at key locations to better measure and correlate observations at frequently used SNOTEL data sites o If new equipment is incorporated into the program, WWC recommends it is essential that on going funding is provided to operate, maintain and supply the new equipment Remote Generators: If feasible, WWC recommends the addition of one remote generator to the Program maximizing it s utilization from the greatest range of wind directions covering the Target Area Manual Generators: WWC recommends up to 2 additional manual generators in the program where necessary Liquid Propane (LP) Generators: WWC recommends the addition of up to 2 LP generators in the program to help with early season warmer operations, pending siting of the generators is feasible Scientific Evaluations: WWC recommends on going scientific evaluations of the seeding effectiveness of the entire seeding program: o In 2014, NCAR completed an independent evaluation of the seeding effectiveness within a portion of the CCMRB Program, which encompasses the Vail/Beaver Creek program since 2013, and the Phase 1 study results are available in the April 2015 report o WWC recommends to continue to evaluate current generator locations and relocate if necessary to maximize seeding potential Potential Phase 2 Study modeling study that builds off results from Phase 1 Study; Radiometers may compliment Phase 2 modeling research Collaboration: WWC recommends seeking continued opportunities for shared generator installations with neighboring basins Page 2
213 Central Colorado Mountains River Basin (Target Area 2), Vail, and Beaver Creek Weather Modification Programs 134A Colorado River 40 Kremmling Williams Fork 40 McCoy «131 Twin Lakes «9 Green Mountain Reservoir Winter Park Eagle 70 Eagle River Minturn Gore Creek Blue River Dillon Dillon Reservoir A B Gypsum Creek Snowmass Ruedi Reservoir «« Turquoise Lake Aspen Cross Creek Fryingpan River Breckenridge Leadville Fairplay ES «82 Twin Lakes « Miles Potential Remote Generators Manual Generators Remote Generators Cities Highways CCMRB Target Area Beaver Creek Vail Ski Resort Boundaries ARAPAHOE BASIN ASPEN HIGHLANDS ASPEN MOUNTAIN BEAVER CREEK BRECKENRIDGE BUTTERMILK COPPER MOUNTAIN KEYSTONE LOVELAND SKI COOPER SNOWMASS VAIL WINTER PARK 285D NAD 1983 Transverse Mercator Data Provided by CWCB
214 April 1 Median SWE for the Central Colorado Mountains River Basin (Target Area 2), Vail, and Beaver Creek Weather Modification Programs 134A Colorado River 40 Kremmling Williams Fork 40 McCoy «131 «9 Green Mountain Reservoir Winter Park Twin Lakes Eagle 70 Eagle River Minturn Gore Creek Blue River Dillon Dillon Reservoir A Gypsum Creek Cross Creek Breckenridge B Snowmass Ruedi Reservoir «« Turquoise Lake Fryingpan River Leadville Fairplay Aspen 285 «82 Twin Lakes ES Miles «9 SWE (in) Manual Generators Remote Generators Cities Highways CCMRB Target Area Beaver Creek Vail NAD 1983 Transverse Mercator Data Provided by CWCB
215 ATTACHMENT 6 GRAND MESA PROGAM
216 This page intended to be blank
217 Grand Mesa Operational Weather Modification Program Highlights 2015 Program Summary: Manager: Water Enhancement Authority (WEA) City of Grand Junction (Key contacts: Mark Ritterbush and Slade Connell) Contractor: John Thompson (Chief Meteorologist), with headquarters in Montrose, Colorado, is the contractor for the operational seeding activities of the Program, and holds the permit for the Program with WEA Target Area: The Grand Mesa in Western Colorado and surrounding terrain including Battlement Mesa and the West Elk Mountains above 5,500 feet mean sea level that contribute streamflow to the Gunnison and Colorado Rivers, and has an area of approximately 500 square miles as shown on the Program map attached Seeding Equipment and Instrumentation: Up to 17 cloud seeding generators (13 manual, 5 remotes, and 1 liquid propane dispensing unit), weather station located at Whitewater Creek with an icing rate meter Season: Up to 6 months (Nov 1 through April 30) History: Program began in the late 1970s, the Water Enhancement Authority (WEA) was formed in 1990 in an effort to conduct cloud seeding operations internally within the organization Permit: State of Colorado Weather Modification Permit No for seeding operations through April 30, 2011, with conditional approval given for future years operations for up to ten years through the operational year Scientific Evaluations: Pursuant to the 2012 State of Colorado Weather Modification Rules and Regulations, North American Weather Consultants, Inc., with headquarters in Sandy, Utah, has completed a target/control evaluation of the Program since 2013 Program Objectives: Increase natural snowpack within the Target Area to augment natural precipitation within the Target Area to provide improved snowpack. The spring run off will then augment streamflows and reservoir storage in the region as well as enhance flows in the Gunnison and Colorado Rivers. Increase snowpack snow water equivalent to benefit natural habitat, agriculture, municipal water, stock growers, recreational interests, and the local economy Increase water supply within the upper Colorado River basin Improve the science and techniques in operation in Colorado Increase Colorado's involvement with solutions to Colorado River Basin water supply shortages Program Sponsors: Water Enhancement Authority City of Grand Junction (members include Grand Mesa Water Conservancy District, Collbran Water Conservancy District, Kannah Creek Water Users Pool, and Grand Mesa Water Users Association) Ute Water Conservancy District Page 1
218 Powderhorn Mountain Resort Delta County Town of Orchard City Colorado River Water Conservation District Highline Ditch Company Cottonwood Lakes Reservoir Company Juniata Ditch Company Overland Ditch Company Clifton Water District Mesa Lakes Reservoir Company Colorado Water Conservation Board (CWCB) and Lower Basin States (Metropolitan Water District of Southern California, Southern Nevada Water Authority, Central Arizona Water Conservation District, and California Six Agency Committee) Program Funding: Funding provided by ski areas will be used to target their individual ski areas as early as November Funds will be used to seed the most productive storms in the remaining portions of the Target Area from December through March/April Existing funding not adequate to take advantage of all seeding potentials and/or scientific evaluation opportunities Future Program Enhancements: Instrumentation: Essential to include new meteorological instrumentation in the Program where necessary to assist with seed/no seed decisions o Mr. Thompson recommends installation of one or more web cameras where appropriate to provide real time information when snow is falling over the Target Area o Mr. Thompson recommends the addition of one or more icing meters to provide real time presence of super cooled liquid water o Mr. Thompson recommends the Colorado Avalanche Information Center (CAIC) expand cloud seeding data to include forecasts of changes in the sounding profile (e.g. wind profiles o Mr. Thompson recommends the addition of one or more precipitation gauges at key locations to better measure and correlate observations at the existing liquid propane generator site and at any future sites o WEA recommends requesting shared use of one Radiometer currently leased by the CWCB in order to provide an additional resource to document suitable conditions for seeding operations Remote Generators: Essential to include additional remote generators in the Program where necessary o WEA requested CWCB WSRA Basin grant funding from the Colorado and Gunnison Basin Roundtables this year to assist with the purchase of two Idaho Power Company (IPC) Page 2
219 remotes, and funding was approved by the CWCB. The two new IPC remotes were deployed in the Program target area in September Manual Generators: WEA recommends replacing the existing manual generators with remotes over time and as funding is available Liquid Propane Generators: May be desirable to include additional liquid propane generators in the Program where necessary Scientific Evaluations: Ongoing scientific evaluations of the seeding effectiveness of the entire seeding program o Evaluate current generator locations and relocate if necessary to maximize seeding potential Permit New Target Area: Investigate opportunities to implement a new cloud seeding program in the Battlement Mesa area (Garfield County) Page 3
220 Grand Mesa Weather Modification Program Rifle 70 Cardiff 70 Colorado River Palisade «65 «330 Molina Collbran Vega Reservoir Overland Reservoir 50 «65 Cedaredge «92 «133 Paonia Somerset « ft Gunnison River Delta «92 « Crawford 11000ft ES Miles Ski Resort Boundaries SKI SUNLIGHT Manual Generator Remote Generator Grand Mesa Target Area Cities Highways NAD 1983 Transverse Mercator Data Provided by CWCB
221 April 1 Median SWE for the Grand Mesa Weather Modification Program Rifle 70 Cardiff 70 Colorado River Palisade «65 «330 Molina Collbran 50 «65 Cedaredge Somerset «133 «133 Paonia SWE (in) Gunnison River Delta «92 « ft ES « Crawford ft Miles Manual Remote Grand Mesa Target Area Cities Highways NAD 1983 Transverse Mercator Data Provided by CWCB
222 This page intended to be blank
223 ATTACHMENT 7 UPPER GUNNISON RIVER BASIN PROGAM
224 This page intended to be blank
225 Upper Gunnison River Basin Operational Weather Modification Program Highlights 2015 Program Summary: Manager: Upper Gunnison River Water Conservancy District (UGRWCD) (Key contact: Frank Kugel) Contractor: North American Weather Consultants, Inc. (NAWC), with headquarters in Sandy, Utah, is the contractor for the operational seeding activities of the Program, and holds the permit for the Program. (Key contact: Don Griffith) Target Area: The mountainous areas above 9,000 feet mean sea level located within Gunnison, northwestern Saguache, and northern Hinsdale Counties that contribute streamflow to Blue Mesa Reservoir as shown on the Program map attached. Drainages that originate from these areas include, but are not limited to, the upper Gunnison River, East River, Taylor River, Slate River, Ohio Creek, Tomichi Creek, Cochetopa Creek, Cebolla Creek, and Lake Fork of the Gunnison River. Seeding Equipment and Instrumentation: Up to 30 cloud seeding generators, one icing rate meter Season: Up to 5 months (Nov 15 through Apr 15) History: Program began in 2002 which initially included only those drainages above 9,000 feet mean sea level in Gunnison County during the first season ( ). Later, at the request of the sponsors, the Target Area was expanded to include additional watershed areas in two adjoining counties to the south (Hinsdale and Saguache). Permit: State of Colorado Weather Modification Permit No through April 15, 2013, with conditional approval given for the next five winters through operational season Scientific Evaluations: Pursuant to the 2012 State of Colorado Weather Modification Rules and Regulations, NAWC has completed a target/control evaluation of the Program since For WY 2015, NAWC reports that the estimated results of the target/control evaluation indicate an average of 8% to 12% increases in April 1 st snow water content at target area SNOTEL sites. Program Objectives: Increase precipitation and snowpack water content to benefit the natural habitat, agriculture, municipalities, recreation, tourism, and the area economy in a cost efficient manner Increase water supply within the upper Colorado River basin Improve the science and techniques in operation in Colorado Program Sponsors: Upper Gunnison River Water Conservancy District (UGRWCD) Gunnison County Dos Rios Water & Sewer Gunnison County Stock Growers Association Town of Mt. Crested Butte East River Regional Sanitation District / Skyland Metro District Antelope Hills Water Page 1
226 Colorado Water Conservation Board (CWCB) and the Lower Basin States (Metropolitan Water District of Southern California, Southern Nevada Water Authority, Central Arizona Water Conservation District, and California Six Agency Committee) Program Funding: Program funding varies year by year Used to seed storms or portions of storms that meet NAWC generalized seeding criteria in the Target Area from November 15 through April 15 Existing funding not adequate to take advantage of all seeding potentials and/or scientific evaluation opportunities Future Program Enhancements: Instrumentation: Essential to include new meteorological instrumentation in the Program where necessary to assist with seed/no seed decisions o NAWC recommended installation of one ground based icing meter at Crested Butte Ski Area in order to make observations of supercooled liquid water to assist with these decisions. The icing meter was installed in the fall of o NAWC recommends including a new icing meter on Monarch Pass o Continued funding support needed for new instrumentation operations, maintenance and data analyses in future years Remote Generators: Desirable to include remote generators in the Program where necessary. NAWC recommends the addition of 1 2 remotes to target high yield areas in the Target Area (e.g. Taylor Reservoir drainage) Manual Generators: NAWC recommends the addition of 2 3 manual generators in the area south of Aspen to target highly seedable storms that have a northerly wind component Scientific Evaluations: Ongoing scientific evaluations of the seeding effectiveness of the entire seeding program: o Evaluate current generator locations and relocate if necessary to maximize seeding potential o NAWC provides annual target/control evaluations pursuant to the 2012 Weather Modification Rules & Regulations o NAWC has identified a potential opportunity in the season to use the CWCBleased radiometer in the Target Area to make observations of supercooled liquid water to allow for comparisons of observed data from the existing ground based icing meter o This summer 2015, NAWC will prepare a scientific analysis and report of the icing events observed at the Crested Butte ski area site last winter Collaboration: Seek opportunities for shared generator installations with neighboring basins Page 2
227 2A # 550 Lazear «92 50 Paonia # Crawford Bowie # # # # Cimarron # # «133 Somerset Blue Mesa Reservoir # # Slate River «149 # Ohio Creek # # 11000ft # # 285 «135 # # «114 Taylor River Tomichi Creek 50 «82 # # Lake Fork The Upper Gunnison Weather Modification Program Crested Butte Powderhorn Gunnison Aspen Taylor Park Reservoir A C Buena Vista Poncha Springs 285 Ridgeway Lake Fork # Cebolla Creek # Cochetopa Creek «114 ES 550 «149 # Creede Miles Ski Resort Boundaries ASPEN HIGHLANDS ASPEN MOUNTAIN BUTTERMILK CRESTED BUTTE SNOWMASS # Manual Generators Potential Manual Generators Potential Remote Generators Upper Gunnison Target Area Cities Highways 112A NAD 1983 Transverse Mercator World Topo Provided by ESRI Data Provided by CWCB
228 # # # Lake Fork April 1 Median SWE for the Upper Gunnison Weather Modification Program Aspen « «82 091A 009C Paonia Bowie Somerset # Slate River 24 2A Lazear «92 # # # Crested Butte # 11000ft # Taylor River Taylor Park Reservoir Buena Vista 550 Crawford 50 # # Cimarron Blue Mesa Reservoir # # # «149 Ohio Creek Powderhorn # 285 «135 Gunnison # Tomichi Creek # « # # 50 Poncha Springs 285 Ridgeway Lake Fork # Cebolla Creek # Cochetopa Creek «114 SWE (in) ES 550 «149 # Creede Miles # Manual Generators Upper Gunnison Target Area Cities Highways 112A NAD 1983 Transverse Mercator World Topo Provided by ESRI Data Provided by CWCB
229 ATTACHMENT 8 WESTERN SAN JUAN MOUNTAINS PROGAM
230 This page intended to be blank
231 Western San Juan Mountains Program Operational Weather Modification Program Highlights 2015 Program Summary: Managers: San Juan Resource Conservation and Development Council (SJRC&DC) (Key Contact: Pam Deems) and Southwestern Water Conservation District (SWCD) (Key Contact: Bruce Whitehead) Contractor: Western Weather Consultants, LLC. (WWC), with headquarters in Durango, Colorado, is the contractor for the operational seeding activities of the program, and holds the permit for the Program (Key contact: Larry Hjermstad) Target Area: The Western San Juan Mountains above 9,000 feet mean sea level, including the Dolores River, La Plata River, Hermosa River, Animas River, and Purgatory Ski Area, and has an area of approximately 1,055 square miles as shown on the Program map attached Seeding Equipment and Instrumentation: Up to 25 cloud seeding manual generators Season: Up to 5 months (November through March/April) History: Program resumed operations in 1999 with additional funding support starting in 2006 primarily used to extend the seeding operations beyond the locally funded three month period from November through January each winter season. The added funding has also been used to add an additional generator needed to improve seeding coverage in portions of the Target Area. Permit: State of Colorado Weather Modification Permit No through March 31, 2011, with conditional approval given for future year s operation through the same operational seasons for up to ten years through the operational year Scientific Evaluations: Pursuant to the 2012 State of Colorado Weather Modification Rules and Regulations, North American Weather Consultants, Inc., with headquarters in Sandy, Utah, has completed a target/control evaluation of the Program since 2013 Program Objectives: Augment natural precipitation within the Target Area to provide improved snowpack for ski resort activities and increase the snowpack water supply to improve the potential runoff for water entities Increase supplemental funding each year to pursue new technologies including updating equipment, and to reach a regularly scheduled five month seeding program to maximize benefits. Increase water supply within the upper Colorado River basin Improve the science and techniques in cloud seeding operations in Colorado Increase Colorado's involvement with solutions to Colorado River Basin water supply shortages Program Sponsors: Southwestern Water Conservation District Purgatory Resort Dolores Water Conservancy District Animas La Plata Water Conservancy District Page 1
232 Colorado Water Conservation Board (CWCB), New Mexico Interstate Stream Commission, and the Lower Basin States (Metropolitan Water District of Southern California, Southern Nevada Water Authority, Central Arizona Water Conservation District, and California Six Agency Committee) Program Funding: Funding provided by the ski area may be used to target the ski area as early as November Funds will be used to seed the most productive storms in the remaining portions of the Target Area from December through March/April for all program participants Existing annual funding is not adequate to take advantage of all seeding events, utilization of new technologies and equipment, and/or scientific evaluation opportunities Future Program Enhancements: Instrumentation: Essential to include new meteorological instrumentation in the Program where necessary to assist with seed/no seed decisions o WWC recommends requesting shared use of one Radiometer within the three programs in southwestern Colorado in order to provide an additional resource to document suitable conditions for seeding operations o WWC recommends requesting the continued funding to NOAA for use of the FX NET forecasting workstation o WWC recommends two high intensity precipitation gauges at key locations to better measure and correlate observations at frequently used SNOTEL data sites o When new equipment is incorporated into the program it is essential that on going funding or maintenance agreements are provided to operate, maintain and supply the new equipment Remote Generators: Essential to include additional remote generators in the Program to maximize effectiveness of seeding operations Manual Generators: May be desirable to include additional manual generators for specific areas in the Program where necessary. Use only if carefully reviewed and approved. Liquid Propane (LP) Generators: Evaluate the benefits of propane generators at specific sites specifically for early season ski area benefits Scientific Evaluations: On going scientific evaluations of the seeding effectiveness of the entire seeding program: o Evaluate current generator locations and relocate if necessary to maximize seeding potential o Evaluate current generator sites to determine if they would be better suited for remote generator operations Collaboration: Seek opportunities for shared generator installations with neighboring basins Strategic Planning: Create a 5 year strategic work plan that recognizes needed program modernization as supported by the program costs and priorities reviewed and approved by participants Page 2
233 Miguel River Miramonte Reservoir Cone Reservoir Saltado Creek Western San Juan Mountains Weather Modification Program # «145 San Miguel River # Disappontment Creek Beaver Creek Telluride 550 Groundhog Reservoir # Fish Creek Dunton Silverton Beaver Creek West Dolores River # Rico Animas River Bear Creek # Dolores Dolores River Stoner # «145 # Dolores River Bear Creek # Hermosa Creek # Electra Lake ES «184 # # Trimble # Vallecito 160 Mancos # # # 550 Florida River Vallecito Reservoir Hesperus # Durango # # # # 160 «140 « # # # Bayfield ES Miles Ski Resort Boundaries DURANGO MOUNTAIN RESORT TELLURIDE (SKI RUN PERIM) 550A # Manual Generators Potential Remote Generators Western San Juan Target Area Cities Highways NAD 1983 Transverse Mercator Data Provided by CWCB
234 Miramonte Reservoir Cone Reservoir Saltado Creek April 1 Median SWE for the Western San Juan Mountains Weather Modification Program # «145 San Miguel River Beaver Creek Telluride # Disappontment Creek 550 Groundhog Reservoir # Fish Creek Dunton Silverton Beaver Creek West Dolores River # Rico Animas River Bear Creek # Dolores Dolores River Stoner # «145 # Dolores River Bear Creek # Hermosa Creek # Electra Lake ES SWE (in) «184 # # Trimble # Vallecito Mancos # # # 550 Florida River Vallecito Reservoir # # Hesperus # # Durango 160 «140 « # # # # Bayfield ES Miles # Manual Generators 550A Western San Juan Target Area Cities Highways NAD 1983 Transverse Mercator Data Provided by CWCB
235 ATTACHMENT 9 EASTERN SAN JUAN MOUNTAINS PROGAM
236 This page intended to be blank
237 Eastern San Juan Mountains Program Operational Weather Modification Program Highlights 2015 Program Summary: Managers: San Juan Resource Conservation and Development Council (SJRC&DC) (Key Contact: Pam Deems) and Southwestern Water Conservation District (SWCD) (Key Contact: Bruce Whitehead) Contractor: Western Weather Consultants, LLC. (WWC), with headquarters in Durango, Colorado, is the contractor for the operational seeding activities of the program, and holds the permit for the Program (Key contact: Larry Hjermstad) Target Area: The Eastern San Juan Mountains above 9,000 feet mean sea level, including the Florida River, Pine River, Four Mile Creek, Piedra River, San Juan River, Navajo and Blanco River drainage basins, and has an area of approximately 740 square miles. Seeding Equipment and Instrumentation: Up to 21 cloud seeding manual generators Season: Up to 5 months (November through March/April) History: Program resumed operations in 2001 with additional funding support starting in 2006 primarily used to extend the seeding operations beyond the locally funded three month period from November through January each winter season. The additional funding has also been used to add an additional generator needed to improve seeding coverage in portions of the Target Area. Permit: State of Colorado Weather Modification Permit No through March 31, 2011, with conditional approval given for future year s operation through the same operational seasons for up to ten years through the operational year Scientific Evaluations: Pursuant to the 2012 State of Colorado Weather Modification Rules and Regulations, North American Weather Consultants, Inc., with headquarters in Sandy, Utah, has completed a target/control evaluation of the Program since 2013 Program Objectives: Augment natural precipitation within the Target Area to provide improved snowpack and increase the snowpack water supply to improve the potential runoff for water entities Increase supplemental funding each year to pursue new technologies including updating equipment, and to reach a regularly scheduled five month seeding program to maximize benefits Increase water supply within the upper Colorado River basin Improve the science and techniques in cloud seeding operations in Colorado Increase Colorado's involvement with solutions to Colorado River Basin water supply shortages Program Sponsors: Southwestern Water Conservation District Pine River Irrigation District Florida Water Conservancy District and (4 Ditch Companies) San Juan Water Conservancy District Page 1
238 City of Durango Colorado Water Conservation Board (CWCB), New Mexico Interstate Stream Commission, and the Lower Basin States (Metropolitan Water District of Southern California, Southern Nevada Water Authority, Central Arizona Water Conservation District, and California Six Agency Committee) Program Funding: Funds will be used to seed the most productive storms in the Target Area from December through March/April for all program participants Existing annual funding is not adequate to take advantage of all seeding events, utilization of new technologies and equipment, and/or scientific evaluation opportunities Future Program Enhancements: Instrumentation: Essential to include new meteorological instrumentation in the Program where necessary to assist with seed/no seed decisions o WWC recommends requesting shared use of one Radiometer within the three programs in southwestern Colorado in order to provide an additional resource to document suitable conditions for seeding operations o WWC recommends requesting the continued funding to NOAA for use of the FX NET forecasting workstation o WWC recommends two high intensity precipitation gauges at key locations to better measure and correlate observations at frequently used SNOTEL data sites o When new equipment is incorporated into the program it is essential that ongoing funding or maintenance agreements are provided to operate, maintain and supply the new equipment Remote Generators: Essential to include additional remote generators in the Program to maximize effectiveness of seeding operations Manual Generators: May be desirable to include additional manual generators for specific areas in the Program where necessary. Use only if carefully reviewed and approved. Scientific Evaluations: Ongoing scientific evaluations of the seeding effectiveness of the entire seeding program o Evaluate current generator locations and relocate if necessary to maximize seeding potential o Evaluate current generator sites to determine if they would be better suited for remote generator operations Collaboration: Seek opportunities for shared generator installations with neighboring basins Strategic Planning: Create a 5 year strategic work plan that recognizes needed program modernization as supported by the program costs and priorities reviewed and approved by participants Page 2
239 «62 Eastern San Juan Mountains Weather Modification Program Silverton Creede Rio Grande «149 Animas River South Fork Electra Lake Vallecito Creek # Tacoma Florida River # Vallecito Vallecito Reservoir Piedra River # 160 # 160 # # # # Gem «172 Village «151 # # # Pagosa Springs # Ignacio # «84 «172 Allison Navajo Reservoir # # Navajo River Chromo ES Miles Ski Resort Boundaries DURANGO MOUNTAIN RESORT TELLURIDE (SKI RUN PERIM) WOLF CREEK # Manual Generators Potential Remote Generators Cities Eastern San Juan Target Area Highways NAD 1983 Transverse Mercator Data Provided by CWCB
 0 160 0-5 # # 5-10 # # # Gem «172 Village «151 # # Pagosa Springs # 10-15 15-20 20-25 25-30 30-35 35-40 Ignacio «172 Allison Navajo")
240 April 1 Median SWE for the Eastern San Juan Mountains Weather Modification Program 550 Silverton Creede Rio Grande «149 Animas River South Fork Electra Lake # Tacoma Florida River 160 # Vallecito Vallecito Reservoir # # Vallecito Creek Piedra River SWE (in) # # 5-10 # # # Gem «172 Village «151 # # Pagosa Springs # Ignacio «172 Allison Navajo Reservoir # # «84 # Navajo River Chromo ES Miles # Manual Generators Eastern San Juan Target Area Cities Highways NAD 1983 Transverse Mercator Data Provided by CWCB
241 ATTACHMENT 10 WEST DOLORES AND TELLURIDE SKI AREA PROGAM
242 This page intended to be blank
243 West Dolores and Telluride Resort Ski Area Program Operational Weather Modification Program Highlights 2015 Program Summary: Managers: San Juan Resource Conservation and Development Council (SJRC&DC) (Key Contact: Pam Deems) and Southwestern Water Conservation District (SWCD) (Key Contact: Bruce Whitehead) Contractor: Western Weather Consultants, LLC. (WWC), with headquarters in Durango, Colorado, is the contractor for the operational seeding activities of the program, and holds the permit for the Program (Key contact: Larry Hjermstad) Target Area: The Western San Juan Mountains above 9,000 feet mean sea level in the Upper regions of the West Dolores and San Miguel River drainage basins including Telluride Ski Area, in Dolores, Montezuma and San Miguel Counties, and has an area of approximately 580 square miles as shown on the Program map attached Seeding Equipment and Instrumentation: Up to 20 cloud seeding manual generators Season: Up to 5 months (November through March/April) History: Program resumed operations in 1997 with additional funding support starting in 2006 primarily used to extend the seeding operations beyond the locally funded three month period from November through January each winter season. The additional funding has also been used to add an additional generator needed to improve seeding coverage in portions of the Target Area. Permit: State of Colorado Weather Modification Permit No through March 31, 2013, with conditional approval given for the next five winters through operational season Scientific Evaluations: Pursuant to the 2012 State of Colorado Weather Modification Rules and Regulations, North American Weather Consultants, Inc., with headquarters in Sandy, Utah, has completed a target/control evaluation of the Program since 2013 Program Objectives: Augment natural precipitation within the Target Area to provide improved snowpack for ski resort activities and increase the snowpack water supply to improve the potential runoff for water entities Increase supplemental funding each year to pursue new technologies including updating equipment, and to reach a regularly scheduled five month seeding program to maximize benefits Increase water supply within the upper Colorado River basin Improve the science and techniques in cloud seeding operations in Colorado Increase Colorado's involvement with solutions to Colorado River Basin water supply shortages Program Sponsors: Southwestern Water Conservation District Dolores Water Conservancy District Telluride Ski & Golf Company Page 1
244 Colorado Water Conservation Board (CWCB) and the Lower Basin States (Metropolitan Water District of Southern California, Southern Nevada Water Authority, Central Arizona Water Conservation District, and California Six Agency Committee) Program Funding: Funding provided by ski areas may be used to target their individual ski area as early as November Funds will be used to seed the most productive storms in the remaining portions of the Target Area from December through March/April for all program participants Existing annual funding is not adequate to take advantage of all seeding events, utilization of new technologies and equipment, and/or scientific evaluation opportunities Future Program Enhancements: Instrumentation: Essential to include new meteorological instrumentation in the Program where necessary to assist with seed/no seed decisions o WWC recommends requesting shared use of one Radiometer within the three programs in southwestern Colorado in order to provide an additional resource to document suitable conditions for seeding operations. May fund with other Basin Round Tables. o WWC recommends requesting the continued funding to NOAA for use of the FX NET forecasting workstation o WWC recommends two high intensity precipitation gauges at key locations to better measure and correlate observations at frequently used SNOTEL data sites o When new equipment is incorporated into the program it is essential that ongoing funding or maintenance agreements are provided to operate, maintain and supply the new equipment. This may require increased member support or other funding sources to supplement routine budgets. Remote Generators: Essential to include additional remote generators in the Program to maximize effectiveness of seeding operations Manual Generators: May be desirable to include additional manual generators for specific areas in the Program where necessary. Use only if carefully reviewed and approved. Liquid Propane (LP) Generators: Evaluate the benefits of propane generators at specific sites specifically for early season ski area benefits Scientific Evaluations: Ongoing scientific evaluations of the seeding effectiveness of the entire seeding program o Evaluate current generator locations and relocate if necessary to maximize seeding potential. WWC plans to submit a modeling proposal to the Program Manager Fall 2015 for consideration. o Evaluate current generator sites to determine if they would be better suited for remote generator operations Collaboration: Seek opportunities for shared generator installations with neighboring basins Strategic Planning: Create a 5 year strategic work plan that recognizes needed program modernization as supported by the program costs and priorities reviewed and approved by participants Page 2

245 Redvale West Dolores and Telluride Resort Ski Area Weather Modification Program # # «141 Norwood Gurley Reservoir «145 # «62 Ridgeway San Miguel River Saltado Creek Placerville Miramonte Reservoir Cone Reservoir Sawpit Beaver Creek # «145 Telluride Camp Bird Pandora # Disappontment Creek Bear Creek Ophir town 550 # Fish Creek Dunton Beaver Creek West Dolores River # Dolores River «145 Rico 550 Stoner # # # Dolores Dolores River «145 # Bear Creek # Electra Lake Tacoma ES Miles Ski Resort Boundaries DURANGO MOUNTAIN RESORT TELLURIDE (SKI RUN PERIM) # Cloud Seeding Generators Potential Remote Generators West Dolores and Telluride Resort Ski Area Target Area Cities Highways NAD 1983 Transverse Mercator Data Provided by CWCB
246 ES «141 April 1 Median SWE for the West Dolores and Telluride Resort Ski Area # Weather Modification Program # Norwood Gurley Reservoir «145 San Miguel River # «62 Ridgeway Saltado Creek Placerville Miramonte Reservoir Cone Reservoir Sawpit Beaver Creek # «145 Telluride Camp Bird # Disappontment Creek Bear Creek Pandora Ophir town 550 # Fish Creek Dunton # Dolores Dolores River Beaver Creek West Dolores River Stoner # «145 # # Bear Creek # Dolores River «145 Rico # SWE (in) Electra Lake Tacoma Miles # # Manual Generators West Dolores and Telluride Resort Ski Area Target Area Cities Highways NAD 1983 Transverse Mercator Data Provided by CWCB #
247 ATTACHMENT 11 IDAHO POWER COMPANY CLOUD SEEDING PROGRAM AND EQUIPMENT INFORMATION
248 This page intended to be blank
249 August 5, 2014 Colorado Water Conservation Board 1313 Sherman Street, Room 721 Denver, CO Dear CWCB Members, We understand that your staff is interested in purchasing remotely operated ice nuclei generators from Idaho Power Company (IPC). And, that the equipment would be used to enhance existing and future cloud seeding efforts supported by the CWCB and the Colorado River Seven Basin States collaboration by providing an option to locate ice nucleating generators within optimal terrain and at suitable elevations where nuclei can reach the target and will not become trapped by inversions. Idaho Power is an investor owned electric utility. As such, IPC is not well versed in selling products other than electricity. However, IPC is interested in supporting the advancement of the cloud seeding industry with improved science and equipment, and elevating the success and reputation of cloud seeding programs. Enhancement of existing and future programs like those supported by the CWCB is consistent with that vision. As such, IPC is investigating its concerns related to selling its ice nucleating generators and is currently working towards determining whether it is feasible to sell its equipment to the CWCB. One area of concern relates to rights to the design and intellectual properties of the equipment and its sub-components. The other area of concern relates to the equipment and its functionality outside of IPC s corporate network. A few years ago, Idaho Power undertook a comprehensive redesign of its remote ice nucleating generators that focused on reliability, and streamlining the fabrication, installation, and maintenance of the equipment. As part of that redesign, Idaho Power developed an onboard computer, data logger, and associated software to address the specific needs of the generators control system. The computer software is designed to communicate from within our corporate firewall and with databases within our corporate network. Preparing the generators and control software to operate autonomously and outside of our corporate network is entirely feasible, but it will require time and effort. IPC is putting effort into assessing each of these areas of concern, with an interest in finding a way to support CWCB s efforts. Idaho Power operates a cloud seeding project in the Payette River Basin, where 17 remote generators combined with a seeding aircraft have increased snowpack an average of 14% since And, we have collaborated with the High Country RC&D to place 19 remote generators in Eastern Idaho and Western Wyoming to enhance the RC&D s manual generator program. We are continuing to collaborate with the State of Wyoming as we expand the ground generator network in the upper Snake, and expansion into the Boise and Wood Basins appear very likely. We expect to add 10 additional generators to our network for this season, and anticipate having

250 CWCB Members Page 2 of 2 August 5, 2014 approximately 80 generators in the Snake basin at build-out. Idaho Power is excited and interested to work with the CWCB and the Colorado River Seven Basin States to pursue making its ice nucleating equipment available to enhance programs. With water becoming such a precious resource, it makes sense to utilize the best equipment and technology to make the most of augmenting our water supplies. Our involvement with the North American Weather Modification Council and with the State of Wyoming s research program has revealed that this is a time of unprecedented collaboration and information sharing among the industry. And, a transition from older technologies to industry standard technologies will be an important step for Colorado and cloud seeding throughout the western U.S. Sincerely, Shaun Parkinson, Ph.D, PE


 includes 23 remote-controlled, ground-based generators and two airplanes contracted for")
251 Idaho Power s Cloud Seeding Program What is the purpose of Idaho Power s cloud seeding program? Idaho Power s cloud seeding program increases snow accumulation and provides increased generation at the company s hydroelectric facilities. It also benefits skiers, snowmobilers, agriculture, fish and other wildlife habitat, aquifer recharge and water quality. In what areas does Idaho Power currently conduct cloud seeding? The original program was established to increase snow accumulation in the south and middle forks of the Payette River watershed. In 2008, Idaho Power expanded its cloud seeding efforts by enhancing an existing program operated by a coalition of counties and other stakeholders in the upper Snake River system above Milner Dam. For the winter season, the Central Mountains project (includes Payette, Boise, and Wood Basins) includes 23 remote-controlled, ground-based generators and two airplanes contracted for operations. The program in the Upper Snake River Basin includes 20 remote-controlled, ground-based generators operated by Idaho Power and 25 manual, ground-based generators operated by the coalition. Idaho Power provides meteorological data and weather forecasting to guide the coalition s operations. How long has Idaho Power been involved in cloud seeding? The company has continuously operated a cloud seeding program since How long has cloud seeding been used? The principle of cloud seeding was discovered in 1946 by American chemist and meteorologist Vincent Schaefer. The use of silver iodide to enhance the formation of ice crystals in clouds was discovered only a few days later by noted atmospheric scientist Dr. Bernard Vonnegut. The technology has been used since the late 1940s to enhance precipitation and also to dissipate fog and reduce the size of hailstones.


252 2014 Idaho Power 12/14 Printed on recycled paper. How prevalent is cloud seeding? The latest data from the World Meteorological Organization, compiled in 2000, listed 74 projects ongoing in 23 countries worldwide. In 2001 the National Oceanic and Atmospheric Administration (NOAA) documented 66 projects conducted in the western U.S. A wide range of entities sponsor cloud seeding programs in the U.S. They include municipal, county and state governments; irrigation, water resource and water con servation districts; airports; ski resorts; and private industry. (source: North American Weather Modification Council) Active programs exist in several states, including Idaho, North Dakota, California, Texas, Colorado, Wyoming, Utah, Kansas and Nevada. Is cloud seeding effective? Analyses conducted by Idaho Power since 2003 indicate the annual snowpack in the Payette River Basin increased between 5 and 15 percent (depending on the year, with an average increase of about 14 percent). Idaho Power estimates cloud seeding in the Payette provides nearly 300,000 additional acre-feet of water for the Hells Canyon Complex and the Upper Snake provides approximately 283,000 acre-feet each year for all of hydro projects downstream of Milner. That additional water can generate approximately 193,000 megawatt-hours, or enough to power roughly more than 15,000 homes. Studies conducted by the Desert Research Institute from 2003 to 2005 support the effectiveness of Idaho Power s program. How does cloud seeding work? Idaho Power seeds clouds by introducing additional ice nuclei (silver iodide) into winter storms. The additional ice nuclei increase precipitation from passing winter storm systems. If a storm has water vapor and appropriate temperatures, the conditions are optimal for cloud seeding to increase precipitation. Idaho Power uses two methods to seed clouds: 1) ground generators at high elevations, or 2) airplanes that release special flares into storm clouds. Either method successfully releases silver iodide into passing storms. Minute water particles within the clouds freeze on contact with the silver iodide particles and eventually grow and fall to the ground as snow. Is it safe? Silver iodide has been used as a seeding agent in numerous western states for decades without any known harmful effects. Silver iodide is insoluble in water which is a characteristic that keeps it from having harmful effects. Doesn t cloud seeding in one area decrease precipitation in other areas? Research indicates that there is no evidence that cloud seeding in one location causes a reduction in precipitation in neighboring areas. During a storm a relatively small portion of the airborne water vapor falls to the ground as precipitation. Cloud seeding increases that amount slightly, leaving most of the water vapor still present in the storm system. The additional precipitation that does fall is not lost from the water cycle. Typically, a well-run cloud seeding program would affect less than 1 percent of the water vapor in the atmosphere. Is there any environmental oversight? Idaho Power works closely with federal, state and local authorities to ensure our cloud seeding operations comply with all relevant environmental and land-use guidelines. For more information, contact: North American Weather Modification Council nawmc.org Weather Modification Association weathermodification.org Shaun Parkinson, PE, PhD Water Resources Leader, Idaho Power sparkinson@idahopower.com Derek Blestrud Meteorologist, Idaho Power dblestrud@idahopower.com


.")

 allow")

 & burn chamber")
 Communications via satellite modem Bluetooth")
 communicates via Internet to")


253 Idaho Power s RCNG14 Standardized Features: Acetone based AgI solution Swivel burn head, ignition coil, flame temperature, Shaped rime shroud Rime heater Propane fired burn chamber, back plate geometry and Spraying Systems atomizing nozzle tested at CSU cloud chamber optimized for AgI particle generation Shaped rime shroud, Flow Rate 20 gm/hr AgI, 0.33 gph solution Features Unique to IPC RCNG s Freestanding tower design 28 tall, footprint approx. 22 dia., weight 850 lbs wet designed to withstand winds of 75 mph and dynamic fall loadings of 900 lbs. IPC developed this tower to promote safety, simplicity of transport to field and setup effort. And, to limit site preparation and disturbance. Swivel head orients burn chamber down wind, improving ignition in wind. Shaped rime shroud and rime heater to promote firing during icing conditions. Valve box location is near the burn chamber to enhance purge cycle effectiveness. Flow control uses nitrogen pressurized solution and orifice (no needle valves). Mass flow meter to monitor flow solution flow rates Integrated platform elevates consumables above snow, and variable length struts allow leveling on uneven ground. Cartridge style DOT certified solution tanks (10 gallon) allow container to remain sealed from point of fill to point of consumption or disposal. IPCdeveloped on boardcomputer controlsystemto to control: Control valve box (propane, nitrogen, and solution flow) & burn chamber ignition Monitor flow rates, flame temp, propane, and weather T, P, RH (wind optional) Communications via satellite modem Bluetooth enabled for onsite operation with Android app (or, Trimble Recon) Workstation interface (Niveum) communicates via Internet to satellite modem, relaying commands to individual generators, and display machine status and weather parameters to operator. Unified wire harness with automotive weather pack connectors and sealed ECU computer housing Modular design allows quick replacement of components Typical Maintenance interval 40 hrs of run time. Testing Aerosol from burn chamber tested for particle size distribution Ice nucleating particle production measured and compared to WMI remote generator, and an original Sky Fire generator (originally tested in CSU cloud chamber). Provides baseline with chamber tested unit. Weather Sensors Solar Panels Computer Box Work Platform Valve Box Tower Satellite Modem Solution and Nitrogen Tanks Batteries Propane


254 Android Control Interface Control of RCNG via Bluetooth Status ofrcng via cell, Internet, Bluetooth Niveum Interface Control and status of each RCNG, grouped by project Status of generators in a list format Ability to start/stop select generators (Virtual Al) Maintenance summary of equipment Nozzle time, AgI remaining, LPG status, last service, notes (can be populated with Android device), runtimes Display meteorological data at RCNG(s), by unit, by elevation, by parameter


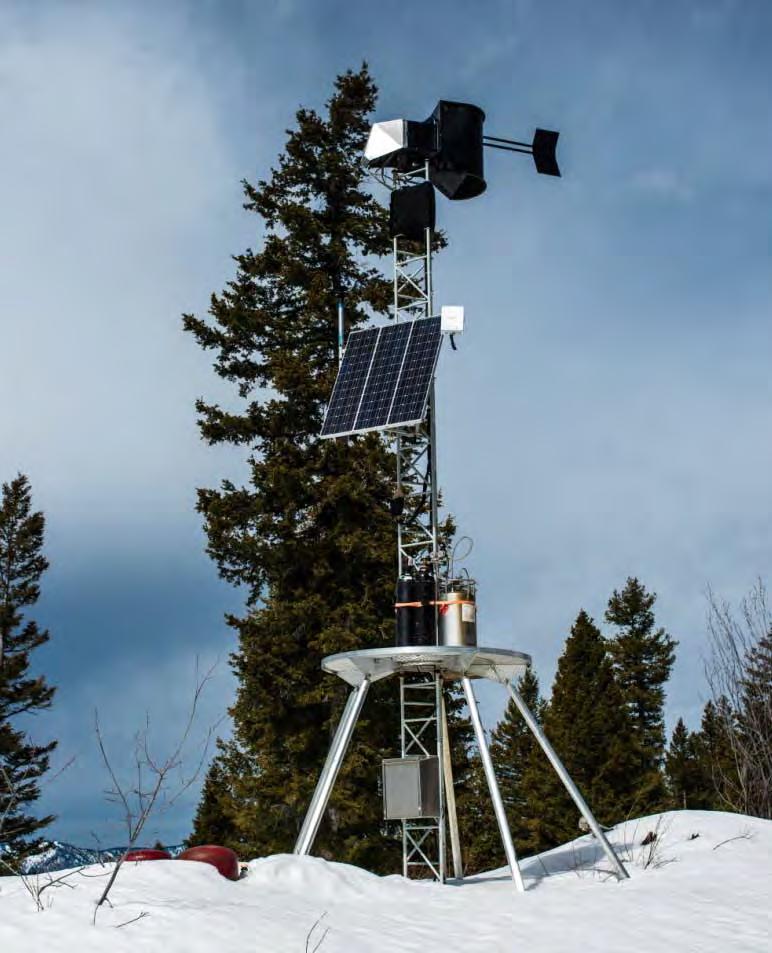
255 Idaho Power Company Summary Description of RCNG14 April 2015 { DOCX; 1} 1
256 Background The Sate of Colorado s Water Conservation Board, CWCB, desires to make state of the art cloud seeding generators available to winter cloud seeding projects in Colorado. The CWBC has requested a proposal from Idaho Power Company (IPCO), to sell IPCO developed cloud seeding generators. The terms provided below apply to the sale of one complete IPCO generator, RCNG14, associated equipment, software to control the generator both on-site and remotely plus services to integrate them into Colorado s program. Specific elements include: One complete RCNG14 Satellite communication hardware and direction to use Rignet as a Sat service provider (service cost payable by the apparatus owner) License to cloud-based control software for operations and local software for maintenance Delivery and training Maintenance supplies and training Documentation Limited one year warranty RCNG14 IPCO s latest iteration of a remote operated cloud seeding generator has evolved since our first foray into cloud seeding in the 90 s. Generator heritage can be traced back to Colorado State University s cloud chamber and work done by investigators to establish Silver Iodide, AgI, production and performance. As such, the AgI solution atomizing nozzle and back-plate geometry use industry standards established by that work such that AgI particle size and numbers are produced with a high degree of confidence. This is achieved using a Spraying Systems 1/8j SS nozzle at a constant flow rate of.33 gph and a 2 percent AgI concentration with perchlorates added to achieve the desired burn temperature and release rate. These values produce an AgI release rate of 20 grams per hour. With that as a base little else is the same as when IPCo s program got started. Performance and reliability have been constantly enhanced to produce the lowest cost, easiest to maintain generator in the industry. The tower is a two piece, 24 foot tall lattice structure with an aluminum work platform 8 feet above the ground. The burn chamber is fitted to the top of the tower and sits upon a swivel that allows the head to follow winds through 120 degrees ensuring the flame stays even and consistent in winds exceeding 40 knots. A rime shroud and a rime heater are included with the swivel head so the generator can be reliably fired. Five 4.5 diameter aluminum adjustable legs for uneven terrain on a 20 foot dia footprint support the entire structure. Nitrogen for pressure and purge cycling plus 10 gal, stainless steel, DOT tested, solution tanks which may be ganged from one to three using quick connect hoses sit on the work platform. Fluid and gas delivery is through a valve box, inset into the tower just below the head and housed in an aluminum shell, containing 4 magnetic latchkey valves, a thermal, non-intrusive flow meter and performance sensors for pressure and head temperature. Flow rate is controlled via N2 pressure on solution through a laser pierced, sized stainless steel orifice. An IPCO developed control computer sits at platform level powered by batteries in an aluminum box below the platform and an adjustable solar array at mid tower. The computer drives the tower through a unified control harness and communication with the outside world is through an omni-directional satellite modem and blue tooth for local control during maintenance and setup. The entire package weighs about 600 lbs ready to fire, assembles with around 30 bolts and can be completed by a two man crew on unprepared ground in about 2.5 hrs. Training and manuals for set up and operation as well as requirements for on-going maintenance will be provided. What is not included in the sale is site procurement, batteries, and propane and nitrogen tanks. Recommendations, however, will be made for these items to be sourced locally. { DOCX; 1} 2
257 Communication and Control Direct communication with the tower is done through the provided Skywave satellite modem. Customer will be responsible for setting up a contract with RigNet communication services for the satellite service itself and for all associated costs. Control software will be provided through Azure cloud computing services and is based on the IPCO developed software Niveum. At its most basic level simple controls for turning on and off the generators remotely, real time status reporting and advanced controls for individual control of valves to trouble shoot potential issues is provided. In addition, accounting capabilities of the software include solution consumption, trend tracking of generator performance and consumables as well as recording runtimes, maintenance notes and history. Also provided is an Android based control app which can be used with the end users data phone or any android based hand held device with blue tooth capabilities. The local control software communicates directly with the generator and provides individual control as well as start and shut down sequences. Performance statuses are also reported to provide individual tuning of the generator during set up. Delivery, Training and Maintenance An IPCO team will deliver the generator and all supporting hardware and documentation to the end user. A two-day seminar including set up and operation will be conducted. The RCNG14 will be warranted for manufacturer defects for one year from the date of purchase. Software support including satellite communication troubleshooting will be provided also for that year. All consumables are the responsibility of the end user. AgI solution may be provided by IPCO or mixed by the end user but chemistry must follow IPCO recommendations or generator performance cannot be guaranteed and the warranty voided. An initial annual servicing to the valve box and other components will be provided. After the first year all service and upgrades will be provided at market price. Anticipated Costs Estimated costs, prior to applicable taxes, are as follows: [REDACTED] Note: The above estimated costs are estimates only. Idaho Power does not warrant or guarantee the estimated costs included above, which are subject to change. Further, this document is a preliminary description only and does not constitute, or form the basis of, a definitive agreement related to the purchase or sale of any goods or services. Unless and until a definitive purchase agreement is negotiated and executed by Idaho Power and an interested party, no party will have any legal rights or obligations, express or implied, related to the subject matter of this document. { DOCX; 1} 3
258 This page intended to be blank
259 ATTACHMENT 12 DESERT RESEARCH INSTITUTE CLOUD SEEDING RESEARCH AND SERVICES
260 This page intended to be blank


261 OMNIA PRO PATRIA NEVADA SYSTEM OF HIGHER EDUCATION WEATHER MODIFICATION PROGRAM CLOUD SEEDING RESEARCH AND SERVICES DRI has over 40 years of experience conducting weather modification research and providing custom cloud seeding services in the Western U.S. DRI s pioneered many of the techniques that are routinely used by cloud seeding programs around the world, including design of silver iodide (AgI)seeding generators, use of ultra- trace chemical snow analysis to verify seeding materials are transported into the targeted area, and development of an advanced more effective AgI-based seeding formulation. DRI currently conducts winter storm and hydrological research and cloud seeding site selection in Wyoming, and operational programs in Nevada, California, and Colorado using ground-based and airborne-cloud seeding systems. DRI also continues to conduct research to improve the effectiveness and utility of cloud seeding to enhance water resources in the desert. CUSTOM PROGRAM DESIGN Feasibility assessment based on climatological data and atmospheric modeling Selection of methods (ground or airborne seeding) and preliminary program design Precipitation enhancement assessment including hydrologic analysis Field surveys for proposed ground seeding generator sites Regulatory/policy assessment Deployment/operational budget and cost-effectiveness analysis PROGRAM DEPLOYMENT Procurement/manufacturing of equipment and supplies Satisfying regulatory/policy requirements Deployment of field equipment and staging for airborne seeding Establishment of standard operating procedures OPERATIONS 24/7 forecasting and data analysis to determine seeding activities Remote initiation and secession of seeding Routine and as-needed equipment maintenance and resupply Periodic activity/data analysis, efficacy assessment, and reporting ENHANCED EVALUATION APPROACHES Randomized seeding design approach Ultra-trace snow chemistry to assess targeting of seeding agents Enhanced cloud microphysics and meteorological instrumentation to verify seeding operations criteria Assessment using atmospheric modeling with advanced cloud and precipitation microphysics 1865 CONTACTS Frank McDonough Division of Atmospheric Sciences THE DESERT RESEARCH INSTITUTE IS PART OF THE NEVADA SYSTEM OF HIGHER EDUCATION. Low altitude 70 gallon Agl generator High altitude 120 gallon Agl generator LP dispenser 500 gallons High altitude dual burner 140 gallon Agl generator FACILITIES High-resolution atmospheric climate and weather forecast modeling from the latest WRF model, run on the 80 node 640 computing core DRI cluster Complete ground generator fabrication/maintenance shops Fully staffed 24/7 operations/communications center with access to a wide variety of real-time meteorological data sets including; surface, upper air, radar, pilot reports, and satellite data, as well as forecast modeling to active seeding activities frank.mcdonough@dri.edu RENO CAMPUS: 2215 Raggio Parkway, Reno, NV PHONE: WEBSITE:
262 DRI CLOUD SEEDING SYSTEMS AND EQUIPMENT DRI CLOUD SEEDING GENERATORS PURCHASE ANNUAL LEASE CONSUMABLES PRICE PRICE PACKAGE EXPLORE MORE AT DRI.EDU DRI CLOUD SEEDING FORECASTING AND OPERATIONAL SUPPORT CLOUD SEEDING SERVICES PER NETWORK PER WATER YEAR DRI Labor for Forecasting, Operation of Generators, and Reporting PRICE $39,200 Reporting includes two operational reports and one final report Forecasting and operations include 24/7 monitoring of weather conditions during one winter season. The following services are not included in the service price: program design siting deployment instrument installment and maintenance enhanced evaluation approaches atmospheric modeling. QUOTE FOR THESE SERVICES IS AVAILABLE UPON REQUEST. PLEASE CONTACT: Frank McDonough High Altitude Portable Generator 120 gallons/ with flow controller $56,820 $12,500 $11,039 consumables pkg (AgI-120 gal, 2 N2 cylinders, LP-350 gal) Dual Burner High Altitude Portable Generator 140 gallons/ flow controllers $81,893 $15,100 $13,212 consumables pkg (AgI-140 gal, 2 N2 cylinders, LP-700 gal) Low Altitude Portable Generator 70 gallons/ with flow controller $50,098 $11,800 $6,865 consumables pkg (Agl/70 gal, N2x2, LP 250 gal + rentals LP Dispenser 500 gallons $10,523 $2,500 $2,546 LP consumables pkg. (500 gal LP and Methanol)+ rental Annual lease price includes generator, pre- and mid-season maintenance, and data retrieval. Price does not include DRI travel time and costs to site location and consumables. Consumables Package includes cost to fill generator one time. Consumable price will provide approximately 2.44 hours of operation per gallon of CSS in optimal conditions. Additional price quote for generator parts and supplies is available upon request. COMMUNICATION PACKAGES requires power supply and may require tower Cell Comms system $1,442 Base Station system $3,102 Radio system (requires base station) $1,869 Modem land line Comms $1,242 Satellite system $4,973 Comm Box only $710 Solar Comm Box with battery and charger $1, v Comm Box with battery and charger $933 Relay tower Comm box $4,510 Service plan and monthly fees are dependent on site location and are not included in price. DRI will assist in selecting communication package options based on site location. WEATHER STATIONS AND SENSOR PACKAGES may require power supply, datalogger, Comms pkg, tower/pedestal Wx station Wind Direction/Wind Speed $2,019 Wx station W/D W/S heated/ requires 120vac $4,079 Option: Freezing rain detector/ requires 120vac $8,144 Precipitation gauge ETI $6,131 Precipitation gauge Geonor 1500 mm $10,404 Camera w/8gb card heated $3,858 Ceilometer $35,769 Datalogger $2,119 TOWER AND STANDS Tower per 10 section w/guys $1,058 Tower base on 2 x2 concrete pad $1,735 6 crossarm $410 Geonor Pedestal 2.5 m $1,685 Pedestal base on 2 x2 concrete pad $1,489 All prices are subject to change. PRICE PRICE PRICE


263 Cloud Seeding FACT SHEET» 40+ years of cloud seeding research experience in Nevada s watersheds makes DRI uniquely qualified to design and conduct operational projects for these same watersheds.» Scientific studies support that DRI s method of cloud seeding enhances local snowfall and resulting snowpack levels.» DRI pioneered the technique of using trace chemical analysis of snowfall to assess both environmental impacts and the effectiveness of cloud seeding.» The trace chemical technique was used to show that cloud seeding operations produced a seasonal 8 percent increase in the snowpack across a specific watershed.» A National Academy of Sciences report noted that wintertime cloud seeding, as done by DRI, showed strong suggestions of positive seeding effects.» DRI obtained $2.5 million in federal grants to establish the scientific basis for cloud seeding in the Sierra Nevada and to develop the tools with which to conduct cloud seeding and evaluate its impact prior to launching the program that is currently in place.» For 25 years, DRI provided more than 40 percent of the $1 million it has cost to run the program annually.» DRI scientists estimate that annual augmented snow water has averaged 64,000 acre-feet during the last 15 years. That s enough to supply 140,000 households with water annually. The state-funded program cost was $7 $15 per acre-foot.» DRI runs an extremely efficient operation with three technicians with a combined 50 years of experience running the programs in Northeastern Nevada, the Walker-Carson Area and Tahoe-Truckee region + active participation in several Colorado projects.» There are no detrimental downwind impacts by cloud seeding operations. In other words, cloud seeding does not diminish snowfall in basins beyond where operations occur. CONTACT Arlen Huggins, Associate Research Scientist 2215 Raggio Parkway, Reno, NV OFFICE: 775/ Arlen.Huggins@dri.edu WEBSITE:

264
265 ATTACHMENT 13 RADIOMETRICS CORPORATION RADIOMETER INFORMATION INCLUDING 2014 CWCB PURCHASE QUOTE
266 This page intended to be blank


 Liquid Density (gm")


267 Continuous radiosonde-like temperature and humidity soundings Liquid density soundings Optimal cloud seeding target identification All-weather RAOB software ( Liquid Density (gm -3 ) Portable, rugged, easy to install, operate and maintain RAOB software ( m.nelson@radiometrics.com (303)

268 The Colorado Water Conservation Board operates an MP-3000A radiometer yearround to aid water management. The radiometer was located near Vail Pass during the winter to support cloud seeding agencies. It is currently installed in Pagosa Springs Colorado where it will be co-located with a weather radar and used to support severe weather forecasting. Live sounding plots are available in real-time here: The radiometer detects temperature and water vapor and liquid in the atmosphere from the ground to an altitude of about six miles above ground. These atmospheric profiles help forecasters determine threats from incoming weather systems. The radiometer can detect the presence of liquid before the radar can see it, thus providing warning far in advance for severe weather. The plot above is a common radiometric RAOB plot showing temperature, liquid and cloud cover. There are many weather needs that radiometers address, from augmenting weather balloon soundings for data to feed into data-hungry weather models, to fog predictions, to air quality measurements and predictions, to utility load forecasting and wind farm management, to a variety of proprietary applications. See our website for more information:

269

270


271
272 This page intended to be blank
273 ATTACHMENT 14 DRAFT EXECUTIVE SUMMARY WYOMING WEATHER MODIFICATION PILOT PROGRAM LEVEL II STUDY DECEMBER 2014
274 This page intended to be blank


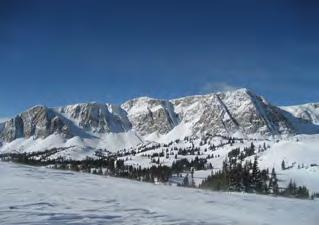
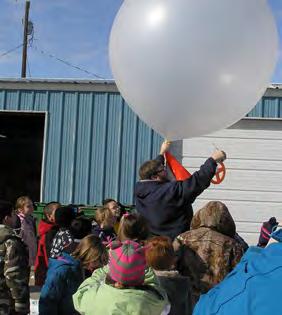


275 DRAFT EXECUTIVE SUMMARY The WYOMING Weather Modification Pilot Program LEVEL II STUDY PREPARED FOR WYOMING WATER DEVELOPMENT COMMISSION 6920 YELLOWTAIL ROAD, CHEYENNE WY SUBMITTED BY DECEMBER 2014
, the Wyoming Water Development Commission (WWDC) funded the WWMPP (2005-2014) as a")
276 DRAFT EXECUTIVE SUMMARY The Wyoming Weather Modification Pilot Program (WWMPP) was conducted to assess the feasibility of increasing Wyoming water supplies through winter orographic cloud seeding. Following a Level II feasibility study that found considerable potential for cloud seeding in the state (WMI 2005), the Wyoming Water Development Commission (WWDC) funded the WWMPP ( ) as a research project to determine whether seeding in Wyoming is a viable technology to augment existing water supplies, and if so, by how much, and at what cost. The WWMPP then established orographic cloudseeding research programs in three Wyoming mountain ranges considered to have significant potential: the Medicine Bow, Sierra Madre, and Wind River Ranges (Figure 1). Figure 1. Map of WWMPP facilities (see legend) in the Wind River (left, blue shaded box on inset map) and the Medicine Bow and Sierra Madre Ranges (right; purple shaded box on inset map). Orographic cloud seeding is a technology designed to enhance precipitation in winter storms with an inefficient precipitation process due to a lack of natural ice nuclei. This inefficiency allows supercooled water to persist for long periods instead of being depleted by ice crystals, which grow and fall as snow. This fact is well documented by the measurement of sustained supercooled liquid water in orographic clouds taken by aircraft and ground-based instruments, such as radiometers. In contrast to natural ice nuclei, artificial ice nuclei, such as silver iodide, will nucleate substantial numbers of ice crystals at subfreezing temperatures of 8 C (+17 F) and cooler, creating ice crystals in clouds that are typically too warm for natural ice formation. In the presence of supercooled water droplets, these ice crystals rapidly grow into larger particles that fall to the ground as snow. The technology of orographic cloud seeding uses ground-based generators to produce a silver iodide plume, which is then transported by the ambient wind into orographic clouds to increase precipitation. This process of seeding clouds to create additional snow is complex and to date has not been scientifically verified in well-designed statistical tests. 1
277 Two independent contractors were retained by the WWDC to conduct the WWMPP. The seeding operations were performed under a contract with Weather Modification, Inc. (WMI), while the evaluation activities were separately contracted with the Research Applications Laboratory of the National Center for Atmospheric Research (NCAR). Additional contributors to the project included the University of Wyoming (Department of Atmospheric Science, Department of Botany, Department of Civil & Architectural Engineering, and the Office of Water Programs), the Desert Research Institute (DRI), Heritage Environmental Consultants, the University of Alabama, the University of Nevada Las Vegas, and the University of Tennessee. A Technical Advisory Team (TAT) was established early during the project to provide guidance to the Wyoming Water Development Office on the oversight of the program. The TAT facilitated numerous collaborative efforts and data/resource sharing activities during the project. Similarly, local stakeholders were engaged from the program s onset and throughout the life of the project, which was a valuable contribution to the project s overall success. Design of the WWMPP The primary goal of the WWMPP was to design and conduct a scientific evaluation of winter orographic cloud seeding. Following guidance from the National Research Council (NRC) 2003 report on weather modification, the evaluation was designed to combine physical, statistical, and numerical modeling studies of environmental, microphysical, and hydrological systems to evaluate the impacts of cloud seeding and determine its economic feasibility. The evaluation was primarily focused on the Medicine Bow and Sierra Madre Ranges where the statistical evaluation was conducted; however, there were additional evaluation components that focused on the Wind River Range. The main effort in this evaluation was the design, implementation, and completion of a Randomized Statistical Experiment (RSE) to test orographic cloud seeding using a response variable measured by high-resolution snow gauges. In addition to the RSE, the evaluation included physical and modeling studies. These tasks required: permits for siting seeding generators and instruments; numerical modeling studies; physical measurements of silver iodide; verification of silver iodide targeting; establishing the climatological context of seeding opportunities; hydrological modeling of cloud-seeding impacts; monitoring silver in the environment; and studies of extra-area effects. This executive summary is an overview of the final report describing the completion of these tasks. Based on the conclusions and recommendations of the Level II feasibility study (WMI 2005), and on the resource allocations included in the WWMPP, an iterative design process resulted in a final design (NCAR 2008) that established the RSE, spanning six winter seasons ( ). The design process involved peer reviews, changing and adding facility locations, numerical modeling to verify seeding generator deployment, collecting additional data, and preliminary seeding operations. To meet acceptable scientific rigor for statistical evaluation, the final design required that the analyses and procedures for the RSE be specified a priori (prior to beginning operations for the experiment). This design was published in Breed et al. (2014). In addition, a number of physical and numerical modeling studies were conducted to support the RSE evaluation. The RSE evaluation was based on randomly seeding one or the other of the Medicine Bow and Sierra Madre mountain ranges. Since the two mountain ranges are often affected by the same storms, treating them independently was not statistically appropriate. Therefore, a crossover experiment was designed, in which one range was randomly selected for seeding while the other range served as the control 2
278 (unseeded) comparison. When snowfall in two areas is correlated, treating them in a crossover experiment can decrease the number of cases needed for statistical analysis by a factor of two or more. The criteria for case selection followed the conceptual model of ground-based seeding of winter orographic storms, which required 1) a temperature colder than -8 C (+17 F) near mountain top, 2) a wind direction to transport the silver iodide into the targeted clouds, and 3) the presence of supercooled liquid water. The facilities needed for operations and evaluation (see Figure 1) included an atmospheric sounding unit, microwave radiometers, ground-based seeding generators, high-resolution snow gauges located in target areas as well as control areas (that would not likely be impacted by cloud seeding), and a highresolution weather forecast model for forecasting the atmospheric winds, temperatures, stability, and supercooled liquid water prior to calling experimental cases. The seeding periods ( cases ) for the RSE were 4 hours long and the response variable was the 4-hr accumulation of precipitation. The test statistic for the WWMPP design was the root regression ratio (RRR), which is essentially the ratio of seeded to unseeded snowfall with adjustments for the controls (i.e. the estimate of snowfall that would have occurred naturally). Estimates of the number of cases needed for statistical significance using data collected prior to the experiment suggested that changes in precipitation of 15% (and possibly 10%) should be detectable in a five- to six-year program, assuming cases per year. This estimate seemed reasonable based on precipitation records and modeling of the season. Federal permitting was required to obtain a special use permit to site cloud-seeding generators and snow gauges on Federal lands. This included the National Environmental Policy Act (NEPA) process with the U.S. Forest Service (USFS) involving public comment, and consultation with the U.S. Fish and Wildlife Service under Section 7 of the Endangered Species Act. A Categorical Exclusion was prepared under the NEPA process, resulting in the issuance of the Special Use Permit by the USFS in August This permit was subsequently renewed in December Permits from the Wyoming Office of State Lands and Investments were also required to site cloud-seeding generators on State lands. The Wyoming Game and Fish Department was consulted as part of the State permitting process. Permission was granted by several private landowners to place cloud-seeding generators and other instruments used for monitoring and evaluation on their lands. Prior to each season, cloud-seeding permits were also obtained from the Wyoming State Engineer s Office and reports sent to the National Oceanic and Atmospheric Administration Office of Atmospheric Research. In the six winters during which randomized seeding was performed under the final RSE design, 154 experimental cases were conducted (Figure 2). In the Wind River Range, 131 ground-based seeding events of varying duration were conducted. Seeding-suspension criteria were established for all of the target areas prior to the project to prevent seeding when heavy snowpack or other potentially hazardous conditions developed. Suspension criteria were met three times during the project in the Medicine Bow/Sierra Madre target areas (see Figure 2). 3
279 Physical, Statistical, and Modeling Analyses The evaluation of the project followed the NRC 2003 report guidelines to combine physical, statistical, and numerical modeling studies of cloud seeding. The evaluation results are based on an accumulation of evidence from all three of these areas. Physical Studies Trace chemical analysis of snow samples from the WWMPP target areas was performed prior to and throughout the WWMPP to determine whether silver from silver iodide cloud seeding was being incorporated into snowfall. Ideally, enhanced snowfall from Figure 2. Cumulative number of seeding cases in each of the six seasons of the RSE. Time periods when suspension criteria were met are indicated in red, during which time no new seeding cases were conducted. cloud seeding should be accompanied by enhanced silver concentrations to levels greater than background values that varied, by WWMPP season, from less than 2 to about 5 parts per trillion. This correlation between enhanced precipitation and silver concentration was confirmed in a recent cloudseeding program in Australia. Silver concentrations from snow samples collected during the WWMPP were quite variable, and at times, were complicated by silver intermixed in dust that is sometimes deposited naturally in the snow. Although silver concentrations during seeding periods were generally lower than those found in Australia, there was success in linking enhanced silver concentrations to RSE case periods in the Medicine Bow and Sierra Madre targets, and to the non-randomized seeding in the Wind River Range. A particularly significant environmental finding was that cloud seeding did not broadly increase the average silver concentration in the snowpack to levels above the pre-wwmpp background concentrations. Ground-based measurements of silver iodide particles from ground-based seeding were made near the Medicine Bow target snow gauge site with an acoustic ice nucleus counter (AINC) during the first three project years ( , , ). These measurements confirmed that silver iodide ice nuclei reached the intended target when seeding was conducted in the Medicine Bow Range (Boe et al. 2014; Xue et al. 2014), as well as on some occasions when seeding was conducted upwind in the Sierra Madre Range. The latter result had been raised as a possibility by external reviewers of the initial experimental design, and the measurements of AINC were undertaken to address this question from the review. This result has important implications for the RSE, since seeding from the upstream range impacts the ability of the downstream range to serve as a control for the RSE, as specified in the crossover design. Based on these AINC results the seeding operations were changed to allow a longer clearance period between consecutive experimental cases. Nonetheless, at the time the AINC measurements were 4
280 collected, the impact on precipitation on the downwind barrier was believed to be minimal, although it was understood that it would dilute the magnitude of the response variable. A University of Wyoming study conducted in parallel with the WWMPP, with funding from the University of Wyoming Office of Water Programs, used an aircraft to study physical evidence of seeding impacts over the Medicine Bows (Geerts et al. 2010). The study estimated up to a 25% increase in precipitation for 7 lightly precipitating storms, a small sample set. Additional funding for such aircraft studies was then obtained from the National Science Foundation for two additional years of measurements, also taking advantage of the cloud seeding opportunities provided by the WWMPP. These subsequent measurements did not replicate the considerable seeding effect observed in the initial sample set, although there was still an overall enhancement in the radar signature in the seeded clouds. These differences between the two studies highlight the difficulties of using a very limited sample set, where the seeded clouds are known a priori, to make broad conclusions, and emphasizes the need for randomized blind statistical tests on a large number of seeding cases, such as the WWMPP RSE. Modeling Studies High-resolution Weather Research and Forecasting (WRF) modeling studies were conducted using an NCAR cloud-seeding module (Xue et al. 2013a, b) to simulate the seeded cases from the RSE including simulating silver iodide plumes in the model based on actual generator operations during the , , and seasons. The model was verified using radiometer, snow gauge, and sounding data and shown to perform reasonably well for most of the cases. An important discrepancy in model performance occurred in the timing of supercooled liquid water and affected about one-third of the cases. While not perfect, the model can be used to provide insight into critical questions such as unintended downwind seeding effects and overall seeding impact. The NCAR cloud seeding module was used to evaluate the impact of seeding by comparing model runs with simulated seeding to control runs without seeding for three seasons of the RSE cases. The results indicated that the targets in both mountain ranges experienced simulated seeding effects between 10 to 15%. Although these model simulations are encouraging, a model analysis of the full six years of RSE cases was beyond the scope of the project. If the RSE statistical results could be replicated by modeling the six years of RSE cases, confidence in the model s ability to simulate seeded clouds would be established. This would then allow additional analysis of the physical processes important to the RSE results. Statistical Studies Prior to completing the statistical analysis, careful quality control procedures were developed and performed on the snow gauge data by personnel without knowledge of the seeding decisions. A critical component of the program design was that each target and control site had three snow gauges, which provided redundant data for the quality control methodology. Of the 154 RSE cases conducted, 118 were included in the primary statistical analysis after removing 36 cases that did not pass the snow gauge data quality control (23) or did not have the required operational generators available (13). The primary statistical analysis yielded a RRR of 1.03 and a p-value of These results imply a 3% increase in precipitation with a 28% probability that the result occurred by chance. Since the p-value is 5
281 greater than 0.05, the primary statistical analysis indicated no significant seeding effect. Further analysis, however, suggested that two factors influenced this result: 1) the occurrence of unintended downwind effects on the Medicine Bow by seeding over the Sierra Madre; and 2) insufficient amounts of silver iodide reaching the intended target. The modeling studies identified 18 RSE cases with unintended downwind seeding impacts on precipitation over the Medicine Bow Range. Eliminating those 18 cases from the snow gauge data set increased the RRR to The ground-based AINC measurements indicated that silver iodide reached the Medicine Bow target in 21 Sierra Madre seeding cases. Eliminating these 21 cases from the snow gauge data set increased the RRR from 1.03 to We believe these differences result from the fact that the presence of silver iodide at the surface does not necessarily indicate enhanced precipitation. To have an effect on precipitation, silver iodide is needed at cloud level and may not be reflected by a measurement at the surface. In contrast, the model evaluation of downwind impacts was based directly on the differences in precipitation between control and seeded simulations, therefore we would expect the cases eliminated by the model to have a greater impact. These results suggest that unintended downwind seeding of the Medicine Bow by the Sierra Madre cases impacted the primary statistical analysis used to evaluate the project. The number of seeding generators run per case varied based on wind direction requirements in the final design or on operability of the generators. This resulted in cases having less than the maximum of 32 generator hours (the combined number of hours that all operational generators were run, which is proportional to the total amount of seeding agent released per case). When the snow gauge data were stratified by generator hours, the value of RRR increased from 1.03 to as high as 1.17 for the 62 cases that included at least 27 generator hours of seeding. This result suggests that a sufficient amount of seeding agent is necessary to produce a detectable seeding effect. Because these results were reached through multiple stratifications of the RSE data to achieve a positive result, and used covariates that were not specified a priori for the statistical study, these latter results cannot be claimed to be statistically significant. Although for data stratification the p-value cannot be used to claim statistical significance, it can be used to evaluate the strength of a particular stratification of the RSE data. Using such a posteriori analysis of statistical data to achieve a desired result is known as multiplicity. While recognizing the statistical issues related to multiplicity, the RSE data were stratified based on reasonable physical considerations, and the results suggest that the primary analysis would likely have indicated a positive seeding response, if these factors were anticipated and accounted for in the experimental design. These stratifications of the RSE data suggest that the primary analysis was impacted by unintended downwind seeding effects on the Medicine Bow as a control during Sierra Madre seeding and by an insufficient number of generator hours for some cases. 6

282 Accumulation of Evidence Combining the results from physical, modeling, and statistical studies provides a way to accumulate evidence to develop the assessed seeding effect estimate (Figure 3) following the NRC report guidelines. By far the largest impact on the estimated seeding effect from the statistical results was eliminating cases with low seeding generator hours. This result is consistent with the recent orographic cloud seeding results from Australia that showed, based on a posteriori analysis, an increase of ~14% in precipitation as a result of silver iodide seeding when evaluated on the covariate of seeding generator hours greater than a threshold signifying wellseeded cases (Manton and Warren 2011). Without including a generator hour threshold, the primary statistic based on a priori analysis in the Australia project indicated a 4% increase, similar to the RSE primary analysis. The accumulated evidence from the statistical, modeling, and physical studies suggests a positive orographic seeding effect, over a winter season, between 5 and 15% in the Medicine Bow and Sierra Madre Ranges, for seedable cases based on the RSE criteria and for which sufficient ground-based silver iodide seeding was achieved (Figure 3). Climatology of Seeding Opportunities Figure 3. Estimation of seeding impacts on precipitation as determined by various analysis methods. Blue indicates results from the RSE. The solid blue is the primary statistical result, while the hatched blue represent the range achieved through stratification of the statistical data. The red bar represents the range of model seeding results. The accumulation of evidence leads to the assessed seeding effect as indicated by the gray shading. Because seeding orographic wintertime clouds is appropriate only under certain meteorological conditions, the climatological context for seeding conditions was investigated (Ritzman 2013; Ritzman et al. 2015). The investigation used an eight-year ( ) high resolution regional climate model forced by re-analysis meteorological data (Ikeda et al. 2010) to determine the frequency of seeding opportunities in the Medicine Bow and Sierra Madre Ranges based on the seeding criteria. On average, atmospheric conditions met the seeding criteria less than one-third of the time during the winter, and were accompanied by precipitation approximately half of the time that atmospheric conditions met the seeding criteria. Considering only conditions when precipitation was occurring during seedable conditions 7
283 indicates, on average, ~30% of the wintertime snowpack over the Medicine Bow and Sierra Madre Ranges for the years would have been seeded under the conditions specified for the RSE. Streamflow Impacts For assessing the potential impacts of seeding on streamflow, hydrological model simulations were performed on the North Brush Creek watershed in the Medicine Bow Range and in the Wind River Range. The North Brush Creek watershed, located in the Upper North Platte River Basin (NPRB), was selected because of the availability of historic unimpaired streamflow data. The Variable Infiltration Capacity (VIC) hydrological model was applied (Oubeidillah et al. 2014), and when compared to observed snowmelt-driven streamflow (streamflow from which the base flow has been subtracted) the baseline VIC model (i.e. no cloud seeding increases) estimated snowmelt-driven streamflow within 1% for the snow melt period This period was chosen based on the availability of meteorological variables (Ikeda et al. 2010) and identification of seedable storms (Ritzman et al. 2015). In the Medicine Bow Range, increases in snowmelt-driven streamflow due to cloud seeding were modeled over the range of 5-15%, based on the accumulation of evidence from the WWMPP. Using the frequency of seedable storms determined by the climatology analysis (Ritzman et al. 2015), daily percent increases in precipitation were determined by applying the range of possible seeding percent increase scenarios. The percent increases in precipitation were then applied to daily precipitation data, from the Daymet data base, for use in the VIC model to determine increases in snowmelt-driven streamflow. For a seeding impact of 5-15% on winter precipitation, this resulted in total snowmelt-driven streamflow increases for the North Brush Creek watershed (area 37.4 sq-mi) for the eight-year period of 95 AF/sq-mi to 288 AF/sq-mi. These results were then aggregated to the seedable area in the NPRB within Wyoming. The maximum seedable area, defined as the area with elevation above 9,000 ft, within this region of the watershed was approximately 390 sq-mi. The potential cloud seeding impact area considered was 30 to 80% of the maximum seedable area. The resulting increases in water within the NPRB in Wyoming (see Figure 4) then depends on the increase in precipitation from cloud seeding (5-15%) and the cloud seeding impact area (30-80%) within the watershed. Results from hydrological modeling of the Wind River Range using an un-calibrated version of the WRF-Hydro hydrological model provided results from cloud seeding which were qualitatively similar to those from the VIC hydrological modeling in the North Brush Creek. 8
284 Figure 4. Increases in Wyoming water within the NPRB based on VIC model simulations under the varying estimates of increases in precipitation due to cloud seeding and the various cloud seeding impact area, 30-80% of the maximum seedable area. To estimate the water generated in the NPRB in Wyoming, the total flow at the Northgate Colorado stream gauge (located immediately south of the Wyoming border) was subtracted from the total flow into Seminoe Reservoir for the period This resulted in 3.09 x 10 6 AF for 8 years or an average of 390,000 AF per year. This amount does not account for diversions, primarily agricultural, and return flow upstream of Seminoe Reservoir. For a 10% seeding effect impacting 60% of the basin, cloud seeding would generate an average additional 7,100 AF per year, or an increase of 1.8% in streamflow in the Wyoming area of the NPRB. Annual cost estimates for cloud seeding operations are detailed in Table 1. For a purely operational program using remotely controlled ground based generators, the estimated annual costs range from $375,500 to $526,400. The difference results from sponsor-owned and -operated equipment versus a contractor/leased operation plus use of a real-time forecast model. Cost estimates to include an evaluation component are $222,700. Using the low cost estimate and the example of 10% efficiency and seeding 60% of the basin, the cost of water produced would be approximately $53/AF. Figure 5 shows the range of costs for different cloud seeding efficiencies and the range of cost options. For cloud seeding efficiencies of 5-15% and 60% of the area covered the costs are $35-107/AF for the low cost option. A limited amount of North Platte water, if available, is marketed on a temporary year-toyear basis for municipal and industrial uses at $30/AF by the State of Wyoming out of Pathfinder Reservoir, and at $75/AF by the US Bureau of Reclamation out of Glendo Reservoir. 9

285 Table 1. Estimated cost scenarios for future Medicine Bow and Sierra Madre operational seeding Option Line Item Description Purchase Equipment, Train Personnel to Run the Generators Lease Equipment, Hire Contractor to Provide Personnel to Run Project Operational Support Evaluation Cost per Season Ground- based Seeding 16 generators purchase $190,500 Field Operations/Travel Staff trained/employed by sponsor $145,700 Maintenance/Off season Routine maintenance $8,700 Radiometer Purchase $30,600 Ground- based Seeding 16 generators lease $175,800 Field Operations/Travel Contract staff, per diem and lodging $192,700 Maintenance/Off season Routine maintenance, per diem and lodging $26,800 Radiometer Lease $25,300 Soundings 44 soundings $26,400 Real- time High- res Forecast Modeling Operations and equipment $54,400 Precipitation Gauges 4 sites, (8 gauges) $22,700 High- res Simulation of Numerical modeling to evaluate Seeding Cases seeding $200,000 Total Cost Per Season $375,500 $420,600 $80,800 $222,700 Figure 5. Range of cost per acre-foot of water produced by cloud seeding for the various estimated levels of seeding effect, assuming a cloud seeding impact area of 60% within the watershed greater than 9000 ft, and the range of program cost estimates. 10
286 Environmental Impacts of Seeding Trace chemistry analyses of water and soil samples were conducted for all three ranges following each operational season. These analyses demonstrated a negligible environmental impact of the seeding operations within the three mountain ranges, with silver concentrations in the water ranging in the parts per trillion and concentrations in the soil being in the parts per billion range. These concentrations are far less than would be expected from other potential (background) sources of silver and measured concentrations in water sources were about three orders of magnitude less than values considered hazardous to environmental system or human health. Extra-area Effects WRF model simulations were conducted to investigate the simulated extra-area seeding effect from seeding in the Medicine Bow and Sierra Madre Ranges, as well as for seeding in the Wind River Range. Given the observational constraints of the WWMPP, there were no measurements to validate the model beyond the intended seeding target areas, and therefore, these results should be interpreted with the caveat that they were based on model results. The key result from this numerical modeling study is that the net effect of all simulated seeding in areas outside of the intended targets (i.e. extra-area effects) was small to zero (less than 0.5%). This is consistent with previous studies (Long 2001; DeFelice et al. 2014). Conclusions The WWMPP provided an assessment of weather modification as a strategy for long-term water management. Specifically, the project was funded to determine whether seeding in Wyoming is a viable technology to augment existing water supplies, and if so, by how much, and at what cost. The physical evidence from radiometer measurements showed that ample supercooled liquid water existed at temperatures conducive to generating additional snow by silver iodide seeding over the ranges studied. High-resolution and quality-controlled snow gauges were critical to evaluate the effectiveness of cloud seeding and validate the performance of the model used during the WWMPP. The accumulation of evidence from statistical, physical, and modeling analysis suggests that cloud seeding is a viable technology to augment existing water supplies, for the Medicine Bow and Sierra Madre Ranges. While the primary statistical analysis did not show a significant impact of seeding, statistical analysis stratified by generator hours showed increases of 3-17% for seeded storms (Figure 3). A climatology study based on high-resolution model data showed that ~30% of the winter time precipitation over the Medicine Bow and Sierra Madre Ranges fell from storms that met the WWMPP seeding criteria. Ground-based silver iodide measurements indicated that ground-based seeding reached the intended target, and in some cases well downwind of the target. High-resolution modeling studies by NCAR that simulated half of the total number of seeding cases showed positive seeding effects between 10-15% (Figure 3). In spite of the result of no seeding effect from the primary randomized statistical experiment, ancillary studies, using physical considerations to stratify the RSE data, and modeling studies over full winter seasons, led to an accumulation of evidence from the statistical, modeling, and physical analysis which suggest a positive seeding effect on the order of 5 to 15%. 11
287 Based on a potential increase in precipitation from seeded storms of 5 to 15%, affecting 30 to 80% of the cloud seeding impact area, the VIC hydrological model indicated an increased streamflow for Wyoming water in the NPRB ranging from 0.4 to 3.7%. Using the lower cost estimate for an operational cloudseeding program, along with the range of seeding effects and cloud seeding impact areas, the cost of the water ranges from $27 to $214 per acre-foot. Applying the higher cost operational program option with evaluation, the costs range from $53 to $427 per acre-foot. The NCAR high-resolution cloud model was found to be capable of forecasting the likelihood of seeding conditions over the three mountain ranges studied, aided in the placement of ground-based seeding generators, and assisted in the evaluation of amount and location of seeding-enhanced precipitation and in stratification of the RSE data. The development and real-time application of this model was a major accomplishment of the WWMPP. Measurements of silver in the snow pack, soil, and streams consisting of snowmelt showed negligible environmental impacts (parts per trillion in the snow and streams). Silver concentrations in the soil were measured in parts per billion indicating it is a much larger source of silver than snow produced by cloud seeding. Silver concentrations in snow are also far less than that expected from other sources, such as industrial waste or large combustion sources. We therefore conclude that winter orographic cloud seeding with silver iodide using the procedures from the WWMPP has a negligible impact on the environment and on precipitation in the area surrounding the intended target. Recommendations Based on the results of the WWMPP, we recommend that the WWDC consider implementation of cloudseeding technology within the State of Wyoming by carefully addressing each of the following five components: 1) Barrier identification, 2) Program design, 3) Operational criteria, 4) Program evaluation, and 5) Program management. 1. Barrier Identification Conduct large-scale climatological modeling and observational studies over time scales as long as a decade to identify the barriers most conducive to seeding. 2. Program Design Use the barrier identification climatology and cloud-seeding model to determine whether to use ground or airborne seeding and where to place generators and/or conduct aircraft flights. Perform additional high-resolution modeling studies to test and refine the initial program design and optimize the location and number of generators to ensure that the silver iodide will reliably reach the intended cloud. When siting generators, also consider institutional constraints associated with high-elevation deployments. Based on model analyses and other considerations, determine the sites for the radiometer and sounding units, and identify critical locations for snow-gauge sites. Plan sufficient time to obtain the necessary permits. Siting equipment on Federal lands requires a special use permit, which will include NEPA. Allow 2 to 24 months for permitting activities, depending on the scale of the project. Environmental Impact Statements can take up to 24 months, while State lands permitting in Wyoming can take 1 to 3 months. 12
288 Communicate with land management agencies early and often throughout the permitting process. Engage in public information outreach efforts to identify and address environmental concerns and encourage stakeholder involvement. 3. Operational Criteria Use the radiometer, sounding, and high-resolution, real-time forecast model information to identify seeding opportunities. Ensure that generators and other instruments are properly maintained. Consider the implementation of a real-time model that explicitly forecasts seeding opportunities. Suspension criteria must be clearly defined and revisited as needed. 4. Evaluation Model simulations in combination with high-resolution snow-gauge measurements provide a low-cost methodology to evaluate the effectiveness of cloud-seeding programs. Consider this approach to evaluate the seasonal returns on the investment in the seeding program. High-resolution models used to evaluate cloud seeding need to be validated using sounding, radiometer, and snow-gauge data. Therefore, any model-based evaluation approach should include validation with observations. Evaluate the impacts of cloud seeding on streamflow using the output of the high-resolution cloud-seeding model coupled to a high-resolution hydrology model. Measurements of ice nuclei in airborne snow (i.e. AINC measurements) and in the snowpack (i.e. trace chemistry measurements) are valuable ancillary physical measurements to verify the effectiveness of cloud seeding, as well as for evaluating the performance of the cloudseeding model and extra-area impacts. The costs for this work and the water chemistry below are not included in Table 1. Water chemistry sampling post-season is useful for addressing environmental concerns, though this will be most effective if good inventories of other potential sources of silver within the sampled watersheds are available. 5. Program Management Consult with a Technical Advisory Team to provide guidance to the program. Share program data with affected federal and state resource agencies. Collaborate with other operational weather modification programs. Conduct information and education outreach efforts with local stakeholders. Pursue collaborative funding opportunities for weather modification activities. Conduct any program evaluation independently from program operations. Acknowledgements The WWMPP was made possible by funding received from the Wyoming State Legislature and at the recommendation and approval of the Wyoming Water Development Commission and Legislative Select Water Committee. Wyoming Water Development Office staff provided oversight and guidance to the pilot program throughout. Additional funding for the program was received from the University of Wyoming Office of Water Programs, the Southern Nevada Water Authority, the Central Arizona Project, and the Colorado River Board of California Six Agency Committee. 13
289 Special thanks goes to Dr. Terry Deshler (University of Wyoming Department of Atmospheric Science) for his expertise and guidance to the State of Wyoming in the conduct of the WWMPP. Numerous faculty and students in the Department should also be noted for their contributions to the WWMPP and ancillary studies. We are indebted to several researchers with extensive histories in the evaluation of seeding winter storms for their in-depth and critical comments on designs of the RSE. Thanks goes out to the Wyoming Office of State Lands and Investments, the Wyoming State Engineer s Office, and the USFS for their assistance during their respective permitting processes. Similar thanks goes to the numerous landowners and state lessees granting permission and access for the siting of a myriad of project instrumentation on their lands. The WWMPP benefitted greatly from the establishment of a Technical Advisory Team representing numerous affected federal and state resource agencies. Members participating in the group provided valuable input to the program and often facilitated numerous collaborative efforts and data/resource sharing activities. The North American Weather Modification Council, and its member states and affiliate members provided technical resources to the program throughout. The Wyoming Association of Conservation Districts, and member districts near each of the study areas contributed greatly to the project s success by assisting with equipment deployment/siting and in helping to facilitate WWMPP education and outreach activities. Finally, the WWMPP would not have been possible without the assistance of an untold number of other individuals and entities who in some way contributed to the project by the loaning of equipment, sharing of data or resources, and in showing support for the project. All of these contributions led to the overall success of the program. Disclaimer All rights to the underlying data collected and/or generated with funding from the Wyoming Water Development Office (WWDO) from which this report was created remain with the WWDO. This report does not constitute the opinions of the State of Wyoming, the Wyoming Water Development Commission, or the Wyoming Water Development Office. 14
290 References Boe, B.A., J.A. Heimbach, Jr., T.W. Krauss, L. Xue, X. Chu, and J.T. McPartland, 2014: The Dispersion of Silver Iodide Particles From Ground-based Generators Over Complex Terrain, Part 1: Observations with Acoustic Ice Nucleus Counters. J. Appl. Meteor. Climatol., 53, Breed, D., R. Rasmussen, C. Weeks, B. Boe, and T. Deshler, 2014: Evaluating winter orographic cloud seeding: Design of the Wyoming Weather Modification Pilot Project (WWMPP), J. Appl. Meteor. Climatol., 53, DeFelice, T.P, J. Golden, D. Griffith, W. Woodley, D. Rosenfeld, D. Breed, M. Solak, B. Boe, 2014: Extra area effects of cloud seeding An updated assessment, Atmos. Res., 135, Geerts, B., Q. Miao, Y. Yang, R. Rasmussen, and D. Breed, 2010: An airborne profiling radar study of the impact of glaciogenic cloud seeding on snowfall from winter orographic clouds. J. Atmos. Sci., 67, Ikeda, K., R. Rasmussen, C. Liu, D. Gochis, D. Yates, F. Chen, M. Tewari, M. Barlage, J Dudhia, W. Yu, K. Miller, K. Arsenault, V. Grubisic, G. Thompson, and E. Guttman, 2010: Simulation of seasonal snowfall over Colorado. Atmos. Res., 97, Long, A.B., 2001: Review of downwind extra-area effects of precipitation enhancement, J. Wea. Modif., 33, Manton, M.J., and L. Warren, 2011: A confirmatory snowfall enhancement project in the Snowy Mountains of Australia. Part II: Primary and associated analyses. J. Appl. Meteor. Climatol, 50, NCAR, 2008: Wyoming Weather Modification 5-Year Pilot Program: Design of the Randomized Seeding Experiment with 2008 Additions, 80 pp. Available from the Wyoming Water Development Commission, Cheyenne, WY. National Research Council, 2003: Critical Issues in Weather Modification Research. National Academies Press, Washington, D.C., 123 pp. Oubeidillah, A. A., S.-C. Kao, M. Ashfaq, B. S. Naz, and G. Tootle, 2014: A Large-scale, High-resolution Hydrological Model Parameter Data Set for Climate Change Impact Assessment for the Conterminous US. Hydrology and Earth System Sciences, 18, Ritzman, Jaclyn, 2013: What Fraction of Winter Precipitation over the Sierra Madres and Medicine Bows was Treated during the Wyoming Weather Modification Pilot Project? M.S. Thesis, 96 pp. Ritzman, J., T. Deshler, K. Ikeda, R. Rasmussen, 2015: Estimating the fraction of winter orographic precipitation that is produced under conditions meeting the seeding criteria from the Wyoming weather modification pilot project. J. Appl. Meteor. Climatol., in press. WMI, 2005: Level II Weather Modification Feasibility Study, Report to the Wyoming Water Development Commission by Weather Modification, Inc., Fargo, ND, March pp. Xue, L., and Coauthors, 2013a: AgI cloud seeding effects as seen in WRF simulations. Part I: Model description and idealized 2D sensitivity tests. J. Appl., Meteor. Climatol., 52, Xue, L., S. Tessendorf, E. Nelson, R. Rasmussen, D. Breed, S. Parkinson, P. Holbrook, and D. Blestrud, 2013b: AgI cloud seeding effects as seen in WRF simulations. Part II: 3D real case simulations and sensitivity tests. J. Appl. Meteor. Climatol., 52, Xue, L., X. Chu, R. Rasmussen, D. Breed, B. Boe, and B. Geerts, 2014: The Dispersion of Silver Iodide Particles From Ground-based Generators Over Complex Terrain, Part 2: WRF Large-Eddy simulations vs. Observations. J. Appl. Meteor. Climatol., 53,
291 ATTACHMENT 15 STEVEN M. HUNTER POTENTIAL WATER AUGMENTATION FROM CLOUD SEEDING IN THE COLORADO RIVER BASIN JOURNAL OF WEATHER MODIFICATION, APRIL 2006
292 This page intended to be blank
293 April 2006 HUNTER 51 POTENTIAL WATER AUGMENTATION FROM CLOUD SEEDING IN THE COLORADO RIVER BASIN Steven M. Hunter Technical Service Center Bureau of Reclamation Denver, CO Abstract. A spatially-distributed snow energy and mass balance model, updated with all available snowpack observations, is used to assess the potential for water augmentation by winter orographic cloud seeding in the Colorado River Basin. The modeling system outputs snow water equivalent (SWE) on a 1 km grid throughout the continental United States. The April 1 SWE from the last two years are horizontally integrated across existing and potential seeding target areas in the basin and multiplied by approximately 0.1 to calculate water yields from an assumed seeding-induced increase of 10 percent. Major uncertainties in this method, including snowpack ablation and target area selection, are described. Given those uncertainties, it is estimated that in an average precipitation year, about one million acre-feet of additional snowpack water could be produced by seeding. Somewhat more could be produced in a wet year and about 500,000 acre-feet in a dry year. These figures are reasonably close to those from older studies of augmentation potential in the basin. 1. BACKGROUND Seeding of orographic (mountain) clouds in the cool season has been done in the Upper and Lower Colorado River Basin since the 1960s, on an operational and research basis. Several studies have been done in that time to estimate the potential water augmentation from seeding in the basin. The following are some of the older such studies and their estimates of water yield, as cited in a Bureau of Reclamation report (Water and Power Resources Service 1980): Table 1. Previous water yield estimates from cloud seeding in the Colorado River Basin Source Dates Water Yield Estimates (Acre-ft) Bureau of Reclamation (Grant 1969) ,870,000 Stanford Research Institute (Weisbecker 1974) ,150,000* North American Weather Consultants, Twelve Basin Investigation (Elliott et al. 1973) ,315,000 (liberal) 903,000 (conservative) * Figure from this document is halved because it assumed a 20% increase, whereas today the often accepted increase is 10% Figures from this study do not include estimates from the Gila River Basin in Arizona, which is in the lower basin and most of which is below 9,000 feet elevation. These figures are for seeding all target areas in the basin, with areas selected based on the differing criteria of each study. Since these studies are over 30 years old, it was desired to update them with more recent information. Also, motivation was added by the letter of 25 August 2005 from the seven Colorado Basin states to Interior Secretary Norton. This letter requested a long-term plan for operating Lakes Powell and Mead during hydrologic drought, and included a recommendation that Reclamation develop a plan for water augmentation through cloud seeding. Also, the funding and context for the current work were provided by the Colorado Water Conservation Board s (CWCB) Winter Storm Climatology study, of which Reclamation had a part. 2. AUGMENTATION ESTIMATION PROCEDURES We assumed a 10% increase in April 1 snow water equivalent (SWE) in existing and potential target areas, with SWE provided by the Snow Data Assimilation System (SNODAS; Carroll et al. 2001). The SNODAS consists of a spatially-distributed snow energy and mass balance model, updated with all available snow water equivalent, snow depth, and snow cover (from surface, aircraft, radar, satellite) data. Model outputs include SWE, snow depth, snowmelt, pack temperature, and sublimation. Daily and historical model output for the state of Colorado may be found online (Hunter 2004). The output has been available nationwide since October 2003, and for - Reviewed -
294 52 JOURNAL OF WEATHER MODIFICATION Volume 38 some areas before that date. Therefore data exist for two winters only, a short climatological record compared to the more traditional Snow Telemetry (SNOTEL) and snow course datasets. Unlike these datasets, however, SNODAS provides spatially continuous data at 1 km resolution. The model has been validated (Cline et al. 2004) in the Colorado Mountains against the Corps of Engineers widely-validated SNTHERM model. 2.1 Determination of Target Areas A major variable in estimating water yield from seeding will be selection of the seeding target areas. We split this task into two sections: existing areas already being seeded by operational programs (in Utah and Colorado only), and potential new areas. Geographic Information Systems (GIS) maps were obtained for the former. Selection criteria for existing areas vary, but are in general elevation-based. In Utah, this criterion is 7000 feet or higher, whereas in Colorado it is above feet. These criteria were informally adopted and reflect the higher elevations in Colorado. In any event, the existing areas were used as provided, with no modification except to exclude parts outside the Colorado River drainage area. The existing target areas are listed in Table 2. Table 2. Existing Target Areas Colorado Utah 1. Upper Arkansas 11. Fishlake Mtns. 2. Gunnison North 12. Boulder Mtn. 3. Gunnison South 13. Uinta Mtns. South 4. Vail 14. Dixie Natl. Forest 5. Beaver Creek 6. Grand Mesa North 7. Grand Mesa South 8. San Miguel Mtns. 9. Western San Juans 10. Eastern San Juans Portion of area outside Colorado River Basin For potential areas, a strict 9000 foot base threshold was used as a criterion in the Colorado basin regions of Arizona, New Mexico Colorado, Utah, and Wyoming. This criterion follows that specified in a planning document for a winter cloud seeding research project called the Colorado River Snowpack Enhancement Test (CREST; Super et al. 1993). Further criteria from this document were that the candidate region usually has at least 20 km west-east extent of 9000 feet elevation area and that it is largely or wholly outside designated wilderness areas. These criteria were used to select proposed areas for cloud seeding experimentation, whereas this document is concerned with all potential target areas for operational seeding. It would be impractical to conduct experimentation within a wilderness area, since key instrumentation would not be allowed. Some operational projects target wilderness areas, although their seeding generators are located outside the boundaries of those areas. So for the present study, several additional areas, including those with wilderness designations and barriers no wider than 5 km, have been added. Finally, the potential new areas were included only if they are outside existing target areas. The CREST locations were given spatial extents through use of GIS software, since the planning document gave only general text descriptions of locations (the authors had to manually search 1:1,000,000 aeronautical charts). Based on the slightly different criteria (stated above) and more sensitive mapping with GIS software, we identified five additional potential target areas (Table 3). The Bureau of Reclamation report (Water and Power Resources Service 1980) identified the entire Mogollon Rim in Arizona as a potential target, whereas we exclude all of it (except for the San Francisco Mountains) because it is largely below 9000 feet elevation. The snowfall at such low elevations, particularly if they are at southerly latitudes as in Arizona, would frequently occur at relatively warm subfreezing temperatures, during which silver iodide would be ineffective. Seeding by liquid propane gas expansion, which can create ice crystals at warmer temperatures (thresholds -1 C vs -5 C for silver iodide), might be a viable alternative for such locales. An essential point is that, despite the CREST criteria application, there is still substantial subjectivity in selecting any seeding target area. All new potential areas are listed in Table 3. Both existing and potential areas are shown by the map in Fig Reviewed -
 17. White R. Plateau 22. Mt. Ellen # 28. White Mts. 18. Uncompahgre Plateau 23. Abajo Pk. # 29. San Francisco Peaks # 19.")
295 April 2006 HUNTER 53 Table 3. Potential Target Areas Colorado Utah Wyoming Arizona 15. Park Range 20. Uinta Mtns. North 24. Wyoming Range 26. Kaibab N.F. # 16. Elkhead Mts. 21. La Sal Mts. 25. Wind River Mtns. West # 27. Chuska Mts. AZ/NM) 17. White R. Plateau 22. Mt. Ellen # 28. White Mts. 18. Uncompahgre Plateau 23. Abajo Pk. # 29. San Francisco Peaks # 19. Central # Areas not identified in CREST Area was operationally seeded in previous years by Denver Water utility Figure 1. Existing (operational) cloud seeding target areas (blue) and potential target areas (red). Areas are indexed with numbers corresponding to those in Tables 2 and 3, respectively. Purple and brown polygons are Upper and Lower Colorado River basin outlines, respectively. - Reviewed -

296 54 JOURNAL OF WEATHER MODIFICATION Volume Nature of Calculations For the current application, we integrated SNO- DAS 1 km SWE data over seeding target areas at the traditional end of the mountain snow accumulation season, April 1 (also the traditional beginning of the snowmelt runoff season). To estimate water volumes produced by seeding in potential areas, these integrations are divided by ten, since there is statistical, physical and modeling evidence for about 10 percent augmentation of natural precipitation (snowfall) by orographic cloud seeding (American Meteorological Society 1998). Physical cause-and-effect relationships have yet to be fully demonstrated, however. Since seeding has been conducted in existing areas, it is assumed that SNODAS SWE already reflects the 10% increase, or 110% of natural snowpack. Therefore the integrated SWE is divided by 11 in these areas. These calculations were made for both 2004 and 2005 April 1 SWE data. The year 2004 was an unusually dry one in the Upper Basin and 2005 was a relatively wet one. See Fig. 2 for a graphical representation of the precipitation in the basin. That the calculations are based on snapshots of the snowpack on April 1 requires a caveat. They are representative of cloud seeding augmentation of snowfall to the extent that the snowpack has continually increased and melted little over the preceding winter. Such would not be the case in relatively warm southerly and/or low elevation mountains, as in Arizona. Because some melt occurs even in colder climates and/or higher elevations, the April 1 SNODAS SWE will be lower than SWE from accumulated seasonal snowfall. The latter is actually the more appropriate variable for augmentation potential, but is only measured at a few points. Therefore the seedinggenerated 10% increases of the April 1 SNODAS SWE, as presented below, might be expected to underestimate in proportion to seasonal snowpack ablation (melt, sublimation [ice to vapor] or evaporation). Snowfall measurements from gauges have significant errors as well. Moreover, some of the gauged precipitation could have fallen as rain. Figure 2. Snowpack expressed as percent of 30-year average in various sub-basins of the Colorado River basin, as of 1 April 2004 (left) and 1 April 2005 (right). Data are from SNOTEL sites operated by the National Resource Conservation Service (NRCS) and figures are from the NRCS National Water and Climate Center. - Reviewed -
Idaho Power Company s Cloud Seeding Program May 6, 2016
 Idaho Power Company s Cloud Seeding Program May 6, 2016 Shaun Parkinson, PhD, P.E. Overview What is cloud seeding & how is it done Idaho Power s history with cloud seeding Idaho Power s cloud seeding projects
NORTHERN CHILE WINTER CLOUD SEEDING FEASIBILITY/DESIGN STUDY DON A. GRIFFITH NORTH AMERICAN WEATHER CONSULTANTS (NAWC) SANDY, UTAH
 SANDY, UTAH") NORTHERN CHILE WINTER CLOUD SEEDING FEASIBILITY/DESIGN STUDY DON A. GRIFFITH NORTH AMERICAN WEATHER CONSULTANTS (NAWC) SANDY, UTAH WMA SEMI-ANNUAL CONFERENCE SEPTEMBER 25-27, 2013 SANTIAGO, CHILE INTRODUCTION
NORTHERN CHILE WINTER CLOUD SEEDING FEASIBILITY/DESIGN STUDY DON A. GRIFFITH NORTH AMERICAN WEATHER CONSULTANTS (NAWC) SANDY, UTAH WMA SEMI-ANNUAL CONFERENCE SEPTEMBER 25-27, 2013 SANTIAGO, CHILE INTRODUCTION
Weather Modification Activities in the Colorado River Basin. Mohammed Mahmoud
 Weather Modification Activities in the Colorado River Basin Mohammed Mahmoud Historical Information Authorized by 1968 Basin Project Act Substantially completed in 1993 Responsible for repaying reimbursable
Mountain Snowpacks, Climate Change and the Silver Solution
 Mountain Snowpacks, Climate Change and the Silver Solution Climate Change Seminar Series University of Nevada Las Vegas 11 July 2012 Arlen Huggins Desert Research Institute Reno, Nevada Climate, snow and
An Evaluation of Seeding Effectiveness in the Central Colorado Mountains River Basins Weather Modification Program
 2016, UCAR. All rights reserved. An Evaluation of Seeding Effectiveness in the Central Colorado Mountains River Basins Weather Modification Program for Grand River Consulting Sponsors: Colorado Water Conservation
NIDIS Intermountain West Drought Early Warning System December 11, 2018
 NIDIS Drought and Water Assessment NIDIS Intermountain West Drought Early Warning System December 11, 2018 Precipitation The images above use daily precipitation statistics from NWS COOP, CoCoRaHS, and
NIDIS Intermountain West Drought Early Warning System February 19, 2019
 NIDIS Intermountain West Drought Early Warning System February 19, 2019 Precipitation The images above use daily precipitation statistics from NWS COOP, CoCoRaHS, and CoAgMet stations. From top to bottom,
FEASIBILITY/DESIGN STUDY FOR A WINTER CLOUD SEEDING PROGRAM FOR THE ABAJO AND LA SAL MOUNTAIN RANGES, UTAH
 FEASIBILITY/DESIGN STUDY FOR A WINTER CLOUD SEEDING PROGRAM FOR THE ABAJO AND LA SAL MOUNTAIN RANGES, UTAH Don A. Griffith, David P. Yorty, Todd R. Flanagan and Stephanie D. Beall North American Weather
NIDIS Intermountain West Drought Early Warning System January 15, 2019
 NIDIS Drought and Water Assessment NIDIS Intermountain West Drought Early Warning System January 15, 2019 Precipitation The images above use daily precipitation statistics from NWS COOP, CoCoRaHS, and
Precipitation. Standardized Precipitation Index. NIDIS Intermountain West Regional Drought Early Warning System January 3, 2017
 1/3/2017 NIDIS Drought and Water Assessment NIDIS Intermountain West Regional Drought Early Warning System January 3, 2017 Precipitation The images above use daily precipitation statistics from NWS COOP,
Arizona Cloud Seeding Efforts: A Salt River Project Perspective. James Walter SRP Surface Water Resources CPWAC/CPWP Joint Meeting March 30, 2018
 Arizona Cloud Seeding Efforts: A Salt River Project Perspective James Walter SRP Surface Water Resources Importance of Winter Precipitation Winter Cloud Seeding 101 Early Cloud Seeding Projects Questions
The following information is provided for your use in describing climate and water supply conditions in the West as of April 1, 2003.
 Natural Resources Conservation Service National Water and Climate Center 101 SW Main Street, Suite 1600 Portland, OR 97204-3224 Date: April 8, 2003 Subject: April 1, 2003 Western Snowpack Conditions and
NIDIS Intermountain West Regional Drought Early Warning System February 7, 2017
 NIDIS Drought and Water Assessment NIDIS Intermountain West Regional Drought Early Warning System February 7, 2017 Precipitation The images above use daily precipitation statistics from NWS COOP, CoCoRaHS,
Precipitation. Standardized Precipitation Index. NIDIS Intermountain West Drought Early Warning System September 5, 2017
 9/6/2017 NIDIS Drought and Water Assessment NIDIS Intermountain West Drought Early Warning System September 5, 2017 Precipitation The images above use daily precipitation statistics from NWS COOP, CoCoRaHS,
NIDIS Intermountain West Drought Early Warning System April 18, 2017
 1 of 11 4/18/2017 3:42 PM Precipitation NIDIS Intermountain West Drought Early Warning System April 18, 2017 The images above use daily precipitation statistics from NWS COOP, CoCoRaHS, and CoAgMet stations.
A Review of the 2007 Water Year in Colorado
 A Review of the 2007 Water Year in Colorado Nolan Doesken Colorado Climate Center, CSU Mike Gillespie Snow Survey Division, USDA, NRCS Presented at the 28 th Annual AGU Hydrology Days, March 26, 2008,
A WINTER OPERATIONAL CLOUD SEEDING PROGRAM: UPPER GUNNISON RIVER BASIN, COLORADO. Don A. Griffith*, David P. Yorty and Mark E.
 April 2011 Griffith et al. 29 A WINTER OPERATIONAL CLOUD SEEDING PROGRAM: UPPER GUNNISON RIVER BASIN, COLORADO Don A. Griffith*, David P. Yorty and Mark E. Solak North American Weather Consultants, Inc.
A LEVEL II WEATHER MODIFICATION FEASIBILITY STUDY FOR WINTER SNOWPACK AUGMENTATION IN THE SALT RIVER AND WYOMING RANGES IN WYOMING
 A LEVEL II WEATHER MODIFICATION FEASIBILITY STUDY FOR WINTER SNOWPACK AUGMENTATION IN THE SALT RIVER AND WYOMING RANGES IN WYOMING Don A. Griffith, Mark E. Solak and David P. Yorty North American Weather
NIDIS Intermountain West Drought Early Warning System February 12, 2019
 NIDIS Intermountain West Drought Early Warning System February 12, 2019 Precipitation The images above use daily precipitation statistics from NWS COOP, CoCoRaHS, and CoAgMet stations. From top to bottom,
NIDIS Intermountain West Drought Early Warning System May 1, 2018
 NIDIS Intermountain West Drought Early Warning System May 1, 2018 Precipitation The images above use daily precipitation statistics from NWS COOP, CoCoRaHS, and CoAgMet stations. From top to bottom, and
NIDIS Intermountain West Drought Early Warning System December 18, 2018
 NIDIS Intermountain West Drought Early Warning System December 18, 2018 Precipitation The images above use daily precipitation statistics from NWS COOP, CoCoRaHS, and CoAgMet stations. From top to bottom,
NIDIS Intermountain West Drought Early Warning System March 26, 2019
 NIDIS Intermountain West Drought Early Warning System March 26, 2019 The images above use daily precipitation statistics from NWS COOP, CoCoRaHS, and CoAgMet stations. From top to bottom, and left to right:
NIDIS Intermountain West Drought Early Warning System January 22, 2019
 NIDIS Drought and Water Assessment NIDIS Intermountain West Drought Early Warning System January 22, 2019 Precipitation The images above use daily precipitation statistics from NWS COOP, CoCoRaHS, and
NIDIS Intermountain West Drought Early Warning System September 4, 2018
 NIDIS Drought and Water Assessment NIDIS Intermountain West Drought Early Warning System September 4, 2018 Precipitation The images above use daily precipitation statistics from NWS COOP, CoCoRaHS, and
NIDIS Intermountain West Drought Early Warning System November 21, 2017
 NIDIS Drought and Water Assessment NIDIS Intermountain West Drought Early Warning System November 21, 2017 Precipitation The images above use daily precipitation statistics from NWS COOP, CoCoRaHS, and
NIDIS Intermountain West Drought Early Warning System December 4, 2018
 12/4/2018 NIDIS Drought and Water Assessment NIDIS Intermountain West Drought Early Warning System December 4, 2018 Precipitation The images above use daily precipitation statistics from NWS COOP, CoCoRaHS,
NIDIS Intermountain West Drought Early Warning System November 14, 2017
 NIDIS Intermountain West Drought Early Warning System November 14, 2017 Precipitation The images above use daily precipitation statistics from NWS COOP, CoCoRaHS, and CoAgMet stations. From top to bottom,
NIDIS Intermountain West Drought Early Warning System February 6, 2018
 NIDIS Intermountain West Drought Early Warning System February 6, 2018 Precipitation The images above use daily precipitation statistics from NWS COOP, CoCoRaHS, and CoAgMet stations. From top to bottom,
Operational Perspectives on Hydrologic Model Data Assimilation
 Operational Perspectives on Hydrologic Model Data Assimilation Rob Hartman Hydrologist in Charge NOAA / National Weather Service California-Nevada River Forecast Center Sacramento, CA USA Outline Operational
NIDIS Intermountain West Drought Early Warning System December 30, 2018
 1/2/2019 NIDIS Drought and Water Assessment NIDIS Intermountain West Drought Early Warning System December 30, 2018 Precipitation The images above use daily precipitation statistics from NWS COOP, CoCoRaHS,
The History of Cloud Seeding in Arizona
 The History of Cloud Seeding in Arizona VIII Winter Watershed Conference Show Low, AZ January 29, 2015 James Walter Water Resource Operations Salt River Project Clouds - Cloud condensation nuclei (CCN)
NIDIS Intermountain West Drought Early Warning System October 17, 2017
 NIDIS Drought and Water Assessment NIDIS Intermountain West Drought Early Warning System October 17, 2017 Precipitation The images above use daily precipitation statistics from NWS COOP, CoCoRaHS, and
A BRIEF HISTORY OF EVALUATIONS PERFORMED ON THE OPERATIONAL KINGS RIVER WINTER OROGRAPHIC CLOUD SEEDING PROGRAM. Don A. Griffith and David P.
 AUGUST 2014 GRIFFITH ET AL. 29 A BRIEF HISTORY OF EVALUATIONS PERFORMED ON THE OPERATIONAL KINGS RIVER WINTER OROGRAPHIC CLOUD SEEDING PROGRAM Don A. Griffith and David P. Yorty North American Weather
NIDIS Intermountain West Drought Early Warning System April 16, 2019
 NIDIS Intermountain West Drought Early Warning System April 16, 2019 Precipitation The images above use daily precipitation statistics from NWS COOP, CoCoRaHS, and CoAgMet stations. From top to bottom,
NIDIS Intermountain West Drought Early Warning System July 18, 2017
 NIDIS Drought and Water Assessment NIDIS Intermountain West Drought Early Warning System July 18, 2017 Precipitation The images above use daily precipitation statistics from NWS COOP, CoCoRaHS, and CoAgMet
NIDIS Intermountain West Drought Early Warning System October 30, 2018
 10/30/2018 NIDIS Drought and Water Assessment NIDIS Intermountain West Drought Early Warning System October 30, 2018 Precipitation The images above use daily precipitation statistics from NWS COOP, CoCoRaHS,
NIDIS Intermountain West Drought Early Warning System May 23, 2017
 NIDIS Drought and Water Assessment NIDIS Intermountain West Drought Early Warning System May 23, 2017 Precipitation The images above use daily precipitation statistics from NWS COOP, CoCoRaHS, and CoAgMet
MET Lecture 20 Mountain Snowstorms (CH16)
") MET 4300 Lecture 20 Mountain Snowstorms (CH16) Learning Objectives Provide an overview of the importance and impacts of mountain snowstorms in the western US Describe how topography influence precipitation
MET 4300 Lecture 20 Mountain Snowstorms (CH16) Learning Objectives Provide an overview of the importance and impacts of mountain snowstorms in the western US Describe how topography influence precipitation
NIDIS Intermountain West Drought Early Warning System November 13, 2018
 NIDIS Intermountain West Drought Early Warning System November 13, 2018 Precipitation The images above use daily precipitation statistics from NWS COOP, CoCoRaHS, and CoAgMet stations. From top to bottom,
Deploying the Winter Maintenance Support System (MDSS) in Iowa
 in Iowa") Deploying the Winter Maintenance Support System (MDSS) in Iowa Dennis A. Kroeger Center for Transportation Research and Education Iowa State University Ames, IA 50010-8632 kroeger@iastate.edu Dennis Burkheimer
Deploying the Winter Maintenance Support System (MDSS) in Iowa Dennis A. Kroeger Center for Transportation Research and Education Iowa State University Ames, IA 50010-8632 kroeger@iastate.edu Dennis Burkheimer
3.5 A CASE STUDY OF MESOSCALE AND PLUME DISPERSION MODELING FOR A FEBRUARY 2004 CLOUD SEEDING EVENT IN THE WALKER RIVER BASIN OF CALIFORNIA/NEVADA
 3.5 A CASE STUDY OF MESOSCALE AND PLUME DISPERSION MODELING FOR A FEBRUARY 2004 CLOUD SEEDING EVENT IN THE WALKER RIVER BASIN OF CALIFORNIA/NEVADA Arlen W. Huggins* Darko Koracin Domagoj Podnar Ming Xiao
4.1 THE SANTA BARBARA CLOUD SEEDING PROJECT IN COASTAL SOUTHERN CALIFORNIA, OPERATIONS AND RESEARCH SPANNING MORE THAN 50 YEARS
 4.1 THE SANTA BARBARA CLOUD SEEDING PROJECT IN COASTAL SOUTHERN CALIFORNIA, OPERATIONS AND RESEARCH SPANNING MORE THAN 50 YEARS Don A. Griffith * and Mark E. Solak North American Weather Consultants and
NIDIS Intermountain West Drought Early Warning System January 16, 2018
 NIDIS Drought and Water Assessment NIDIS Intermountain West Drought Early Warning System January 16, 2018 Precipitation The images above use daily precipitation statistics from NWS COOP, CoCoRaHS, and
Filling Gaps in Water Supply Predictions: The RIO-SNO-FLOW Project
 Filling Gaps in Water Supply Predictions: The RIO-SNO-FLOW Project Project Team: Colorado Water Conservation Board NOAA National Severe Storms Laboratory (NSSL) National Center for Atmospheric Research
PRECIPITATION. Last Week Precipitation:
 12/3/2014 NIDIS Drought and Water Assessment PRECIPITATION The images above use daily precipitation statistics from NWS COOP, CoCoRaHS, and CoAgMet stations. From top to bottom, and left to right: most
DRI s Cloud Seeding Program: Tahoe-Truck Project Results for Water Year Jeff Tilley, Arlen Huggins, and Robert David
 DRI s Cloud Seeding Program: Tahoe-Truck Project Results for Water Year 2013 Jeff Tilley, Arlen Huggins, and Robert David WRWC Planning Commission November 6, 2013 WY2013 Results: Tahoe-Truckee Basin CA-NV
March 1, 2003 Western Snowpack Conditions and Water Supply Forecasts
 Natural Resources Conservation Service National Water and Climate Center 101 SW Main Street, Suite 1600 Portland, OR 97204-3224 Date: March 17, 2003 Subject: March 1, 2003 Western Snowpack Conditions and
NIDIS Intermountain West Drought Early Warning System April 24, 2018
 NIDIS Intermountain West Drought Early Warning System April 24, 2018 Precipitation The images above use daily precipitation statistics from NWS COOP, CoCoRaHS, and CoAgMet stations. From top to bottom,
WSWC/NOAA Workshops on S2S Precipitation Forecasting
 WSWC/NOAA Workshops on S2S Precipitation Forecasting San Diego, May 2015 Salt Lake City at NWS Western Region HQ, October 2015 Las Vegas at Colorado River Water Users Association, December 2015 College
Precipitation. Standardized Precipitation Index. NIDIS Intermountain West Regional Drought Early Warning System December 6, 2016
 12/9/2016 NIDIS Drought and Water Assessment NIDIS Intermountain West Regional Drought Early Warning System December 6, 2016 Precipitation The images above use daily precipitation statistics from NWS COOP,
Analysis of the Mt. Crested Butte Ice Detector and Associated Measurements in Colorado during the Winter Season
 North American Weather Consultants, Inc. Analysis of the Mt. Crested Butte Ice Detector and Associated Measurements in Colorado during the 2015-2016 Winter Season Prepared for Colorado Water Conservation
One of the coldest places in the country - Peter Sinks yet again sets this year s coldest temperature record for the contiguous United States.
 One of the coldest places in the country - Peter Sinks yet again sets this year s coldest temperature record for the contiguous United States. In the early morning of February 22, 2010 the temperature
FEMA Hazards Loss Modeling Task Force (MOTF) Situation Report #14. Colorado Spring Flood Risk ***FINAL REPORT***
 Situation Report #14. Colorado Spring Flood Risk ***FINAL REPORT***") FEMA Hazards Loss Modeling Task Force (MOTF) Situation Report #14 Colorado Spring Flood Risk FEMA Modeling Task Force (MOTF) Denver Federal Center, Building 710A Denver, Colorado 80225 Email: FEMA-MOTF@fema.dhs.gov
FEMA Hazards Loss Modeling Task Force (MOTF) Situation Report #14 Colorado Spring Flood Risk FEMA Modeling Task Force (MOTF) Denver Federal Center, Building 710A Denver, Colorado 80225 Email: FEMA-MOTF@fema.dhs.gov
Applications/Users for Improved S2S Forecasts
 Applications/Users for Improved S2S Forecasts Nolan Doesken Colorado Climate Center Colorado State University WSWC Precipitation Forecasting Workshop June 7-9, 2016 San Diego, CA First -- A short background
-Assessment of current water conditions. - Precipitation Forecast. - Recommendations for Drought Monitor
 April 27, 2010 -Assessment of current water conditions - Precipitation Forecast - Recommendations for Drought Monitor 7 Day Precipitation 19-25 April 2010 Month-to-Date Precipitation 1-25 April 2010
Doug Kluck NOAA Kansas City, MO National Center for Environmental Information (NCEI) National Integrated Drought Information System (NIDIS)
 National Integrated Drought Information System (NIDIS)") National Integrated Drought Information System (NIDIS) for the Missouri River Basin Drought Early Warning Information System (DEWS) & Runoff Trends in the Missouri Basin & Latest Flood Outlook Doug Kluck
National Integrated Drought Information System (NIDIS) for the Missouri River Basin Drought Early Warning Information System (DEWS) & Runoff Trends in the Missouri Basin & Latest Flood Outlook Doug Kluck
The Documentation of Extreme Hydrometeorlogical Events: Two Case Studies in Utah, Water Year 2005
 The Documentation of Extreme Hydrometeorlogical Events: Two Case Studies in Utah, Water Year 2005 Tim Bardsley1*, Mark Losleben2, Randy Julander1 1. USDA, NRCS, Snow Survey Program, Salt Lake City, Utah.
PRECIPITATION. Last Week Precipitation:
 2/24/2015 NIDIS Drought and Water Assessment PRECIPITATION The images above use daily precipitation statistics from NWS COOP, CoCoRaHS, and CoAgMet stations. From top to bottom, and left to right: most
2011 National Seasonal Assessment Workshop for the Eastern, Southern, & Southwest Geographic Areas
 2011 National Seasonal Assessment Workshop for the Eastern, Southern, & Southwest Geographic Areas On January 11-13, 2011, wildland fire, weather, and climate met virtually for the ninth annual National
THE SANTA BARBARA CLOUD SEEDING PROJECT IN COASTAL SOUTHERN CALIFORNIA, SUMMARY OF RESULTS AND THEIR IMPLICATIONS
 THE SANTA BARBARA CLOUD SEEDING PROJECT IN COASTAL SOUTHERN CALIFORNIA, SUMMARY OF RESULTS AND THEIR IMPLICATIONS Don A. Griffith and Mark E. Solak North American Weather Consultants Sandy, Utah and Robert
HyMet Company. Streamflow and Energy Generation Forecasting Model Columbia River Basin
 HyMet Company Streamflow and Energy Generation Forecasting Model Columbia River Basin HyMet Inc. Courthouse Square 19001 Vashon Hwy SW Suite 201 Vashon Island, WA 98070 Phone: 206-463-1610 Columbia River
The Colorado Drought : 2003: A Growing Concern. Roger Pielke, Sr. Colorado Climate Center.
 The Colorado Drought 2001-2003: 2003: A Growing Concern Roger Pielke, Sr. Colorado Climate Center Prepared by Tara Green and Odie Bliss http://climate.atmos.colostate.edu 2 2002 Drought History in Colorado
NIDIS Intermountain West Drought Early Warning System August 8, 2017
 NIDIS Drought and Water Assessment 8/8/17, 4:43 PM NIDIS Intermountain West Drought Early Warning System August 8, 2017 Precipitation The images above use daily precipitation statistics from NWS COOP,
DK DM M EMORANDUM D ECEMBER 28, 2018 SUBJECT:
 TO: CC: FROM: SUBJECT: BOARD OF DIRECTORS M EMORANDUM D ECEMBER 28, 2018 ANDY MUELLER, GENERAL MANAGER DAVE DK KANZER, P.E. & DON MEYER, P.E. DK DM COLORADO RIVER BASIN WATER SUPPLY CONDITIONS UPDATE AND
NIDIS Weekly Climate, Water and Drought Assessment Summary Upper Colorado River Basin Pilot Project 13 July 2010
 NIDIS Weekly Climate, Water and Drought Assessment Summary Upper Colorado River Basin Pilot Project 13 July 2010 Precipitation and Snowpack Over the past week, precipitation in the Upper Colorado River
MULTI-AGENCY COORDINATION SYSTEM PUBLICATION CALIFORNIA FIRE WEATHER PROGRAM RISK PREPAREDNESS GUIDE MACS 410-3
 MULTI-AGENCY COORDINATION SYSTEM PUBLICATION CALIFORNIA FIRE WEATHER PROGRAM RISK PREPAREDNESS GUIDE MACS 410-3 August 26, 2013 California Fire Weather Program Risk Preparedness Guide Table of Contents
An Evaluation of Seeding Effectiveness in the Central Colorado Mountains River Basins Weather Modification Program
 An Evaluation of Seeding Effectiveness in the Central Colorado Mountains River Basins Weather Modification Program Submitted to Grand River Consulting Corporation by Research Applications Laboratory of
Oregon Water Conditions Report April 17, 2017
 Oregon Water Conditions Report April 17, 2017 Mountain snowpack continues to maintain significant levels for mid-april. By late March, statewide snowpack had declined to 118 percent of normal after starting
Missouri River Basin Water Management
 Missouri River Basin Water Management US Army Corps of Engineers Missouri River Navigator s Meeting February 12, 2014 Bill Doan, P.E. Missouri River Basin Water Management US Army Corps of Engineers BUILDING
Weather and Climate of the Rogue Valley By Gregory V. Jones, Ph.D., Southern Oregon University
 Weather and Climate of the Rogue Valley By Gregory V. Jones, Ph.D., Southern Oregon University The Rogue Valley region is one of many intermountain valley areas along the west coast of the United States.
Monthly Long Range Weather Commentary Issued: APRIL 1, 2015 Steven A. Root, CCM, President/CEO
 Monthly Long Range Weather Commentary Issued: APRIL 1, 2015 Steven A. Root, CCM, President/CEO sroot@weatherbank.com FEBRUARY 2015 Climate Highlights The Month in Review The February contiguous U.S. temperature
Funding provided by NOAA Sectoral Applications Research Project CLIMATE. Basic Climatology Colorado Climate Center
 Funding provided by NOAA Sectoral Applications Research Project CLIMATE Basic Climatology Colorado Climate Center Remember These? Factor 1: Our Energy Source Factor 2: Revolution & Tilt Factor 3: Rotation!
Great Lakes Update. Volume 193: 2015 January through June Summary. Vol. 193 Great Lakes Update August 2015
 Great Lakes Update Volume 193: 2015 January through June Summary The U.S. Army Corps of Engineers (USACE) monitors the water levels of each of the Great Lakes. This report provides a summary of the Great
Colorado CoCoRaHS. Colorado CoCoRaHS. Because Every Drop Counts! November 2014 Volume 2, Issue 11
 U.S. PRECIPITATION (% OF AVERAGE) LOOKING BACK AT OCTOBER 2014 October was a fairly dry month for much of the nation with the exception of the Pacific Northwest, portions of New England and the Tennessee
Souris River Basin Spring Runoff Outlook As of March 1, 2019
 Souris River Basin Spring Runoff Outlook As of March 1, 2019 Prepared by: Flow Forecasting & Operations Planning Water Security Agency Basin Conditions Summer rainfall in 2018 over the Saskatchewan portion
ASO in Colorado: supporting resilient water management through research support & emerging partnerships
 ASO in Colorado: supporting resilient water management through research support & emerging partnerships Jeffrey S. Deems Airborne Snow Observatory Western Water Assessment National Snow and Ice Data Center
Appendix 1: UK climate projections
 Appendix 1: UK climate projections The UK Climate Projections 2009 provide the most up-to-date estimates of how the climate may change over the next 100 years. They are an invaluable source of information
Folsom Dam Water Control Manual Update
 Folsom Dam Water Control Manual Update Public Workshop April 3, 2014 Location: Sterling Hotel Ballroom 1300 H Street, Sacramento US Army Corps of Engineers BUILDING STRONG WELCOME & INTRODUCTIONS 2 BUILDING
Souris River Basin Spring Runoff Outlook As of March 15, 2018
 Souris River Basin Spring Runoff Outlook As of March 15, 2018 Prepared by: Flow Forecasting & Operations Planning Water Security Agency Basin Conditions Summer rainfall in 2017 in the Saskatchewan portion
Wind River Indian Reservation and Surrounding Area Climate and Drought Summary
 Northern Arapaho Tribe Wind River Indian Reservation and Surrounding Area Climate and Drought Summary Spring Events & Summer Outlook 2015 Spring Was Warm And Very Wet Across The Region The spring season
1.Introduction 2.Relocation Information 3.Tourism 4.Population & Demographics 5.Education 6.Employment & Income 7.City Fees & Taxes 8.
 1.Introduction 2.Relocation Information 3.Tourism 4.Population & Demographics 5.Education 6.Employment & Income 7.City Fees & Taxes 8.Recreation & Activities 9.Climate Data 10.Economic Development History
Summary of the 2017 Spring Flood
 Ottawa River Regulation Planning Board Commission de planification de la régularisation de la rivière des Outaouais The main cause of the exceptional 2017 spring flooding can be described easily in just
-Assessment of current water conditions. - Precipitation Forecast. - Recommendations for Drought Monitor
 2 May 1 st, 2012 -Assessment of current water conditions - Precipitation Forecast - Recommendations for Drought Monitor AHPS Water Year Precipitation as Percentage of Normal 7-day average
Enhancing Weather Information with Probability Forecasts. An Information Statement of the American Meteorological Society
 Enhancing Weather Information with Probability Forecasts An Information Statement of the American Meteorological Society (Adopted by AMS Council on 12 May 2008) Bull. Amer. Meteor. Soc., 89 Summary This
-Assessment of current water conditions. - Precipitation Forecast. - Recommendations for Drought Monitor
 2 June 12, 2012 -Assessment of current water conditions - Precipitation Forecast - Recommendations for Drought Monitor 7-day average discharge compared to historical discharge for the day
Wind River Indian Reservation and Surrounding Area Climate and Drought Summary
 Northern Arapaho Tribe Wind River Indian Reservation and Surrounding Area Climate and Drought Summary Summer Events & Fall Outlook 2015 Summer Was Near, Precipitation Was Highly Variable Across The Region
Upper Missouri River Basin February 2018 Calendar Year Runoff Forecast February 6, 2018
 Upper Missouri River Basin February 2018 Calendar Year Runoff Forecast February 6, 2018 Calendar Year Runoff Forecast Explanation and Purpose of Forecast U.S. Army Corps of Engineers, Northwestern Division
Highlights of the 2006 Water Year in Colorado
 Highlights of the 2006 Water Year in Colorado Nolan Doesken, State Climatologist Atmospheric Science Department Colorado State University http://ccc.atmos.colostate.edu Presented to 61 st Annual Meeting
Water Year 2019 Wet or Dry?? Improving Sub-seasonal to Seasonal Precipitation Forecasting Jeanine Jones, Department of Water Resources
 Water Year 2019 Wet or Dry?? Improving Sub-seasonal to Seasonal Precipitation Forecasting Jeanine Jones, Department of Water Resources Sub-Seasonal to Seasonal (S2S) Precipitation Forecasting Operational
NIDIS Weekly Climate, Water and Drought Assessment Summary. Upper Colorado River Basin
 NIDIS Weekly Climate, Water and Drought Assessment Summary Upper Colorado River Basin August 3, 2010 Precipitation and Snowpack Fig. 1: July precipitation in inches Fig. 2: July precip as percent of average
MTO s Road Weather Information System (RWIS)
") MTO s Road Weather Information System (RWIS) Ontario Good Roads Association Managing Winter Operations Workshop October 19, 2017 Overview of MTO s Road Weather Information Station (RWIS) RWIS for Winter
MTO s Road Weather Information System (RWIS) Ontario Good Roads Association Managing Winter Operations Workshop October 19, 2017 Overview of MTO s Road Weather Information Station (RWIS) RWIS for Winter
Potential impacts of aerosol and dust pollution acting as cloud nucleating aerosol on water resources in the Colorado River Basin
 Potential impacts of aerosol and dust pollution acting as cloud nucleating aerosol on water resources in the Colorado River Basin Vandana Jha, W. R. Cotton, and G. G. Carrio Colorado State University,
An Overview of Operations at the West Gulf River Forecast Center Gregory Waller Service Coordination Hydrologist NWS - West Gulf River Forecast Center
 National Weather Service West Gulf River Forecast Center An Overview of Operations at the West Gulf River Forecast Center Gregory Waller Service Coordination Hydrologist NWS - West Gulf River Forecast
Cloud Seeding. By: Julie Walter Air Chem and Pollution
 Cloud Seeding By: Julie Walter Air Chem and Pollution History In Kurt Vonnegut s 1963 novel titled Cat s Cradle a young scientist has in his possession an ice crystal that has the power to freeze any liquid
Oregon Water Conditions Report May 1, 2017
 Oregon Water Conditions Report May 1, 2017 Mountain snowpack in the higher elevations has continued to increase over the last two weeks. Statewide, most low and mid elevation snow has melted so the basin
NIDIS Weekly Climate, Water and Drought Assessment Summary. Upper Colorado River Basin July 31, 2012
 NIDIS Weekly Climate, Water and Drought Assessment Summary Upper Colorado River Basin July 31, 2012 Fig. 1: July month-to-date precipitation in inches. Fig. 2: SNOTEL WYTD precipitation percentiles (50%
Great Lakes Update. Volume 191: 2014 January through June Summary. Vol. 191 Great Lakes Update August 2014
 Great Lakes Update Volume 191: 2014 January through June Summary The U.S. Army Corps of Engineers (USACE) monitors the water levels of each of the Great Lakes. This report provides a summary of the Great
Extreme Temperature Protocol in Middlesex-London
 Clean Air Partnership Webinar March 17, 2009 Extreme Temperature Protocol in Middlesex-London Presented by Iqbal Kalsi, MBA, CPHI(C), CCEP iqbal.kalsi@mlhu.on.ca 1 History Informal monitoring, tracking
Arizona Climate Summary February 2012
 Arizona Climate Summary February 2012 Summary of conditions for January 2012 January 2012 Temperature and Precipitation Summary January 1 st 20 th : The New Year has started on a very dry note. The La
Preliminary Runoff Outlook February 2018
 Preliminary Runoff Outlook February 2018 Prepared by: Flow Forecasting & Operations Planning Water Security Agency General Overview The Water Security Agency (WSA) is preparing for 2018 spring runoff including