MOBILITY AND SAFETY IMPACTS OF WINTER STORM EVENTS IN A FREEWAY ENVIRONMENT FINAL REPORT
|
|
|
- Eugenia Dickerson
- 6 years ago
- Views:
Transcription
1 MOBILITY AND SAFETY IMPACTS OF WINTER STORM EVENTS IN A FREEWAY ENVIRONMENT FINAL REPORT SponsoredbytheProjectDevelopmentDivision oftheiowadepartmentoftransportation andtheiowahighwayresearchboard Iowa DOT Project TR-426 CTREManagementProject98-39 February2000
2 Theopinions,findings,andconclusionsexpressedinthispublicationarethoseofthe authorsandnotnecessarilythoseoftheiowadepartmentoftransportation. CTRE'smissionistodevelopandimplementinnovativemethods,materials,andtechnologies forimprovingtransportationefficiency,safety,andreliability,whileimprovingthelearning environmentofstudents,faculty,andstaffintransportation-relatedfields.
3 MOBILITY AND SAFETY IMPACTS OF WINTER STORM EVENTS IN A FREEWAY ENVIRONMENT FINAL REPORT Principal Investigator Keith K. Knapp Assistant Professor of Civil and Construction Engineering Iowa State University Manager of Traffic Engineering and Traffic Safety Programs Center for Transportation Research and Education Transportation Research Specialist Dennis Kroeger Center for Transportation Research and Education Graduate Research Assistant Karen Giese Center for Transportation Research and Education The preparation of this report was financed through funds provided by the Iowa Department of Transportation through its research management agreement with the Center for Transportation Research and Education, CTRE Management Project and the Iowa Highway Research Board, TR-426. Center for Transportation Research and Education Iowa State University Iowa State University Research Park 2901 South Loop Drive, Suite 3100 Ames, IA Telephone: Fax: February 2000 i
4 TABLE OF CONTENTS LIST OF FIGURES... VI LIST OF TABLES... VIII EXECUTIVE SUMMARY...X INTRODUCTION...1 PROJECT BACKGROUND AND ORGANIZATION...1 PROJECT PURPOSE AND NEED...1 OBJECTIVES...3 REPORT ORGANIZATION...3 LITERATURE REVIEW...4 INTRODUCTION...4 WEATHER AND ROADWAY CAPACITY...4 WEATHER AND VOLUME/TRAVEL DECISIONS...5 WEATHER AND SPEED...6 WEATHER AND SAFETY...7 ROADWAY AND WEATHER CONDITION MEASUREMENTS...7 SITE SELECTION AND DATA COLLECTION...8 PROJECT PHASE I: ARCHIVED WINTER STORM EVENT DATA...8 Site Selection Criteria...8 Data Collection Sites Selected...9 Data Collected...9 PROJECT PHASE II: PROJECT-COLLECTED WINTER STORM EVENT DATA...20 Site Selection Criteria...21 Data Collection Site Selected...22 Data Collection Preparation...22 Winter Weather Data Collection Concerns...25 Winter Storm Event Data Collection...26 Post-Trip Data Collection...32 SUMMARY...32 WINTER STORM EVENT IMPACT ANALYSIS...32 PROJECT PHASE I: ARCHIVED WINTER STORM EVENT DATA...33 Winter Storm Event Traffic Volume Impacts...33 Winter Storm Event Crash Impacts...40 PROJECT PHASE II: PROJECT-COLLECTED WINTER STORM EVENT DATA...43 Winter Storm Event Speed Impact Statistical Analysis...47 Winter Storm Event Speed Impact Summary...53 APPLICATION OF RESEARCH RESULTS...53 WINTER WEATHER ROADWAY USER IMPACTS AND THE FORETELL INITIATIVE...54 FORETELL DESCRIPTION...54 The Application of Roadway User Impacts in FORETELL...56 WINTER WEATHER ROADWAY USER IMPACTS AND DES MOINES/IOWA ITS STRATEGIES...57 Description of Strategic Plan Components...57 The Application of Roadway User Impacts in the Des Moines Metropolitan Area ITS Strategic Plan...59 The Application of Roadway User Impacts and ITS Measures in Rural Iowa...60 SUMMARY...61 CONCLUSIONS AND RECOMMENDATIONS...62 iii
5 CONCLUSIONS...62 RECOMMENDATIONS...65 REFERENCES...67 APPENDIX...70 iv
6 LIST OF FIGURES FIGURE 1 DATA COLLECTION SITES COLLECTED... 9 FIGURE 2 AVERAGE DAILY TRAFFIC FLOW PROFILES (APRIL 1997, JEWELL, IOWA, ATR #104) FIGURE 3 AVERAGE SATURDAY TRAFFIC FLOW PROFILE (APRIL 1997) AND WINTER STORM EVENT (APRIL 12, 1997) VOLUMES FIGURE 4 ROADWAY SEGMENTS USED IN CRASH ANALYSIS FIGURE 5 TYPICAL TRAFFIC CONTROL PLAN FOR RURAL COUNTY ROADWAY OVERPASS FIGURE 6 AUTOSCOPE EQUIPMENT AND DATA COLLECTION TRAILER FIGURE 7 SNOWFALL INTENSITY AND STORM EVENT VOLUME REDUCTION FIGURE 8 MAXIMUM WIND GUST AND PERCENT STORM EVENT VOLUME REDUCTION FIGURE 9 MAXIMUM AVERAGE WIND SPEED AND PERCENT STORM EVENT VOLUME REDUCTION FIGURE 10 FACTORED WINTER WEATHER VOLUMES AND NON-STORM TRAFFIC FLOW PROFILE (1997 MUNICIPAL INTERSTATE FACTORS) FIGURE 11 PEAK AND OFF-PEAK PERIOD VOLUMES AND SPEEDS (PEAK = 4:00 TO 6:00 PM) FIGURE 12 OFF-PEAK PERIOD WINTER STORM EVENT VOLUMES AND SPEEDS (NO LOW-VOLUME TIME PERIODS) FIGURE 13 WINTER STORM EVENT OFF-PEAK PERIOD AVERAGE SPEED MODEL FIGURE 14 EXAMPLE APPLICATION OF WINTER WEATHER ROADWAY USER IMPACT MODELS FIGURE 15 DES MOINES METROPOLITAN PLANNING ORGANIZATION AREA vi
7 LIST OF TABLES TABLE 1 DATA COLLECTION SITES SELECTED TABLE 2 ROADWAY WEATHER INFORMATION SYSTEM (RWIS) SITE DATA AVAILABILITY TABLE 3 IOWA DEPARTMENT OF AGRICULTURE AND LAND STEWARDSHIP (ADALS) AND NATIONAL WEATHER SERVICE (NWS) SITES USED FOR DAILY SNOWFALL TABLE 4 WINTER STORM EVENTS IDENTIFIED AND DEFINED FOR AMES, IOWA, DATA COLLECTION SITE (RWIS #512 AND ATR #104) TABLE 5 INTERSTATE ROADWAY SEGMENTS USED FOR CRASH ANALYSIS TABLE 6 MOBILE VIDEO DATA COLLECTION SITES SELECTED (BRIDGES OVER INTERSTATE 35) TABLE 7 WINTER STORM EVENT DATA COLLECTION TIME PERIODS TABLE 8 ROADWAY CONDITION GUIDELINES CROSS SECTION PERCENT SNOW COVER TABLE 9 WINTER STORM EVENT TRAFFIC VOLUME IMPACT SUMMARY TABLE 10 WINTER STORM EVENT TRAFFIC VOLUME REGRESSION ANALYSIS RESULTS TABLE 11 WINTER STORM EVENT CRASH IMPACT SUMMARY TABLE 12 WINTER STORM EVENT CRASH FREQUENCY POISSON MODEL REGRESSION RESULTS TABLE 13 WINTER STORM EVENT SPEED DATA SUMMARY TABLE 14 WINTER STORM EVENT AVERAGE VEHICLE SPEED REGRESSION ANALYSIS RESULTS (OFF-PEAK AND NO LOW-VOLUME TIME PERIODS) viii
8 EXECUTIVE SUMMARY Several factors influence a driver s decision to travel, choice of vehicle speed, and the safety of a particular trip. These factors include, among others, the trip purpose, time of day, traffic volumes, weather and roadway conditions, and the range of vehicle speeds on the roadway. The main goal of the research project summarized in this report was the investigation of winter storm event impacts on the volume, safety, and speed characteristics of interstate traffic flow. This report describes the tasks completed as part of the project Mobility and Safety Impacts of Winter Storm Events in a Freeway Environment. During this time period a literature review of weather-related speed and trip choice factors, roadway weather information systems, and traveler information dissemination was completed. In addition, weather and roadway condition data, hourly traffic volumes, and vehicle crash information from the 1995/1996, 1996/1997, and 1997/1998 winter seasons were requested for a number of Iowa interstate locations. The Iowa Department of Transportation (Iowa DOT) provided these data from its roadway weather information system (RWIS), automatic traffic recorders (ATRs), and accident location and analysis system (ALAS). Archived daily precipitation data were also acquired from the Iowa Department of Agriculture and Land Stewardship (IDALS) (i.e., the State Climatologist Office) and the National Weather Service (NWS). Traffic flow, weather, and roadway condition characteristics at one interstate location were also collected with video data collection equipment during seven 1998/1999 winter storm events. The first phase of this project included the collection, use, and analysis of archived weather and roadway condition data, traffic volumes, and vehicle crash information. First, the data collection activities are described, and how the data were manipulated to identify and define a winter storm event documented. More specifically, a winter storm event in this research was defined by the RWIS data, and included those hours with below freezing air and roadway temperatures, a wet pavement condition, and precipitation. Snowfall rates (or intensity) were also calculated for these hours with the daily snowfall data from the IDALS and NWS. Consideration of only the more severe winter storm events was the objective, however, and only those events with a duration of four hours and an average snowfall intensity of 0.20 inches per hour or higher were analyzed. Overall, 64 events or 618 hours of data were identified with these characteristics. In Phase I of this research the impact of these winter storm events on traffic volumes and crashes were investigated and evaluated. An analysis of the weather and volume data indicated that the existence of winter storm characteristics generally decreases traffic volumes. Data from seven Iowa interstate locations show that the overall average reduction in traffic volumes (during the winter storm events considered in this research) was approximately 29 percent. Average winter storm event traffic volume reductions by location ranged from approximately 16 percent to 47 percent. However, there was a large variability in the impact of individual winter storm events on traffic volume. For example, three of the 64 winter storm events analyzed actually showed an increase in overall traffic volumes (i.e., 2 to 42 percent). A statistical regression analysis of the weather and volume data indicated a positive relationship (for a 95 percent confidence interval) between the average winter storm event traffic volume reductions, total storm event snowfall, and the square of wind gust speed. Winter storm event volume reductions can be expected to increase with an increase in these variables (within the range of the data considered). x
9 An analysis of the weather and crash data indicated a decrease in safety during winter storm events. A 30-mile roadway segment adjacent to and centered at each of the seven RWIS stations was used for evaluation purposes. An overall increase from to crashes per hour (a 942 percent increase) was found for the winter storm events identified. An overall increase in crash rate of approximately 1,300 percent was also calculated. The increase in hourly frequency and crash rate increase results, however, varied from 523 (n = 10) to 5,273 (n = 4) percent and 608 (n = 10) to 11,266 (n = 4) percent, respectively. Fortunately, these increases represent a percent change (due to winter storm events) from hourly crash frequencies and rates that are normally very small. The magnitude of these increases are also not completely surprising because this research only considered relatively severe winter storm events in other words, periods when traffic volumes decrease at the same time crashes inevitably increase. A statistical analysis of the crash frequency and several weather-related characteristics was done. This analysis indicated that the number of winter storm event crashes was significantly related to exposure (i.e., vehicle miles traveled), winter storm event duration, and total snowfall. The number of crashes during a winter storm event can be expected to increase as these variables increase. The second phase of this project involved the field collection of interstate traffic flow, roadway, and weather characteristics. These data were collected manually and with mobile video traffic detection equipment during the 1998/1999 winter season. The selection and preparation of the data collection locations, the notification procedure and traffic control plan developed, and the equipment used in these data collection activities are described in this report. In addition, the factors that impacted where, how, and when winter storm event traffic flow data could be collected are discussed. A statistical analysis of the data collected during seven 1998/1999 winter storm events indicated that average 15-minute vehicle speeds are significantly lower during poor winter weather. The measured average vehicle speed during normal conditions was about 72 miles per hour. However, during the seven winter storm events considered the average vehicle speed was approximately 60 miles per hour. Average free-flow speeds (i.e., the average speed of vehicles with at least a 450-foot gap) were calculated to be approximately 72 and 64 miles per hour, respectively, during normal and winter storm event conditions. A regression analysis indicated a statistically significant relationship between average off-peak period vehicle speed and the square of hourly volume, a visibility index (greater or less than ¼ mile), and roadway cover index (snow on or off the roadway lanes). Overall, average off-peak period winter storm event vehicle speeds increased from low volume situations with poor weather conditions to near-normal volume situations with near-normal weather conditions. For this reason, the volumes in this model are believed to be surrogate measures of the weather variables that were not collected during the seven winter storm events. For example, the analysis in phase one showed that percent winter storm event volume reductions were related to total snowfall and the square of wind gust speed (data not available or collected during phase two). The magnitude of the percent volume reduction in the 15-minute traffic volumes collected during these seven winter storm events is similar to the phase one results of this project. Visibility levels smaller than ¼-mile was found to reduce average off-peak vehicle speeds by approximately 4 to 5 miles per hour, and snow on the roadway lanes by approximately 5 to 7 miles per hour. A combination of the two characteristics could reduce average off-peak vehicle speeds by as much as 12 miles per hour. xi
10 The models that resulted from this research can be applied in conjunction with each other to produce expected winter storm event volume and speed reductions (i.e., event travel and delay impacts), and crash increases (i.e., event safety impacts). Combined with an estimate of the value of delay and/or crashes, these models could be used to approximate the average financial impacts on travelers of winter storm events, and this could be incorporated into winter maintenance policies and procedures. However, confidence in the results of these models must be significant to allow their general use. Further refinement of the models developed, using additional data (from Iowa or elsewhere), is necessary to achieve this level of confidence. The current models should only be used with an understanding of their limited basis. The usefulness of the research results (with some model refinement) is discussed for two ongoing case study projects. These projects are attempting to improve winter maintenance and weather forecasting (e.g., the FORETELL project), and traffic flow in general (e.g., the Des Moines Area Intelligent Transportation System Strategic Plan). The results of this research are directly applicable to these projects and their goals for improved roadway mobility and safety in all weather and roadway conditions. This is the final report for the Safety and Mobility Impacts of Winter Storm Events in a Freeway Environment project. xii
11 INTRODUCTION The traffic volumes, crashes, and vehicle speeds experienced along a roadway segment are a function of its prevailing traffic flow and roadway characteristics (e.g., heavy vehicles and lane widths). This idea forms the basis for many of the methods used to evaluate traffic flow operations. These methods typically assume good weather, adequate pavement conditions, and an incident-free roadway environment. During a typical year, Iowa experiences a number of time periods with poor weather and/or roadway pavement conditions. In many cases, these time periods occur during the winter season when high winds, snowfall, and the resultant blowing snow are relatively commonplace. The mobility and safety offered by a roadway segment is compromised during those time periods. This report documents an investigation into the impact of winter storm events on the mobility and safety characteristics of freeway segments. Project Background and Organization The weather has a significant impact on vehicle travel in Iowa. However, the ability to travel in a safe manner at significant speeds is often expected, especially on the interstate system. On September 31, 1998, the Center for Transportation Research and Education (CTRE) presented a problem statement to the Iowa Highway Research Board. This problem statement proposed an investigation into the impacts of winter storm events on traffic volumes, crashes, and vehicle speeds within the freeway environment. The problem statement was approved, and on October 30, 1998, the proposal and funding for the project were initiated. Work began immediately, because one task of the Mobility and Safety Impacts of Winter Storm Events in the Freeway Environment project was the collection of data during storm events of the 1998/1999 winter season. The proposed research project consisted of two major phases. The first phase included a review of the literature, and the collection and investigation of archived roadway/weather data, traffic volume data, and crash data. These data were analyzed, evaluated, and any relevant relationships documented. The second phase of the project included the collection and analysis of traffic flow, roadway characteristics, and visibility for storm events that occurred during the 1998/1999 winter season. All these data, except for the visibility estimates, were collected using a video data collection and monitoring system at one interstate location. An evaluation of the 1998/1999 winter season data collection procedures, traffic control plan, and equipment is described in this report. In addition, the data collected were analyzed and their results documented. Project Purpose and Need A more comprehensive knowledge of the traffic volume, speed, and safety impacts of winter storm events will improve the decision-making capabilities of drivers and those responsible for roadway operations and maintenance. If drivers are provided with more accurate and understandable information about their probable vehicle speed and crash possibilities (given existing or forecast weather and roadway conditions), it is expected that drivers would make more informed and rational travel decisions (e.g., Should I travel?). 1
12 Currently, the relationships among vehicle speed, crashes, and existing weather and roadway conditions are not clearly understood. In the past, the ability to collect and match this type of information was very time consuming if not impossible. In addition, the ability to collect traffic flow data during actual winter storm events was not feasible. Fortunately, new and/or updated data collection equipment and crash information systems have dramatically improved our capabilities in these areas. The purpose of this research was to take advantage of these new capabilities, and investigate and more clearly understand the relationships among weather/roadway conditions, vehicle speeds, traffic volumes, and crashes. As previously mentioned, winter storm events in Iowa can have a significant impact on intrastate and interstate travel. This is true despite the constant vigilance of winter maintenance staff at all levels of government (i.e., local, county, and state). Combinations of high-speed winds and large amounts of snowfall sometimes produce situations in which drivers must adjust their travel and/or driving approach (e.g., choice of speed) in order to maintain a comfortable level of safety. The inability of a driver to match travel plans and driving characteristics with actual, perceived, or forecast roadway conditions can result in a crash and its unfortunate consequences. There is a need for a method or procedure to assess and quantify how the existence, characteristics, and/or consequences of a winter storm event is expected to impact the operation and safety of traffic flow along a freeway segment. The ability to assess and quantify the potential mobility and safety impacts of a winter storm event will improve our ability to communicate these impacts to the public in terms they can better understand (e.g., average vehicle speed reduction, potential for delay, and expected increase in crash potential). Another objective of this research was to match roadway and weather conditions (similar to those experienced by a typical traveler) with their expected speed and safety impacts. The results documented in this report will advance the scope of knowledge in this area of research and assist in the completion of this objective. It is expected that the ability to clearly communicate winter storm event mobility and safety impacts will decrease the number of people traveling and/or involved in crashes during winter storm events, and improve the safety of the general public and winter maintenance vehicles (by removing travelers from roadways during poor weather conditions). A traveler s ability to understand a description of weather and roadway conditions, and the impact these conditions might have on a typical driver s speed choice and safety, should change his or her decisionmaking process and safety-risk criteria. Crashes or run-off-the-road incidents during winter storm events may also decrease when a benchmark speed has been provided for the expected conditions. Eventually, providing this type of information to the general public in real time should improve winter driving decisions. This report describes the incorporation of the models developed in this research into two ongoing project case studies. Finally, the results of this research should assist the Iowa DOT with its identification of roadway and weather conditions that impact the traveling public more dramatically. This identification, therefore, might eventually include a component based on quantitative customer (i.e., traveler) impacts. In some cases, this additional input may identify critical winter maintenance situations that are different than those currently considered. The ability to estimate the operation and safety of a roadway based on available or projected environmental data should also help in the development of winter maintenance standards and policies. In addition, more quantifiable and 2
13 informed resource allocation and operational/safety response decisions can be made. Providing this type of information to winter maintenance decision-makers should illustrate how their customers (i.e., the drivers) are impacted by certain weather and roadway conditions, and possibly allow them to adjust their response decisions accordingly. Objectives The objectives of the Mobility and Safety Impacts of Winter Storm Events in a Freeway Environment research project were accomplished through the completion of the following activities: Complete a literature review of the speed choice behavior; the impacts of weather and roadway conditions upon traffic volume, speeds, and crashes; visual identification of roadway conditions; and the use of roadway weather information for winter maintenance purposes Acquire archived weather/roadway data for several Iowa interstate locations from RWIS/IDALS/NWS, hourly traffic volumes from the ATR system, and hourly crash data from the ALAS Define the existence and duration of a winter storm event using data from the RWIS, IDALS, and NWS for several locations Determine average daily traffic flow profiles and storm event traffic flow profiles for the ATR stations closest to each RWIS unit (i.e., those RWIS units used to define the storm events) Determine typical and winter storm event hourly crash frequencies and approximate crash rates for the roadway segments adjacent to each RWIS unit (i.e., those RWIS units used to define the storm events) Investigate, analyze, and compare winter storm and non-storm event traffic volumes and crashes Develop a procedure and evaluate winter storm event mobile video data collection Collect traffic flow, roadway condition, and visibility data during as many storm events as possible during the 1998/1999 winter season Investigate relationships among winter storm event average 15-minute vehicle speed, traffic volume, vehicle gap and/or headway, visibility, and roadway conditions for the 1998/1999 winter season data Produce conclusions and recommendations based on the analysis and comparison of archived weather/roadway conditions, traffic volumes, and crashes, and the data collected during seven 1998/1999 winter storm events Report Organization The next section of this report summarizes and describes past research about the speed choice of drivers and the impacts of weather on roadway capacity, travel decisions/traffic volumes, vehicular speed, and safety. The measurement of roadway and weather conditions, and the dissemination of this information to the traveling public are also discussed. Section three of this 3
14 report describes the criteria used for the selection of the data collection sites, how and what type of data was collected, and how the data were used and/or analyzed during both phases of the project. Data collection procedures used for mobile winter storm video data collection are discussed, areas of concern with the procedure and equipment are identified, and recommendations for improvement provided. Section four describes the analysis of the data collected during both phases of the project. More specifically, storm and non-storm traffic volumes, crashes, and speeds are summarized and compared. Section five describes how the results of this project might be used or incorporated into two ongoing case study projects. Finally, section six presents conclusions and recommendations based on the literature review, data collection, and data analysis. LITERATURE REVIEW Introduction There are a number of factors that influence the vehicle speed choice of a driver (1). Some of these factors include: Roadway characteristics Amount of traffic Weather conditions Time of day Speed limit and enforcement Trip length Trip purpose Vehicle operating capabilities Driver risk-taking characteristics These factors (and others) impact the safety versus travel-time tradeoff drivers consciously or unconsciously make when choosing a vehicle speed (1). The boundary conditions for this type of decision include not traveling at all (i.e., a vehicle speed of zero) or driving as fast as the vehicle and road will allow. Driving faster will reduce travel time, but it also increases the severity of a crash (i.e., reduces safety), and possibly the probability of crash involvement (1). The safety versus travel-time tradeoff made by a driver is most obvious during poor weather and/or with snow-impacted roadway conditions. In these situations drivers reduce their vehicle speed (whatever the speed limit) and increase their travel time, but also increase their perceived or actual safety level. The focus of this research project is the relationship between winter storm event roadway and weather conditions, speed choice, crash experiences, and traffic volumes. Weather and Roadway Capacity There has been some research done on the capacity impacts of poor weather. Three studies were found that considered the impact of snow or rain on the capacity of a freeway segment (2, 3, 4). A study in Houston, Texas, revealed that rain events reduced the capacity of an Interstate 45 4
15 segment by 14 to 19 percent (2). Similarly, a study of Interstate 35W in Minneapolis, Minnesota, indicated a reduction of 8 percent for even a trace of precipitation (3). The study also found that each additional 0.01 inch/hour of rain (beyond the initial trace) decreased capacity by 0.6 percent (3). The impact of snow was even more dramatic for every additional 0.01 inch/hour (water equivalent) of snow there was a 2.8 percent decrease in capacity (3). This reduction in capacity was verified by research in Michigan, but a significant amount of variation in the overall reduction was also found (4). In addition, a more recent study modeled a reduction in maximum traffic flow (i.e., capacity) due to the presence of rain (5). None of the studies, however, tried to relate traffic or safety characteristics (e.g., vehicle speed or crashes) to the existence or characteristics of a rain or snow event. The Transportation Research Board (TRB) has also stated that large variations in roadway operations should be expected due to weather events, and that 10 to 20 percent reductions in capacity are considered typical (6). Hall and Barrow also found that the traffic volume needed to produce congested conditions decreased when it was raining or snowing (7). TRB recommends that adverse weather effects be considered in the design of facilities that regularly experience these phenomena (6). However, it does not quantify exactly when and how these weather impacts should be considered. A new Highway Capacity Manual by TRB is planned for the year This new manual is expected to include more information on the impacts of weather on traffic flow characteristics (e.g., capacity). Weather and Volume/Travel Decisions Hanbali and Kuemmel have investigated volume reductions due to winter storms (8). They collected traffic volume and weather data (i.e., storm period, high/low temperature, and depth/type of participation), primarily from three winter months in Then they calculated traffic volume reductions for different ranges of total snowfall, average daily traffic, roadway type, time of day, and day of the week (8). Overall the traffic volume reductions ranged from 7 to 56 percent depending on the category of winter event (8). Hanbali and Kuemmel concluded that volume reductions increased as the total amount of snow increased, and that the decreases were smaller during peak travel hours (versus off-peak hours) and on weekdays (versus the weekend) (8). A 1977 Federal Highway Administration (FHWA) study had similar findings (9). Volume reductions observed during adverse weather conditions were found to depend on, among other things, the time of day, trip purpose, the existence of a well-maintained parallel route, normal traffic volume levels, the type of roadway, and the pavement surface level of service achieved by the local maintenance crews (9). The impact of winter weather on traffic flow is also related to the characteristics of the storm event (e.g., depth of snow, duration of storm) (10). In a recent study of pavement friction as a maintenance tool Nixon also investigated the impact of a winter storm on observed volumes (11). He considered two days of storm and non-storm event volumes collected at a case study ATR location near Council Bluffs, Iowa, on Interstate 80/29. An analysis of the case study data suggested that traffic volumes decrease during winter storm events (11). The research documented in this report expands upon Nixon s traffic volume case study, and also measures vehicle speed during actual winter storm events. 5
16 Weather and Speed One measure of traffic flow mobility is vehicle speed. In an economic analysis of winter weather maintenance, Hanbali used a FHWA study that found an average range of speed reduction due to snow and ice conditions of 18 to 42 percent on two-lane roadways and 13 to 22 percent on freeways (9, 12). One benefit of winter weather maintenance, therefore, is a decrease in travel time (9). A Swedish study (referenced by Brown and Baass, (21)) also found a 10 to 30 percent reduction in speed due to the existence of ice and snow conditions (13). Another study, however, concluded that speed reductions might be determined more by roadway appearance than the actual friction levels provided, and that the speed reductions observed are typically higher when slippery roadway conditions are combined with precipitation (14). The impact of visibility on vehicle speed has also been considered. Liang, et al studied a 15-mile segment of Interstate 84 in Idaho (15). Traffic volume data were collected by ATRs, and visibility by two point detection systems and one laser ranging device. From December 1995 to April 1996 there were 21 days with extreme weather conditions. Speed data from foggy days revealed an average speed reduction of five miles per hour when compared to average clear day speeds. Data from days with snow, on the other hand, showed that speeds were impacted by more variables than visibility. A generalized linear model was developed that described speed as a function of visibility, snow cover, light, temperature, and wind. Overall an average speed reduction of 11.9 miles per hour was observed during snow events, but the data were highly variable. Liang, et al concluded that the measured speed reductions resulted from a perceived reduction in safety by drivers (15). Other studies has categorized weather events and evaluated their impact on operating free-flow vehicle speeds. For example, Lamm, et al. considered 24 rural two-lane highways during dry and wet conditions, but found no statistical difference in operating speed (16). However, visibility was not limited during any of the rain events considered. Ibrahim and Hall, on the other hand, found site-specific reductions in free-flow speed of 1.2 mph (2 kilometers per hour (kph)) for light rain, 1.9 mph (3 kph) for light snow, 3.1 to 6.2 mph (5 to 10 kph) for heavy rain, and 23.6 to 31.0 mph (38 to 50 kph) for heavy snow (17). These reductions should be used with caution, however, because they may represent the impact of other site-specific characteristics. In a German study, Brilon and Ponzlet found vehicle speeds were reduced by 3.1 mph (5 kph) at night and 5.9 to 7.4 mph (9.5 to 12 kph) when roadways were wet (18). Finally, there are several proposals for the inclusion of currently unpublished speed-weather relationship data in the 2000 Highway Capacity Manual. These proposals include incorporating references in the 2000 Highway Capacity Manual on the reduction of free-flow speed for different weather conditions. Ongoing studies have shown that light precipitation and heavy rain may have larger free-flow speed impacts than previously documented, and that high winds may also have an impact. Some countries and states have also proposed or implemented winter weather information and intelligent transportation system applications. In fact, studies have shown that weather controlled speed limit and/or variable message displays will decrease the average and standard deviation of vehicle speeds, and increase vehicle spacing (e.g., decrease volumes) (19). In addition, these reductions in speed limits, if appropriate, appear to be acceptable to drivers (19). A 1975 study by McWhinney found similar results when drivers were notified of bridge ice by automated signs (20). Weather information can be provided to the traveling public through a number of automated methods including cellular phones, rest area kiosks, radio, in-vehicle systems, and television. 6
17 Weather and Safety Some studies have investigated certain aspects of winter storm safety. Hanbali considered the economic impacts of winter road maintenance on roadway users and found a significant decrease in crash rates before and after deicing maintenance activity (12). The results of several Swedish studies (as reported by Brown and Baass) have supported Hanbali s findings, and also indicate that severe injury rates on roads with snow and ice can be several times greater than roadways under non-winter conditions (21, 22, 23). ). Research by Perry and Symons concurred, but also found that total injuries and fatalities increased by 25 percent on snowy days, and that the rate of injuries and fatalities increased by 100 percent (10). A Quebec, Canada study, on the other hand, found that winter months (December to March, inclusive), when compared to summer months, have higher minor and material damage accident rates, but lower severe and fatal accident rates (21). A 1977 FHWA study had similar findings, and showed that fatal crash rates were lower for snowbelt states (i.e., Minnesota, Wisconsin, and Michigan) during their winter months than crash rates during those same months in nonsnowbelt states (9). The study results for injury crash rates, however, were the exact opposite (9). The snow may be acting as a cushion during winter season crashes, and speeds may be slower. The research in this project is expected to verify and expand upon the some of the results from these past studies. Nixon has also suggested that one method of quantifying the safety of a winter roadway would be to identify the pavement friction levels during poor weather conditions (11). Currently, the condition of a roadway pavement during winter maintenance activities is usually verified visually (e.g., bare pavement). Nixon recommends that pavement friction levels be studied during winter storms (11). The second phase of this research considered using pavement friction data as a factor in the analysis of winter storm event vehicle speeds, but the quality and quantity of the data during the 1998/1999 winter season was not adequate. Roadway and Weather Condition Measurements Finally, some researchers have also investigated the ability to classify roadway pavement conditions with digitized video images (24). Kuehnle and Burghout collected 69 color images of various roadway surface conditions (24). They then classified these video images by completing a statistical analysis of the relationship between their quantitative features (i.e., the red, green, blue, gray brightness levels) and the identified roadway surface conditions. The results of this analysis were used to develop a neural network and predict roadway surface conditions from a given video image. The researchers found that the condition of a roadway could be approximated from a video image but that it was difficult to distinguish between icy and wet pavements (24). Typically, roadways were identified as dry or snow-covered. It is expected that the technology evaluated by Kuehnle and Burghout could be useful in the future. Several studies have also evaluated the use of NWS and RWIS data to improve winter maintenance decision-making (25, 26). One study developed a software program that produced weather forecasts based on NWS information (25). The forecasts produced by the program were available at shorter intervals than the NWS updates, and also allowed the integration of local terrain and roadway networks. It was believed that the availability and use of this program allows 7
18 more applicable and efficient winter maintenance decisions (25). The FORETELL project, discussed in the fifth section of this report, also includes the improvement and dissemination of weather forecasts for winter maintenance purposes. RWIS stations are located adjacent to roadways throughout Iowa and at many locations throughout the country. These stations actively collect roadway pavement condition and weather data. Some of the data typically collected at an RWIS station include air and pavement temperatures, pavement conditions (e.g., wet, dry), and the existence of precipitation. In the early 1990s Boselly studied the benefits of these systems to winter maintenance decision-makers (26). He specifically considered the reductions in labor, equipment, and materials that the data allow, and found that these reductions were worth five times more than the cost of the RWIS installation (26). Similar cost efficiencies for properly implemented and applied RWISs have also been shown in other United States and Finnish studies (12, 27). Boselly also discussed several of the benefits RWIS offers winter maintenance decision-makers (26). For example, with RWIS data winter weather roadway levels of service should improve because the information available allows more applicable, efficient, and quicker winter maintenance decisions. RWIS data also allow roadway and weather condition forecasts or reports to be verified. In other words, there should be fewer instances of incorrect maintenance vehicle dispatch decisions (e.g., maintenance vehicles are on the roadway due to a forecast, but not actual roadway conditions). RWIS data also help winter maintenance decision-makers decide when to start and stop snow and ice control, and more closely match the amount of deicer spread to the amount needed (26). Indirect benefits from improved winter maintenance decisions (based on RWIS data) can also include improved traffic flow, and reduced crash rates, fuel consumption, and insurance premiums. Also, if RWIS stations are located correctly the data received might substitute for some patrolling activity of roadway problem areas. Iowa currently has 50 RWIS stations and continues to experience many of these benefits. Some of the data from all these stations are now available on the Internet. This research project takes advantage of the archived data currently available from the Iowa RWIS. SITE SELECTION AND DATA COLLECTION Project Phase I: Archived Winter Storm Event Data The first phase of this research project involved the collection, manipulation, and analysis of roadway and weather condition data from the Iowa RWIS/IDALS and NWS; hourly traffic volumes from the ATR system; and crash data from the ALAS. More specifically, the impacts of a winter storm (identified from the RWIS/IDALS/NWS data) on traffic volumes (from the ATRs) and crash data (from the ALAS) were investigated. The following paragraphs describe the criteria used in this phase of the project to select data collection sites, the sites selected, the type of data collected at each site, and how those data were used in the analysis described in the next section of this report. Site Selection Criteria The focus of this research project was an investigation of the impacts of winter storms on traffic mobility and safety. The first criterion for the data collection sites used in this research was that they be in the highly controlled interstate roadway environment. This type of control was 8
19 necessary to minimize the number of factors, other than roadway pavement and weather conditions, which might influence traffic flow characteristics. For example, the ability to ignore the speed- and crash-related impacts of certain geometric factors (e.g., driveways) simplified the analysis of the data. All of the data collection sites used in this research were located on the interstate system in Iowa. A second requirement for each data collection site was the existence of nearby RWIS and ATR stations. A RWIS station was needed to identify when winter storm event characteristics existed near the interstate roadway. This information was then combined with precipitation data from a nearby NWS or IDALS observer site (each county in Iowa has one or more observers). The nearby ATR station, on the other hand, was required to estimate the hourly traffic volumes occurring on the interstate roadway segment of interest (i.e., adjacent to the RWIS station) during those winter storm conditions. One objective was to also analyze RWIS and ATR data from the last three winter seasons (before the 1998/1999 season). Therefore, all the data collection sites also had to have RWIS and ATR stations that existed in Data collection sites from throughout the state was also a goal. Data Collection Sites Selected Iowa has 50 RWIS sites dispersed throughout the state. Approximately 27 of these sites are on the interstate system, but six of these sites were installed in Initially, nine interstate roadway locations with nearby RWIS and ATR stations were identified for data collection purposes. The RWIS and ATR pairs for each of these sites are shown in Figure 1 and listed in Table 1. The locations listed in Table 1 were chosen for data collection purposes because they met most or all of the criteria previously discussed. A preliminary analysis of the RWIS and ATR data available at each of these sites, however, produced some data reliability questions at two locations. The data collection sites on Interstate 29 near Council Bluffs, Iowa, (ATR 704/RWIS 170) and Onawa, Iowa, (ATR 105/RWIS 604) were subsequently dropped from further consideration. Data Collected Three databases were created for each of the sites shown on Figure 1 and listed in Table 1. Archived roadway and weather condition data were collected from each RWIS location and daily snowfall precipitation from nearby IDALS/NWS observer stations (28, 29). These roadway/weather RWIS and IDALS/NWS data were used to define, identify, and determine the time periods when significant winter storm events most likely occurred along the interstate roadway segment of interest. Hourly traffic volumes were also collected from the ATR site closest to the RWIS station (see Figure 1 and Table 1). These data were used to determine the traffic flow characteristics during winter storm and average non-storm event time periods. Finally, crash data from ALAS were collected for a 30-mile interstate roadway segment adjacent to and centered at each RWIS location. The objective of phase one was to use this data to determine whether there was a difference between the number of crashes during winter storm and average non-storm event time periods. Specifics about how the data were adjusted for use in the storm impact analysis are described in the following sections of this report. 9
20 Figure 1 Data Collection Sites Selected 10
21 Table 1 Data Collection Sites Selected 1, 2 Interstate RWIS Location #133 I-235, Des Moines, Iowa (MP 6) #170 I-29, Council Bluffs, Iowa (MP 47) #512 I-35, Ames, Iowa (MP 113) #604 I-29, Onawa, Iowa (MP 104) #606 I-380, Cedar Rapids, Iowa (MP 21) # 615 I-80, Grinnell, Iowa (MP 183) #619 I-35, Mason City, Iowa (MP 187) #620 I-80, Adair, Iowa (MP 70) #624 I-35, Leon, Iowa (MP 13) Closest Interstate ATR Location #700 I-235, At Pennsylvania Avenue, Des Moines, Iowa (MP 8) #704 I-29/I-80, 1.0 KM West of Iowa 192, Council Bluffs, Iowa (MP 2) #104 I-35, 4.8 KM North of Iowa 175, Jewell, Iowa (MP 136) #105 I-29, 6.1 KM South of Iowa 175, Onawa, Iowa (MP 108) #703 I-380, At J Avenue South of Coldstream, Cedar Rapids, Iowa (MP 22) #103 I-80, 8.0 KM East of Iowa 146, Grinnell, Iowa (MP 187) #109 I-35, 4.8 KM North of County B20, Hanlontown, Iowa (MP 200) #115 I-80, 3.2 KM East of U.S. 71, Atlantic, Iowa (MP 62) #106 I-35, 2.4 KM North of Iowa 2, Leon, Iowa (MP 14) 1 MP = milepost, approximate location, KM = kilometers 2 RWIS 170 and 604 were dropped from further analysis due to data concerns Approximate Separation (Miles) Roadway and Weather Conditions Archived roadway and weather condition data from 1993 to 1998 were requested from the Iowa DOT for 16 of the 21 interstate RWIS sites. However, the reconstruction of the RWIS computer system during this project and the usefulness of the data available limited the number of sites and years that could be considered. Data from 1995, 1996, 1997, and 1998 were provided for 10 of the interstate RWIS sites requested. Nine of these sites were originally considered (See Figure 1 and Table 1), but due to data reliability concerns at two sites only seven sites were actually used (RWIS #170 and #604, see Table 1, were dropped from consideration). Table 2 indicates the time periods for which roadway and weather data were available for the seven RWIS sites eventually considered in the analysis. Each Iowa RWIS site has sensors that almost continuously collect a large amount of roadway and weather condition data. Each piece of data is recorded by the RWIS station at irregular time intervals whenever one of the collected characteristics changes. Some RWIS sites are newer and collect different types of information than some of the older sites. A list of some of the data collected at all Iowa RWIS sites would include Date and time of day Air temperature Dewpoint temperature 11
22 Wind speed (average and gust) Wind direction (current, minimum, and maximum) Relative humidity Surface and subsurface temperatures Pavement status (e.g., wet, dry) Amount of deicing material on the roadway surface Existence of precipitation Table 2 Roadway Weather Information System (RWIS) Site Data Availability 1 Interstate RWIS Location #133 I-235, Des Moines, Iowa (MP 6) #512 I-35, Ames, Iowa (MP 113) #606 I-380, Cedar Rapids, Iowa (MP 21) # 615 I-80, Grinnell, Iowa (MP 183) #619 I-35, Mason City, Iowa (MP 187) #620 I-80, Adair, Iowa (MP 70) #624 I-35, Leon, Iowa (MP 13) Time Period Data Available (Month/Year) Winter Season 2 Available (Years) 4/1996 to 7/ /1997 and 1997/ /1995 to 10/ /1996, 1996/1997, and 1997/1998 9/1995 to 6/ /1996, 1996/1997, and 1997/1998 9/1995 to 3/1997, 12/ /1996, 1996/1997, and to 4/1998, and 6/ / /1996 to 6/ /1997 and 1997/1998 6/1996 to 6/ /1997 and 1997/ /1994 and 9/1995 to 4/ MP = milepost, approximate location 2 Winter season in this table is defined from December to April 1995/1996, 1996/1997, and 1997/1998 The data listed were used to define the time periods during which the characteristics of a winter storm event occurred. More specifically, the RWIS data were searched and a winter storm event duration (at each RWIS location) was defined by those hours that met the following requirements: 1. Precipitation occurring 2. Air temperature below freezing 3. Wet pavement surface (indicated at any of the pavement sensors per site) 4. Pavement temperature below freezing (indicated at all of the pavement sensors per site) Winter storm events were identified, and their duration defined by the hours within which the RWIS station recorded data meeting these four requirements. However, the variability of the data, the sensitivity of the data collection sensors, and the proposed use of the data (i.e., to define 12
23 the time periods when traffic flow or crashes may be impacted) required the application of two additional criteria. First, winter storm event time periods (as defined by the four RWIS data requirements) were combined if they were separated by only one non-storm event hour. Second, a winter storm event was used in this research only if it had a defined duration of four or more hours. These criteria were added for a more conservative identification and definition of the potential winter storm event time periods at each RWIS location, and also limited the analysis to some of the more severe winter storm events. Daily snowfall data were also acquired from IDALS/NWS sites (see Table 3) and used better describe the winter storm events defined by the RWIS data (28, 29). First, the approximate severity, in inches of snowfall per hour, for each winter storm event (as defined by the RWIS data) was calculated from daily IDALS/NWS snowfall data. It was assumed that the daily snowfall amounts recorded at the observer sites occurred uniformly during the winter storm event time periods identified by the RWIS data, and a snowfall intensity (i.e., inches of snowfall per hour) was calculated. Second, the RWIS-defined winter storm event durations were adjusted and winter storm events removed from further consideration if the IDALS/NWS data indicated that only a trace or less of snowfall had occurred on the day of the identified time period. Hourly precipitation data from the NWS were considered to make these calculations (to avoid the uniform snowfall assumption), but were not used. The hourly data were considered questionable, especially with respect to the correlation between the time a measurement is taken and when the snowfall actually occurred. Plus, hourly precipitation data are collected on a less widespread basis than daily data. Table 3 Iowa Department of Agriculture and Land Stewardship (ADALS) and National Weather Service (NWS) Sites Used for Daily Snowfall Interstate RWIS Location ADALS/NWS Site Used for Daily Snowfall Estimate #133 I-235, Des Moines, Iowa Des Moines-Airport and Des Moines-Camp Dodge #512 I-35, Ames, Iowa Ames 5 SE #606 I-380, Cedar Rapids, Iowa Cedar Rapids #1 #615 I-80, Grinnell, Iowa Grinnell 3 SW #619 I-35, Mason City, Iowa Mason City Airport #620 I-80, Adair, Iowa Atlantic 1 NE #624 I-35, Leon, Iowa Leon 6 ESE The winter storm events considered in this research were required to meet a minimum estimated snowfall intensity. This particular criterion was used because the researchers only wanted to consider the impacts of the more severe winter storm events identified. As discussed previously, the snowfall intensity for each winter storm event was calculated from the IDALS/NWS daily snowfall data, and this is one of many variables (and combinations of variables) that could be used to identify winter storm event severity. The snowfall intensities calculated for all the winter storm event time periods identified ranged from to 1.51 inches per hour, but only those winter storm events with an intensity of more than 0.2 inches per hour were analyzed (see the next section of this report). These higher intensity storms represented 26 percent of the 336 winter storm events identified overall. Preliminary and unpublished research from the Department of Geological and Atmospheric Sciences at Iowa State University indicates that 13
24 visibility is about 1.0 to 1.25 miles when snowfall intensity is typically around 0.20 to 0.25 inches per hour. Table 4 is an example of the winter storm time periods (and their snowfall intensity) identified and defined for the data collection location near Ames, Iowa. Similar lists for all seven data collection sites are in the appendix. Those winter storm events with a snowfall intensity of 0.2 inches per hour or higher were analyzed for their impact on traffic volumes and crashes. The results of these analyses are discussed in the next section of this report. Table 4 Winter Storm Events Identified and Defined for Ames, Iowa, Data Collection Site (RWIS #512 and ATR #104) Date Time Period Duration (Hours) Estimated Snowfall 1 Intensity (Inches/Hour) February 15, AM to 9 PM March 6, AM to 1 PM March 25, AM to 6 AM November 27, AM to 6 PM December 2-3, PM to 6 AM December 23, AM to 6 PM December 23-24, PM to 5 AM December 25-26, AM to 5 AM December 26, AM 11 AM January 4-5, PM to 3 AM January 9-10, AM to 5 AM January 14, AM to 1 PM January 14-15, PM to 1 AM January 23-24, PM to 6 AM January 26, AM to 1 PM January 26-27, PM to 6 AM February 3-4, PM to 12 PM February 12, AM to 6 AM February 15, PM to 11 PM February 27, AM to 6 AM March 14, AM to 6 AM April 12, AM to 9 AM November 2-3, PM to 3 AM November 14, AM to 6 AM November 15, AM to 6 PM December 4-5, PM to 3 AM December 8, AM to 12 PM December 8-9, PM to 8 AM December 9-10, PM to 6 AM
25 Table 4 (Continued) Date Time Period Duration (Hours) Estimated Snowfall 1 Intensity (Inches/Hour) December 22, AM to 10 AM December 22, PM to 11 PM December 30, AM to 10 AM January 14, AM to 11 AM January 14, PM to 10 PM January 16, PM to 9 PM January 20-21, PM to 6 AM January 21-22, PM to 6 AM February 12, AM to 4 AM February 27-28, PM to 9 AM February 28-March 1, PM to 6 AM March 5, PM to 10 PM March 7-8, PM to 4 AM March 8, AM to 1 PM March 8, PM to 9 PM March 10-11, PM to 4 AM Snowfall intensity estimated from ADALS/NWS daily snowfall amounts and winter storm event durations identified from nearby RWIS station. Hourly Traffic Volume Data There are 124 permanent continuous ATR locations in Iowa. They are located on the rural and municipal interstate and primary systems, the rural secondary system, and the city street system. Twenty-one ATRs are embedded in the pavement of rural and municipal interstate roadways (the focus of this research). Traffic volume data from nine of these locations (see Figure 1 and Table 1) were used in this research. Actual or estimated hourly traffic volumes from 1995 to 1998 were provided by the Iowa DOT for almost every interstate ATR location in Iowa. These traffic volumes are automatically collected by the ATRs every hour, and only estimated when a malfunction occurs. The duration of the malfunction defines the procedure used to estimate the missing data. Volume estimations of just a few hours are based on an average of past data, while longer periods of estimation (e.g., weeks) use a more advanced statistical analysis of the volume patterns observed at the site. Hourly traffic volumes from the ATR locations shown in Table 1 were considered. These are the interstate ATR locations closest to the RWIS data collection stations used to define the winter storm event time periods (see the previous discussion). The bidirectional hourly traffic volumes from the ATRs were used in several tasks. First, the data were searched to identify the actual (not estimated) hourly traffic volumes the interstate experienced during winter storm events (as defined by the roadway and weather data). Those winter storm events that occurred on a day with only estimated hourly volumes were not considered in the impact analysis (see the next section of this report). Estimated hourly traffic 15
26 volumes represent the typical flow rather than atypical winter storm event flow. Second, the estimated and actual non-storm event hourly traffic volumes were used to calculate average traffic flow profiles for each weekday of a particular month. This calculation only excluded the atypical hourly volumes from holidays and the days surrounding each holiday. Therefore, those winter storm events that occurred on an atypical holiday-impacted travel day were not considered in the impact analysis. The April 1997 average non-storm event daily traffic flow profiles at the Jewell, Iowa, ATR are shown in Figure 2. As expected, the daily traffic flow profiles for Monday to Thursday are similar, but the daily traffic flow profiles for Friday, Saturday, and Sunday have their own pattern. Figure 3 shows the hourly traffic volumes observed at the Jewell ATR during a winter storm event on Saturday, April 12, 1997 (as defined by the RWIS #512 in Ames, Iowa). Also shown is the average Saturday daily traffic flow profile for April 1997 at the Jewell, Iowa, ATR. As expected, the volumes during the winter storm event are at or below the average.this type of comparison was done for all the winter storm events defined (using the criteria previously discussed). The only exceptions were those winter storm event time periods that occurred on holiday-impacted dates and/or on days the Iowa DOT had to estimate the hourly traffic volumes (due to an ATR malfunction). An analysis of the winter storm and average non-storm volume and crash levels is discussed in the next section of this report. Crash Data Average and winter storm event crash data were also collected and calculated for this research. The crash data were obtained from ALAS for the interstate roadway segments adjacent to the RWIS data collection locations used to define the winter storm event time periods. Crash information is available from ALAS for reported crashes on all Iowa roadways from 1989 to Data from 1998, however, were not available at the time the crash analysis was completed. This fact, along with the archived weather and roadway data available at the time, limited the safety/crash analysis to those winter storm events identified and defined for 1995, 1996, and In simple terms, ALAS is a computerized version of almost all the information contained on a police crash report. These data are contained in three ALAS crash record files. Two files (Record Type B and C) contain detailed information about the roadway vehicle environment, vehicle type, vehicle damage, and driver/passenger characteristics and injuries connected to the crash. The other file (Record Type A) contains information more applicable to this project. Some of the information contained in a Record Type A includes the following: Date, day of the week, and time Crash location (urban/rural, county, city, route, roadway/intersection classification, approximate milepoint and milepost) Crash type Crash severity Number of fatalities and injuries, and estimated property damage Number of vehicles involved 16
27 Average Hourly Volume (vehicles per hour) Avg. Mon. Avg. Tues. Avg. Wed. Avg. Thurs. Avg. Fri. Average Sat. Avg. Sun Hour of the Day Figure 2 Average Daily Traffic Flow Profiles (April 1997, Jewell, Iowa, ATR #104) 17
28 1200 Average and Actual Hourly Volume (vehicles per hour) Average Sat. 4/12/97 Storm Volumes Hour of the Day Figure 3 Average Saturday Traffic Flow Profile (April 1997) and Winter Storm Event (April 12, 1997) Volumes 18
29 Figure 4 Roadway Segments Used In Crash Analysis 19
30 Roadway character and geometry Light conditions (e.g., day, dusk, dawn) Weather conditions (e.g., clear, cloudy, fog) The data in this list were collected for 1995, 1996, and 1997 crashes reported and related to the interstate roadway segment adjacent to the RWIS stations used to define the winter storm event time periods. Each of the segments considered was 30 miles long and had the RWIS station at its midpoint. The approximate milepost endpoints for these segments are listed in Table 5 and shown in Figure 4. A roadway length of 30 miles was chosen because it was assumed that in most cases a segment of this length would experience weather conditions similar to those indicated at the RWIS station. In other words, if winter storm characteristics were recorded at an RWIS station, it was assumed that the interstate roadway within 15 miles of that station would experience similar conditions. Table 5 Interstate Roadway Segments Used for Crash Analysis Interstate RWIS Location Approximate Beginning Milepost Approximate Ending Milepost #133 I-235, Des Moines, Iowa I-35 MP 63 2 I-35 MP 89 2 #512 I-35, Ames, Iowa #606 I-380, Cedar Rapids, Iowa 6 36 #615 I-80, Grinnell, Iowa #619 I-35, Mason City, Iowa #620 I-80, Adair, Iowa #624 I-35, Leon, Iowa The Leon, Iowa, RWIS station is approximately located at milepost 13. The interstate segment considered consists of the first 30 miles of Interstate 35 in Iowa (13 miles south of the RWIS station, and 17 miles north). 2 The Des Moines, Iowa, location includes all of Interstate 235, approximately 10 miles of Interstate 35 south of the west I-80/I-235/I-35 interchange, and approximately four miles of Interstate 35 north of the east I-80/I-235/I-35 interchange ALAS crash data were collected for the seven 30-mile interstate roadway segments listed in Table 5. To be analyzed, however, these data were manipulated and combined with hourly traffic volumes. First, the number of crashes per hour during each winter storm event (as defined previously) was determined, and then the monthly average non-storm event crashes per hour for those same time periods calculated. Then, the crash rates for each storm event and similar nonstorm time period were approximated by dividing the number of crashes by the hourly traffic volumes collected at the nearby ATR. These rates were only approximate because the ATR volumes represent traffic flow at one interstate location rather than the entire 30-mile segment. used in the crash analysis. The changes in crash frequency and rate are reported and analyzed in the next chapter of this report. Project Phase II: Project-Collected Winter Storm Event Data One of the more challenging tasks in winter weather research is the collection of traffic flow characteristics during actual winter storm events. The second phase of this research project 20
31 required this type of activity, and involved the collection of traffic flow characteristics, and weather and roadway condition data during seven 1998/1999 winter storm events. The data were collected with a mobile video traffic data collection system commonly known as AutoScope. The selection of potential data collection locations and their preparation, the traffic control plan, and the procedures needed to complete winter weather data collection are described in the following paragraphs. Some concerns and factors that impacted how, when, and where the data could be collected are also documented. Site Selection Criteria The scope of this research was limited to the analysis and evaluation of winter storm events on the traffic flow and safety of a freeway environment. This required the identification of locations where the mobile video data collection trailer (i.e., AutoScope ) and personnel could safely collect interstate traffic flow, roadway, and weather characteristics during winter storm events. Safety was a critical issue. In fact, due to these safety concerns it was decided that the data collection equipment and personnel should not be adjacent to the interstate roadway during winter storm events, and the data should be collected from the bridges that overpass the interstate. The initial objective of this data collection activity was to collect traffic flow data for the winter storm events that impacted Interstate 35 between Des Moines, Iowa, and the Iowa/Minnesota border. The decision to collect data from interstate overpasses, however, limited the actual number of feasible data collection sites. Additional physical and operational response criteria for the data collection sites added even more limitations. For example, it was decided that data collection activities could only be done safely (i.e., without closing the overpassing roadway) on low-volume gravel roadways with bridges at least 26 feet wide from rail to rail. The 26-foot requirement was based on the fact that the mobile data collection trailer is 6 feet wide, and that a minimum of 20 feet was needed to continue bidirectional traffic flow on the bridge. One of the overpasses used for data collection also had to be between the Interstate 35/80/235 system interchange north of Des Moines and the State Highway 210 interchange near Slater and Maxwell, Iowa. This is the segment of Interstate 35 along which the Iowa DOT winter maintenance concept vehicle operates, and collects pavement friction data. Ultimately, these data were not available for the 1998/1999 winter season, but the identification of the data collection sites occurred before this was known. All of the bridges that met the width and gravel surface requirements described in the previous paragraph were investigated. This included several bridges between the Interstate 35/80/235 system interchange north of Des Moines and the State Highway 210 interchange near Slater and Maxwell, Iowa. The sight distance along the gravel roadway at each overpass was visually evaluated and the general volume levels on the roadway checked. Seven potential data collection sites (that were separated by approximately 25 to 30 miles) were identified. These sites were prepared for potential data collection activity and are listed in Table 6. It was expected that these sites would allow the safe collection of traffic flow characteristics during winter storm events that did not impact an extensive area of Iowa. For example, a winter storm might impact Interstate 35 near Des Moines but not impact Interstate 35 near Ames. 21
32 Table 6 Mobile Video Data Collection Sites Selected (Bridges over Interstate 35) Overpass Roadway Name Approximate Location County Ashworth Road 1 South of the I-35/I-80/I-235 interchange, West Des Moines, Iowa Polk Northeast 142 nd Avenue Two miles north of I-35 Elkhart interchange Polk 150 th Street Two miles south of I-35 Story City interchange Story 250 th Street 1.5 miles south of I-35 Webster City interchange Hamilton 85 th Street 1.5 miles south of I-35 C47/Dows interchange Franklin 170 th Street 2 miles north of I-35 B60/Rockwell interchange Cerro Gordo 435 th Street 2.5 miles north of I-35 A38/Joice interchange Worth 1 Ashworth Road, although paved and in an urban area, was selected as a potential data collection site because it had a shoulder 18 feet wide (i.e., data collection could be done safely and without disrupting traffic flow). Data Collection Site Selected The data collection sites listed in Table 6 were identified and prepared for data collection activities with the AutoScope (i.e., the roadway was marked). These preparation activities are described in the following paragraphs. After one or two winter storm events, however, it was concluded that many of these sites were too far away from the Ames-based data collection team to allow a feasible response. In fact, the preparation and assembly of the data collection team and setup of the traffic control plan could typically require up to two or three hours. This meant that many of the locations listed in Table 6 would not allow a significant amount of traffic flow data to be collected between the time of notification (usually about the time snow began to fall or immediately after) and the end of a winter storm event. Ultimately, only Northeast (NE) 142 nd Avenue (the closest site to Ames, and between the Interstate 35/80/235 and State Highway 210 interchanges) was used for data collection purposes. More widespread data collection could be possible in the future if additional data collection teams or equipment were positioned throughout the state. Data Collection Preparation A number of tasks were required to prepare for AutoScope data collection activities during winter storm events. These tasks included 1) marking the roadway at the data collection locations, 2) developing a traffic control plan, and 3) designing a winter storm event notification and preparation process. Each of these activities is discussed in the following paragraphs. 22
33 Data Collection Site Pavement Marking AutoScope data collection sites must have marks of known spacing on the roadway of interest. For this project, paint marks were placed at the seven locations identified in Table 6. These marks were located along the shoulders of the interstate. Three to four marks, placed 50 feet apart, were added to each shoulder. These marks were used to construct a detector grid for the AutoScope video detection system, and this allowed the calculation and/or determination of traffic flow characteristics. The addition and use of uniformly spaced marks on the shoulders, rather than the use of some preexisting landmarks (e.g., lane markings or pavement cracks), also compensated for the visual challenges (e.g., shadows, headlight reflections) that could impact the construction of the detector grid and subsequent reduction in data collection accuracy. Data Collection Traffic Control Plan A traffic control plan was designed for the data collection crew when they were in the field. This plan is shown in Figure 5 for the six rural county data collection sites. A similar plan was also developed for the one urban data collection site (i.e., Ashworth Road in West Des Moines, Iowa). The traffic control plan included three advance construction signs (i.e., Road Construction Ahead, One Lane Bridge Ahead, and the Flagger Symbol) in both directions. In addition, a slow/stop paddle was used at each end of the bridge to adjust the speed of approaching vehicles. Data collection staff members were located in vehicles (with strobe lights) at each end of the bridge and had hand-held radios (See Figure 5). The approach of a vehicle from either direction was communicated through the hand-held radios. Traffic cones with reflector bands were used to shift traffic and close the shoulder (approximately 6 feet) on the bridge during data collection activities. It was found that the setup time for this traffic control plan and the AutoScope trailer required about one hour (especially in poor weather conditions). The usefulness of temporary traffic control equipment in winter weather conditions is discussed later in this document. Winter Storm Event Notification and Preparation Procedure Winter storm events can occur at any time of the day or night, and can also sometimes occur with very little advance notice from local newscasts. Predicting the time of arrival for a winter storm can be very difficult. For these reasons, an Internet weather notification service was purchased. This service provided hourly forecasts up to 10 days in the future and included frequently updated radar and satellite imagery. These tools were used to observe the movement of weather fronts and potential winter weather events by project staff to estimate time of arrival and departure at the Northeast 142 nd Avenue data collection site. In addition to the weather notification service, a procedure was also developed to help determine when a relatively significant winter storm event was predicted for the near future or had arrived at the data collection location. First, the Iowa DOT personnel responsible for winter roadway maintenance (e.g., plowing, anti-icing) at each data collection location (See Table 6) were informed of the research project. They were then asked to notify the data collection team whenever they dispatched their winter maintenance vehicles. It was found that, depending on the location and winter storm characteristics, this notification could occur hours before the winter storm event was predicted to arrive or after the snow had already begun to fall. In either case, after the Iowa DOT notified CTRE, a two-person team was assembled and preparations were made for outdoor winter weather data collection activities. The Polk County sheriff and engineer 23
34 Three Temporary Construction Signs at 500 Feet and 500-Foot Spacing (See Notes Below) Gravel Roadway Vehicle with Strobe Light and Slow/Stop Paddle (See Notes Below) feet (Depending on County) feet Gravel Roadway Three Temporary Construction Signs at 500 Feet and 500-Foot Spacing (See Notes Below) Traffic Cones with Reflectors 6 feet Interstate Data Collection Trailer Vehicle with Strobe Light and Slow/Stop Paddle (See Notes Below) Approx. 200 feet Approx feet Not to Scale Note: 1. Both vehicles will have yellow strobe lights 2. Three temporary construction warning signs placed at 500 feet and 500-foot spacing in the following order: Road Work Ahead, One Bridge, and Flagman Symbol (stop/slow paddles located included with each vehicle to avoid vehicle conflicts on bridge). 3. Cones will be placed at 50-foot spacing in taper (before upstream vehicle) and 10-foot spacing in tangent. 4. Upstream and downstream vehicles will announce the presence of approaching vehicles through use of hand-held 5. di Vehicular conflicts on the bridge were avoided by slowing vehicle traveling in upstream direction (using slow/stop paddles). 6. All data collection staff wore orange reflective vests when in the field. Figure 5 Typical Traffic Control Plan for Rural County Roadway Overpass 24
35 were then notified of the impending data collection activity at the Northeast 142 nd Avenue overpass. Overall, this entire notification, assembly, and preparation process usually took at least an hour to complete. Winter Weather Data Collection Concerns A number of data collection concerns impacted where, how, and when winter storm event traffic flow, roadway, and weather data could be collected with mobile video data collection equipment. Some of the more significant factors are discussed in the following paragraphs. Equipment There were a number of concerns about how well the video and data collection equipment would operate and withstand harsh winter weather conditions. First, it was determined after the first winter storm event that a four-wheel drive vehicle would be needed to tow the video data collection trailer along snow-covered roadways. This vehicle was leased from the University of Iowa for the winter season. Second, the data collection trailers needed to be altered to allow the setup of the video equipment (on top of the trailer) during winter weather conditions. Iowa DOT added a ladder and a handrail that allowed data collection personnel relatively safe access to and on the top of the trailer. Finally, although preferable, none of the electronic video equipment or connections was altered for use in winter weather conditions. Three examples of the complications encountered with the equipment and connections included brittle cables and connections (requiring extreme caution when connecting/disconnecting), snow- or ice-filled video cable connections, and the need to attach these relatively delicate connections with bare hands in winter weather conditions. This equipment also needed to stay in the vehicle throughout the winter. It could not withstand the freeze/thaw cycle that results from moving it from the outside winter conditions to warm building conditions. Each of these concerns was addressed as they occurred, and data collection activities continued throughout the 1998/1999 winter season. In the future, however, more robust equipment will most likely be needed. Overall Safety of the Data Collection Team To ensure the safety of the data collection team a data-ready radio, cellular phone, and hand-held radios were acquired. The data-ready radio was hand-held and used to monitor Iowa DOT winter maintenance frequencies in the county where the data collection site was located. The cellular phone was available to call the Iowa DOT if the team was stranded at the site. In addition, the closest residents to the NE 142 nd Avenue data collection site were contacted, and they agreed to help the data collection team if conditions were too severe to return to and/or return the equipment to Ames. Finally, citizens band radios and hand-held radios were acquired so that the two-person data collection team could be in contact at separate ends of the bridge and in-transit to the data collection site. All of this equipment helped improve the overall safety of the data collection team and should be used in future winter weather data collection activities. Pavement Marking Visibility As previously mentioned, using the AutoScope video data collection equipment requires a set of markings with known spacing. In this research, these markings were painted on the shoulder of the interstate. Unfortunately, the shoulders are the first part of the roadway covered by snow during a winter storm event. Initially, this required a data collection team member to remove the 25
36 snow on the interstate shoulder during winter weather conditions. This activity was considered too dangerous, and the Iowa DOT agreed to paint additional marks in the middle of the lane at several data collection locations. These markings faded quickly, however, because of traffic flow wear and the cold temperature at which the paint was applied. Therefore, the shoulder markings were used throughout the 1998/1999 winter season. Another manner of designating distance for the video data collection equipment must be determined if the equipment is used during winter weather conditions in the future. Night Collection Finally, the video data collection equipment used in this research require minimum light levels to differentiate vehicles, and determine their speed and other characteristics. None of the data collection sites initially identified (See Table 6) had any street lighting except for the Ashworth Road location in West Des Moines. Therefore, none of the rural locations (including NE 142 nd Avenue) allowed video data collection during nighttime hours. It was also determined that the street lighting levels at Ashworth Road were probably not high enough to produce valid or reliable data collection. A cursory analysis of 10 minutes of nighttime traffic flow data was done for the Ashworth Road data collection location. The video data collection system indicated an average vehicle speed of approximately 45 miles per hour. However, a manual analysis and calculation of vehicle speeds during the same 10-minute period revealed an average vehicle speed of approximately 70 mph (i.e., near-normal free-flow speed). Visual observation of the traffic flow during the 10-minute time period would appear to support the manually calculated speed. The results of this preliminary analysis indicate how important minimum light levels are in the use of video data collection equipment. For this reason, winter storm event data were only collected during daylight hours at NE 142 nd Avenue. This decision also improved the safety of the data collection team, because it did not allow the setup and breakdown of the traffic control plan and video data collection equipment in the dark. High Wind Speeds Several periods of data collection were done during periods of very high wind speed and snowfall. These situations typically had very low visibility levels and made the use of traffic control devices (e.g., advance warning signs and traffic cones) extremely important. The nature of the mobile data collection equipment, however, required the use of temporary traffic control devices. In particular, this research used temporary reflectorized advance warning signs and traffic cones (See Figure 5). Unfortunately, these devices were not designed for use in high wind speed situations. Under heavy winds, the temporary advance warning signs (which are plastic and attached to springs) were bent almost parallel to the ground and could become unreadable by approaching motorists. The traffic cones would also begin to be buried in snow and in some cases would not remain in their original position. This required constant vigilance by the data collection team for shoveling and repositioning purposes. A more permanent solution to these problems will need to be found for future mobile winter storm event data collection activities. Winter Storm Event Data Collection For the second phase of this research project traffic flow, roadway, and weather-related data were collected during seven 1998/1999 winter storm event time periods. During these time periods there was some type of snowfall (e.g., light, moderate, or heavy), and in most cases there were 26
37 winter maintenance activities occurring. Table 7 lists the day and time period winter storm event traffic flow, roadway, and weather-related data were collected at the Northeast 142 nd Avenue overpass data collection site. Data at this site were only collected for the northbound traffic flow on Interstate 35. Table 7 contains a general qualitative description of the weather conditions during each winter storm event time period. Several types of data were collected during the time periods listed in Table 7. Some of the data were manually collected (e.g., the approximate roadway snow cover and driver visibility), but the traffic flow characteristics (e.g., volume, speed, headway, and gaps) were collected with mobile video data collection equipment (i.e., the AutoScope ). All of the data collected, manually or with the AutoScope equipment, were summarized into 15-minute time increments. Overall, more than 27 hours of data were collected during the seven winter storm events (See Table 7). There was data for minute time periods, and the analysis of this data is described in the next section of this report. Table 7 Winter Storm Event Data Collection Time Periods Time Time Duration General Winter Storm Event Date Start End (Hours) Description Wednesday, December 30, :00 AM 4:30 PM to 7 inches of snow Sunday, January 17, :00 PM 4:00 PM 2.0 Less than ½-inch of snow Friday, January 22, :15 PM 6:00 PM 1.75 Mist/very low precipitation (no snow) Thursday, February 11, :45 AM 4:30 PM 4.75 High winds, ice, and blowing snow 1 to 2 inches of snow, wet pavement, and no snow accumulation on road surface Thursday, February 18, :45 AM 1:30 PM 3.75 Monday, February 22, :00 PM 6:00 PM 4.0 Windy, light snow, blowing snow, and ½-inch of snow in last hour Monday, March 8, :30 AM 3:00 PM 5.5 High winds and blowing snow A general description of the AutoScope equipment and how it collected and/or calculated the winter storm event traffic flow data is described in the following paragraphs. The data collected manually and from the videotape of the site during winter storm events are also documented. AutoScope Video Data Collection Equipment Interstate 35 traffic flow characteristics were collected during seven 1998/1999 winter storm events from the Northeast 142 nd Avenue overpass of Interstate 35 in Polk County. The data were collected with the AutoScope wide-area video detection system. This system consists of a control unit, image sensors (or video cameras), and supervisor computer/software. For this 27
38 research, two video cameras were mounted on a trailer and directly connected to the AutoScope control unit. Figure 6 shows the AutoScope trailer, cameras, and control unit. Traffic flow images were recorded with the cameras in the field, and then stored on videotape using the electronic equipment contained in the enclosed trailer (see Figure 6). These images were then processed at CTRE using the AutoScope supervisor computer/software, and the necessary traffic flow characteristics calculated. A brief description of the process used by the AutoScope software to calculate the traffic flow characteristics is explained in the next paragraph. The AutoScope supervisor software processes images by distinguishing a change in the pixels on the videotape. The software is calibrated for each initial image file, and the start time of the data collection input for time stamping purposes. Then, the computer and software are provided a known distance along the roadway by the placement of computer-readable detectors on the video image. The researcher places these detectors on the roadway video image by using the painted shoulder markings at the data collection site (the placement of these markings was explained previously in this document). These detectors, which are a known length, provide the AutoScope software with the ability to record or calculate many traffic flow characteristics (i.e., volumes, vehicle speed, vehicle length, and vehicle gaps or headways). These variables can be determined because the software measures the movement of each vehicle through the electronic detectors by interpreting the video image pixel changes each vehicle produces. The AutoScope software records the time of each pixel change, and this allows all the traffic flow data to be calculated. The data collected with the AutoScope and manually are described in the following paragraphs. Traffic Volumes Winter storm event 15-minute traffic volumes were collected using the AutoScope equipment. The videotape images were evaluated using the AutoScope supervisor software, and the time each vehicle activated a detector was noted. These vehicle activations were summed for each 15- minute time increment (i.e., 4:00 to 4:15 PM) data were collected. For analysis purposes (see the next section) each of these 15-minute volumes have been expressed as an equivalent hourly rate. Fifteen-minute volumes were calculated for both lanes of northbound Interstate 35 (at the Northeast 142 nd Avenue overpass) and for each individual lane. Average Vehicle Gap and Headway The average vehicle gap and headway can also be calculated using AutoScope video image processing. As previously indicated, a time stamp was recorded when each vehicle activated one of the detectors. This information is used by the AutoScope software to calculate the time gap between successive vehicles on Interstate 35. This variable could be zero if a vehicle in each lane activated their lane detector at exactly the same time. Vehicle headways are similar to vehicle gaps, but they are calculated on a per lane basis. The difference in the time of successive lane detector activations is calculated by the AutoScope software, and is equivalent to the vehicle headways. The average gap (based on flow in both lanes) and headway (for each lane) were calculated for each 15-minute data collection time period. 28


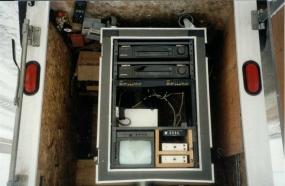
39 Figure 6 AutoScope Equipment and Data Collection Trailer 29
40 Vehicle Speed The AutoScope image processing software was also used to calculate the speed of each vehicle that passed through the detectors during the winter storm event time periods. Vehicle speed is calculated by measuring how long it takes each vehicle to cross a known detector distance along the roadway. In this case, the known distance was the detector length in each lane. The length of these detectors is based on the previously discussed pavement markings painted on the roadway shoulders at the data collection site. For the data analysis (see the next section), average vehicle speeds were calculated for each 15-minute time period. Driver Visibility Driver visibility was also manually approximated during each 15-minute time period winter storm event data collection. Visibility distances were estimated as greater or less than ¼-mile by the data collection team every 15 minutes and recorded in data collection field notes. These visibility estimations are based on the distance the data collection team could see through the snowfall and blowing snow along Northeast 142 nd Avenue (the east/west roadway from which the northbound Interstate 35 data was collected). Driver visibility on Interstate 35, therefore, may have been somewhat different because of its north/south alignment and moving vehicles. In most cases, however, the difference is not expected to be significant. A visibility index (greater or less than ¼-mile) was used in the analysis of these data (see the next section). Roadway Conditions It has been shown that roadway pavement surface conditions have an impact on speed choice. These conditions were approximated in this research by a visual analysis of the AutoScope videotape and an estimation of the snow cover on the roadway cross section. The paved cross section of Interstate 35 within the data collection area was observed using the videotape, and an average percentage of cross section snow cover estimated for each 15-minute data collection time period. The paved cross section of Interstate 35 in the data collection area consists of two 12-foot lanes, a 10-foot right shoulder, and a 6-foot left shoulder. Some of the more typical roadway conditions, and an approximation of how much snow cover they represent (as a percent of total cross section) are presented in Table 8. The percentage of snow cover was visually estimated for each 15-minute time period by comparing the observed average roadway conditions to the guideline descriptions shown in Table 8. For example, if the left shoulder was completely snow covered and the rest of the roadway was clear, the percent snow cover cross section would be 15 percent (i.e., 6 feet of the 40 feet was snow covered). After a preliminary evaluation, several different snow cover conditions were combined, and these data were represented and analyzed as a roadway snow cover index (snow either on the roadway lanes or not). Friction Factors The collection and use of pavement friction factors when winter storm events occur was also proposed as part of this research. The objective was to use the friction data collected by the Iowa winter maintenance concept vehicle as it plowed through the Northeast 142 nd Avenue data collection area. The existence of the maintenance concept vehicle in this area of Interstate 35 was one of the reasons Northeast 142 nd Avenue was chosen as the preferred data collection site. Using the friction factors collected by the maintenance concept vehicle would have required matching the time the friction factor data were collected with the time the vehicle appeared on 30
41 the videotape. Unfortunately, the quality and quantity of the friction data collected during the 1998/1999 winter season did not allow this information to be used in the data analysis. The percent snow cover on the roadway cross section was assumed to be somewhat of a surrogate for the roadway friction factor. The technology to continuously collect friction factor data during winter storms, and to transfer the time and location of these measurements in real-time, are currently under investigation at CTRE and may be available for analysis purposes in the future. Table 8 Roadway Condition Guidelines Cross Section Percent Snow Cover Roadway Condition Description Cross Section Percent Snow Cover 1 Completely dry Dry or 0 percent snow covered Completely wet Wet or 0 percent snow covered Trace amount of snow, and completely wet Snowing and wet, but 0 percent snow covered The left shoulder is 100 percent covered, and the 15 percent snow covered right shoulder and both lanes are clear Both shoulders are 50 percent snow covered 20 percent snow covered The right shoulder is 100 percent snow covered, 25 percent snow covered and the left shoulder and both lanes are clear Both shoulders are 100 percent snow covered, 40 percent snow covered and both lanes are clear The right shoulder is 100 percent snow covered, 50 percent snow covered the left shoulder and left lane are clear, and only 18-inch wheel tracks exist in the right lane The right lane is clear, but the shoulders are percent snow covered percent snow covered, and only 18-inch wheel tracks exist in the left lane Both shoulders are 100 percent snow covered, the left lane is 100 percent snow covered, and the right lane is clear Only 18-inch wheel tracks exist in the left and right lanes, and the shoulders are 100 percent snow covered Both shoulders are 100 percent snow covered, the left lane is 100 percent snow covered, and only 18 inch wheel tracks exist in the right lane The roadway surface is completely snow covered 1 Percentages are approximated. 70 percent snow covered 85 percent snow covered 90 percent snow covered 100 percent snow covered Crash Records Crash records were also obtained from the ALAS for 30 miles of Interstate 35 centered at the data collection site (i.e., the Northeast 142 nd Avenue overpass). Only those crashes that occurred along this roadway segment, and during the seven data collection time periods (See Table 7) 31
42 were of interest. The objective of the researchers was to evaluate the relationship between the traffic flow, roadway, and weather-related data previously described, and the number of crashes that occurred in the data collection area. Unfortunately, the small number of 1998/1999 winter storm events, and the use of only one data collection site did not allow a reasonable safety analysis to be completed. In fact, The ALAS showed that there were no crashes recorded along the 30-mile segment of Interstate 35 (centered at Northeast 142 nd Avenue) during the seven winter storm event data collection time periods. Post-Trip Data Collection In addition to the information collected in the field, additional data were also obtained from the NWS and other weather-related resources (e.g., the Des Moines Register) for each of the seven 1998/1999 winter storm events. These data included approximations of the total snowfall for the entire winter storm event (and this was not always equal to the number of hours data was collected) and wind speeds. This information was simply intended to supplement the data collected in the field, and provided a more comprehensive description of each winter storm event. Summary A large amount of data were collected, obtained, and/or calculated during the two phases of this research project. Phase one involved the collection and manipulation of archived weather and roadway condition, traffic volume, and crash data for seven locations along the interstate system in Iowa. An analysis of the differences between winter storm and non-storm event traffic volumes and crash records is described in the next section of this report. Phase two of the project included the collection of traffic flow, roadway, and weather-related data (e.g., vehicles speeds, visibility, and roadway snow cover) during seven 1998/1999 winter storm events. More than 27 hours of winter storm event data were collected at one Interstate 35 data collection site. However, the amount of friction and crash data available and collected for the seven winter storm event time periods did not allow a meaningful analysis of these variables. An analysis of the relationship between average winter storm event vehicle speed and the other data described previously is documented in the following section. WINTER STORM EVENT IMPACT ANALYSIS The previous section of this report described the collection and preparation of the roadway/ weather, traffic flow, and crash data used in both phases of this research. The specific data collected, the criteria used to select data collection sites, and some winter storm event data collection concerns were some of the subjects discussed. For phase one, it was stated that archived roadway and weather data from the RWIS and ADALS/NWS were used to identify and define time periods with significant snowfall intensity (i.e., winter storm events with greater than 0.2 inches of snow per hour). Hourly traffic volumes and crash records for these winter storm events and comparable non-storm time periods have been acquired and calculated. In addition, for phase two of this research traffic flow, roadway conditions, and weather-related variables were collected during seven 1998/1999 winter storm events. The evaluation and analysis of the data collected during both phases of this research is described in the following paragraphs. First, the impact of winter storm events on traffic volumes (i.e., 32
43 mobility) is analyzed. A summary of winter storm event traffic volume impacts at each phase one data collection location is presented, and a statistical relationship between the change in traffic volume and several winter storm characteristics explored. Then, a similar analysis is completed for the crash (i.e., safety) impacts of the winter storm events. Hourly crash frequencies and approximate crash rates are calculated for the winter storm events and comparable non-storm time periods at each data collection location. The relationship between crash frequency and several winter storm characteristics are also analyzed. Finally, the relationships between winter storm event average vehicle speed, other traffic flow characteristics, roadway conditions, and visibility are explored, evaluated, statistically analyzed, and documented. Project Phase I: Archived Winter Storm Event Data Phase one of this project involved the collection, use, manipulation, and analysis of archived roadway/weather condition, traffic volume, and crash data. The following paragraphs describe the analysis completed to evaluate the impact of winter storm events on traffic volumes and crashes. The analysis was limited to the data already available within several Iowa information collection and management systems (i.e., RWIS, ATR, and ALAS). Winter Storm Event Traffic Volume Impacts Hourly traffic volumes were obtained from the ATRs listed in Table 1. These ATRs are near each of the RWIS stations used in the identification and definition of winter storm events (See Table 1). Overall, the durations of 336 winter storm events were defined for the seven data collection locations used in phase one. All of the winter storm events identified and defined for each location are in the appendix. However, the traffic volume data evaluation and analysis described in the following paragraphs only considered winter storm events with the following characteristics: 1) an estimated snowfall intensity more than 0.2 inches per hour, 2) a minimum of four hours duration, 3) the event did not occur on or near a holiday, and 4) the event did not occur on a day when hourly volumes were estimated (i.e., the ATR malfunctioned). Sixty-four winter storm events, encompassing 618 hours, met these criteria. These events are also listed in the appendix. Winter Storm Event Traffic Volume Database Evaluation Several variables were calculated to create the winter storm event traffic volume database. These variables included the following for each winter storm event time period: Winter storm event volume Comparable average monthly non-storm volumes for that time period and day of week Volume difference and percent change between winter storm event volume and average non-storm volume These winter storm event characteristics have been summarized and evaluated for each of the data collection locations, and for all 64 winter storm events. The statistics that describe these variables are in Table 9. 33
44 Table 9 Winter Storm Event Traffic Volume Impact Summary 1 Number of Storm Events Storm Event Hours Average Storm Event Volume Reduction (Percent) Std. Dev. Storm Event Volume Reduction (Percent) Min. Storm Event Volume Reduction (Percent) Interstate RWIS Location #133 I-235, Des Moines #512 I-35, Ames #606 I-380, Cedar Rapids #615 I-80, Grinnell Max. Storm Event Volume Reduction (Percent) #619 I-35, Mason City #620 I-80, Adair #624 I-35, Leon Overall Volumes are in vehicles unless specified. Negative volume reductions indicate an increase in volumes. Overall, three of the storm events defined had negative volume reductions. Overall, a general decrease in volumes is shown for the winter storm events in Table 9. Average storm event volume reductions at each location ranged from approximately 16 to 47 percent, but an overall average volume reduction of approximately 29 percent was calculated. A simple t-test (assuming a normal distribution of the data) of the overall average percent volume reduction (n = 64) revealed that this overall mean was significantly different than zero at a 95 percent level of confidence. The 95 percent confidence interval for the overall average winter storm event percent volume reduction was 22.3 to 35.8 percent. As expected, the results in Table 9 also indicate that there is a large variability in the traffic volume impacts (i.e., the percent volume reduction). The minimum storm event percent volume change (by location) ranged from a 42 percent increase to a 13 percent decrease. The maximum storm event percent volume reduction (by location), on the other hand, ranged from 40 to 92 percent. The variability of the data was also indicated by the fact that the standard deviation of the percent volume reduction at each location was close to the average percent volume reduction at the location. This variability may be the result of the small number of storm events used in these calculations. The variability observed within individual winter storm event hourly volumes was even larger. Overall, the average hourly volume reduction was approximately 33 percent, but ranged from a calculated increase of approximately 56 percent to a decrease of approximately 100 percent. In fact, three winter storms showed a percent volume increase (See Table 9). An evaluation of these three winter storm events indicated that they either had a short duration (e.g., four or five hours) and/or more than snow intensity should have been used to define winter storm event severity (at least with respect to traffic flow). In general, it was found that volumes actually increased during the early hours of most winter storm events and then started to decrease (especially for events that occurred on a weekday afternoon). Therefore, a short duration/high snowfall intensity event (like those that showed a volume increase in this research) might experience the volume increase, but not the decrease. There are also a number of winter storm event characteristics (other than the 0.2 inches per hour snowfall intensity variable considered in this research) that might be used to 34
45 define the severity of a storm in terms of its impact on travel decisions (i.e., traffic volumes). For example, no volume impact may be observed for a high intensity snowfall event of short duration. However, that same high snowfall intensity event on another occasion may have the same or lower impact on traffic volumes as a low snowfall intensity event with high winds. Therefore, there may have been some relatively significant winter storm events that were not considered storm events in this research (and were subsequently included in the non-storm calculations). Winter Storm Traffic Volume Impact Statistical Analysis The following paragraphs describe an analysis of the relationships between winter storm event percent traffic volume reductions, snowfall intensity, and some of the other readily available weather-related variables collected by the RWIS stations in Iowa (i.e., wind speeds). Previous research has considered the impact, among other factors, of storm duration, total depth of snow, time of day, day of week, and visibility on winter storm event traffic volumes (8, 9, 10). A plot of the calculated winter storm event traffic volume reductions and snowfall intensity is shown in Figure 7. A visual inspection of the plot supports the previous discussion that there is a high degree of variability in the data, and subsequently the percent volume reduction and snowfall intensity relationship. In fact, for the winter storms used in this analysis, Figure 7 appears to show no definable relationship between percent winter storm event volume reduction and snowfall intensity (i.e., inches of snow per hour). This conclusion is supported by the statistical analysis results described in the following paragraphs. In addition to a visual evaluation of the percent volume reduction and snowfall intensity relationship, the percent traffic volume reduction and maximum gust wind speed (recorded by the RWIS) for each winter storm event was also plotted. The result is shown in Figure 8. This data plot indicates that, although there is some variability in the data, there appears to be a general increase in percent traffic volume reduction as maximum gust wind speed increases. Several relationships (e.g., linear, logarithmic, quadratic) were considered for the data shown, but a quadratic relationship (See Figure 8) appeared to describe the data trend. Similar results were also found for the relationship between winter storm event percent traffic volume reduction and maximum average wind speed (i.e., greatest one-minute average) (See Figure 9). These and other relationships were analyzed, evaluated, and quantified (if appropriate) to determine the impact of weather-related variables on winter storm event percent volume reduction. This analysis is described in the following paragraphs A multiple regression analysis (which assumes a normal distribution of data) of the traffic volume and RWIS weather data was done to evaluate and quantify (if appropriate) their relationship. More specifically, this research considered the relationship between winter storm event percent volume reduction (the dependant variable) and storm event duration, snowfall intensity and total snowfall (from the IDALS/NWS), minimum and maximum average (during a one-minute period) wind speed, and maximum gust wind speed (maximum four-second wind speed during a one-minute time period). Interactions between these variables (e.g., the product of snowfall intensity and maximum gust wind speed) and transformations (e.g., the square of the maximum average wind speed) were also considered. The results of this analysis support the conclusions documented in the previous paragraphs. 35
46 Percent Storm Event Volume Reduction Snowfall Intensity (Inches per Hour) Figure 7 Snowfall Intensity and Storm Event Volume Reduction 36
47 Percent Storm Volume Reduction Maximum Wind Gust (Miles per Hour) Figure 8 Maximum Wind Gust and Percent Storm Event Volume Reduction 37
48 Percent Storm Volume Reduction Maximum Average Wind Speed (Miles per Hour) Figure 9 Maximum Average Wind Speed and Percent Storm Event Volume Reduction 38
49 A number of models (i.e., combinations of variables) were considered through a subset and stepwise regression analysis approach. In general, the analyses indicated that winter storm event percent volume reduction has a statistically significant relationship with a number of variables, but many of the variables (e.g., gust wind speed and maximum average wind speed) were intercorrelated, and should not be used in the same model. The model chosen from the regression analysis results is shown in Table 10. It shows a statistically significant relationship between percent volume reduction, total snowfall, and the square of maximum gust wind speed. The t- statistics or p-values of each variable coefficient also indicate that they are statistically significant at a 95 percent level of confidence. The positive sign of each coefficient indicates that percent winter storm event volume reduction increases (i.e., grows larger) with an increase in total snowfall and the square of maximum gust wind speed. The negative constant in the model was of some concern, but it is considered more appropriate to assume that negative model outputs are equal to zero (when using variables within the range indicated in Table 10) than to change the structure of the model. Overall, the model summary statistics (See Table 10) indicate a statistical significance at a 95 percent level of confidence, and the adjusted coefficient of multiple determination (i.e., R- Squared) is 54.4 percent. Therefore, the model does have some explanatory power. Some of the other variables considered in the analysis (i.e., storm event duration, snowfall intensity, maximum average wind speed, the square of minimum average wind speed, the square of maximum average wind speed, (intensity) x (maximum gust wind speed), and maximum gust wind speed) were either not statistically related to percent volume reduction, or they were correlated to other variables considered, and could not be used together in a model. Winter Storm Event Traffic Volume Impact Summary In general, it can be concluded that the winter storm events defined in this research decreased traffic volumes in the vicinity of the seven data collection locations. Of course, the traffic volume impact of an individual storm event depends on a number of factors, and this produced some variability in the results. It was also found that this variability could be relatively significant, and was most likely due to the large number of factors that define the severity of a winter storm event and these factors taken into account by the public in their travel decisions. Some of these factors were considered in this research, and an analysis of their relationships with percent winter storm Table 10 Winter Storm Event Traffic Volume Regression Analysis Results 1, 2 (Dependant Variable: Percent Winter Storm Event Volume Reduction) Explanatory Variable Coefficient T- Statistic P- Value Mean of Variable Std. Dev. of Variable Total Snowfall (inches) Max. Wind Gust Speed 2 (mph 2 ) Range of Variable 1.05 to to 2,916.0 Constant mph = miles per hour 2 Model Summary Statistics: Number of Observations = 64, F-Value = 38.65, P-Value = 0.000, Mean Square Error = 332, Coefficient of Multiple Determination = R-Squared = 0.559, and R-Squared (Adjusted) =
50 event traffic volume reductions were analyzed. Overall, the winter storm event percent volume reduction was found to have a significantly positive relationship with total snowfall and the square of gust wind speed. The reduction in traffic volume (expressed as a percentage) can be expected to increase as both of these variables increase for a particular winter storm event. These analysis results appear to indicate that total storm event snowfall and the square of maximum gust wind speed would have been better indicators than snowfall intensity of winter storm event severity with respect to volume or travel impacts. Winter Storm Event Crash Impacts The number of reported vehicle crashes (recorded in ALAS) during the defined winter storm events were obtained from a 30-mile roadway segment adjacent to each RWIS data collection location (which were used to identify and define the winter storm events). The number of crashes that occurred along the roadway segment was also obtained for comparable non-storm event time periods. For example, the number of crashes that occurred at the Ames, Iowa, data collection location during a Thursday, February 15, 1996, winter storm event from 8 AM to 9 PM was obtained, and at the same location crashes were identified for the comparable non-storm time periods (i.e., 8 AM to 9 PM on each of the other Thursdays in February 1996). At the time of this research, computerized crash data were not available for 1998, and this activity could only be completed for the winter storm events identified in 1995, 1996, and The following paragraphs document the evaluation of the winter storm event and comparable non-storm event crash data. The percent difference between crash frequency and estimated crash rates for the winter storm and non-storm time periods are discussed. In addition, a statistical analysis of the crash data was completed to identify relationships that may exist between winter storm event crash frequencies and winter storm event variables (e.g., storm duration, snowfall intensity, wind speeds, etc.). The results of this analysis are discussed. Winter Storm Event Crash Database Evaluation Overall, 54 winter storm events, encompassing 491 hours, were defined and the data for these events were used in the crash analysis. The number of crashes during each winter storm event and comparable non-storm time periods were obtained from ALAS, and the hourly crash frequency and an approximate crash rate calculated (when combined with the hourly traffic volumes obtained from a nearby ATR location see the previous section of this report). The crash rates must be considered estimates because the traffic volumes obtained represent flow at one specific roadway location near the RWIS station, but the crash data are for a 30-mile segment centered on the RWIS station. In most cases, the ATR was within this 30-mile segment (See Table 1 of this report), but interchanges may exist between the ATR and the RWIS station. The differences between the hourly crash frequencies and estimated crash rates of winter storm events and comparable non-storm time periods are summarized in Table 11. Overall, the durations of 54 winter storm events were used in the calculation of their hourly crash frequencies and estimated crash rates. In each case, however, the number of hours considered in the calculation of comparable non-storm frequencies and rates were much larger because they represent a combination of the same time period on the other three to four comparable weekdays during that same month with normal weather conditions. The change in crash frequency between the winter storm events and non-storm time periods ranges from to crashes per hour for the seven data collection locations considered. Table 11 also indicates an overall increase in 40
51 hourly crash frequency from to This represents an increase of approximately 942 percent. The estimated crash rates, on the other hand, increased by approximately 1,303 percent overall, and ranged from approximately 608 percent to 11,266 percent at the seven locations. As expected, the approximated winter storm event and non-storm event crash rates were relatively variable, and increased more than the hourly crash frequencies. Table 11 Winter Storm Event Crash Impact Summary Non- Storm Interstate RWIS Location Number of Storm Events Number of Storm Event Hours Event Hourly Crash Frequency Storm Event Hourly Crash Frequency Percent Change in Hourly Crash Frequency Approx. 1 Percent Change in Estimated Crash Rate #133 I-235 Des Moines ,101% 1,175% #512 I-35, Ames % 608% #606 I-380, Cedar Rapids % 1,134% #615 I-80, Grinnell ,273% 11,266% #619 I-35, Mason City ,787% 1,951% #620 I-80, Adair ,528% 2,168% #624 I-35, Leon % 1,030% Overall % 1,303% 1 Crash rates are calculated with hourly traffic volumes from a nearby ATR (See Table 1). These volumes only approximate the traffic flow on the 30-mile segments considered in this safety analysis. The overall difference in estimated crash rates is most likely due to a number of influencing factors. First, the winter storm event definition used in this research represents relatively severe weather conditions, and the likelihood of crashes during these periods is expected to be large. Second, traffic volumes are expected to concurrently decrease during winter storm events (see the previous section on winter storm event traffic volume impacts). This combination of substantially reduced traffic volumes and an increased number of crashes can result in substantial crash rate differences. Another factor that may have contributed to the increase in crash rates during winter storm events is a possible bias in crash reporting during these time periods (when compared to crash reporting rates during non-storm conditions). It is believed that crashes are more likely to be reported during winter storm events because the weather conditions may necessitate a call for help. Increased vigilance by transportation and/or maintenance agencies, police, and emergency medical services may also increase crash reporting levels during winter storm events. Winter Storm Event Crash Impact Statistical Analysis The winter storm event crash database included crash and RWIS or weather-related data. The same RWIS data (e.g., maximum gust wind speed) used to analyze the traffic volume impacts of 41
52 winter storm events were also used in the crash impact analysis. In this case, however, the regression analysis assumed winter storm event crash frequency was the independent variable, and that the weather-related data were the dependent variables. Crash frequencies are considered count data. Therefore, a statistical approach unlike the one used to analyze traffic volume impacts of winter storm events was needed. A Poisson regression modeling approach is appropriate for count data like the crash frequency (e.g., number of crashes per winter storm event) along a roadway segment (30). In the analysis, winter storm event crash frequency was the dependent variable, and the independent variables included an exposure term (the product of section length (miles) and traffic volume during the winter storm events) in million-vehicle-miles (mvm), snowfall intensity, maximum gust wind speed, maximum average wind speed during the storm event, and minimum average wind speed. The interaction effects of these variables were also considered. Table 12 shows the Poisson modeling results. In general, the model indicated a significantly positive coefficient (at a 95 percent level of confidence) for the exposure term and snowfall intensity. In other words, an increased exposure and snowfall intensity during winter storm events increases crash frequency, but the model also indicated that storm event duration has an additional effect besides that captured by the exposure term. The model supports the conclusion that an increase in snowfall intensity increases crash frequency. These results are not surprising, but the model allows a statistical quantification of the relationships described. Overall, the rhosquared (ρ 2 ) term for the model (i.e., 0.443), a goodness-of-fit measure, also indicates a reasonable fit between the model and the data. The model has some explanatory power. Table 12 Winter Storm Event Crash Frequency Poisson Model Regression Results 1 (Dependant variable: crash frequency during winter storm event) Mean of Explanatory Variable Explanatory Variable Coefficient T-statistic Marginal Values Exposure (million-vehicle-miles) Storm Event Duration (hours) Snowfall Intensity (inches/hour) Max. Gust Wind Speed (miles per hour) Constant Model Summary Statistics: Number of observations = 54, Log likelihood function [L(β)] = , Restricted Log likelihood [L(0)] = , ρ 2 = 1- L(β)/L(0) = Table 12 also shows the estimated coefficient for the maximum gust wind speed. This coefficient is positive and indicates that increasing maximum gust wind speeds contribute to higher crash frequency. However, the variable was not found to be statistically significant. An additional exploration of several different interaction variables also did not find any that had a statistically significant influence on winter storm event crash frequency. The effect of each explanatory variable on winter storm event crash frequency was also evaluated by calculating their marginal values. A marginal value for an explanatory variable (See Table 12) 42
53 provides the impact (on the dependant variable) of a unit change from the mean value of that explanatory variable. The impact of this unit change is evaluated while all the other explanatory variables are held equal to their mean. For example, a unit increase in the exposure term (i.e., one mvm) from its mean of mvm will result in an increase of crashes during a winter snow event (provided all other explanatory variables are held equal to their mean). Likewise, a one hour increase in winter storm event duration beyond the data mean will result in additional crashes. The marginal value for snowfall intensity indicates that an increase of one inch per hour, beyond inches per hour, results in additional crashes. Finally, the marginal value for maximum gust wind speed shows an additional crashes for each unit increase in maximum gust wind speed beyond 23.3 mph. However, this variable and its estimated marginal value were not statistically significant. Winter Storm Event Crash Impact Summary As expected, hourly crash frequency and crash rates increase during winter storm events with relatively high snowfall intensities (i.e., 0.2 inches/hour or more). The magnitude of the increases observed might be due to the fact that unlike traffic volumes (which may decrease gradually as the weather worsens), crashes can begin to increase as soon as the roadway surface starts to become snow or ice covered. For this reason, the number of crashes that occur during significant winter storm events would be expected to be completely different from the number that typically occur along a dry interstate roadway. In addition, in many cases the most intense snowfall events do not allow the roadway to be cleared completely and crashes become more likely. The dramatic percent increases in hourly crash frequencies and rates (See Table 11) are representative of what can occur during some of the most severe winter storm events in Iowa. These numbers would most likely decrease if less severe were storm events had been incorporated into this research. An analysis of the relationships between winter storm event crash frequency and several weatherrelated variables (from Iowa RWIS stations) also had interesting results. It was found that crash frequencies during winter storm events were positively related to snowfall intensity and exposure (in mvm) at a 95 percent level of significance. In other words, as these winter storm event and volume characteristics increase, the number of crashes in a storm can be expected to increase. The results quantify and support expected weather and safety variables. Project Phase II: Project-Collected Winter Storm Event Data Phase two of this research included the collection and analysis of specific traffic flow, roadway, and weather-related data during seven 1998/1999 winter storm events. These data were collected manually and with mobile video data collection equipment at the NE 142 nd Avenue overpass of Interstate 35 in Polk County, Iowa. Overall, a total of hours of data were summarized into minute increments. For each of these 15-minute increments the phase two database includes average vehicle speed, traffic volume (in vehicles per hour), estimated visibility (greater or less than ¼-mile), average gap (both lanes) and headway (individual lanes) between vehicles, and roadway condition (as a percentage of the cross section that is snow covered). Each 15- minute time period was also identified as occurring during the peak-period (i.e., 4 to 6 PM) or off-peak travel times. Data was collected during 90 and 19 off-peak and peak-period 15-minute time increments, respectively. A description of the equipment/processes used and the data collected for phase two were described in the previous chapter. The following paragraphs document the evaluation and 43
54 analysis of these data. First, descriptive statistics of the variables in the database are presented and discussed. This discussion includes a general comparison of winter storm event and nonstorm (i.e., normal) volumes, and average and free-flow vehicle speeds. Then, the relationship between the average 15-minute winter storm event vehicle speeds and traffic flow (e.g., volume), roadway (e.g., snow cover), and weather (e.g., visibility) data collected are described. However, the statistical modeling was limited to the data collected for the 90 off-peak period time periods. Past research has shown that the peak-period travel decisions are based on a different set of criteria, and the small amount (n = 19) of peak-period data does not allow a statistically valid model to be developed. Overall, the amount, variability, and intercorrelation of the data collected (e.g., the range of characteristics exhibited by the seven winter storm events observed), and the number of factors that can impact average vehicle speeds during winter storm events also limit the explanatory power of the off-peak model developed. Winter Storm Event Speed Database Evaluation The data collected during phase two of this research included vehicle speeds, vehicle gaps and headways, traffic volume, and an estimation of visibility and roadway snow cover. These data were collected during seven winter storm event time periods with a combined duration of hours. In addition, for comparison purposes, the same data were collected on a typical weekday in May when there were no adverse weather conditions. All of the data collected were summarized for each 15-minute time period (e.g., 4:00 to 4:15 PM). The summary statistics for each of the variables (except for the visibility indicator variable) are shown in Table 13 for the data from each winter storm event, the overall database, and the normal weekday data. As expected from the results of phase one, the statistics in Table 13 show that traffic volumes typically decreased during the seven 1998/1999 winter storm events considered in phase two. Almost all of the average non-factored volumes for the winter storm events are lower than that of typical weekday volumes in May, and this is also generally true when the winter storm event volumes (which occurred in different months and on different weekdays) are factored to equate them with the weekday traffic flow profile from Wednesday, May 19, 1999 (31). Winter storm event volumes and a non-storm traffic flow profile are shown in Table 13 and Figure 10. About 100 of the 109 factored winter storm event volumes are less than the non-storm traffic flow profile. On average, for the entire database, the percent volume reduction was about 36 percent, and ranged from an increase of about 46 percent to a decrease of approximately 97 percent. These results are surprisingly similar to the 33 percent average reduction, 56 percent increase, and approximately 100 percent decrease found in phase one of this research (which are based on volume data from 64 winter storm events throughout Iowa during three winter seasons). The phase one analysis also showed that winter storm event volume reductions were related to total snowfall and the square of the maximum gust wind speed (See Table 10). Table 13 shows some general trends in the data collected. General relationships between average vehicle winter storm event vehicle speeds, traffic volumes, vehicle gaps, roadway condition, and visibility can be seen. As expected, vehicle gap and traffic volumes are closely related. As volumes increase the vehicle gaps (i.e., the average vehicle density) decreases. As previously mentioned, phase one of this research also showed that the reduction in traffic volumes during winter storm events has been shown to increase (i.e., the total winter storm event volume decrease) with decreased weather conditions (e.g., increased total snowfall and gust wind speed). 44
55 Table 13 Winter Storm Event Speed Data Summary 1 Winter Storm Event Date Sample Size 2 Mean Volume (vph) 3 Mean Factored Volume (vph) 3 Mean Gap (sec.) 4 Std. Dev. of Gap (sec.) Range of Gap (sec.) Mean Percent Snow Covered Rdwy. 5 Std. Dev. of Percent Snow Covered Rdwy. Range of Percent Snow Covered Rdwy. Visibility over ¼-mile? 6 Mean Speed (mph) Std. Dev. of Speed (mph) Range of Speed (mph) Wed., Dec. 30, to 9 40% 0.0% 40% to 40% to 69.5 Sun., Jan. 17, , to 5 0.0% 0.0% 0.0% to 0.0% to 70.5 Fri., Jan. 22, , to 6 0.0% 0.0% 0.0% to 0.0% to 70.7 Thurs., Feb. 11, to 13 21% 25% 0.0% to 50% to 66.9 Thurs., Feb. 18, to 11 7% 8% 0.0% to 15% to 63.5 Mon., Feb. 22, to 12 11% 29% 0.0% to 85% to 67.0 Mon., Mar. 8, to 68 53% 27% 15% to 90% to 62.6 Overall Winter to 68 25% 27% 0.0% to 90% to 70.7 Storm Event Normal Dry Weekday (Wed. May 19, 1999) 46 1,037 1, to to vph = vehicles per hour, sec. = seconds, and mph = miles per hour. 2 Sample size is the number of 15-minute time periods in winter storm event. 3 Mean volumes are for two lanes, and not factored. Factored volumes are for proper comparison to volumes on a non-storm event Wednesday in May. 4 Gap equals time period between vehicles traveling in both lanes. 5 Mean percent snow covered roadway is an estimation of the roadway cross section (including shoulders) covered by snow (in percent) during a particular 15-minute time period. Forty percent and below typically represents snow covering the shoulders only. 6 Visibility number represents those periods with visibility over ¼- mile. 45
56 Volumes (vehicle per hour) Normal Conditions Winter Conditions :00 AM 7:00 AM 8:00 AM 9:00 AM 10:00 AM 11:00 AM 12:00 PM 1:00 PM 2:00 PM 3:00 PM 4:00 PM 5:00 PM 6:00 PM 7:01 PM Time Figure 10 Factored Winter Weather Volumes and Non-Storm Traffic Flow Profile (1997 Municipal Interstate Factors) 46
57 Not surprisingly, average winter storm event vehicle speeds also generally decrease with decreased weather conditions. The data for phase two, therefore, generally shows a decrease in average winter storm event vehicle speeds as winter storm event volumes decrease. The average winter storm event vehicle speeds collected in phase two also appear to decrease with visibility, roadway conditions, and/or some combination of the two (although these conclusions are only based on 27 and 20 pieces of data, respectively). Vehicle speeds during winter storm events were lower than the typical speeds measured at the data collection location. The overall range of the average winter storm event 15-minute vehicle speeds during the seven winter storm events (See Table 13) ranged from 43.6 to 70.7 mph, and the mean vehicle speed for each winter storm event ranged from 51.3 to 69.7 mph. In addition, the standard deviation of the winter storm event average vehicle speeds ranged from 0.6 to 8.23 mph. Overall, the winter storm event average vehicle speed was approximately 59.9 mph, and had a standard deviation of 7.57 mph (n = 109). During a normal weekday, on the other hand, the average vehicle speed was approximately 71.5 mph with a standard deviation of only 1.86 mph (n = 45). In general, there is approximately a 16 percent difference between the normal and winter storm event average vehicles speeds, and this reduction is significantly different than zero at a 95 percent level of confidence. The standard deviations were also substantially different.a comparison of winter storm event and typical vehicle free-flow speeds (based on the speed of vehicles at least 450 feet from any other vehicle) produced results similar to those described in the previous paragraph. Overall, the average free-flow vehicle speed during the winter storm events was about 64.2 mph. The average normal free-flow speed, on the other hand, was 72.4 mph. As expected, the normal average vehicle speed was almost equal to the overall average normal speed of 71.5 mph. The difference between typical and winter storm event average freeflow vehicle is approximately 11 percent. These speeds are significantly different than each other at a 95 percent level of confidence. In general, the data indicate a significant reduction in average and free-flow vehicle speeds during the seven winter storm events considered. The variability of vehicle speed choice during winter storm events also seems to increase. In addition, a relationship between winter storm event average vehicle speed, traffic volumes (an apparent surrogate for total snowfall and gust wind speed), roadway conditions, and visibility appears to exist. A statistical regression analysis was completed to evaluate and quantify these relationships if possible. This analysis is described in the following paragraphs. Winter Storm Event Speed Impact Statistical Analysis The previous paragraphs included a brief discussion about the variability in the winter storm event data collected during the 1998/1999 winter season. Overall, data for minute time periods were collected for a wide range of weather conditions (See Table 7). The limited number of 1998/1999 winter storm events, and the physical restrictions on the collection of winter storm event data at multiple locations, did not allow data collection during two or more winter storm events with similar characteristics. Repeated data measurements during events with similar weather conditions would provide more confidence in the statistical results presented in the following paragraphs. Therefore, while the results of the statistical analysis done for this research are useful (see the next section of this report for two case study applications), they should be used with caution. 47
58 A preliminary evaluation of the data was completed before the statistical analysis. This evaluation identified two sources of removable variability in the overall database. First, the database included both peak (4:00 to 6:00 PM) and off-peak period data. There are traffic flow, roadway, and weather data for 90 off-peak and 19 peak-period 15-minute time periods. Past research has shown that the factors considered in travel decision-making (e.g., should I travel) can be different during peak and off-peak time periods, and this conclusion is supported by a plot of the peak and off-peak period average volumes and speeds (See Figure 11). There appears to be a similar relationship between the winter storm event volumes and speeds in the off-peak and peak time periods, but there is also an apparent shift in the data. It was concluded that separate models should be developed for the off-peak and peak time periods. Unfortunately, the amount of data collected during the peak period (n = 19) was not considered significant enough to complete this task. The statistical analysis, therefore, focused on the development of a model for the off-peak period data (n = 90). The second source of undesirable variability in the overall database was connected to the calculation of an average 15-minute winter storm event vehicle speed. The average 15-minute vehicle speeds in the phase two database are based on the number of vehicles that passed the data collection site during the specified 15-minute time period. This produced a situation in which there was more confidence in the average vehicle speeds calculated during 15-minute time periods with higher volumes (up to 383 vehicles) than those with lower volumes (as low as 9 vehicles). For this reason, only data from the 15-minute time periods with 30 or more vehicles were used in the analysis. Unfortunately, this decision reduced the number of data points by seven (i.e., n = 83), and the time periods removed from the database also represented the most severe weather conditions (i.e. those with the smallest volumes). A plot of the off-peak average volumes and speeds, without the low-volume (i.e., less than 30 vehicles) time period data, is shown in Figure 12. A statistical regression analysis (assuming a normal distribution) of the data shown in Figure 12, along with the other traffic flow, weather, and roadway condition data collected, was completed as part of this research. The relationships between the off-peak period winter storm event average vehicle speed, volume, visibility, and roadway condition were evaluated. An analysis of variable correlation coefficients revealed a strong relationship between winter storm event vehicle speed and traffic volume. As expected, average vehicle gap and traffic volume were also strongly correlated (i.e., they should not be used as dependent variables in the same model). The amount of snow cover on the roadway cross section also showed some correlation with both traffic volume and vehicle speed. When this variable was expressed as an index (i.e., whether snow was on the roadway lanes or not), however, its correlation strengthened with vehicle speed and weakened with traffic volume. Overall, the visibility index (i.e., is it greater or less than ¼-mile) showed very little correlation with any of the other data collected. The relationships between the off-peak winter storm event vehicle speeds, traffic volumes, and visibility/roadway condition indices were investigated through a multiple regression approach. A number of transformations and interactions between these variables were also investigated. The results from a regression analysis of data (from the off-peak and no low-volume time periods) are shown in Table 14. A graphical representation of the model is shown in Figure
59 Average Speed (miles per hour) Off Peak Data Peak Data Hourly Volume (vehicles per hour) Figure 11 Peak and Off-Peak Period Volumes and Speeds (Peak = 4:00 to 6:00 PM)
60 Average Speed (miles per hour) Hourly Volume (vehicles per hour) Figure 12 Off-Peak Period Winter Storm Event Volumes and Speeds (No Low-Volume Time Periods) 50
61 80 Visibility < 1320 feet and Only Shoulders Impacted by Snow 70 Visibility > 1320 feet and Only Shoulders Impacted by Snow 60 Average Speed (miles per hour) Visibility < 1320 feet and lanes impacted by snow Visibility > 1320 feet and Lanes Impacted by Snow Hourly Volume (vehicles per hour) Figure 13 Winter Storm Event Off-Peak Period Average Speed Model 51
62 Table 14 Winter Storm Event Average Vehicle Speed Regression Analysis Results (Off- Peak and No Low-Volume Time Periods) 1,2 (Dependant Variable: Average Vehicle Speed (mph)) Explanatory Variable Coefficient T-Statistic P-Value Mean of Variable Std. Dev. of Variable Traffic Volume 2 (vph 2 ) , ,125 Range of Variable 15,376 to 788,544 Visibility Index Roadway Cover Index Constant mph = miles per hour and vph = vehicles per hour 2 Model Summary Statistics: Number of Observations = 83, F-Value = 42.55, P-Value = 0.000, Mean Square Error = 21.85, Coefficient of Multiple Determination = R-Squared = 0.618, and R-Square (Adjusted) = The visibility index is equal to one when visibility is less than ¼-mile and zero when greater. 4 The roadway cover index is equal to one when snow has begun to impact the roadway lanes and zero if snow is only on the shoulders or nonexistent on the roadway surface. Several conclusions can be made from the information shown in Table 14 and Figure 13. First, the positive relationship between winter storm event average vehicle speed and the square of winter storm event traffic volume is statistically significant at a 95 percent level of confidence. This relationship is reasonable for winter weather (i.e., snow is falling) speed-volume data because low volumes during these time periods typically indicate poor weather/roadway conditions, and large or near-normal volumes indicate near-normal winter weather conditions. In fact, during phase one of this project it was shown that winter storm event volume reductions were significantly and positively related to total snowfall and the square of gust wind speed. In other words, total winter storm event volume levels decreased as total snowfall and gust wind speed increased. The relationship found between the square of winter storm event traffic volume and average vehicle speed, therefore, is an indication that total snowfall and gust wind speed also have an impact, at least indirectly, on winter storm event average vehicle speed. Unfortunately, data on total snowfall and gust wind speed were not collected in phase two of this project, and the impact of these two weather variables on winter storm event vehicle speeds could not be measured directly. In addition to the relationship between winter storm event traffic volume and average vehicle speed, a negative relationship (at 95 percent level of confidence) was also found between winter storm event average vehicle speed, and the visibility and roadway condition indices. The model coefficients for these two indices are shown in Table 14. A reduction in visibility below ¼-mile lowers the predicted winter storm event average vehicle speed by approximately 3.9 mph. The roadway cover index is a measure of when the snow on the paved cross section surface began to encroach on the marked roadway lanes. The model predicts a reduction in winter storm event average vehicle speed of about 7.2 mph if snow encroaches onto the marked roadway lanes. Therefore, a combination of poor visibility and roadway conditions can decrease winter storm event average vehicle speeds by about 11 mph. The relationships quantified between winter storm event average vehicle speed, visibility, and roadway cover, however, are based on a small amount of data (n = 19 and n = 10 respectively) and should be used with caution. Fortunately, the model has some explanatory power overall with an adjusted coefficient of determination (Rsquared) of approximately 60 percent. 52
63 Winter Storm Event Speed Impact Summary Phase two of this research project included the collection of traffic flow, roadway conditions, and weather data during seven 1998/1999 winter storm events. Over 27 hours (or minute time periods) of data were collected manually and with video data collection equipment. The data collected specifically included traffic volumes, vehicle gaps and headways, visibility (greater or less than ¼ mile), and the percentage of the roadway cross section covered by snow. An evaluation of the data collected indicates that winter storm event average vehicle speeds were significantly less than typical weekday vehicle speeds at the data collection location. In fact, the difference between the average vehicle speeds was approximately 12 mph. Similar to the results from phase one of this project, the average percent volume reduction was about 33 percent during the seven 1998/1999 winter storm events considered. A statistical analysis of the data indicated a positive and statistically significant relationship (at a 95 percent level of confidence) between winter storm event average vehicle speed, volume squared, visibility, and roadway condition. The model indicates that average vehicle speed increases with traffic volume during winter storm events. However, traffic volumes are related to certain winter weather variables. Phase one of this project showed winter storm event volumes were lower if total snowfall and the square of gust wind speed increased. In other words, winter storm event vehicle speeds and volumes are lower during poor weather conditions, and higher as the winter weather/roadway variables that impact travel approach near normal conditions (e.g., light snow falling and roadway clear). In addition to traffic volume (i.e., total snowfall and wind gust speed), average winter storm event average vehicle speed appears to be negatively related to indices for visibility and roadway condition. Average winter storm event vehicle speeds are predicted by the model to decrease by up to 11 mph for a combination of poor visibility and roadway snow cover. The winter storm event average vehicle speed model developed in phase two of this research project can be used in conjunction with the volume reduction model and crash model developed in phase one. These models can be used (with caution) to evaluate and/or forecast the expected winter storm event impacts on the traveling public. The speed model, in particular, allows the calculation of expected delays due to a winter storm event with particular characteristics. Combined with a dollar value for time the winter storm event delay costs can be calculated for a certain percentage of the population (the results of the volume reduction model). The crash model, of course, can be used as an indication of the relative change in safety due to a winter storm event. The results of this model can be combined with the average dollar value of a crash, and an estimate of winter storm event safety-related costs calculated. The results from these models, when appropriately refined and provided to the public or maintenance policy decisionmakers, may change travel plans or maintenance approaches for potential winter storm events. How the results of the three models developed in this research (individually and in combination) might be used in two case study situations is described in the next section of this document. APPLICATION OF RESEARCH RESULTS Research projects are typically done to investigate improvements to applications of currently used materials, procedures, and/or methods of operation. The new information, knowledge, and/or tools provided by the research may be applied immediately in some cases, but incrementally in others. The results of this research project included the creation of a winter 53
64 weather, traffic flow, and safety database, and the development of statistically valid models for the prediction of winter storm event impacts on traffic volumes, crash frequencies, and average vehicle speeds. Data were collected from currently available Iowa information management systems (e.g., RWIS and ALAS), and during actual winter storm events. The flowchart shown in Figure 14 provides one example of how the models developed in this research could be applied to produce useful information. Using and disseminating the model results in the manner indicated (See Figure 14) requires accuracy equal to (and hopefully better than) the weather-related information already used by travelers. Acquiring this accuracy will require additional data collection and model refinement activities. Fortunately, during the past year these additional data have become more and more available through ongoing and recently completed research projects throughout the United States. The results of the models developed as part of this research, when adequately refined and appropriately disseminated, could have a significant impact on when, how, and where people travel in Iowa. The following paragraphs, for example, describe how the results of these models could eventually be incorporated into two ongoing case study projects. The Iowa DOT is currently involved with two projects that could become more effective if they use the results of this research project. The two projects are the FORETELL initiative and the Des Moines Metropolitan Area ITS Strategic Plan. Both of these projects involve the implementation of advanced intelligent transportation system (ITS) measures intended to improve traveler mobility, safety, and decision-making through the dissemination of understandable and usable information. Winter Weather Roadway User Impacts and the FORETELL Initiative Winter weather conditions contribute to an estimated 1,150 fatalities annually in the United States and Canada (32). In addition to these safety impacts, adverse winter weather conditions also contribute to increased travel times, driver anxiety, and stress levels (32). Overall, the annual cost of controlling snow and ice on United States and Canadian roadways exceeds 2.0 billion dollars (33). There is a need for more efficient, effective, and economical maintenance strategies to lower the cost of winter maintenance activities (and winter weather impacts). The state of Iowa is the lead public-sector agency in a multi-state initiative program called FORETELL. The primary goal of this program is to combine detailed roadway/weather condition information with ITS measures to improve the safety and mobility of winter weather travel in North America. Other partners in the investigation and implementation of FORETELL include Castle Rock Consultants, the states of Illinois, Iowa, Minnesota, Missouri, and Wisconsin, and Ontario, Canada. FORETELL Description The FORETELL project was proposed in In general, it was initiated to improve the information currently provided to winter maintenance personnel. The goal was to provide the information they needed and desired by integrating current equipment and future ITS infrastructure with advanced weather information systems. The objective was to provide information that could aid winter maintenance decision-makers and agencies. 54
65 Data Needed (Forecast or Existing) Total Snowfall Event Duration Gust Wind Speed Potential Visibility Potential Roadway Model 1 Percent Winter Storm Event Volume Reduction Model Model 2 Winter Storm Event Crash Frequency Model Calculate Percent Winter Storm Event Volume Reduction and Compare to Typical Traffic Flow Profile Calculate Average Winter Storm Event Hourly Volumes Model 3 Off-Peak Winter Storm Event Average Vehicle Speed Model Calculate Winter Storm Event Crash Frequency and Compare to Typical Crash Frequency Possible Outputs! Change in Volume (i.e., Travel)! Potential for Individual Traveler Delay! Total Delay Approximation (Based on Average Vehicle Speed)! Cost Due to Delay (When Combined with Value of Time) Possible Outputs! Approximate Increase in Crash Frequency or Rate! Increased Individual Potential for a Crash! Cost Due to Increased Crashes (When Combined with Average Value of Crash) Figure 14 Example Application of Winter Weather Roadway User Impact Models 55
66 Winter maintenance decision-makers and agencies have indicated a need for more accurate weather predictions and more frequent roadway condition updates. More accurate and frequent information is expected to facilitate more efficient, economical, and safer maintenance procedures. One specific objective of the FORETELL project, for example, is to decrease the interval between weather forecast updates from one day to one hour. More frequent forecasts should allow agencies to more quickly detect changes in weather and roadway condition patterns, and adjust their maintenance strategies accordingly. It should also improve the accuracy of predicting the beginning/end of a winter storm event. These predictions have a direct impact on the determination of personnel and roadway chemical application needs. The overall objective of the FORETELL program is to provide a one-stop information outlet for accurate and timely weather forecasts. It is expected that winter maintenance personnel could use this information to more effectively adjust typical procedures in terms of required labor, equipment, and the type and amount of application materials used. The implementation of FORETELL results, when complete, will allow state, federal, and local transportation agencies to share forecast and weather/roadway data. This information integration could potentially increase maintenance agency efficiency, and subsequently result in safer roadways at less expense. The Application of Roadway User Impacts in FORETELL A combination of the results from this research and FORETELL should improve the usefulness of both projects. First, the weather and roadway condition forecasts produced by FORETELL can be used in the models developed in this research project. These models could then be used to predict the expected changes in crash frequency, traffic volume, and average vehicle speed from an ongoing or predicted winter storm event of particular characteristics. These impacts could then be incorporated back into FORETELL system and the information disseminated. The improved and more frequent prediction of weather and roadway conditions (a FORETELL product), along with a knowledge of how the expected winter weather conditions could impact the traveling public (a product of this research) may alter typical winter travel plans and maintenance approaches. In summary, the weather and roadway information collected and/or forecast by FORETELL could be used to improve and refine the prediction models developed as part of this research, and the information produced from these models used to improve the effectiveness of FORETELL by providing it with potential winter weather traveler impacts. More specifically, the models produced in this research could eventually be used to predict the expected crash, volume, and/or speed impacts for winter storm events of particular characteristics. FORETELL could provide these impacts to winter maintenance personnel in addition to, among other things, current and forecasted hourly precipitation, snowfall accumulation, wind speed, and roadway friction. This knowledge may impact the winter maintenance approach taken for a particular winter storm event and eventually affect overall winter maintenance policies. The expected roadway user impacts will then be quantified and incorporated into the winter maintenance approach. The roadway user models developed as part of this research, however, require further refinement and verification before their results can be used in a general manner. 56
67 Winter Weather Roadway User Impacts and Des Moines/Iowa ITS Strategies Intelligent transportation systems (ITSs) integrate technologies in communications, computers, and information systems to facilitate more informed decision making by both commercial and personal travelers (34). In December 1997, the Des Moines metropolitan planning organization (MPO), Iowa DOT, and the Federal Highway Administration released a report describing the Des Moines area strategic plan to implement an ITS (34). The plan proposes the use of ITS technologies throughout the Des Moines region to improve traveler information, safety, and mobility. In May 1995, research began on a Des Moines metropolitan area ITS early deployment plan. The purpose of the study was to determine what ITS technologies would most benefit the Des Moines MPO region, and a long-term plan to deploy these technologies in the metropolitan area was proposed. The study resulted in the Des Moines Metropolitan Area ITS Strategic Plan report mentioned in the previous paragraph (34). The Des Moines Metropolitan Area ITS Strategic Plan proposed ITS technology applications throughout the Des Moines metropolitan area. This region contains portions of Dallas, Madison, Polk, and Warren counties, and the cities of Des Moines, Altoona, Ankeny, Bondurant, Carlisle, Clive, Grimes, Johnston, Pleasant Hill, Urbandale, West Des Moines, and Windsor Heights. The boundaries of the Des Moines MPO are shown in Figure 15. The implementation of the strategic plan will require a significant amount of inter-jurisdictional cooperation. Early in the process, it was recommended that the Iowa DOT (in cooperation with the Des Moines MPO and the state highway patrol) lead the implementation of the proposed ITS plan. Description of Strategic Plan Components The ITS strategic plan for the Des Moines metropolitan area includes various technologies. The overall goal of these technologies is to improve transportation mobility and safety in the Des Moines area by reducing the removal time of crashes, providing travelers with improved and more current roadway system traffic flow conditions, and improving the traffic flow management near high crash locations. In the past, most intelligent transportation systems have been implemented in relatively large cities (e.g., Chicago) with significant traffic congestion. The schedule and components of the proposed ITS measures in Des Moines are planned to recognize the size/population of the metropolitan area and the past experiences of other cities. For example, the plan identifies achievable, economically feasible, and sustainable short-term candidates for ITS projects in the Des Moines area. It also incrementally builds a core ITS infrastructure that uses interoperable systems, and recognizes the long-term commitment required for full implementation of the plan. In fact, the plan developed a framework for the partnerships needed between the MPO, other transportation development programs, and other stakeholders. The plan specifically included near-term (1 to 5 years in the future) recommendations, and a medium- to long-term (5 to 10 and 57
 in the following categories: Public")
68 Jurisdiction Borders Figure 15 Des Moines Metropolitan Planning Organization Area 10 to 20 years in the future, respectively) deployment framework. It also outlined the development of the ITS infrastructure required for plan implementation, and identified specific projects (and their estimated costs) in the following categories: Public Transportation Systems Commercial Vehicle Operations Service Patrols Priority Corridors Interjurisdictional Signal Control 58
69 Advanced Traffic Management and Traveler Information Systems Incident Management Pre-Trip Traveler Information The Application of Roadway User Impacts in the Des Moines Metropolitan Area ITS Strategic Plan The following paragraphs describe how the results of this research might be applied to some of the projects within the eight categories (see above) addressed by the Des Moines Metropolitan Area ITS Strategic Plan. Commercial Vehicle Operations A number of commercial vehicle ITS measures have been implemented by state and federal governments. The Des Moines metropolitan area, however, contains the intersection of two major cross-country interstates (i.e., Interstate 35 and Interstate 80), and there is an interest in providing ITS measures (at the MPO level) that improve the safety and efficiency of commercial vehicle movements. The Des Moines ITS strategic plan has recommended that the motor carrier offices that dispatch commercial vehicles in the Des Moines area be provided with projected and real-time traffic condition information, the location and impact of incidents, and weather-related information. The data collection procedures and models developed in this project could be used to improve and refine the traffic condition and weather-related information provided to the commercial vehicle dispatch offices mentioned previously. If the video data collection equipment used during the 1998/1999 winter season (as part of this research) are incorporated into the Des Moines area ITS plan, video images of roadway surface conditions and traffic flow characteristics could be provided to the dispatchers in real time. The information provided by this video data collection equipment could also be used with the models developed as part of this research to provide the dispatch offices with a predication of how the existing or expected weather conditions would impact their commercial vehicle operations. For example, existing or projected volumes, and worst-case weather and roadway conditions could be used in the average vehicle speed model to predict an expected (and most likely reduced) average vehicle speed. The difference between the expected winter weather average vehicle speed and a typical average vehicle speed could then be used to calculate the potential delay. The volume and crash models could also be used to provide the reduction in travel (i.e., percent reduction in volume) and the increased crash potential expected from an ongoing or predicted winter storm event. A dispatcher could then, if appropriate, reroute his or her vehicles. In fact, the models developed could eventually be incorporated (along with an estimate of the roadways impacted by the same weather system) directly into the vehicle route modeling software used by dispatchers. Of course, the information collected as part of the Des Moines ITS could also be used to refine and improve the models developed as part of this research. Priority Corridors and Advanced Traffic Management/Traveler Information Systems The reconstruction of Interstate 235 in Des Moines will begin in the near future. This project will have regional traffic flow impacts in the Des Moines area for a number of years. Due to the construction, traffic is expected to divert from the interstate to parallel city arterials. Using a 59
70 travel demand model, Wilbur Smith and Associates identified some of the most likely vehicle diversion routes for four different construction/traffic diversion volume scenarios. The Des Moines ITS strategic plan suggests the implementation of ITS technologies along these priority corridors to help maintain traffic flow and mobility. The priority corridor (i.e., those roadways that will most likely be used by drivers to avoid the Interstate 235 reconstruction) ITS recommendations focus on the implementation of advanced transportation management and traveler information system (ATMTIS) measures. The core element of the recommended ATMTIS in Des Moines is the development of a traffic management center (TMC). A TMC serves as a central location for the collection and distribution of traffic and/or roadway condition information. In many cases, the information is used directly by organizations (e.g., the state patrol) with staff stationed at the TMC. In addition, the information collected by the TCM is typically distributed (when appropriate) to the public through highway advisory radio (HAR), variable message signs, and normal broadcast radio. The Des Moines ITS strategic plan recommends that the surveillance and data collection systems used in the Des Moines metropolitan area be video-based. In fact, a number of video-based surveillance and/or data collection cameras are recommended for installation in the Des Moines metropolitan area. The collection and calculation of traffic flow data through the proposed video-based detection system can be combined with the results of this project. The video and traffic flow data, when combined with RWIS weather information, can be used as input for the models developed to predict ongoing or forecasted winter storm event volume reductions (i.e., the potential for travel time changes), safety impacts, and average vehicle speed. The large amount of traffic flow, roadway, and weather data collected (and hopefully archived) could also be used to refine and improve the accuracy of the model results for their eventual dissemination to the general public. This information could be provided to the public in a useful form through a number of communication formats (e.g., HAR, variable message signs). Pre-Trip Traveler Information System Another recommendation in the Des Moines metropolitan area ITS strategic plan is the development of a pre-trip traveler information system. Travel information in this system would be provided to the public through home computers, public kiosks, and the television. This information should assist travelers with their decisions about how, when, and if they should travel. Data from the ATMTIS equipment discussed in the previous paragraphs, along with results of improved versions of the models developed in this research, can be integrated with existing and predicted weather data, traffic conditions, weather advisories, and incidents/closures information. When feasible, the results of models like those produced in this research can be provided to indicate the safety and mobility impacts of existing and predicted winter storm events. The Application of Roadway User Impacts and ITS Measures in Rural Iowa The state of Iowa is primarily rural. Therefore, ITS measures with rural applications have widespread potential. Using ITS measures to provide safe and efficient travel throughout Iowa (especially along Interstate 35 and Interstate 80) is one possible goal. Some of the ITS measures recommended for the Des Moines metropolitan area can also be applied in rural areas. Drivers on 60
71 the interstate can benefit from real-time information about traffic and weather conditions, and the models produced as part of this research can predict the impact of these conditions on the traveler. Travelers can then make more informed travel and route decisions. For example, if a major incident (possibly weather related) has occurred along the interstate, travelers could be informed of the incident and its location. They could also be provided with an estimate of the delay caused by the incident and possible alternative routes. This type of information could be beneficial, especially to commercial vehicle operators. Similar information about winter storm event impacts could be possible once the models developed as part of this research are refined and improved with more data. Pre-trip traveler information (including winter weather impacts on safety and mobility) would benefit travelers planning extended trips through the rural areas of Iowa. Travel and route decisions could be made before the trip begins or possibly en-route. Accurate information about existing or predicted adverse winter weather and roadway conditions is critical in Iowa. This information, along with the expected impact on travel, should eventually be available throughout Iowa. Summary Past research into the roadway user impacts of winter storm events has been limited. The large variability of weather and roadway condition factors that impact travel is significant and makes quantification of these impacts difficult. The results of this research and the models it produced are an initial step towards eventually informing the traveling public about the expected impacts of winter weather events. Several possibilities of how this information dissemination might occur have been discussed. The models developed (when refined appropriately) could be used in conjunction with the FORETELL project and the ITS measures proposed for Iowa. The usefulness of these two projects can be improved through their use of the models developed in this research. In turn, the data collected or produced as part of the FORETELL program and the Des Moines ITS can be used to improve the models from this research. In fact, the models produced as part of this research must be refined before their results are accurate enough to be used in any general manner. Additional data for model refinement can come from the existing and proposed (e.g., the two case study projects discussed) information systems in Iowa and other states. The impacts predicted by the models developed in this research could also eventually be incorporated into maintenance policy decisions. However, this would require research into the impacts of other winter maintenance approaches. The impacts quantified during this research were based on one winter maintenance approach (e.g., reasonably near-normal surface within 24 hours and an anti-icing policy) for a particular type of roadway (e.g., the interstate). It is expected that the models would show larger winter storm event impacts if non-interstate roadways or a less diligent winter maintenance approach (e.g., no anti-icing) were evaluated. 61
72 CONCLUSIONS AND RECOMMENDATIONS Conclusions The following conclusions are based on the results of the tasks completed as part of the Mobility and Safety Impacts of Winter Storm Events in a Freeway Environment project: The 64 significant winter storm events used in the traffic volume analysis of this research reduced volumes by an average of approximately 29 percent. The average traffic volume impact of the storm events at each data collection location, however, was relatively variable (ranging from approximately 16 percent to 47 percent). Hourly traffic volumes within winter storm events can be extremely variable. Overall, the hourly volume changes during winter storm events ranged from an increase of approximately 56 percent to a decrease of approximately 100 percent. In some cases, hourly volumes appeared to increase at the beginning and/or end of the winter storm event. This is most likely an indication of drivers leaving early and traveling before the storm arrives or waiting until it leaves the area. Three of the 64 winter storm events used in the traffic volume analysis actually showed an increase in traffic volumes. These increases appear to be the result of two factors. First, snowfall intensity is not a complete measure of the impact a winter storm event can have on traffic volumes. In other words, the average non-storm event volumes in this research may include storm events with a significant traffic volume impact but a snowfall intensity lower than that used to define a storm event. The second factor may be related to the short duration of some high intensity snowfall winter storm events. The winter storm events that experienced increased traffic volumes were of a short duration (five hours or less). It is believed that these two events experienced the phenomenon mentioned in the previous conclusion (i.e., traffic volumes increased at the beginning of events) but because of their short duration no reductions in traffic volume were recorded before the end of the event. A visual evaluation of the relationships among percent winter storm event traffic volume reduction, snowfall intensity (the variable used to define the winter storm events analyzed), and wind speed data collected from Iowa RWIS stations was completed. Percent winter storm event volume reduction data were plotted with snowfall intensity, maximum average wind speed, and maximum wind gust speed. These plots appear to indicate an increasing quadratic relationship between winter storm event traffic volume reductions and the wind speed data. No observable relationship, however, was apparent between snowfall intensity (at or above the minimum intensity of 0.2 inches per hour, which defined the winter snow events analyzed in this study) and percent winter storm event traffic volume reductions. A multiple regression analysis (which assume a normal distribution of the data) of the traffic volume reduction, RWIS, and snowfall data was completed to evaluate and quantify possible relationships. More specifically, this research considered the relationship between percent winter storm event volume reduction (the dependant variable) and storm event duration, snowfall intensity, total snowfall, minimum and maximum average wind speed, and maximum gust wind speed. Interactions and transformations of these variables were also considered. Percent winter storm event 62
73 volume reduction was found to have a significant (to a 95 percent level of confidence) positive relationship with the square of maximum wind gust speed and total snowfall. Volume reductions can be expected to increase with increases in either of these variables. Overall, the model developed also has some explanatory power with a coefficient of multiple determination (i.e., R-Squared) of 54.4 percent. Hourly crash frequencies and approximate crash rates increase dramatically during the winter storm events considered in this research (i.e., those with a snowfall intensity of at least 0.2 inches per hour). For example, the overall increase in hourly crash frequency was from (during non-storm periods) to crashes (during winter storm events) per hour. This is an increase of 942 percent. The magnitude of the crash frequencies, however, were very low during the non-storm time periods (0.005 to crashes per hour) and only increased to to crashes per hour during winter storm event time periods. The overall estimated increase in the approximated crash rates for the 54 winter storm events considered in this analysis was approximately 1,300 percent. The dramatic increases in hourly crash frequencies and approximate crash rates (reported in the previous conclusion) appear to based on the following four facts. One, this research considered only those winter storm events with a high estimated snowfall intensity (0.20 inches per hour or greater). In many cases, these events represent some of the most severe winter weather situations (especially when combined with high wind speed). Two, the winter storm events considered in this research also represent time periods when it is extremely difficult to keep roadway pavements clear. It should be expected that hourly crash frequencies and crash rates (normally very low on the interstate) would increase dramatically in these situations. Three, traffic volumes decrease during winter storm events at the same time the number of crashes is expected to increase. This combination has a complementary impact on the increases expected in crash rates. Four, there may be a bias in crash reporting during winter storm events. When compared to normal conditions, additional vigilance of public safety and maintenance crews may increase the number and type of crashes reported during winter storm events. A statistical analysis of winter storm event crash and weather-related variables was also completed. Relationships between winter storm event crash frequency (i.e., the number of crashes per winter storm event), an exposure term (the product of section length and traffic volume in million-vehicle-miles), snowfall intensity, maximum gust wind speed, and maximum/minimum average wind speed were evaluated with a Possion regression modeling approach. It was found that winter storm event crash frequency was significantly related (at a 95 percent level of confidence) to the exposure term, storm duration, and snowfall intensity (i.e., inches of snow per hour). The number of crashes per winter storm event increases with an increase in any or all of these three variables. The number of winter storm event crashes was also found to increase with maximum gust wind speed, but the model coefficient for this variable was not statistically significant at a 95 percent level of confidence. The goodness-of-fit measure for the overall model indicated that the model had some explanatory power. Weather, roadway condition, and traffic flow data were also actively collected during seven storm events of the 1998/1999 winter season. More than 27 hours of data were collected manually or with video-based data collection equipment, and then summarized into minute time periods. Traffic volumes, average vehicle speeds, vehicle gaps, 63
74 visibility, and an approximation of the snow cover on the roadway were collected, calculated or estimated for each 15-minute period. The seven 1998/1999 winter storm events during which data were collected had a wide range of characteristics. Conditions ranged from extremely poor (e.g., snow falling, visibility less than ¼-mile, and 90 percent of the roadway cross section covered by snow) to near-normal (e.g., snow falling, but no snow on the roadway and visibility more than ¼-mile) conditions. In fact, the mean vehicle speed for the seven individual winter storm events ranged from 51.3 to 69.7 mph. Overall, the winter storm event average vehicle speed was 59.9 mph, but the normal or non-snow event average vehicle speed was 71.5 mph. This difference represents a 16 percent reduction in average vehicle speed between normal and winter storm event conditions. In addition, the standard deviation for the average vehicle speeds during the winter storm events was 7.57 mph, but for the normal or non-snow conditions it was 1.86 mph. Therefore, average vehicle speeds are not only reduced during winter storm events, but they are also more variable than non-snow event time periods. Past research has shown that the probability of a crash increases when a vehicle is traveling faster or slower than the overall average vehicle speed of the traffic flow. A multiple regression analysis (assuming a normal distribution of the data) of the data collected during the 1998/1999 winter season was also completed. A visual evaluation of the volume and speed data from the off-peak and peak time periods (i.e., 4:00 to 6:00 PM) found similar but segmented patterns. The majority of the data (approximately 82 percent), and the focus of this analysis was the off-peak period winter storm event data. Relationships between winter storm event average vehicle speed, traffic volume, vehicle gap, visibility, and roadway snow cover were evaluated. A relationship (within 95 percent level of confidence) was found between winter storm event average vehicle speed, the square of traffic volume, visibility (greater or less than ¼-mile), and roadway snow cover (snow on the roadway lanes or not). Overall, winter storm event average vehicle speed increased with the square of traffic volume, and decreased when visibility dropped below ¼-mile and when snow began to impact or cover the roadway lanes. It is believed that in this model traffic volume is a surrogate for weather characteristics that impact vehicle speed, but could not be collected during the 1998/1999 winter season (e.g., total snowfall and wind speeds). The model indicates that when visibility is less than ¼-mile winter storm event average vehicle speed decreases by about 4 mph, but that snow on the roadway lanes decreases it by about 7 mph. Both of these reductions in average vehicle speed were found to be statistically significant at a 95 percent level of confidence. However, because of the small data sample sizes used to make these conclusions (n = 19 and 10, respectively), caution is advised with their application. Several issues need to be addressed before future winter weather data collection activities. For example, more robust video data collection equipment and connections will need to be acquired. In addition, the markings necessary to use the video data collection system must be located where they are visible from the early hours of (and preferably throughout) a winter storm event. Traffic control devices that can adequately withstand high wind speeds and blowing snow are also needed. Mobile video data collection during winter storm events requires a steadfast approach to ensuring the safety of the data collection team and the traveling public. Permanent and automated data collection systems might be 64
75 considered to avoid or at least mitigate the impacts of the need to work in a low visibility, high wind, low temperature environment. Recommendations The following recommendations are based on the results of the tasks completed as part of the Mobility and Safety Impact of Winter Storm Events in a Freeway Environment project: Subsets of the winter storm events identified should be examined and their impact on traffic volumes and/or crashes investigated. Some examples include grouping the winter storm events by duration, weekend/weekday, maximum average wind speed, and maximum gust speed. The entire winter storm event database, rather than just storms with a snowfall intensity over 0.2 inches per hour, could also be evaluated in future research. In addition, volume changes within winter storm events should be more closely investigated. The distribution of crashes within winter storm events should be investigated. It has been hypothesized that many of the crashes identified in this research may have occurred in the first few hours of the winter storm event. Comparisons to maintenance schedules may also be possible to determine how crash numbers change before and after winter maintenance activities. A similar approach may be possible with regard to winter storm event and/or area pre-wetting activities. The implementation of automatic vehicle locators on winter maintenance vehicles, and a fully operational winter maintenance concept vehicle, will make this task easier to complete. The impact of winter storm events on the severity of crashes should be considered. It has been hypothesized that the severity of crashes may actually decrease, and the number of injuries and property damage crashes increase, during winter storm events. Future use of the mobile video data collection unit during winter storm events will require more robust electrical and video equipment/connections, a better method of marking the roadway for visual distance verification, and more permanent traffic control devices. The widespread use of mobile winter weather video data collection is not considered feasible. A safer approach to the collection of winter storm event data (e.g., traffic flow characteristics and roadway surface conditions) would include the development and application of permanent or semi-permanent monitoring and data collection equipment at strategic locations throughout the state. For example, the automated collection of roadway conditions (i.e., snow cover) and visibility measures require data collection with some type of video- or laser-based equipment. This type of data collection/monitoring equipment could initially be incorporated into the Des Moines ITS strategic plan infrastructure, or possibly into some of the existing RWIS stations. The monitoring and collection of weather/roadway surface conditions and traffic flow characteristics (mobility and safety) would produce more data, and allow the verification and refinement of the models developed in this research. Data from several winter storm events with similar characteristics are necessary for improved confidence in the models, and in Iowa a significant number of winter seasons may be necessary for this type of repeatability. 65
76 The weather, roadway, traffic, and crash data available from existing Iowa information systems should be archived and continually investigated. Weather data from the Iowa RWIS stations are now available on the Internet, and should be archived. This type of data is also being collected by other states, countries, and researchers, and may be useful. Additional data will allow the verification and/or refinement of the models developed during this research. In fact, at this point in time, the results from the winter storm event volume reduction, crash frequency, and average vehicle speed models should be used with caution. Until the models are refined and/or verified with more data, the general public and/or maintenance officials should use the model results for exploratory and informational reasons only, and not for decision-making or policy-setting purposes. Consideration should be given to incorporating the products of this study and other weather/safety/traffic flow projects into the Des Moines area ITS strategic plan and the FORETELL program. The objective of these case study projects is to improve the safety and mobility of the traveling public during all types of weather, and the models developed as part of this research (once verified and refined) could make them more useful. The models could eventually be used by the information collection and dissemination systems of both projects to provide the public and winter maintenance decision-makers with expected traveler impacts of winter storm events with particular characteristics. Of course, the data collected and/or improved weather forecasting produced by these case study projects could also be used to improve the validity of the models developed in this research. 66
77 REFERENCES 1. Committee for Guidance on Setting and Enforcing Speed Limits. Special Report 254: Managing Speed Review of Current Practice for Setting and Enforcing Speed Limits. Transportation Research Board, National Research Council, Washington, D.C., Jones, E.R., M.E. Goolsby, and K.A. Brewer. The Environmental Influence of Rain on Freeway Capacity. In Highway Research Record 321. Transportation Research Board, National Research Council, Washington, D.C., 1970, pp Ries, G.L. Impact of Weather on Freeway Capacity. Minnesota Department of Transportation, Office of Traffic Engineering, Systems and Research Section, Minneapolis, Minnesota, January Kleitsch and D.E. Cleveland. The Effect of Rainfall on Freeway Capacity. Highway Safety Research Institute, Report Tr S-6. University of Michigan, Ann Arbor, Michigan, Kockelman, K.M. Changes in Flow-Density Relationship Due to Environmental, Vehicle, and Driver Characteristics. In Transportation Research Record Transportation Research Board, National Research Council, Washington, D.C., 1998, pp Committee on Highway Capacity and Quality of Service. Special Report 209: Highway Capacity Manual, 3 rd Edition. Transportation Research Board, National Research Council, Washington, D.C., Hall F.L. and D. Barrow. Effect of Weather on the Relationship Between Flow & Occupancy on Freeways. In Transportation Research Record Transportation Research Board, National Research Council, Washington, D.C., 1988, pp Hanbali, R.M. and D.A. Kuemmel. Traffic Volume Reductions Due to Winter Storm Conditions. In Transportation Research Record Transportation Research Board, National Research Council, Washington, D.C., 1993, pp McBride, J.C., et al. Economic Impact of Highway Snow and Ice Control. National Pooled Fund Study. Federal Highway Administration Report FHWA-RD Federal Highway Administration, U.S. Department of Transportation, Washington, D.C., December Perry, A.H. and L.J. Symons. Highway Meteorology. University College of Wales, Swansea, United Kingdom, Nixon, W. The Potential of Friction as a Tool for Winter Maintenance. Iowa Institute of Hydraulic Research, Report No. 392, College of Engineering, the University of Iowa, Iowa City, Iowa, February Hanbali, R.M. Economic Impact of Winter Road Maintenance on Road Users. In Transportation Research Record Transportation Research Board, National Research Council, Washington, D.C., 1994, pp
78 13. Oeberg. G. Friction and Journey Speed on Roads with Various Winter Road Maintenance. Swedish National Road and Transport Research Institute (VTI) Sartryck, Report No. 237, Wallman, C.G., P. Wretling, and G. Oeberg. Effects of Winter Road Maintenance State of the Art. Swedish Road and Traffic Research Institute (VTI) Sartryck, Report No. 423, Liang, W.L., M. Kyte, F. Kitchener, and P. Shannon. The Effect of Environmental Factors on Driver Speed: A Case Study. In Transportation Research Record Transportation Research Board, National Research Council, Washington, D.C., 1998, pp Lamm, R., E.M. Choueiri, and T. Mailaender. Comparison of Operating Speeds on Dry and Wet Pavements of Two-Lane Rural Highways. In Transportation Research Record Transportation Research Board, National Research Council, Washington, D.C., 1990, pp Ibrahim, A.T., and F.L. Hall. Effect of Adverse Weather Conditions on Speed-Flow- Occupancy Relationships. In Transportation Research Record Transportation Research Board, National Research Council, Washington, D.C., 1994, pp Brilon W., and M. Ponzlet. Variability of Speed-Flow Relationships on German Autobahns. In Transportation Research Record Transportation Research Board, National Research Council, Washington, D.C., 1996, pp Philli-Shivola, Y. and A. Schirokoff. Finnish Solution for Transport Telmatics E18 as a Test Area. Paper presented at 78 th Transportation Research Board Annual Meeting, January 1999 (Included on Preprint CD-ROM). 20. MacWhinney, R.C., E.C. Lovell, and F.J. Ruden. Evaluation of Snow and Ice Detection. Federal Highway Administration Report FHWA-RD Final Report. Federal Highway Administration, U.S. Department of Transportation, Washington, D.C., Brown, B. and K. Baass. Seasonal Variation in Frequencies and Rates of Highway Accidents as a Function of Severity. In Transportation Research Record Transportation Research Board, National Research Council, Washington, D.C., 1997, pp Scharsching. H. Nowcasting Road Conditions: A System Improving Traffic Safety in Wintertime. In conference proceedings: Road Safety in Europe and Strategic Highway Research Program (SHRP), No. 4A, Part 5: Road and Roadside Design, Hazardous Situations. Swedish Road and Traffic Research Institute (VTI) Sartryck, 1996, pp Savenhed, H. Relation Between Winter Road Maintenance and Road Safety. Swedish Road and Traffic Research Institute (VTI) Sartryck, Report No. 214, Kuehnle A. and W. Burghout. Winter Road Condition Recognition Using Video Image Classification. In Transportation Research Record Transportation Research Board, National Research Council, Washington, D.C., 1998, pp
79 25. Reiter, E.R., D.K. Doyle, and L. Teixeira. Intelligent and Localized Weather Prediction. Strategic Highway Research Program, National Research Council, Washington, D.C., Boselly III, E. Road Weather Information Systems: What are They and What Can They do for You? In Transportation Research Record Transportation Research Board, National Research Council, Washington, D.C., 1993, pp Pilli-Shivola, Y., and K. Toivonen. Road Weather Service system in Finland and Savings in Driving Costs. In Transportation Research Record Transportation Research Board, National Research Council, Washington, D.C., 1993, pp Iowa Climate Review. Iowa Department of Agriculture & Land Stewardship, State Climatologist Office. Des Moines, Iowa. November 1996 (Volume 10, Number 11) to April 1997 (Volume 11, Number 4), and October 1997 (Volume 11, Number 10) to March 1998 (Volume 12, Number 3). 29. Climatological Data Iowa. United States Department of Commerce, National Oceanic and Atmospheric Administration, National Environmental Satellite, Data and Information Service, Washington, D.C., and National Climatic Data Center, Asheville, North Carolina. November 1995 (Volume 106, Number 11) to March 1996 (Volume 107, Number 3). 30. Greene W. Econometric Analysis. Third Edition. Macmillan Publishing Company, New York, NY, Iowa Department of Transportation. Automatic Traffic Records Iowa Department of Transportation, Ames, IA, January Davies, P., D. Deeter, and C.E. Bland. FORETELL: Providing Integrated Weather Information Services Across the Upper Midwest. In proceedings for Crossroads 2000 conference. Iowa State University, Center for Transportation Research and Education, Ames, Iowa, 1998, pp Matrix Management Group. Road Weather Information Systems Volume 1: Research Report. SHRP H 350. Strategic Highway Research Program, Washington, D.C., September The Center for Transportation Research and Education, Allied Signal, and Booz-Allen and Hamilton. Des Moines Metropolitan Area ITS Strategic Plan. Prepared for the Des Moines Metropolitan Planning Organization, Iowa Department of Transportation, and the Federal Highway Administration. Center for Transportation Research and Education, Ames, IA, December
80 APPENDIX Storm Durations and Estimated Snow Intensity from RWIS/NWS Database Combination #133 - I-235, Des Moines, Iowa (Time Scale - 0 Hour = 12 AM to 1 AM, 23 Hour = 11 PM to 12 AM) Estimated Hourly Holiday Used in Used in Begin Date End Date Snowfall Intensity Volumes Influenced Volume Crash (Year/Month/Day) Begin Hour (Year/Month/Day) End Hour Hours Duration (Inches/Hour) Estimated? Date? Analysis? Analysis? 1 97/04/ /04/ Yes No No No 2 97/02/ /02/ No No Yes Yes 3 98/03/ /03/ No No Yes No 4 98/03/ /03/ No No Yes No 5 97/11/ /11/ No No Yes Yes 6 98/01/ /01/ No No Yes No 7 98/01/ /01/ No No Yes No 8 97/12/ /12/ No No Yes Yes 9 97/12/ /12/ No No Yes Yes 10 97/12/ /12/ /12/ /12/ /12/ /12/ /12/ /12/ /01/ /01/ /01/ /01/ /01/ /01/ /01/ /01/ /01/ /01/ /01/ /01/ /12/ /12/ /11/ /11/ /12/ /12/ /12/ /12/ /12/ /12/ /03/ /03/ /12/ /12/ /02/ /02/ /02/ /03/ /01/ /01/ /02/ /02/ /01/ /01/ /01/ /01/ /01/ /01/
81 Storm Durations and Estimated Snow Intensity from RWIS/NWS Database Combination #512 - I-35, Ames, Iowa (Time Scale - 0 Hour = 12 AM to 1 AM, 23 Hour = 11 PM to 12 AM) Estimated Hourly Holiday Used in Used in Begin Date End Date Snowfall Intensity Volumes Influenced Volume Crash (Year/Month/Day) Begin Hour (Year/Month/Day) End Hour Hours Duration (Inches/Hour) Estimated? Date? Analysis? Analysis? 1 97/02/ /02/ No No Yes Yes 2 98/03/ /03/ No/Yes No No No 3 98/03/ /03/ Yes No No No 4 98/03/ /03/ Yes No No No 5 96/02/ /02/ No No Yes Yes 6 97/02/ /02/ No No Yes Yes 7 97/04/ /04/ No No Yes Yes 8 98/01/ /01/ Yes No No No 9 97/02/ /02/ No No Yes Yes 10 97/01/ /01/ No No Yes Yes 11 97/01/ /01/ No No Yes Yes 12 97/11/ /11/ No No Yes Yes 13 97/01/ /01/ No No Yes Yes 14 97/01/ /01/ No No Yes Yes 15 96/03/ /03/ Yes No No No 16 97/01/ /01/ /12/ /12/ /12/ /12/ /12/ /12/ /11/ /11/ /12/ /12/ /12/ /12/ /12/ /12/ /03/ /03/ /11/ /11/ /01/ /01/ /03/ /03/ /11/ /11/ /03/ /03/ /12/ /12/ /12/ /12/ /01/ /01/ /01/ /01/ /02/ /02/ /02/ /02/ /12/ /12/ /02/ /03/ /12/ /12/ /12/ /12/ /01/ /01/ /02/ /02/ /03/ /03/ /01/ /01/ /12/ /12/ /01/ /01/

82 72
83 Storm Durations and Estimated Snow Intensity from RWIS/NWS Database Combination #615 - I-80, Grinnell, Iowa (Time Scale - 0 Hour = 12 AM to 1 AM, 23 Hour = 11 PM to 12 AM) Estimated Hourly Holiday Used in Used in Begin Date End Date Snowfall Intensity Volumes Influenced Volume Crash (Year/Month/Day) Begin Hour (Year/Month/Day) End Hour Hours Duration (Inches/Hour) Estimated? Date? Analysis? Analysis? 1 96/01/ /01/ No No Yes Yes 2 98/03/ /03/ No No Yes No 3 98/03/ /03/ No No Yes No 4 95/11/ /11/ No No Yes Yes 5 96/01/ /01/ No No Yes Yes 6 95/11/ /11/ No No Yes Yes 7 96/01/ /01/ /03/ /03/ /12/ /12/ /12/ /12/ /01/ /01/ /11/ /11/ /02/ /02/ /03/ /03/ /01/ /01/ /03/ /03/ /03/ /03/ /02/ /02/ /02/ /02/ /03/ /03/ /02/ /03/ /01/ /01/ /03/ /03/ /03/ /03/ /03/ /03/
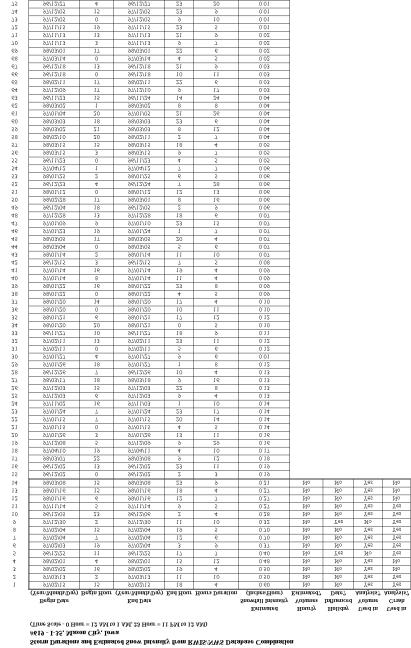
84 74
Effect of Environmental Factors on Free-Flow Speed
 Effect of Environmental Factors on Free-Flow Speed MICHAEL KYTE ZAHER KHATIB University of Idaho, USA PATRICK SHANNON Boise State University, USA FRED KITCHENER Meyer Mohaddes Associates, USA ABSTRACT
Deploying the Winter Maintenance Support System (MDSS) in Iowa
 in Iowa") Deploying the Winter Maintenance Support System (MDSS) in Iowa Dennis A. Kroeger Center for Transportation Research and Education Iowa State University Ames, IA 50010-8632 kroeger@iastate.edu Dennis Burkheimer
Deploying the Winter Maintenance Support System (MDSS) in Iowa Dennis A. Kroeger Center for Transportation Research and Education Iowa State University Ames, IA 50010-8632 kroeger@iastate.edu Dennis Burkheimer
Traffic volume, afecy, and vehicle speed along a. Investigation of Volume, Safety, and Vehicle Speeds During Winter Storm Events. Keith K.
 Investigation of Volume, Safety, and Vehicle Speeds During Winter Storm Events Keith K. Knapp Winter storm events can have significa~t impacts on mobility and safety. During the past year, these impacts
Transportation and Road Weather
 Portland State University PDXScholar TREC Friday Seminar Series Transportation Research and Education Center (TREC) 4-18-2014 Transportation and Road Weather Rhonda Young University of Wyoming Let us know
Road Weather Management Program
 Road Weather Management Program AASHTO/TRB Joint Maintenance Conference: Highway Safety & Reliability (Winter Maintenance and Highway Safety and Reliability) 7/22/2015 Gabe Guevara. P.E. FHWA Office of
Dunn County Snow Removal Policy
 Dunn County Snow Removal Policy OVERVIEW With the advent of another winter season in the northern plains comes the possibility of snow, freezing rain and slippery roadways, and area resident s concern
Responsive Traffic Management Through Short-Term Weather and Collision Prediction
 Responsive Traffic Management Through Short-Term Weather and Collision Prediction Presenter: Stevanus A. Tjandra, Ph.D. City of Edmonton Office of Traffic Safety (OTS) Co-authors: Yongsheng Chen, Ph.D.,
City of Saginaw Right of Way Division Snow and Ice Removal Policy January 18, 2016
 Snow and Ice Removal Policy January 18, 2016 It is the policy of the to provide snowplowing and ice removal services in order to: Provide safe traveling conditions for motorists and pedestrians Assist
Weather Information for Road Managers
 Weather Information for Road Managers by Paul A. Pisano, Lynette C. Goodwin and Andrew D. Stern How Does Weather Affect Roads? The complex interactions between weather and roads have major affects on traffic
Evaluating the Potential of Remote Sensing Rural Road and Travel Conditions
 82 TRANSPORTATION RESEARCH RECORD 1409 Evaluating the Potential of Remote Sensing Rural Road and Travel Conditions KEVIN A. FRENCH AND EUGENE M. WILSON Communication of current road and travel conditions
Snow and Ice Control POLICY NO. P-01/2015. CITY OF AIRDRIE Snow and Ice Control Policy
 Page 1 CITY OF AIRDRIE Snow and Ice Control Effective Date: Approved By: Approved On: March 17, 2015 City Council March 16, 2015 Revision Date: Resolution #: ------ PURPOSE: The City of Airdrie is responsible
Federal Maintenance Decision Support System (MDSS) Prototype Update
 Prototype Update") Federal Maintenance Decision Support System (MDSS) Prototype Update Kevin R. Petty, Ph.D. National Center for Atmospheric Research Boulder, Colorado, USA MDSS Meeting 6 August 2008 Reno, Nevada Historical
Federal Maintenance Decision Support System (MDSS) Prototype Update Kevin R. Petty, Ph.D. National Center for Atmospheric Research Boulder, Colorado, USA MDSS Meeting 6 August 2008 Reno, Nevada Historical
UDOT Weather Program Traffic Operations Center
 UDOT Weather Program Traffic Operations Center Presentation Goals You MUST account for weather in your Traffic Management program Provide you with information on proven tools and strategies You NEED a
Plows Truck Drivers. tations. Winter Maintenance Report. 30,546 Lane Miles 87% 174,000 40,000. Total Cost of Winter $ Million
 2014-15 Winter Maintenance Report 30,546 Lane Miles At A Glance Total Cost of Winter $ 87.9 Million 87% Frequency Achieving Bare Lanes 1,514 Full-time 327 Backup Drivers 839 Plows 39.4 Statewide Snowfall
CITY OF NEW LONDON WINTER ROAD & SIDEWALK MAINTENANCE POLICY
 CITY OF NEW LONDON WINTER ROAD & SIDEWALK MAINTENANCE POLICY GENERAL The purpose of this policy is to set up acceptable procedures and policies for the winter maintenance of public areas in the City of
10/18/2016 The Hoosier Co. Inc W. 86th Street, Indianapolis, IN
 10/18/2016 The Hoosier Co. Inc. 5421 W. 86th Street, Indianapolis, IN 46268 1 Today s Topics Weather impacts What is RWIS? How old is this tool? Key RWIS Technology/Innovation Key RWIS sensing parameters
What are Intelligent Transportation Systems? Major ITS Areas
 Intelligent Transportation Systems in Small Cities and Rural Areas Indiana Road School March 20, 2001 Steven Beningo Federal Highway Administration Midwestern Resource Center What are Intelligent Transportation
Research Needs for Weather-Responsive Traffic Management
 1 Research Needs for Weather-Responsive Traffic Management Paul A. Pisano, Team Leader Federal Highway Administration (FHWA), Office of Operations Road Weather Management 400 Seventh Street, S.W. HOTO-1,
COUNCIL POLICY MANUAL
 COUNCIL POLICY MANUAL SECTION: PUBLIC WORKS SUBJECT: SNOW & ICE CONTROL POLICY 2012/2013 GOAL: Pages: 1 of 10 Approval Date: Dec. 3, 2012 Res. # 1001/2012 To annually identify the winter maintenance costs
Educational Objectives
 MDSS and Anti-Icing: How to Anti-Ice with Confidence Wilf Nixon, Ph.D., P.E. IIHR Hydroscience and Engineering University of Iowa Iowa City And Asset Insight Technologies, LLC Educational Objectives At
EFFECTS OF WEATHER-CONTROLLED VARIABLE MESSAGE SIGNING IN FINLAND CASE HIGHWAY 1 (E18)
") EFFECTS OF WEATHER-CONTROLLED VARIABLE MESSAGE SIGNING IN FINLAND CASE HIGHWAY 1 (E18) Raine Hautala 1 and Magnus Nygård 2 1 Senior Research Scientist at VTT Building and Transport P.O. Box 1800, FIN-02044
EFFECTS OF WEATHER-CONTROLLED VARIABLE MESSAGE SIGNING IN FINLAND CASE HIGHWAY 1 (E18) Raine Hautala 1 and Magnus Nygård 2 1 Senior Research Scientist at VTT Building and Transport P.O. Box 1800, FIN-02044
Weather Responsive Traffic Management. WYDOT VSL Project. October 2011
 Weather Responsive Traffic Management Portland, OR WYDOT VSL Project October 2011 Variable Speed Limits I 80 Background Information >50% of I 80 traffic in Wyoming is commercial vehicles Rural AADT 11,000
A FIELD EXPERIMENT ON THE ACCURACY OF VISUAL ASSESSMENT OF WINTER ROAD CONDITIONS
 A FIELD EXPERIMENT ON THE ACCURACY OF VISUAL ASSESSMENT OF WINTER ROAD CONDITIONS Naoto Takahashi Civil Engineering Research Institute for Cold Region 1-34, Hiragishi 1-3, Toyohira-ku, Sapporo, Hokkaido
PILOT STUDY: PAVEMENT VISUAL CONDITION AND FRICTION AS A PERFORMANCE MEASURE FOR WINTER OPERATIONS
 1 PILOT STUDY: PAVEMENT VISUAL CONDITION AND FRICTION AS A PERFORMANCE MEASURE FOR WINTER OPERATIONS Nishantha Bandara, Ph.D., P.E. Department of Civil Engineering Lawrence Technological University 21000
MDSS and Advanced Forecasting STSMO Weather Workshop Dave Huft, SDDOT Research Program Manager September 12, 2017
 Connecting South Dakota and the Nation MDSS and Advanced Forecasting STSMO Weather Workshop Dave Huft, SDDOT Research Program Manager September 12, 2017 1 Weather Impacts & Strategies Winter perceived
MUNICIPALITY OF ANCHORAGE PUBLIC TRANSPORTATION DEPARTMENT AnchorRIDES TRANSPORTATION SYSTEM
 Purpose: The Public Transportation Department and contracted provider will provide safe transportation for AnchorRIDES customers and employees during severe weather or emergency conditions. AnchorRIDES
CITY OF BEAVER DAM SNOW & ICE REMOVAL POLICY
 CITY OF BEAVER DAM SNOW & ICE REMOVAL POLICY Revised January, 2016 Approved by Operations Committee: February 1, 2016 This snow and ice removal policy guides Public Works personnel with deicing, plowing,
SNOW CONTROL OPERATIONS
 SNOW CONTROL OPERATIONS PUBLIC WORKS TEAM STREET MAINTENANCE DIVISION SNOW CONTROL OPERATIONS Standard Operating Procedures for Snow Removal Operations. 1. Plowing operations will be initiated when snow
Evaluation of fog-detection and advisory-speed system
 Evaluation of fog-detection and advisory-speed system A. S. Al-Ghamdi College of Engineering, King Saud University, P. O. Box 800, Riyadh 11421, Saudi Arabia Abstract Highway safety is a major concern
Center for Transportation Research and Education. Winter Maintenance Operations & Maintenance Decision Support System TRANS 691 Seminar March 5, 2004
 Center for Transportation Research and Education Winter Maintenance Operations & Maintenance Decision Support System TRANS 691 Seminar March 5, 2004 1 Why Winter Maintenance? Weather related traffic accidents
Winter Maintenance Report
 98.4 Official State Snowfall 150 Truck Stations 1,813 Full-time and Backup Snowfighters 840 Plow trucks - includes 47 reserve plows 30,585 Lane Miles 85% Frequency Achieving Bare Lanes 2017-18 Winter Maintenance
Organized Chain-Up and VSL
 Organized Chain-Up and VSL Jim Mahugh, PE WSDOT SC Region Traffic Engineer North/West Passage VSL Peer Exchange January 28, 2015 Snoqualmie Pass 2 Limits of VSL EB: MP 48.12 to 66.56 WB: MP 46.69 to 66.90
1st Annual Southwest Ohio Snow Conference April 8, 2010 Abner F. Johnson, Office of Maintenance - RWIS Coordinator
 1st Annual Southwest Ohio Snow Conference April 8, 2010 Abner F. Johnson, Office of Maintenance - RWIS Coordinator The Ohio Department of Transportation ODOT has approximately 5500 full-time employees
What s New in the World of Winter Maintenance Technology. Laser Road Surface Sensor (LRSS) Functional Description
 Functional Description") What s New in the World of Winter Maintenance Technology Dennis Burkheimer Winter Operations Administrator Iowa Department of Transportation John Scharffbillig Fleet Manager Minnesota Department of Transportation
What s New in the World of Winter Maintenance Technology Dennis Burkheimer Winter Operations Administrator Iowa Department of Transportation John Scharffbillig Fleet Manager Minnesota Department of Transportation
Weather Information for Surface Transportation (WIST): Update on Weather Impacts and WIST Progress
: Update on Weather Impacts and WIST Progress") Weather Information for Surface Transportation (WIST): Update on Weather Impacts and WIST Progress Samuel P. Williamson Office of the Federal Coordinator for Meteorological Services and Supporting Research
Weather Information for Surface Transportation (WIST): Update on Weather Impacts and WIST Progress Samuel P. Williamson Office of the Federal Coordinator for Meteorological Services and Supporting Research
WINTER STORM Annex II
 WINTER STORM Annex II I. PURPOSE A. This annex has been prepared to ensure a coordinated response by state agencies to requests from local jurisdictions to reduce potential loss of life and to ensure essential
Acquisition of Multi-Function Equipment at DIA: Conditions, Factors, Considerations & Integration. Presented by Mike Carlson September 20, 2012
 Acquisition of Multi-Function Equipment at DIA: Conditions, Factors, Considerations & Integration Presented by Mike Carlson September 20, 2012 1 Denver International Airport 5 Runways 12,000 /. (3,658m)
Town of Barnstable. Department of Public Work. Snow and Ice Control Operations Plan
 Town of Barnstable Department of Public Work Snow and Ice Control Operations Plan I. Mission: The mission of the Department of Public Works is to remove accumulations of snow and ice from town, county
Innovations in Road Weather. Jon Tarleton Senior Marketing Manager / Meteorologist
 Innovations in Road Weather Jon Tarleton Senior Marketing Manager / Meteorologist How Do We Warn Them About This! 2 We have tried this before! Limited Success Visibility and wet pavement worked well Snow/ice
Winter Maintenance on Ontario s Highways
 Ministry of Transportation Winter Maintenance on Ontario s Highways MTO Eastern Region November 18, 2015, Northumberland County Council Outline 1. Winter Maintenance Areas - Eastern Region 2. Winter Maintenance
SPEARFISH FIRE DEPARTMENT POLICIES AND PROCEDURES
 SPEARFISH FIRE DEPARTMENT POLICIES AND PROCEDURES Page 1 of 5 Volume: Operation Section: 20.00 Number: 20.09 Subject: Weather Watches, Warnings, Advisory s and Spotter Activation Date Issued: 28 March
FHWA Road Weather Management Program Update
 FHWA Road Weather Management Program Update 2015 Winter Maintenance Peer Exchange Bloomington, MN September 21-25, 2015 Gabe Guevara FHWA Office of Operations Road Weather Management Team 2015 Winter Maintenance
MUNICIPALITY OF ANCHORAGE PUBLIC TRANSPORTATION DEPARTMENT AnchorRIDES PARATRANSIT SYSTEM
 Purpose: The Public Transportation Department (PTD) and AnchorRIDES paratransit contractor will provide transportation in as safe a manner as effectively possible. Paratransit vehicles primarily operate
Cost-Benefit Analysis of the Pooled- Fund Maintenance Decision Support System: Case Study
 Cost-Benefit Analysis of the Pooled- Fund Maintenance Decision Support System: Case Study Zhirui Ye (WTI) Xianming Shi (WTI) Christopher K. Strong (City of Oshkosh) 12 th AASHTO-TRB TRB Maintenance Management
Meridian Environmental Technology, Inc.
 Meridian Environmental Technology, Inc. Providing Tomorrow s Technology Today Meridian is committed to the support of its clients through advancement of science and technology A National Leader in Road
Town of Oconomowoc Snow & Ice Control Policy
 Town of Oconomowoc Snow & Ice Control Policy Introduction The purpose of this policy is to provide a detailed overview of the Town s snow & ice control operations including its goals and objectives. All
A Proposed Driver Assistance System in Adverse Weather Conditions
 1 A Proposed Driver Assistance System in Adverse Weather Conditions National Rural ITS Conference Student Paper Competition Second runner-up Ismail Zohdy Ph.D. Student, Department of Civil & Environmental
AN INVESTIGATION INTO THE IMPACT OF RAINFALL ON FREEWAY TRAFFIC FLOW
 AN INVESTIGATION INTO THE IMPACT OF RAINFALL ON FREEWAY TRAFFIC FLOW Brian L. Smith Assistant Professor Department of Civil Engineering University of Virginia PO Box 400742 Charlottesville, VA 22904-4742
City of Brainerd, Minnesota Snowplowing Policy
 City of Brainerd, Minnesota Snowplowing Policy 1. Introduction The city of Brainerd, Minnesota, finds that it is in the best interest of the residents of the city to assume basic responsibility for control
What is 511? Need for 511 Services. Development & Deployment of Regional Road and Weather Information Supporting 511 Traveler Services
 Development & Deployment of Regional Road and Weather Information Supporting 511 Traveler Services Leon F. Osborne University of North Dakota Regional Weather Information Center Grand Forks, ND David L.
PW 001 SNOW REMOVAL AND SANDING FOR ROADWAYS AND SIDEWALKS October 6, 2014 (#223-14) Original October 19, 2015; October 15, 2018 Public Works
 Original October 19, 2015; October 15, 2018 Public Works") Policy Statement: The Village of Kitscoty will provide snow and ice control on municipal streets and sidewalks according to determined priorities. Purpose: To provide direction and information to employees
Policy Statement: The Village of Kitscoty will provide snow and ice control on municipal streets and sidewalks according to determined priorities. Purpose: To provide direction and information to employees
WHITE PAPER. Winter Tires
 WHITE PAPER Winter Tires WHITE PAPER Introduction According to the Federal Highway Administration accidents caused by winter weather result in 150,000 injuries and 2,000 deaths each year on average. In
A Prototype System to Extract Winter Weather Information for Road Users
 A Prototype System to Extract Winter Weather Information for Road Users George Kochumman College of Engineering University of Iowa Iowa City, IA 52242 Wilfrid Nixon Professor Civil and Environmental Engineering,
ALASKA ITS. Vehicles and Observations in the cloud
 ALASKA ITS Vehicles and Observations in the cloud 1 YOUR PRESENTERS Wilf Nixon, Salt Institute Mark DeVries, Vaisala Dan Schacher, ADOT&PF 2 Today s Agenda A Cloud Based Overview connected and autonomous
CITY OF EAST PEORIA SNOW AND ICE CONTROL PROGRAM INTRODUCTION
 CITY OF EAST PEORIA SNOW AND ICE CONTROL PROGRAM INTRODUCTION The responsibility for providing snow and ice control on East Peoria s 240 lane miles of streets and alleys rests with the Street Divisions
SNOW REMOVAL POLICY ITASCA COUNTY TRANSPORTATION DEPARTMENT
 ITASCA COUNTY TRANSPORTATION DEPARTMENT Effective Date: November 1, 1989 Revised: November 18, 2014 Policy Number: Operations 89-4 Distribution: Commissioner's Office Engineer's Office All Garages Number
Session 6: and Evaluation. M c Farland Management, LLC
 Session 6: Performance Measurement and Evaluation State of the Practice Overview 1 Why Evaluate WRTM Strategies Understand system performance and benefits Specific benefits directly attributable to WRTM
Decision Support Part 1: Tools to aid travel planning
 Decision Support Part 1: Tools to aid travel planning Decision Support: Tools to Aid Travel Planning Decision support systems are so much more than simply saying when to plow and how much chemical to apply.
SNOW AND ICE REMOVAL. Policy i
 Table of Contents SNOW AND ICE REMOVAL Policy 828.1 PURPOSE... 1.2 APPLICABILITY... 1.4 GENERAL POLICIES... 1 4.1 WEATHER MONITORING... 1 4.2 EQUIPMENT PREPARATION... 2 4.3 EMPLOYEE NOTIFICATION AND SHIFTS...
Using Winter Severity Indices for Winter Maintenance Performance Management. TRB Winter Maintenance Committee AHD65
 Using Winter Severity Indices for Winter Maintenance Performance Management TRB Winter Maintenance Committee AHD65 https://sites.google.com/site/trbcommitteeahd65/ Max Perchanok July 29 2015 Winter Maintenance
Weather Responsive Traffic Management. Wyoming DOT Variable Speed Limit (VSL) Project. March 2012
 Project. March 2012") Weather Responsive Traffic Management Wyoming DOT Variable Speed Limit (VSL) Project March 2012 I-80 Background Information >50% of I-80 traffic in Wyoming is commercial vehicles Rural AADT 11,000 vehicles
Weather Responsive Traffic Management Wyoming DOT Variable Speed Limit (VSL) Project March 2012 I-80 Background Information >50% of I-80 traffic in Wyoming is commercial vehicles Rural AADT 11,000 vehicles
Jessica M. Rathke* and Renee A. McPherson Oklahoma Climatological Survey, University of Oklahoma, Norman, Oklahoma 2. DATA. 2.1.
 4A.9 MODELING ROAD PAVEMENT TEMPERATURES WITH SKIN TEMPERATURE OBSERVATIONS FROM THE OKLAHOMA MESONET Jessica M. Rathke* and Renee A. McPherson Oklahoma Climatological Survey, University of Oklahoma, Norman,
Active Traffic & Safety Management System for Interstate 77 in Virginia. Chris McDonald, PE VDOT Southwest Regional Operations Director
 Active Traffic & Safety Management System for Interstate 77 in Virginia Chris McDonald, PE VDOT Southwest Regional Operations Director Interstate 77 at Fancy Gap Mountain Mile markers 0-15 Built in late
Steven Chien Kung-E Cheng New Jersey Institute of Technology. David Bowlby New Jersey Department of Transportation
 Steven Chien Kung-E Cheng New Jersey Institute of Technology David Bowlby New Jersey Department of Transportation The 11th MDSS Stakeholder Meeting Charlotte, NC September 16, 2009 NJ-MDSS Goals Improve
Winter Weather. National Weather Service Buffalo, NY
 Winter Weather National Weather Service Buffalo, NY Average Seasonal Snowfall SNOWFALL = BIG IMPACTS School / government / business closures Airport shutdowns/delays Traffic accidents with injuries/fatalities
John A. Carlson Snow and Ice Removal
 John A. Carlson Snow and Ice Removal A. Introduction 1. The purpose of the Snow and Ice Removal Operation Plan is to provide all personnel who are involved in snow and ice removal a single source document,
National Rural ITS Conference 2006
 National Rural ITS Conference 2006 Design of Automated Variable Speed Limits and Lane Assignments in Rural Areas Presented by: Tom Blaine P. E., POE New Mexico Department of Transportation Intelligent
The Climate of Payne County
 The Climate of Payne County Payne County is part of the Central Great Plains in the west, encompassing some of the best agricultural land in Oklahoma. Payne County is also part of the Crosstimbers in the
Temporary College Closure Due to Inclement Weather or Other Adverse Conditions.
 OTHER TOPICS Index No. X-1 PROCEDURES MEMORANDUM TO: FROM: SUBJECT: MCC Students and Staff Office of the President Temporary College Closure Due to Inclement Weather or Other Adverse Conditions. DATE:
RESOLUTION NO INTRODUCTION
 RESOLUTION NO. 0824 A RESOLUTION TO ESTABLISH THIS CITY S SNOW AND ICE CONTROL POLICY DURING WINTER MONTHS, SPECIFICALLY DEFINED AS NOVEMBER THROUGH MARCH. BE IT RESOLVED BY THE CITY COUNCIL OF SOLON,
Drivers % Winter Maintenance Report 30,517 46, , Statewide Snowfall Average. Truck Stations. Full-time Backup.
 2016-17 Winter Maintenance Report At A Glance 30,517 Snow and Ice Lane Miles 54 Statewide Snowfall Average 150 Truck Stations Total Cost of Winter $ 97 Million 87% Frequency Achieving Bare Lanes 1,779
Comprehensive Winter Maintenance Management System BORRMA-web MDSS inside to increase Road Safety and Traffic Flow
 Thorsten Cypra 1 Comprehensive Winter Maintenance Management System BORRMA-web MDSS inside to increase Road Safety and Traffic Flow American Public Works Association (APWA) Monday, 04/14/2008 3:30 4:30
BOONE COUNTY Snow Removal Program and Policy SECTION 1, INTRODUCTION:
 BOONE COUNTY Snow Removal Program and Policy SECTION 1, INTRODUCTION: The Roads Department of Boone County is responsible for providing snow removal for approximately 1100 miles of county roads. The Roads
Winter weather and municipal winter road maintenance
 Winter weather and municipal winter road maintenance Marie Eriksson 1 and Alf Johansson 2 1 Marie Eriksson, PhD, Klimator AB, Earth Sciences Centre, Box 460, SE-405 30 Göteborg, SWEDEN. E-mail: mariee@gvc.gu.se,
EXAMINATION OF THE SAFETY IMPACTS OF VARYING FOG DENSITIES: A CASE STUDY OF I-77 IN VIRGINIA
 0 0 0 EXAMINATION OF THE SAFETY IMPACTS OF VARYING FOG DENSITIES: A CASE STUDY OF I- IN VIRGINIA Katie McCann Graduate Research Assistant University of Virginia 0 Edgemont Road Charlottesville, VA 0 --
Tahlequah Public Schools Inclement Weather Transportation Plan
 Tahlequah Public Schools Inclement Weather Transportation Plan Inclement Weather with Ice and Snow From time to time throughout the school year, weather may force a change in the District s normal operating
PERFORMANCE MEASUREMENT FOR HIGHWAY WINTER MAINTENANCE OPERATIONS. Lin Qiu. An Abstract. Thesis Supervisor: Professor Wilfrid A.
 PERFORMANCE MEASUREMENT FOR HIGHWAY WINTER MAINTENANCE OPERATIONS by Lin Qiu An Abstract Of a thesis submitted in partial fulfillment of the requirements for the Doctor of Philosophy degree in Civil and
DEVELOPMENT OF A WINTER MAINTENANCE DECISION SUPPORT SYSTEM. Presentation prepared for the:
 DEVELOPMENT OF A WINTER MAINTENANCE DECISION SUPPORT SYSTEM Steve Arsenault, engineer Ministère des Transports du Québec Presentation prepared for the: October 16 session on Management Systems to Support
IOWA COUNTY ORDINANCE NO. 22 IOWA COUNTY SNOW & ICE POLICY
 IOWA COUNTY ORDINANCE NO. 22 IOWA COUNTY SNOW & ICE POLICY AN ORDINANCE REPEALING ESTABLISHING THE POLICY AND LEVEL OF SERVICE IN RESPECT TO CLEARANCE OF SNOW AND ICE AND MAINTENANCE OF IOWA COUNTY S SECONDARY
Director, Operations Services, Met-Ed
 Director, Operations Services, Met-Ed Pennsylvania House Republican Policy Committee Hearing on Storm Response Tobyhanna Township Municipal Building Pocono Pines, Pa. August 9, 2018 Planning and Forecast
The Climate of Marshall County
 The Climate of Marshall County Marshall County is part of the Crosstimbers. This region is a transition region from the Central Great Plains to the more irregular terrain of southeastern Oklahoma. Average
Updating the Urban Boundary and Functional Classification of New Jersey Roadways using 2010 Census data
 Updating the Urban Boundary and Functional Classification of New Jersey Roadways using 2010 Census data By: Glenn Locke, GISP, PMP 1 GIS-T May, 2013 Presentation Overview Purpose of Project Methodology
H IG HWAY WINTER OPERATIONS SNOW REMOVAL AND ICE CONTROL POLICY. Revised January 4, 2016
 ! H IG HWAY WINTER OPERATIONS SNOW REMOVAL AND ICE CONTROL POLICY Adopted January 11, 2010 Revised January 4, 2016 Pol icy It is the goal and intent of the Town of Sullivan to provide timely, efficient
W. Douglas Wewer 1,2 *, Michael J. Jenkins 1
 A PRACTITIONER S PERSPECTIVE: PROVIDING TIMELY AND RELEVANT MOUNTAIN WEATHER INFORMATION TO AVALANCHE WORKERS AT SNOWBASIN, A SUN VALLEY RESORT AND THE FOREST SERVICE UTAH AVALANCHE CENTER W. Douglas Wewer
SNOW CONTROL OPERATIONS 2017 PUBLIC SERVICES DEPARTMENT MAINTENANCE DIVISION
 SNOW CONTROL OPERATIONS 2017 PUBLIC SERVICES DEPARTMENT MAINTENANCE DIVISION 1 SNOW CONTROL OPERATIONS The following are the standard operating procedures f snow removal operations. 1. Plowing operations
DEVELOPMENT OF TRAFFIC ACCIDENT ANALYSIS SYSTEM USING GIS
 DEVELOPMENT OF TRAFFIC ACCIDENT ANALYSIS SYSTEM USING GIS Masayuki HIRASAWA Researcher Traffic Engineering Division Civil Engineering Research Institute of Hokkaido 1-3 Hiragishi, Toyohira-ku, Sapporo,
National Winter Maintenance Peer Exchange Vancouver, Washington September 10 th & 11 th, 2013 Steve Spoor Maintenance Services Manager
 National Winter Maintenance Peer Exchange Vancouver, Washington September 10 th & 11 th, 2013 Steve Spoor Maintenance Services Manager Idaho Transportation Department Strategic Plan Goals o Commit to Providing
The Climate of Texas County
 The Climate of Texas County Texas County is part of the Western High Plains in the north and west and the Southwestern Tablelands in the east. The Western High Plains are characterized by abundant cropland
Snow and Ice Removal
 Policy # 6.6 Procedure # - Replaces 5.10 & 5.10A Revises - Date Approved February 10, 2014 Method of Approval Resolution #17 1. PRINCIPLES The City of Dauphin desires to maintain the City streets, lanes,
U.S. - Canadian Border Traffic Prediction
 Western Washington University Western CEDAR WWU Honors Program Senior Projects WWU Graduate and Undergraduate Scholarship 12-14-2017 U.S. - Canadian Border Traffic Prediction Colin Middleton Western Washington
Western States Rural Transportation Consortium Meeting. June 14, 2011
 Western States Rural Transportation Consortium Meeting June 14, 2011 1 Overview/Agenda Welcome / Introductions / Recent ITS Activities General Status of the WSRTC Clarus One Stop Shop Update Year 1 Incubator
BAD WEATHER DOESN T CAUSE ACCIDENTS
 March 15, 1997 It is with mixed feelings of humor and dismay that persons in the field of traffic safety read frequent headlines in the newspapers--even the largest dailies--blaming the weather for automobile
Traffic Control Weather Policy
 Traffic Control Policy can plan a huge factor in our ability to set up, maintain and remove a closure safely. There are many weather factors that require consideration when traffic control is to be in
HAZARD DESCRIPTION... 1 LOCATION... 1 EXTENT... 1 HISTORICAL OCCURRENCES...
 WINTER STORM HAZARD DESCRIPTION... 1 LOCATION... 1 EXTENT... 1 HISTORICAL OCCURRENCES... 3 SIGNIFICANT PAST EVENTS... 4 PROBABILITY OF FUTURE EVENTS... 5 VULNERABILITY AND IMPACT... 5 Hazard Description
School for Highway Superintendents Real-Time Local Weather Information
 School for Highway Superintendents Real-Time Local Weather Information Mark W. Wysocki Senior Lecturer in Meteorology Cornell University New York State Climatologist Keith Eggleston and Kathy Veerland
Evaluation of NDDOT Fixed Automated Spray Technology (FAST) Systems November 24, 2009
 Systems November 24, 2009") Evaluation of NDDOT Fixed Automated Spray Technology (FAST) Systems November 4, 009 Shawn Birst, PE Program Director, ATAC Associate Research Fellow Upper Great Plains Transportation Institute North Dakota
Evaluation of NDDOT Fixed Automated Spray Technology (FAST) Systems November 4, 009 Shawn Birst, PE Program Director, ATAC Associate Research Fellow Upper Great Plains Transportation Institute North Dakota
Weather and Travel Time Decision Support
 Weather and Travel Time Decision Support Gerry Wiener, Amanda Anderson, Seth Linden, Bill Petzke, Padhrig McCarthy, James Cowie, Thomas Brummet, Gabriel Guevara, Brenda Boyce, John Williams, Weiyan Chen
1. Major streets, Central Business District (CBD) and school bus routes. 2. Local streets 3. Downtown parking lots
 and school bus routes. 2. Local streets 3. Downtown parking lots") City of Mt. Pleasant Administrative Memo #1-85 Issued: January 1, 1985 SUBJECT: Snow and Ice Control Policy SUMMARY: The intent of this policy is to construct a basic guideline to effectively and efficiently
City of Mt. Pleasant Administrative Memo #1-85 Issued: January 1, 1985 SUBJECT: Snow and Ice Control Policy SUMMARY: The intent of this policy is to construct a basic guideline to effectively and efficiently
The Climate of Murray County
 The Climate of Murray County Murray County is part of the Crosstimbers. This region is a transition between prairies and the mountains of southeastern Oklahoma. Average annual precipitation ranges from
City of Laramie, Wyoming SNOW AND ICE POLICY
 City of Laramie, Wyoming SNOW AND ICE POLICY 11/02/89; rev 10/15/2007 I. INTRODUCTION The intention of this Policy is to set reasonable goals and general practices as a guide for the conduct of snow and