MOOSE-VEHICLE ACCIDENTS ON ALASKA'S RURAL HIGHWAYS NOTICE TO USERS
|
|
|
- Joseph Farmer
- 5 years ago
- Views:
Transcription

1
2
3 MOOSE-VEHICLE ACCIDENTS ON ALASKA'S RURAL HIGHWAYS NOTICE TO USERS This is a research document produced by the Central Region of the Alaska Department of Transportation and Public Facilities. Persons who may rely on information contained in this document should check with the Department of Transportation for the most current information. Please contact Mr. Dennis Morford, P.E., Traffic Engineer, at
4 MOOSE-VEHICLE ACCIDENTS ON ALASKA'S RURAL HIGHWAYS TABLE OF CONTENTS Executive Summary 1 I. Purpose and Objectives of Study 3 II. The Problem Setting 3 A. General Trends 3 B. Moose Behavior 3 C. Driver Behavior 5 D. The Problem & Perspective 5 III. Prioritizing Alaska s Rural Highway Segments 10 A. Data Search and Route Selection 10 B. Collision Rating, Method A: By Accident Concentrations 10 C. Collision Rating, Method B: Adjusting for Traffic Volumes 12 D. Top Ranking Moose-Vehicle Collision Segments 14 IV. Analysis of the Results 17 A. Quality of Results 17 B. Accident Characteristics 18 V. Mitigation History 29 A. Research 29 B. Direct Mitigation Projects 31 C. Indirect Mitigation Projects 33 VI. Potential Solutions 34 A. Range of Solutions 34 B. General Recommendations 53
5 MOOSE-VEHICLE ACCIDENTS ON ALASKA'S RURAL HIGHWAYS LIST OF TABLES Table 1 A Sample of Wildlife Vehicle Conflicts 9 Table 2 Table 3 Table 4 Rural Alaska Highways Sampled for Moose-Vehicle, Daytime, and Nighttime Accident Rates 11 Alaska s Rural Highway Segments with the Highest Moose-Vehicle Collision Rates (Five Year Concentrations ) 16 Alaska s Rural Highway Segments with the Highest Moose-Vehicle Collision Rates (Five Year Concentrations ) Sorted by Route Name 19 Table 5 Potential Moose-Vehicle Accident Solutions 35 LIST OF FIGURES Figure 1 Major towns and cities in Alaska 4 Figure 2 Moose Crossing the Roadway 6,7 Figure 3 Figure 4 Figure 5 Figure 6 Figure 7 Frequency Distribution of Moose-Vehicle Accident Concentrations Along Rural Alaska Highways ( ) 13 Frequency Distribution of Moose-Vehicle Accident Rates Along Rural Alaska Highways ( ) 15 Location Map for Alaska s Top Ranked Moose-Vehicle Collision Segments on Rural Highways 20 Alaska s Top Ranked Moose-Vehicle Collision Segments Located on the Kenai Peninsula21 Alaska s Top Ranked Moose-Vehicle Collision Segments Located in the Upper Cook Inlet22 Figure 8 Alaska s Top Ranked Moose-Vehicle Collision Segments Located in the Fairbanks Area 23 Figure 9 Figure 10 Figure 11 Initial Record of Roadway Light Conditions for Moose-Vehicle Accidents on Alaska s Rural Highways ( ) 24 Adjusted Record of Roadway Light Conditions for Moose-Vehicle Accidents on Alaska s Rural Highways ( ) 24 Monthly/Yearly Distribution of Moose-Vehicle Accidents on Alaska s Rural Highways ( ) 26 Figure 12 Distribution of Daylight Hours in Alaska 27 Figure 13 Hourly Distribution of Moose-Vehicle Accidents on Alaska s Rural Highways ( ) 28 Figure 14 Results of a Typical Moose-Vehicle Collision 30
6 MOOSE-VEHICLE ACCIDENTS ON ALASKA'S RURAL HIGHWAYS Figure 15 Location Map: Mitigation History and Other Projects Affecting Moose-Vehicle Collisions 32 Figure 16 Public Awareness Program: Give Moose A Brake Signing 37 Figure 17 Potential Combination Signing Layout 38 Figure 18 State of Alaska Moose Warning Signs 39 Figure 19 Swareflex Deer Reflectors 43 Figure 20 Delineator Backdrop 45 Figure 21 High Frequency Deer Warning Devices 46 Figure 22 Glenn Highway Moose Fencing Details 48 Figure 23 Glenn Highway: Ship Creek Moose Pathway and Undercrossing 49 Figure 24 Typical Cattle Guard (Montana) 50 Figure 25 Glenn Highway: Muldoon Road to Artillery Road, Before and After Construction of Illumination, Fencing, and Widening in List of Appendices Appendix A Appendix B Sliding Spot Analysis Charts Using Collision Rating Method A: By Accident Concentrations Sliding Spot Analysis Charts Using Collision Rating Method B: Adjusting for Traffic Volumes
7 MOOSE-VEHICLE ACCIDENTS ON ALASKA'S RURAL HIGHWAYS Executive Summary Moose-vehicle accidents are an issue of public safety and public resource. They result in considerable damage to vehicles and sometimes injury to the motorist. The impacting animal can be as large as 1200 pounds. Public and media attention to these types of accidents has been increasing since the early 1980 s along with the growth of Alaska s population. In response, the State of Alaska has focused on a few of the worst locations in the state. Recent mitigation projects have included fencing, highway lighting, right-of-way clearing, and public awareness programs. As the Department of Transportation and Public Facilities (DOT/PF) prepares future highway construction projects, choosing where and how to mitigate moose-vehicle accidents becomes increasingly difficult. The public, DOT/PF, the Alaska Department of Fish and Game (ADF&G), and other agencies, each have experience with this problem. To date, there has not been an areawide examination of the moose-vehicle accident problem. Without a broader perspective, it has been difficult for all parties involved to agree on the extent of the problem and the level of solution needed. This report reviews moose-vehicle accidents on rural two-lane highways throughout the State of Alaska. At around 500 collisions per year, the State of Alaska has the highest number of moose-vehicle collisions on its highways of anywhere in North America. On rural roadways, these collisions represent over twenty percent of all motor vehicle accidents. This amount can double during winters of heavy snowfall. The Department of Fish and Game estimates this number may be as much as fifteen percent higher due to unreported accidents. When rated against vehicular miles of travel, Alaska has the highest rate of moose-vehicle collisions in the world. This report compiles historical data to determine Alaska s highest accident locations for moose-vehicle collisions. Many of these segments are well known by local residents and state agencies. Some of these roadways are posted with moose warning signs. Solutions beyond signing require significant construction and maintenance expenditures. Future mitigation efforts need to target problem areas. Costs of efforts will be a factor at each site. This report provides a list of old and new solutions, gathered together for the consideration of planners, designers, and managers. Several distinct characteristics of moose-vehicle accidents on Alaska s rural highways were identified in this report. These include: 1. Most accidents occur on rural highways surrounding major cities and towns, primarily near Anchorage, Palmer, Wasilla, Soldotna, Kenai, Fairbanks, and North Pole. The highest accident segments include: Kenai Spur Road - Soldotna to Kenai Kalifornsky Beach Road - Soldotna to Cannery Road Sterling Highway - Soldotna to Milepost 86 (West of Sterling) Sterling Highway - Milepost 100 to Milepost 106 (South of Soldotna) Glenn Highway - Matanuska River to Parks Highway Junction Knik-Goose Bay Road - Wasilla to Parch Road Sterling Highway - Milepost 70 to Milepost 72 (Between both Skilak Lake Junctions) Parks Highway - Houston to Milepost 61 (3.5 miles North of Houston) Sterling Highway - North Johnson Lake Loop Road to Noble Street (At South Junction of Kalifornsky Beach Road) 2. Most accidents occur in lowland marshes and tundra at elevations at or below 200 feet above sea level. The exception is the Fairbanks area. There, the low lying drainages are typically at about 400 feet above sea level. 1
8 MOOSE-VEHICLE ACCIDENTS ON ALASKA'S RURAL HIGHWAYS 3. Most accidents occur at distinct locations which connect drainages and represent migration corridors and prime habitat areas. 4. The top five percent of the highest moose-vehicle accident segments amount to twenty-three miles of state roadways, or one-half of one percent of the state highway system. These segments contain over fifteen percent of all moose-vehicle accidents statewide. These twenty-three miles contain one-quarter of the moose-vehicle accidents sampled by this report. 5. The top twenty-five percent of the highest moose-vehicle accident segments amount to ninety-one miles of state roadways, or one and one-half percent of the state highway system. These segments contain twenty-seven percent of all moose-vehicle accidents statewide. These ninetyone miles contain nearly half of the moose-vehicle accidents sampled by this report. 6. There are typically few accidents in April and May, the safest months on the highway in terms of moose-vehicle accidents. 7. Accidents peak in December and January to approximately twice that of any other time of year. With nearly three-quarters of all accidents occurring during hours of darkness, there is a strong indication that visibility is a key factor in moose-vehicle accidents. Monthly and hourly distributions correlate with light conditions. 8. Most accidents occur at dawn and dusk. They peak in the evening from 5:00 PM to 12:00 AM. A smaller peak occurs from 6:00 AM to 9:00 AM. These hours correlate with the most active times of movement for both moose and people. Moose are on the move as they feed, and people are typically commuting to and from work, shopping, and recreational areas. 9. A smaller peak occurs from June to August, when hours of darkness are minimal. This may be related to the twofold increase in traffic volumes on many of the rural roads each summer. 10. Along with the cluster of locations along commuter routes connecting to cities, the hourly and monthly trend suggests the motorist involved in the accident is typically a local resident and likely familiar with the roadway. A commuting driver would have greater odds of a moose encounter than the occasional or mid-day motorist. During the winter, traffic volumes are commonly at their lowest. Tourism and recreation volumes are at a low point, while the majority of traffic is local. 11. By inspection, many of the top locations were characterized by steeper fill slopes with overgrown vegetation on the roadsides during the study period. These factors may result in moose clamoring up the slope and an overall lack of visibility of the moose until they get onto the road surface. 12. Some of the roads ranking high in moose-vehicle collisions also experience high daytime and nighttime accident rates. Some mitigation measures, such as clearing and lighting, could benefit these other accident types as well. These locations include Kalifornsky Beach Road, the Sterling Highway from Soldotna to Sterling, and the Parks Highway from the Glenn Highway to Wasilla. 2
9 MOOSE-VEHICLE ACCIDENTS ON ALASKA'S RURAL HIGHWAYS I. PURPOSE AND OBJECTIVES OF STUDY The purpose of this investigation is to provide a tool for planning and applying future moose-vehicle accident mitigation methods in Alaska. This report does not attempt to solve the moose-vehicle accident problem either as a whole or on a site-by-site basis. Instead, it provides a comprehensive overview. It furthers knowledge about the scope of the problem, and it gathers together what little information is known about solutions. From this information, managers of both wildlife and highways can better choose, develop, and test solutions at specific locations. Participants in the 27th North American Moose Conference, hosted in 1991 at Anchorage, Alaska by ADF&G, outlined several needs in regards to moose mortality (44). Ideas included an assessment of the economic impacts of moose-vehicle collisions, increasing overall accident research, and development of solutions. Mitigation on future highway projects was identified as a primary goal. The objectives of this investigation are to evaluate the extent of moose-vehicle accidents on rural highways within the State of Alaska. It will identify high accident locations and present potential solutions to reduce the occurrence of these collisions. The project study area includes all major rural highways within the State of Alaska. II. THE PROBLEM SETTING.A. General Trends Alaska s population has been increasing rapidly ever since statehood in It parallels the development of the Swanson River oil fields on the Kenai Peninsula in the late 1950 s, and the well known Prudhoe Bay fields to the north in the late 1960 s. While tourism and raw resource industries are important to the state economy, it is during this time of oil development that Alaska has seen the most growth. Major population centers such as Anchorage, Fairbanks, and Kenai have overflowed and have begun to merge with outlying towns such as Eagle River, Palmer, Wasilla, North Pole, and Soldotna (See Figure 1). Growth has meant over 10 percent average annual increases in the number of vehicles on some existing highways. These cities contain over half the state s population, and it is near these population centers where there are the most conflicts with neighboring moose populations. Several new highways have been added to better connect major cities. The Glenn Highway was built across the Palmer Hay Flats between Anchorage and the Matanuska-Susitna Valley. The Parks Highway was constructed to connect a second route between Anchorage and Fairbanks. Portions of many other roads, such as the Alaska Highway and Sterling Highway, have been widened and realigned to accommodate higher speeds and more efficient flow of commercial, local, and recreational traffic. All of these routes pass through many miles of prime lowland moose habitat. B. Moose Behavior Moose movement ranges from daily travel within seasonal ranges, migration between ranges, to dispersal to new ranges. Patterns vary. Some animals seasonally migrate and others remain resident year round. Some migrate between high-elevation summer ranges to low-level winter ranges. Others may spend the summer at low elevations, move to high elevations during fall and early winter, and return to lower elevations during mid to late winter. This is what occurs on the Glenn Highway near Anchorage. Moose also travel along major drainages which parallel and intersect the highways. In some cases, migratory corridors can be identified, such as adjacent to Ship Creek and the Glenn Highway near Anchorage. In other cases, no concentrated area of movement can be described (68,69,70) 3
10
11 MOOSE-VEHICLE ACCIDENTS ON ALASKA'S RURAL HIGHWAYS Moose may move any time during the day or night, but most movement occurs near dawn and dusk. Moose frequently bed down during the day for thermoregulation and energy conservation, particularly during the summer and winter. Activity increases during spring because animals are more actively searching for food after a winter of negative energy balance. During winters of heavy snowfall, deep snow bogs down moose and exhausts them. This makes roads, trails, and railways attractive to moose, because they offer cleared pathways which make walking easier for moose. It is in these shared travel corridors that humans are most likely to encounter moose. Most Alaskan drivers fear the moment when an unseen moose will leap from the ditch into their headlights. Their dark brown hide makes them difficult to see at night against a wooded backdrop. They may proceed to cross without stopping for anything. Often a cow moose is leading the way, and a calf may soon follow. The calf is hurrying to stay with its mother. Other moose have been observed standing and wandering along the roadsides, watching cars approach and pass, and then cross the road. Moose have been observed to remain on railroad tracks even when in the path of an oncoming, whistling train. Unable to outrun oncoming trains, and resistant to stepping into the deep snowbanks, some moose tragically turn and charge, with fatal results. Cow moose are fiercely protective of their calves. When they sense danger, they may raise up their hackles and even charge, stomp, or bluff in defense. Or they may whirl around and fling their sharp front hooves toward the object of their distress with a deadly force. C. Driver Behavior Alaska s rural highways serve many purposes. The typical driver may be a commuter, recreational traveler, or a courier delivering commercial goods. There is typically a long distance between destinations such as cities, ports, and recreation areas. This can affect the performance of many drivers. Some drivers may be sightseeing and traveling at or below the speed limit. For some drivers, the focus becomes the road - staying on course and arriving at their destination in accordance with a planned schedule or goal. A driver may not plan much slack time in their trip. They may be traveling at or above the speed limit, staring straight ahead with tunnel vision, unaware of what lies very far from the edge of pavement or the horizon ahead. Many local residents often discuss the need to watch the roadway, looking from side to side, always aware. People often do not notice a moose in the ditch until they have just passed it. D. The Problem and Perspective 1. A Worldwide Comparison Alaska averages about 500 moose-vehicle accidents per year on its roadways. During severe winters the average number of collisions can double. The Department of Fish and Game estimates the actual number of moose-vehicle accidents may be as much as fifteen percent higher due to unreported accidents. For Alaska's rural roadways, these collisions amount to over twenty percent of all accident types. It is the largest single category when compared with other accident types such as run-off-the-road or multiple vehicle accidents. This is significant evidence there is a problem. Alaska's moose-vehicle accidents also can be put into perspective by comparing them with similar problems around the world. In Alaska, there are the highest number of recorded moose-vehicle accidents of anywhere in North America. However, Sweden records the highest number of moose-vehicle accidents in the world. 5

12 PICTURE DELETED

13
14 MOOSE-VEHICLE ACCIDENTS ON ALASKA'S RURAL HIGHWAYS Next to Alaska are British Columbia, Newfoundland, Alberta, and Quebec in Canada. Each of these provinces record a little over half the number of accidents found in Alaska. The states of Maine, Idaho, Michigan, and Utah each record less than one-fifth the accidents found in Alaska. How Alaska fares depends on how the numbers are compared. Table 1 shows a comparison of moose and deer collisions between Alaska and other locations. In terms of numbers, Swedish motorists kill ten times the number of moose than are killed in Alaska. A resident of Pennsylvania would be much more concerned about the number of deer collisions than moose collisions. Nearly 50,000 deer were struck on Pennsylvania roads in 1992 (51). Geographic changes mean changes in the type of wildlife impacted and changes in people's value for each type of wildlife. In Great Britain, residents are concerned enough about mass frog migration and frog kills that they consider it a serious problem for wildlife and a safety hazard for motorists. They even go so far as to carry the frogs across highways (81). In Michigan, frog tunnels have been built under the highway to allow migration. In Florida, residents worry about bear crossings along some highways. In Australia, a major wildlife problem is kangaroos drinking from potholes in the road (92). Residents of other states and countries could argue that sheer numbers demonstrate their problem is more significant than Alaska's. The Alaskan concern for moose-vehicle accidents becomes better justified when considering the rate of animal collisions to the amount of vehicle miles traveled by motorists. Sweden is one-fifth the size of Alaska and yet has ten times the road miles and eight times the population. In terms of accidents per 100 million vehicle miles, Alaskans are running into moose and damaging vehicles at about the same rate as Swedish motorists. Alaska has the highest known moose-vehicle accident rate in the world. This rate is likely to increase as the State of Alaska continues to grow in population and vehicles. While Alaska's moose-vehicle accident rate is less than the rate of deer-vehicle accidents in other states, the size of the animals is also greatly different. At three to six times the size and weight of a deer, moose are one of the largest animals to be frequently struck on highways. 2. The Odds It is possible to estimate the odds of a moose-vehicle accident on the segments of highways studied by this report. Several high moose-vehicle accident segments have average daily traffic volumes of around 8,000 vehicles per day and record about fifteen to twenty moose kills per year. These segments are commuter routes which are typically eight miles or less in length. About one-third of all moose-vehicle accidents can be shown to occur during commuter hours. By using six moose-vehicle accidents per segment per year, and dividing by 8,000 vehicles at two trips per day, the odds are computed to be one in 650 of a commuter being involved in a moosevehicle accident. This perspective assumes a motorist driving two trips per day on the full length of this same highway segment, all year. Actual working days only add up to approximately sixty percent of the year. Thus, the odds are more likely around 1:1000 for the daily commuter along some of Alaska's worst highway segments. Only one-half of one percent of Alaska's moose-vehicle accidents result in a motorist fatality. Given this, the commuter mentioned above faces a one in 200,000 chance of striking a moose and being killed. In terms of injury, the same commuter faces odds of one in 5,000. Motorists on other routes face far smaller chances of a moose-vehicle accident. Another way to view moose-vehicle accidents is to compare the likelihood of that type of accident with other familiar incidents in Alaska. Annually, there are sixteen times as many vehicle collisions with moose than with railroad trains. The commuter mentioned above is equally as likely to be involved in an alcohol related traffic accident as a moose-vehicle accident. They are five times more likely to have their car stolen than hit a moose (103). They are 1000 times more likely to die from some other cause, including cancer, drowning, other car accidents, homicide, etc., than from a moose accident. The commuter is sixteen times more likely to die as a victim of a homicide than from a collision with a moose (102). These rough comparisons are based on statewide statistics. Alaska's geography, culture, and population distribution are diverse enough that the odds will vary depending on the area of the state. 8

15
16 MOOSE-VEHICLE ACCIDENTS ON ALASKA'S RURAL HIGHWAYS III. PRIORITIZING ALASKA'S RURAL HIGHWAY SEGMENTS A. Data Search and Route Selection The first step in studying moose-vehicle accidents in Alaska is to select rural highways for analysis. Currently, Alaska accident statistics are compiled annually by geographic regions and overall state totals (1). Engineers and biologists involved in the design and maintenance of highway and game resources are interested in using these statistics to compare highways against each other for wildlife conflicts. In this way, problem spots are more easily ranked. For this report, desktop computer database programs had to be employed in order to make it possible to compare specific accident occurrences between highways. Routes selected for analysis are presented in Table 2. A five year analysis period was selected from 1988 to A recurring five year study cycle was recommended by the Department of Fish and Game (43). Winter severities can cause variations in moose population and location. Thus, one or two year studies can be inconclusive. The winter of was regarded as a severe winter in Alaska, resulting in higher than average moose-vehicle accident rates. Moose were forced to make early changes in their migration patterns in search of food. For safety analyses, the Department of Transportation usually works with three years of data. The five year period used in this report is intended to average out for severe winters and seasonal variations which affect moose mortality statistics. From Table 2, it can be seen these rural routes represent 1655 miles of roadway, or thirty percent of the 5500 miles of major routes in the state. Despite this low percentage, these roads represent nearly all of Alaska s major rural roadways. The roads selected network the state s most populated communities (Figure 1). Urban roadways, local government roads, and low-volume recreational roads make up the remainder of the total miles statewide and were not included in this list. Most urban roadways are already well-developed and lighted, leaving little room for additional mitigation measures. Traffic speeds are also lower on urban roads. Motorists have more reaction time and single vehicle accidents are less severe. On low-volume and local roads accident rates are difficult to analyze because of the low traffic numbers. There are little or no recorded accidents per mile. Roadways were sampled in Southeast Alaska but were found to have little or no animal -vehicle accidents. While Southeast Alaska has a significant deer population, there are few moose and seems to be no apparent animal accident problem. It should be noted that collisions with caribou and bison on Alaska s rural highways also occur. It was assumed moose and other animal accidents are the same basic type of occurrence, affecting motorist perception/reaction time in much the same way as for moose. These type of animal accidents were combined with the moose-vehicle collision data analyzed in this report. Currently, all police agencies code accidents on a standardized statewide report form. This form does not distinguish caribou from other animals; they are simply reported as animal accidents. Moose-vehicle collisions are specifically recorded as moose accidents. At ninety-five percent, moose represent nearly all of the wildlife accidents in the state s reporting system. B. Collision Rating Method A: By Accident Concentrations Two methods were used to evaluate accident rates on the sampled roadways. The first check was a look at simple accident concentrations. The Department of Transportation logs distance along routes using milepoints as part of a computer database known as the Consolidated Data System, or more commonly referred to as the CDS Route Log (2). These CDS Route milepoints are a separate log from the physical milepost marker signs posted along the highway. Milepost markers are of historical value and also serve to locate postal addresses along the highway. In some later tables of this report, these markers are referenced as landmarks. 10
17
18 MOOSE-VEHICLE ACCIDENTS ON ALASKA'S RURAL HIGHWAYS For the five year period from January 1988 to December 1992, a sliding spot analysis was performed. Beginning at milepoint 0.0, a computer search was performed, moving forward along each roadway. Each time a moose-vehicle collision was found logged to a certain milepoint, a formula was employed to look backwards along the route for a distance of one mile and then sum the total number of occurrences found in the previous mile. This sum represented the number of moose accidents over preceding mile. It provides a method for observing how the number of collisions accumulates or declines over the highway. While the accident database records accidents to the nearest one-hundredth of a mile, it was not relied on to that level of accuracy. Many moose-vehicle accidents are only coded to the nearest milepost marker. Because of this milepost anomalies can occur. For this reason the basic segment used in this analysis is no smaller than one mile. An alternative method would have been to break down roadways into even one mile segments, rather than using a sliding spot analysis. This method of analysis was ruled out because accidents would not appear as significant. Consider an example between milepoints 9 and 11. If the only accidents were eight accidents found between milepoints 9.5 and 10, and another eight were found between milepoints 10 and 10.5, each even mile segment (i.e. 9-10, 10-11) would show a concentration of eight per mile. This could potentially lower the ranking of these highway segments by splitting the rating between the one mile segments. By using the sliding spot analysis, the resulting concentration would more realistically be computed as 16 accidents per mile between milepoints 9.5 and This higher number truly shows the accident concentration over a one mile segment. In turn, this may push this location much higher on the final ranking against other segments. Figure 3 shows the frequency distribution resulting from applying Rating Method A to the sampled highways and obtaining cumulative accident ratings whenever a moose accident was encountered along the highway. The mean rating of the sliding spot concentrations was found to be five accidents per mile, or the equivalent of about one per year over five years. The top five percent of rural roadways with moose-vehicle accidents show a rating of fifteen per mile, the top ten percent - twelve per mile, and the top twenty-five percent - about eight moose-vehicle accidents per mile. Later in this report, these percentile ratings were used to select a manageable number of roadway miles for potential moose accident mitigation in Alaska. Appendix A contains the charted results of the sliding spot analysis for each highway using Rating Method A. C. Rating Method B: Adjusting for Traffic Volumes Straight accident concentrations from Rating Method A are useful for showing where moose-vehicle collisions occur most often. However, a true accident analysis must also examine the question of whether the number of accidents is really significant when compared against the volume of traffic on the roadway. For example, a roadway with an Annual Average Daily Traffic (ADT) volume of 2000 vehicles per day (vpd), experiencing fifteen moose-vehicle accidents per mile, per five years, is equivalent to an accident rate of: (15 accid/mile) (1,000,000) = 4.11 accid per Million Vehicle Miles (MVM) (365 days/yr)(5 yrs)(2000 veh/day) Another roadway may have an Average Daily Traffic volume of 10,000 vpd with twice the number of accidents over five years, which is a rate of: (30 accid/mile) (1,000,000) = 1.64 accid per MVM (365 days/yr)(5 yrs)(10,000 veh/day) 12
19
20 MOOSE-VEHICLE ACCIDENTS ON ALASKA'S RURAL HIGHWAYS Clearly, this calculation shows the lower volume roadway has a relatively higher accident rate when compared against the higher volume roadway. Using this reasoning, Rating Method B was also applied to the sample of rural roadways. Straight accident concentrations from Rating Method A, were adjusted by using 1990 traffic volumes published by the Department of Transportation (21). These volumes represent the mid-life of the analysis period and are considered to be the average over the five years. It was found that for ADT s less than 2000 vpd, the accident rate begins to rise or skew dramatically. For a roadway with an ADT of 400 vpd and only one moose accident per mile, the resulting accident rate would be 1.37 accidents per MVM. This rate is nearly that of the high volume highway with thirty accidents per mile. Yet with only one accident in a mile per five years, it is simply too difficult to predict this is a significant location, or how certain another accident will occur on this segment in the next five years. For this reason, a cutoff of 2000 vehicles per day was chosen. Below this volume, accident rates by Rating Method B are considered to be inaccurate and not usable in prioritizing highway segments. Roadways with an ADT less than 2000 are considered to be low-volume roads. For these roads, it is commonly difficult to compute accident rates (66). Low volume roads were rated using Collision Rating Method A. Only roadway segments with ADT s greater than 2000 vpd were used in computing the results of Figure 4. Figure 4 shows that when moose-vehicle accidents occur (for roadways with ADT's greater than 2000 vpd), the average moose-vehicle accident rate is 0.7 accidents per MVM. The top twenty-five percent of roadway segments experience a rate greater than or equal to 1.0 accidents per MVM. The top five percent of all segments experience a rate greater than or equal to 1.5 accidents per MVM. D. Top Ranking Moose-Vehicle Collision Segments Both Rating Methods A and B were used to rank rural highway segments. Highways which rank high by either method need to be kept at the top of a ranking list. If Rating Method B were not used, then some of Alaska s lower volume roadways would drop to the bottom of the list and be ignored. This is because the number of collisions are lower. Rating Method B is important because it identifies segments where the number of collisions is significant for the amount of traffic on the roadway. An example would be the Parks Highway north of Houston. It is well known for moose-vehicle accidents. A high number of accidents occurred along this highway, especially during a severe winter in This highway has ranked high by Rating Method B. The frequency of accidents has been significant given the lower traffic volumes than most of the highways sampled. This location would not be considered significant by Rating Method A due to a lower total number of collisions. Using Rating Method A (accident concentrations) is important also. Some high volume routes experience higher numbers of moose-vehicle collisions which usually receive alot of public attention. Yet, because of high traffic volumes, these routes would not be on the ranking list using Rating Method B alone. The only major mitigation project in Alaska - the Glenn Highway from Anchorage to Eagle River - would rank below the statewide rural average by Rating Method B, but would have qualified as the top route in the state (1982 to 1986) by Rating Method A. Using both rating methods produced the ranking list of Alaska s rural highway segments presented in Table 3. Segments were ranked based on the longest possible combination of continuous accident zones. For example, the top location, Kenai Spur road, ranked in the top twenty-five percent by Rating Method A over a total distance of 8.40 miles. Table 3 shows what portion of this zone qualified for the top five and twenty-five percent by both rating methods. Each segment was sorted first by summing the length of the route qualifying in the top five percentile using Rating Methods A and B. A second sort was performed based on the length of each route qualifying in the top twenty-five percent using both methods. 14
21

22
23 MOOSE-VEHICLE ACCIDENTS ON ALASKA'S RURAL HIGHWAYS Sorting thresholds were chosen to produce a manageable mileage of state roadways for ranking and potential mitigation planning. The top twenty-five percentile was used as a lower threshold. As evidenced in Table 3, approximately ninety miles (or only 1.6% out of 5500 statewide) have been identified to show a rate of eight or more moose-vehicle collisions or more in five years (0.95 accidents/mvm). In other words, thirty-six highway segments were identified in the top twenty-five percent of those showing occurrences of moose-vehicle accidents. The top five percentile was used as an upper threshold. This produces a more focused list for potential mitigation planning. This amounts to seven segments of approximately twenty-three miles total (or less than one-half of a percent of the 5500 miles statewide) rated at fifteen or more moose-vehicle collisions in five years (1.52 accidents/mvm). The typical traffic volume on these segments is around vehicles per day. The longer rural highway links, such as the outer portions of the Parks Highway or Alaska Highway, cover long distances encountering little or no population centers. Most of the more remote highway segments did not make the list. One reason is due to the low traffic volumes on these segments, ruling out a definitive result from Rating Method B. Accident concentrations occur at a rate of zero to one per mile and are spread too far over the highway to use as a basis for locating migration corridors or for clearly identifying areas to target mitigation strategies. Other rural highway segments, such as the Seward Highway or Glenn Highway, have high enough traffic volumes to apply Rating Method B. However, on most of the length of these highways, the frequency of moose accidents is at or below average because they are not located near prime moose habitat. Instead, much of these highways exist through and beside mountainous areas of the State, rather than lowlands. IV. ANALYSIS OF THE RESULTS A. Quality of the Results The quality of the data sample from the roadways selected can be verified from Table 2. Approximately 2600 moose-vehicle accidents have been recorded over a five year period from 1988 to 1992 on rural and urban state highways. Of these, 1500, or sixty percent, were investigated by this report. It is clear that moose-vehicle accidents typically occur on the rural highways selected. Another 200 moose accidents are located on the low volume and local roadways excluded from this report. Much of the 900 remaining moose accidents occurred either in urban areas (not studied in this report), or at unknown milepoints on the rural highways. The Department of Fish and Game keeps varying record systems of regional moose roadkills. These include hit and run occurrences. Their records indicate possibly fifteen percent higher total of verifiable accidents than the Department of Transportation s data recorded from police/state trooper accident records (57). The records used by Department of Transportation do not include the additional Fish and Game statistics or unreported/unknown accidents, but are the single, most complete database available. The top thirty-six locations identified by this study could be easily reproduced by polling enough Alaskans familiar with the outlying highways. While answers will vary, eventually the same locations will appear. The methodology used in this report removes the subjectiveness of personal observations. It allows both the Department of Fish and Game and the Department of Transportation to rank locations statewide for the first time. 17
24 MOOSE-VEHICLE ACCIDENTS ON ALASKA'S RURAL HIGHWAYS B. Accident Characteristics From the data sample selected, several general trends were distinguishable which have also been characterized in other countries. Examining and understanding these general trends is the key to identifying solutions that will work. 1. General Location Table 4 re-sorts the top ranked locations by route name and shows the actual numbers of recorded moose-vehicle accidents. This listing makes it easier to trace top locations along the highways. It can be seen that several segments are clustered near each other (See Figures 5, 6, 7, and 8). Top ranked locations focus around the more populous areas of the Kenai Peninsula, the Upper Cook Inlet, and the Fairbanks area. These areas have populations of 20,000 people or greater. Around these areas, the traffic volumes are typically 6000 to 8000 vehicles per day. These population areas are also situated in prime moose habitat. Typically the roadways are routed through or adjacent to lowlands or tundra flats. These areas are full of willow and other vegetation and are used as forage areas. Surrounding elevations are typically less than or equal to 200 feet. Major river drainages which may connect several lowland areas are present at nearly all locations. Over half of the residents of the Kenai Peninsula reside next to what is known as the North Kenai Lowlands and Kenai National Wildlife Refuge. The majority of residents in the Mat-Su Valley live adjacent to the Palmer Hay Flats State Game Refuge. In the Fairbanks area, Fairbanks and the North Pole populations are separated by the Chena River and the Tanana River Flats. 2. Light Conditions Figure 9 shows that most accidents happen at night when driver visibility is reduced due to darkness. Nighttime accidents are three times more common than daytime accidents. The necessary reaction time for recognizing a moose and stopping becomes much greater at night. Initially, accident records showed that for as much as twenty-four percent of the accidents, light conditions were not recorded and are unknown. Particularly, most of the uncoded accidents were along the more rural stretches of the Parks Highway north of Willow and the Richardson Highway south of Fairbanks. However, by examining the month of the year and the hour of the day when the accident occurred, it was possible to fill in these gaps by inspection. A majority of the "unknown" light conditions were coded to the extreme hours and months of the winter and summer seasons. These were easily filled in using daylight charts for Alaska (8). Frequently, accidents with unknown light conditions occurred during very late night hours in December and January and were likely to have occurred in darkness. While the many accidents found during evening hours in late June and early July were likely to occur in daylight. Filling in the gaps in the database, darkness appears to be even more significantly correlated (three-fourths of all accidents), as shown in Figure 10. Even after adjusting for unknown light conditions, the ratio of night to day accidents remains the same at 3:1. The recurrence of this same ratio supports an earlier conclusion that the data sample is large enough to produce a ranking and represent trends even though there are unrecorded and unlocatable accidents. This high ratio is worth noting. When examining all other types of accidents on rural highways, as well as moose-vehicle accidents, the night to day ratio is not nearly as high. It is much lower, at about a even 1:1 ratio. 3. Road Surface Conditions There was no substantial relationship noted between dry roads and snow and ice covered roads. While the driver needs a much longer reaction and braking time on ice covered roads, the rate of accidents was approximately equal to that found on dry roads. 18

25
26
27
28
29
30
31 MOOSE-VEHICLE ACCIDENTS ON ALASKA'S RURAL HIGHWAYS 4. Monthly Distribution The monthly distribution of moose-vehicle collisions is presented in Figure 11. The severe winter of is visible. Similarly, appears to have been no easier on moose and motorists. The months of December and January are the worst. During these months Alaska has the least amount of daylight hours (Figure 12). During the winter solstice, around December 20th, continuous darkness approaches twenty hours. This time of year also corresponds to the downward migration of moose as they search for food during winters of heavy snow accumulation. Roadways become more efficient pathways for moose and can become a deadly trap for them. This same peak period has been identified in northern Sweden and British Columbia (46, 47). The months of April and May were the low points for moose accidents. Accidents increased in June and July. Even though drivers are assisted by twenty hours or more of daylight, this may be related to the increase in cow-calf pairs this time of year. The new calves typically follow along the cow's heels, adding to the number of animals crossing in front of a motorist. The June and July peaks are also mirrored in British Columbia, and noted as the time just following the birth of calves (47). In the fall, during the rut, male and female moose seek each other out to breed. A rise in the number of moose-vehicle collisions occurs in the months of August to October during this rutting period. 5. Daily Distribution On a daily basis, there was not a noticeable difference in moose-vehicle collisions between Monday through Sunday. There was a small increase on weekends. This is probably due to increased recreational activity. Traffic volumes generally increase on weekends on the rural highways as motorists travel to and from their favorite recreational spots. 6. Hourly Distribution Figure 13 shows the hourly distribution of moose-vehicle collisions. Most happen between the hours of 5:00 PM and 12:00 AM Midnight. Similar hours were established in British Columbia (47). A smaller peak occurs during the hours of 6:00 AM to 9:00 AM, probably during commutes to adjacent population areas. AM and PM peaks may be considered to correspond with the regular trips of local drivers. This also fits moose behavior as they bed down during the day, and then are on the move at dawn and dusk. A smaller peak shows in the early morning hours. 7. Roadside Many of the segments identified in this report had steep foreslopes and fill sections adjacent to the highway during the study period. Roadsides were typically vegetated and overgrown. Some of the segments have been reconstructed since the accident data was analyzed. Slopes have been flattened, brush cleared, and grasses planted. The roadside relates to the overall visibility of a moose crossing the road. A moose climbing out of a steep ditch in brush may not be as noticeable at night until they are on top of the asphalt pavement. 8. Moose Characteristics Studies on the Kenai Peninsula have shown that a majority of moose killed on the roadways are cows and calves (68). About ten percent of the roadkilled moose are bulls. Approximately forty percent are cows, and fifty percent are calves. This is expected as cows and calves are more numerous in the overall moose population than bulls. The typical moose killed in motor vehicle accidents is a two year old. Also, as mentioned, calves often trail their mother across the highway. 25
32
33
34
35 MOOSE-VEHICLE ACCIDENTS ON ALASKA'S RURAL HIGHWAYS 9. Accident Severity An 800 to 1200 pound adult moose is as large as many vehicles and can total a car beyond use. The height and weight of a moose makes a collision with it more significant than a collision with its relative, the deer. At three to four feet or more to its belly and five to seven feet at the shoulder, a moose will often end up on the hood, roof, or in the windshield of the vehicle. Vehicles impacting a moose are often disabled, and can block a rural two lane roadway for one to two hours. Figure 14 shows the typical results following a moose-vehicle collision. Nearly eighty percent of moose-vehicle collisions resulted only in property damage to the vehicle. In Sweden, two to three percent of all accidents resulted in motorist fatalities (46). In Canada, typically ten percent of moose-vehicle accidents involve injuries, while only two percent are fatal (14). In Alaska, over a five year period, twenty percent of the accidents resulted in injuries, and as low as one-half of a percent resulted in fatalities. 10. Implications Putting together some of the characteristics mentioned above, another trend is visible. A majority of collisions occur on the busier highways used for commuting, shopping, and recreation adjacent to population centers. And most moose-vehicle accidents occur in the middle of winter during hours of darkness. More specifically they occur during the hours people travel to and from work and are evenly spread out among the days of the week. During the middle of winter most motorists are local travelers, while during the summer there is a large increase in visitors and recreational traffic. This data suggests the typical motorist involved in a moosevehicle accident is a local person, who is familiar with the route and probably drives it daily. Residents typically make their winter commute home from 4:00 p.m. to 6:30 p.m. in the dark. During the months of December and January, traffic volumes are lower than during the summer months. The volumes which were used in Rating Method B were seasonally adjusted to average for all months of the year. With the peak moose-vehicle accident time occurring in December through January, the accident rate at these times is actually more significant. Traffic volumes are usually at their lowest point of the year during these months. Combining all the trends listed in items 1-9 suggests the moose-vehicle accident problem may be related to visibility and roadside conditions rather than traffic volumes or unfamiliar drivers. This report does not attempt to explain individual causes and characteristics at each location. It is likely the locations produced in Table 3 would remain the same regardless of the period of study. Common factors such as nearby large cities and towns, and river drainages and lowlands, suggests the problem is a more permanent conflict between busier human transportation routes and natural moose migration corridors. V. MITIGATION HISTORY A. Research The Department of Fish and Game maintains a moose research station north of Kenai off the end of Swanson River Road on the Kenai Peninsula (68). Captured and orphaned moose and caribou are kept in four pens, each with an area of about one square mile. Moose being cared for in the facility have been exposed to various highway mitigation measures such as electric fencing and moose fencing. Moose fencing tested in the research center was later installed along the Glenn Highway north of Anchorage as described in the next section. Radio collaring has been used to study migration patterns prior to a highway construction project (42). Moose were studied as they migrated back and forth from foothills to lowlands just north of Anchorage. 29
36 PHOTO DELETED FIGURE 14
37 MOOSE-VEHICLE ACCIDENTS ON ALASKA'S RURAL HIGHWAYS The number of highway crossings over the Glenn Highway by each animal was recorded. Radio collaring has also been applied in other areas to study moose migration. B. Direct Mitigation Efforts Figure 15 shows the locations where some form of moose-vehicle accident mitigation has previously been applied to highways in Alaska. These locations include the following: 1. Glenn Highway: Muldoon Road to Hiland Road (1987) This section of road once had the highest number and rate of moose-vehicle accidents in Alaska. There were typically forty-five accidents per year over a six mile stretch of four lane divided highway. This rate was nearly twice that of the rural highway problems evidenced today. This route has some of the state s highest traffic volumes using a controlled access freeway which cuts through a winter/summer moose range. Deer reflectors were given a trial in the mid-1970 s. After one year the Department of Transportation determined these did not reduce moose-vehicle accidents (11). Warning signs were installed and roadside clearing performed. No documentation of these early tests is available. By the early 1980 s, a rising number of moose-vehicle collisions raised concerns for both motorist safety and significant depletion of the local moose population. When designing for a widened six lane freeway, both moose fencing and continuous highway lighting were added. (12). Significant results were achieved the following year with over a seventy percent reduction in accidents. This success has been maintained for over five years following the project. This case was the subject of several reports (57, 42). This case and the successful application of fencing and lighting as a solution is discussed again in the next section of this report. 2. Public Awareness Program ( present) The most widespread effort, a public awareness campaign begun in 1990 by the Department of Fish and Game and the Alaska State Troopers, continues today (43). Large signs were placed along high accident corridors on the Kenai Peninsula and in the Mat-Su Valley. The slogan Give Moose a Brake was adopted. Changeable numbers on the signs, which are updated weekly, indicate the current number of roadkills for each local area. Initially, bumper stickers were issued, radio announcements made, and children were educated in school with the hope they would deliver the message home to their parents. A reduction in accidents was noted one year later, however, variations in seasons and subsequent data make it difficult to quantify this program s lasting effect (68). 3. Kalifornsky Beach Road (1991) About two miles west of Soldotna, on the north side of this road, a one-half mile test strip was cleared in 1991 (68). It was the result of a joint effort between the local maintenance office of DOT/PF and the field office of ADF&G. It involved clearing a fifty foot width from the edge-of-traveled-way on each side of the road. Adjacent to the highway, a grass (Arctared Fescue) was planted to inhibit growth of moose browse. Nearby trees were limbed up to eight feet high to improve motorist visibility. According to observations by ADF&G, there have not been any moose accidents along this short stretch of road. No research or follow-up studies have been produced yet. 4. Alaska Railroad ( present) Moose kills on the Alaska Railroad have been significant enough that mitigation measures have been explored and implemented over the years (17-20, 72). In the winter of dozens of moose were being killed each night when about four trains make the trip between Anchorage and Fairbanks. The last time winters were this severe on moose was in During a typical winter, the Railroad hits 31
38
39 MOOSE-VEHICLE ACCIDENTS ON ALASKA'S RURAL HIGHWAYS around 250 moose. Heavy snowfalls prompted moose from Willow to Talkeetna to walk along the tracks instead of in the deep snow. This stretch of track lies adjacent to the Susitna River drainage, where moose are often forced to forage during heavy snowfalls. Over the next five years the railroad tried many mitigation measures (24). They worked with the Department of Fish and Game, and the University of Alaska in Fairbanks, to develop methods to keep moose off railroad tracks. A water cannon mounted on the locomotive to squirt at moose and make them move was explored and rejected. A high voltage, low amperage wire running down the tracks as a shock to moose was considered. It was ruled out as unfeasible to maintain, due to wire breakage. People who ski and snowmachine across the tracks were also a concern when considering electric wiring. Fencing was ruled out due to maintenance costs. Creating alternate forage areas away from the railroad was attempted. Ultrasonic whistles were tested on trains but moose did not respond. Sirens were used, but did not scare moose off the tracks, but instead caused them to run down the tracks as they normally did. Guns with blanks were fired with the same results. A test locomotive driven at half speed, or 25 MPH, failed to reduce moose kills. Again in the winter of , heavy snows pushed moose onto the railroad tracks and highways north of Willow (22-40). Snow berms were five to eight feet on each side of the railroad tracks. Nearly 350 moose were killed in the month of January. Radio collaring showed that moose all around the area were falling victim to the heavy snowfall. By January, emergency meetings were held for the purpose of formulating mitigative measures. One suggestion was to have special permit hunts to reduce moose numbers near the railroad. Meanwhile, the railroad sent pilot cars ahead of trains equipped with sirens, lights, and shotguns with birdshot. Moose tended to stay off the tracks for several hours after an encounter with a pilot car. Moose kills were reduced by twenty-five to fifty percent by this method. By February, the Railroad sent out "snow-cat" track vehicles to pack twenty foot snow paths along each side of the railroad from Willow to Talkeetna. The Army and volunteers also helped clear paths. Meanwhile, legislation was proposed which would fine the Railroad for each moose kill, but did not pass. Arguments were made to replace traditional browse sources, which had matured, with alternate forage areas. By March the Department of Fish and Game began feeding hay to moose, even though its nutritional value was questionable. The strategy was to lure moose away from highways and the railroad. Still, nearly 700 moose were killed by trains by the end of the season. Ever since the season, the Alaska Railroad has implemented a moose accident mitigation program. They have met with the Department of Fish and Game annually in order to improve on solutions (72). The Railroad logs all moose kills, noting time, location, snow depth, and the sex of the animal. From December to April, they run pilot cars to clear moose prior to night trains. This requires four full time employees. The Railroad continues to pack moose trails beside the tracks which are wide enough to give moose a place to stand. This requires two full time employees. A salvage program is maintained for field dressing and hauling moose for pickup by charities. The Railroad also has an annual summer program specifically designed to cut moose browse along the tracks in the problem areas. C. Indirect Mitigation Efforts Indirectly, routine clearing and new highway projects carried out by the Department of Transportation can be considered moose-vehicle accident mitigation efforts. These projects temporarily improve roadside visibility for the motorist. Recent indirect mitigation efforts include the following: 1. Other Clearing Efforts ( ) As part of their recent work schedule, the Maintenance Section cleared many miles of highway in the summers of 1992 and 1993, including some significant moose areas. Regular clearing every two to three years has become a focus of the Maintenance Section. Recently cleared locations include the Sterling Highway, from 33
40 MOOSE-VEHICLE ACCIDENTS ON ALASKA'S RURAL HIGHWAYS the Seward Wye intersection with the Seward Highway south to Sterling, and the Parks Highway, from Wasilla to Willow. The Department of Fish and Game also reported it has conducted clearing of additional brush from creeks and culverts along the same stretch of the Parks Highway, in a direct effort to reduce roadside browse and increase moose-visibility at likely crossings. No follow up programs have been set up to study the effects of work done so far (70). 2. Recent Highway Projects ( ) Recent highway projects often result in roadside clearing and occasionally highway lighting. The latest projects completed in identified moose accident areas include: Sterling Highway widening from Sterling to Soldotna Kenai Spur Road rehabilitation from Soldotna to Kenai Interchange reconstruction and lighting at Hiland Road A new divided Glenn Highway from Eklutna to the Parks Highway Widening the Glenn Highway from the Parks Highway to Sutton These projects include some areas which ranked highest in moose-vehicle collisions earlier in this report. No direct effort has yet been made to mitigate moose accidents along these projects. They were already wrapping up or finished with design work prior to the time this became an issue at the 1991 North American Moose Conference. A few of these projects have temporarily increased the presence of moose along the roadway and the number of roadkills (67). Fall seeding and fertilizing of the roadside have resulted in lush grasses just as winter set in, creating a new alternate browse for moose. It is common practice to topsoil and seed in the fall on highway projects. This will have to be evaluated when determining future solutions to moose accidents. VI. POTENTIAL SOLUTIONS A. Range of Solutions Potential solutions are presented in an order intended to reflect the increasing effort and cost required for implementation. Refer to Table 5 for a list of these solutions. 1. The Do-Nothing Alternative There is always the option to do nothing - or leave the roadway as is. In general, the public and media have demonstrated their disapproval with the current frequency of moose-vehicle collisions. In some cases, moose-vehicle collisions could be causing drastic reductions in the local moose population. This was the case on the Glenn Highway from Anchorage to Eagle River, where moose collisions were twice as numerous as anywhere else in the state today. 2. Route Alignment During the preliminary design of highways, a good practice would be to determine whether any new roadway alignments will cross through moose habitat. Choosing a new alignment which avoids moose habitat may be one of the easiest solutions to apply as a moose mitigation measure, because the problem has not yet developed. Most of the mountainous road sections sampled do not show high moose-vehicle accident concentrations. Level and rolling terrain, with flats, or swampy tundra, are prime moose habitat and usually the site of high moose concentrations. The top ranked spots in Alaska were these types of areas, including the Palmer Hay Flats State Game Refuge on the Glenn Highway, and the Kenai National Wildlife Refuge on the Sterling Highway near Soldotna and Sterling. 34
41
42 MOOSE-VEHICLE ACCIDENTS ON ALASKA'S RURAL HIGHWAYS Based upon the general trends observed in this report, it would seem best to design roads above and well away from the lowlands. An example of this type of roadway would be the Parks Highway from Nenana to Fairbanks. It follows a chain of ridgetops, at the base of which are lowlands on both sides. There could have been more moose-vehicle conflicts if the highway had been routed along the base of these ridges. Most roadbuilding solutions typically avoid lowlands in favor of more suitable areas for construction. The route alignment will depend on more than moose habitat. It will also be affected by the number of identifiable route alternatives and their overall cost. 3. Public Awareness Program This type of solution has been tried in the form of pamphlets and brochures distributed to the public in both Newfoundland and Sweden (45, 46). A similar program was implemented in Alaska in 1990 in the Upper Cook Inlet and Kenai Peninsula areas (43). As discussed earlier, the undertaking included bumper stickers, school discussions, and posting highway signs (Figure 16) with regularly updated tallies. Initial results, after one year, suggested an eighteen percent reduction in moose-vehicle accidents. After a longer period, these results are now uncertain. It is likely a controlled setting no longer exists to test this case. Now that motorists have seen the signs year around, it is hard to measure any reduction due to variables such as winter severity, roadside clearing, and recent highway projects. Signs are in place for this program and require an updating of the number of roadkills tallies in each region. The costs of the program were absorbed into the current staffing levels of the Department of Fish and Game and the Department of Public Safety. The Public Awareness Program could be expanded statewide. New public awareness signing could utilize reflectorized sign sheeting and minimum lettering heights necessary for legibility. The local media could further educate the public about high moose-vehicle accident areas and where they are located. This could be combined with warning signs at the worst segments (Figure 17). In order to be most effective, this information could be related to the public during the highest accident months of December through February. 4. Install Warning Signs Standard diamond shaped warning signs (Figure 18) are already present along some of Alaska s top ranked highway segments. The rankings in this report lend some consistency in determining sign placement. If signs were placed along the segments determined by the criteria in this report, this would give more credibility to the signs. Warning signs give the driver some information as to "why" the motorist may want to be alert. Moose warning signs may have advisory plates to provide additional information. However, it is difficult to select an appropriate advisory speed for moose encounters because the point at which they will cross in front of a motorist is unpredictable. Because of this, advisory speed plates may not be useful. Instead, noting the length of the accident zone may be more useful information to the motorist. Then the motorist can make their own choice of what they consider to be a reasonable and safe speed. The top twenty-five percent of moose-vehicle collision segments ( both eight accidents per mile per five years and 0.95 accidents per million vehicle miles) could be used as a possible threshold for installing warning signs. This would result in approximately ninety sign installations. Some of the top ranked segments already have a scattered arrangement of warning signs in place. Limiting the use of these signs maintains their credibility. Warning signs may be more effective when used in combination with public awareness signing. Warning signs could be carefully installed on their own posts (3), at design standard offsets and heights (4), and at regular two minute spacing intervals (similar to the state s speed zone posting policy) (9). Signing all of the top ranked segments would be inexpensive compared with other mitigation measures. 36

43
44
45
46 MOOSE-VEHICLE ACCIDENTS ON ALASKA'S RURAL HIGHWAYS 5. Speed Limit Reductions In general, speed limit signs will do little to change driver choice of speeds. However, this does not mean that slower speeds will not reduce moose-vehicle accidents. Speed limit signs are regulatory, and thus differ in purpose from warning signs. Speed limit signs do not explain "why" to the driver. Unless there is strict enforcement, they may not encourage compliance as well as warning signs. Studies show that driver s select speeds based upon roadway conditions and not the speed limit posting (15, 41, 50, 61, 80). They will drive at speeds they feel are reasonable or prudent for the condition and quality of the roadway. The Department's policy on the establishment of speed limits explains the relationship between "reasonable and prudent" drivers and speed limits: "...where restricted speed limits are needed, they shall basically be established at or near the 85th percentile speed, which is defined as the speed at or below which 85 percent of the traffic is traveling. Regardless of the posted limit, and to a certain extent the level of enforcement, the 85th percentile speed remains the same for a given section of road. The effects of posting a zone lower than the 85th percentile is to increase the percentage of drivers exceeding the posted limit and to decrease the percentage of motorists within the pace, which is an undesirable effect. The pace speed is defined as that 10 mile-per-hour increment of speed containing the largest number of vehicles. The safest conditions occur when all vehicles on the road are moving at the same speed. This ideal is impractical. However, it is known that when the pace contains 70 percent or more of the vehicles, accidents are minimized. It has also been determined that when roadways are posted at the 85th percentile speed, the pace usually contains 70 percent or more of the vehicular traffic. The basic speed law states that no person shall drive at a speed greater than is reasonable or prudent. The majority of drivers comply with this law, and disregard regulations which they consider unreasonable. It is only a small portion of drivers who are inclined to be reckless, unreliable, or who have faulty judgement and must be controlled by law enforcement. Speed limits, set at or near the 85th percentile speed, provide law enforcement officials with a means of controlling the drivers who will not conform to what the majority considers reasonable and prudent. The 85th percentile speed conforms to the consensus of those who drive the highway as to what speed is reasonable and safe, and is not dependent on the judgement of one or a few individuals." One application of this policy has been the Parks Highway from a point North of Talkeetna to Fairbanks. By studying motorist's speeds and roadway conditions, around 200 miles of the Parks Highway was recently reposted from 55 MPH to 65 MPH. The geometrics of this highway meets operational criteria for speed limits higher than 55 MPH (80). 6. Plantings to Inhibit Roadside Browse Without frequent maintenance, the roadside eventually becomes overgrown with willow, birch, aspen, alder, and cottonwoods. This is often the case in Alaska due to budget constraints and more pressing maintenance priorities. Many areas become forage for moose in the summers and severe winters. Some roadsides actually support a nonmigratory moose population year around (68). Recently, new highway projects on the Kenai Peninsula have planted grass in the fall which stayed lush and green long after wild brush had dropped its leaves for winter. Late into November, moose were still able to kick up the snow cover to reach green grasses. These new highway segments attracted as many as twenty or more moose at a time, feeding along five to six miles of highway at a time. The grass mixture on the projects includes a thirty percent mixture of Arctared Fescue, a grass which will grow reedy and spiny by its second year. It was planned to inhibit the growth of browse and control erosion. The cause of attraction for moose may not have been the grass mixture, but the time of planting and the amount of fertilizing (68). On a one half mile test strip of Kalifornsky Beach Road (within a segment ranked second statewide), Arctared Fescue, clearing, and delimbing of nearby trees was undertaken in 1991 to increase visibility and discourage browse growth. The results appear successful so far, but no controlled study has been undertaken (68). 40
47 MOOSE-VEHICLE ACCIDENTS ON ALASKA'S RURAL HIGHWAYS A study would be necessary to determine the proper planting time and the mixture of roadside seeding that will inhibit moose browse growth. Earlier spring planting may provide a more desirable mature grass by fall. This mitigation measure could be especially critical for new highway projects which fall within top ranked moose-vehicle collision areas. Fall planting is usually convenient and timely for highway construction. It takes all summer to prepare the road before topsoil and seeding can be placed. Environmental requirements for construction typically require soil stabilization as soon as practicable, which is often prior to winter shutdown. When roadway projects fall within locations identified by this report, designers could explore temporary erosion control measures which would not attract moose in the fall. The following summer, permanent plantings could then be applied. 7. Clearing This is one of the most commonly applied solutions to moose-vehicle collisions. In Sweden, clearing has been estimated to produce a twenty percent reduction in moose-vehicle accidents (46). Clearing can be performed by a variety of methods, including: Hydroaxing Hand clearing Steam clearing Spray Inhibitors Hydroaxing using a large "brush hog" is a fast and efficient method of clearing, and is employed by the Maintenance Section of DOT/PF and the Alaska Railroad Corporation. Hand clearing may be necessary when machines cannot drive into creek areas or culvert ditches. The Railroad experimented for one year with steam clearing to maintain the top of the track bed only (43, 72). A hot steam is applied to the top of the track bed to kill and inhibit vegetation. There is a high initial cost in a special railroad car devoted to the work and the program was dropped. The Railroad formerly cleared with chemical sprays, however, the method became environmentally and politically controversial. Alternative methods were studied in detail through research work conducted by the University of Alaska, Fairbanks. Spray inhibitors have not been used by the Railroad for years. The Department of Transportation recently considered testing an environmentally approved spray, "Rodeo", to inhibit vegetation growth under guardrail. Even though the use of this product is common in other states (88, 89), this plan was cancelled due to public protest of its use (91). The Maintenance Section strives to clear roadsides every two to three years, which is the Department's maintenance schedule for roadside clearing. Clearing is necessary regardless of other solutions. Anytime brush is allowed to grow uncontrolled along the roadside, it begins to provide browse which attracts moose. If it matures beyond browse, then roadside trees will grow and become obstacles to the errant driver. So even if illumination, delineators, fences, or other mitigation measures are present, clearing will always be required. Typically, clearing is performed to the highway right-of-way limits, or about twenty to thirty feet from the edge of pavement. The time of year in which clearing is performed is critical. It is best to start in the early summer as a plant invests more nutrients in above ground growth, and less in its root system. Clearing at this time has a larger impact on the plant, shocking it into remission. Some experts advocate clearing several times the first year it is performed, continually beating back the plants before they can recover. Clearing may be performed just once a season after that (68). 8. Reduce Population Densities Another option is to reduce moose population densities near highways. This has been an approach advocated in Newfoundland, Canada. It was suggested the control method be in the form of April/May spring hunt 41
48 MOOSE-VEHICLE ACCIDENTS ON ALASKA S RURAL HIGHWAYS traffic. At the same time migratory populations from farther away that cross the road in December/January are possibly less roadwise, and are getting hit more often. Based upon this theory, it could be concluded a spring hunt may reduce the roadwise population. At the same time, the migratory population may remain unaffected, still contributing to the same amount of roadkills. Thus a net loss in moose population could result. 9. Alternate Forage Areas Another type of clearing option is the creation of alternate forage areas for moose. Habitat alteration or manipulation has been suggested in Canada (47, 45). This method is employed in Alaska, but has been limited by adjacent residential development. Acreage off the highway can be cleared in order to develop browse for moose. If well located, the alternate forage area is expected to attract moose away from highway roadsides. Special attention must be paid to how close to the highway a clearing is located. If it is too close it may draw moose near the highway. It is also not a good idea to clear alternate areas on both sides of a highway. Then there is potential for moose to travel between the areas, and increase roadway crossings (68). 10. Alternate Travel Paths When snow accumulation becomes very deep in winter, moose will begin to use the cleared railroads and roadways for easier walking. As demonstrated by the Alaska Railroad, alternate travel paths provide routes for moose besides highways and railroads. In areas where moose kills are a serious problem, alternate travel paths could be cleared adjacent to the highway. However, at some point moose may still need to cross the road to get to browse or follow a migration route. 11. Deer Reflectors Austrian developed deer reflectors have proven successful in mitigating deer collisions in Washington State and other areas (Figure 19) (16, 71). In other states, such as Wyoming and Utah, they have been considered ineffective (62, 107). A series of these delineators at sixty to 100 foot spacings are used to reflect headlight beams at right angles from the roadway. This is intended to create a visual barrier to control wildlife. To date, a controlled test has not been conducted to confirm the effectiveness or ineffectiveness of these delineators in Alaska. The Glenn Highway test of deer reflectors in the early 1970's was undocumented and appears to have had few controls. The test lasted one season and appeared to have little effect on moose. (11) Delineators would have to be maintained in good condition throughout a test. A period longer than two years, preferably three, could be used to average out for winter severity. Washington State tested these reflectors by alternately covering and uncovering them on a weekly basis over the same test section. In this way, accident reductions could be directly related over the same winter season. 12. Wildlife Mirrors Otherwise known as Van de Ree mirrors, these polished stainless steel wildlife mirrors reflect light at right angles to the roadway, just as reflectors do. For deer, they were considered successful in one Maine test, and achieved nearly a 100 percent reduction in the Netherlands. However, other tests in Maine, and other states, have concluded these mirrors were ineffective (16). Sweden dropped the use of them by the early 1980's (46). Application and testing would be similar to that for deer reflectors. 42
49
50 MOOSE-VEHICLE ACCIDENTS ON ALASKA'S RURAL HIGHWAYS 13. Delineator Backdrop A delineator backdrop is a potential method to improve the driver's ability to see moose along the roadside (Figure 20). Ideally, moose should be detectable far enough ahead that the driver can brake to a stop, if necessary. The driver should be able to notice a silhouette, movement, or break in the regular roadside pattern. This same basic theory is currently applied in lighting and signing placement for highways (3). The backdrop is similar to the idea that the dark appearance of a moose is more easily detected against the white snow cover. Since winter thaws frequently remove or dull snow cover, a delineator backdrop would be an extra aid in providing a bright background for the driver. Highly reflective sign sheetings are now available which combat road sludge and dirt buildup on the signs. This approach would not prevent all moose-vehicle accidents. Some moose may cross quickly, beginning from outside the driver's cone of vision. Road conditions and the distance betwen the moose and the driver may not allow enough time to react to the crossing moose. However, this method has some potential for assisting drivers. It would require an intensive experiment or maintenance effort to make sure the system of delineators is maintained throughout any analysis period. 14. Ultrasonic Sound Devices A pair of horns can be mounted on vehicles in order to make a high frequency sound as wind blows through it (Figure 21). They are similar to a dog whistle and are intended to alert and hopefully drive off deer and dogs as much as 1200 feet in advance of the vehicle. The sound is not detectable by humans. This has been tried on moose in Sweden on a random scale, but was considered unsuccessful. Apparently moose adjusted to the sound after a short while (46). In Utah, a test of these devices involving over 900 mule deer concluded they were ineffective (106). As noted earlier, ultrasonic sound devices were tried on the Alaska Railroad trains with no apparent effect. Many motorists are particular about their cars and may not be receptive to a voluntary plan to mount sound devices to their vehicles. Ultrasonic sound devices must be taken apart and cleaned if they get dirty, and there are two to take care of. Plastic horns are mounted to the bumper by a stick-on base, though they could be screwed on, and are not intended to go through a car wash. Some motorists might ignore or forget to adhere to these requirements. Road sludge and grime during the worst months of moose activity could get into the horns and alter the whistle or render them useless. Ice and snow or slight bumps into another car or grocery cart could also bust off the standard whistle. High frequency deer warning devices are currently being marketed commercially in Alaska. A test of this solution would involve equipping a large enough percentage of vehicles to make a successful analysis. Equipped vehicles, on a regular commuter route, could be compared against a control group of nonequipped vehicles. 15. Slope Flattening Slope flattening is the widening and flattening of the roadside adjacent to the pavement, and is frequently performed on major highway construction projects. Slope flattening helps to improve moose visibility by bringing them up to the level of the road and within view of the motorist. Moose are more likely to be visible in the path of vehicle headlights, rather than down in a ditch. Recent construction projects, such as the Sterling Highway reconstruction from Soldotna to Sterling, and the Glenn Highway reconstruction over the Palmer Hay Flats State Game Refuge, are good test cases for future evaluation of slope flattening and its potential for reducing moosevehicle accidents. 44

51

52
53 MOOSE-VEHICLE ACCIDENTS ON ALASKA'S RURAL HIGHWAYS 16. Moose Fencing and Moose Underpasses As mentioned earlier, moose fencing was installed along the first four miles of the Glenn Highway from Muldoon to Eagle River (See Figures 15, 22, 23). This was an effective solution for a controlled access facility, but may be more difficult to install on a roadway with many driveways. About half of the project used lighting only, and both lighting and fencing were used on the other half. A ninety-five percent reduction was noted in areas with both fenced and lighted areas (57, 42). Fencing can require a few repairs per year as trees fall on it and other actions test its integrity. Sweden has dealt with greater mileages than the Glenn Highway. One of their roads is continuously fenced for over sixty miles and resulted in around eighty percent reductions in moose-vehicle accidents. (46). A special underpass was also built on the Glenn Highway fencing project and is currently being used by moose. The bridge at Ship Creek two miles into the project was used to maintain a regular moose crossing area between winter and summer range. An underpass is a structure like any other bridge. Its cost will vary depending on whether it is built as a tube or a bridge and the span length. It requires regular field inspections and patching or replacement. In most locations, it may be necessary to construct underpasses in combination with fencing. The underpasses can be used to allow moose access between winter and summer habitat, which helps to preserve a healthy animal population. If the facility to be fenced is not a controlled access highway, then cattle guards may be an option for consideration. Common in Montana, cattle guards consist of a fence, with no gates, but instead a grating at each driveway or sidestreet (Figure 24). The grating has openings large enough that hoofed animals cannot walk across them safely (20, 73). Though not foolproof, the grates work well with cattle and are easily fabricated. If there is enough snow or debris buildup, they will require maintenance. Even though the grates work, some cattle still attempt to cross. They can be injured and may have to be destroyed. Cattle grates across driveways could replace culverts and serve as drainage structures. Cattle guards may not work for moose. If moose injure their legs on cattle guards, they will probably have to be destroyed. For this reason, this idea may not be considered acceptable. One option may be to install cattle guards at a test site using visually false holes in the grating and monitor it over a period of time. 17. Continuous Illumination Figure 10 showed a strong correlation between the hours of darkness and moose-vehicle accidents. One of the most effective methods of reducing moose-vehicle accidents is to illuminate the roadside. The added lighting appears to aid motorists in avoiding moose. As mentioned earlier, eight miles of continuous illumination were installed on the Glenn Highway from Muldoon Road to Hiland Road in the summer of The Glenn Highway is a controlled access divided highway with enough traffic in winter months to warrant lighting regardless of moose-vehicle collisions. Prior to installing lighting, this stretch of roadway was the most evident in the state for moose-vehicle collisions. Two reviews of this project showed significant moose-vehicle accident reductions. A seventy percent reduction in collisions was proven in lighted areas (57, 42). 47
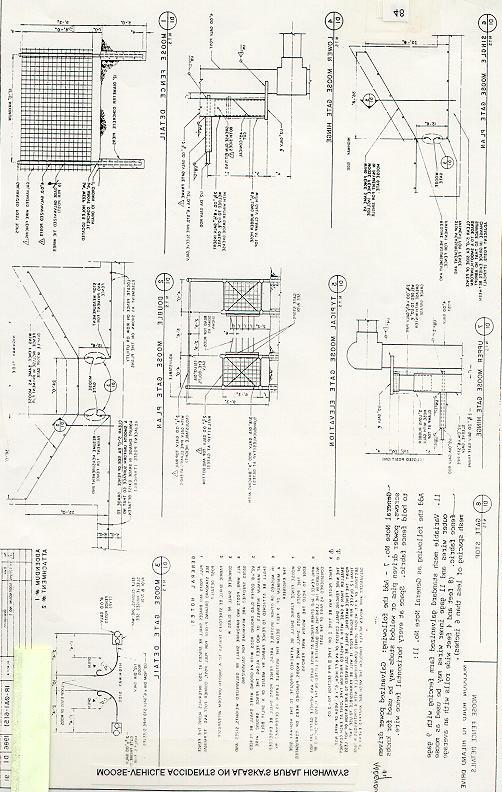
54

55

56
Lesson Nine Population Problems. Key question How does growth of Florida s human population affect bear populations?
 Lesson Nine Population Problems Key question How does growth of Florida s human population affect bear populations? Conceptual frameworks topics IV.C. Florida black bear seasonal activities and movements
Urban Encroachment on the Wilderness: Moose-Vehicle Collisions in Anchorage, Alaska,
 Urban Encroachment on the Wilderness: Moose-Vehicle Collisions in Anchorage, Alaska, 1991-1995 Larry C. Garrett and George A. Conway Epidemic Intelligence Service and National Institute for Occupational
Motorists are urged to drive wisely and cautiously in all winter weather situations:
 Snow and Ice Snow and ice control is a central winter activity of the Milford Township road crew, especially during a rough winter. Milford Township is responsible for keeping 76.45 miles of roads passable
TOWN OF GRAND FALLS WINDSOR
 TOWN OF GRAND FALLS WINDSOR DEPARTMENT OF ENGINEERING AND WORKS FREQUENTLY ASKED QUESTIONS FOR WINTER OPERATIONS... What streets are the first to be plowed & salted/sanded? The roads crews are each assigned
Transportation and Road Weather
 Portland State University PDXScholar TREC Friday Seminar Series Transportation Research and Education Center (TREC) 4-18-2014 Transportation and Road Weather Rhonda Young University of Wyoming Let us know
EXAMINATION OF THE SAFETY IMPACTS OF VARYING FOG DENSITIES: A CASE STUDY OF I-77 IN VIRGINIA
 0 0 0 EXAMINATION OF THE SAFETY IMPACTS OF VARYING FOG DENSITIES: A CASE STUDY OF I- IN VIRGINIA Katie McCann Graduate Research Assistant University of Virginia 0 Edgemont Road Charlottesville, VA 0 --
Snow Removal Policy WARREN COUNTY ENGINEER S OFFICE (WCEO) WARREN COUNTY HIGHWAY DEPARTMENT. October 16, 2014
 WARREN COUNTY HIGHWAY DEPARTMENT. October 16, 2014") Snow Removal Policy WARREN COUNTY ENGINEER S OFFICE (WCEO) October 16, 2014 Presented by: Neil F. Tunison, Warren County Engineer Snow Removal Policy OPERATIONS SAFETY WARREN COUNTY ENGINEER S OFFICE (WCEO)
Snow Removal Policy WARREN COUNTY ENGINEER S OFFICE (WCEO) October 16, 2014 Presented by: Neil F. Tunison, Warren County Engineer Snow Removal Policy OPERATIONS SAFETY WARREN COUNTY ENGINEER S OFFICE (WCEO)
How Can DOT Operations and Maintenance Prepare for Extreme Weather Events?
 How Can DOT Operations and Maintenance Prepare for Extreme Weather Events? Gregory C. Johnson, P.E. Chief Operations Officer Michigan Department of Transportation November 17, 2012 Michigan s Climate Four
City of Hermosa Beach Beach Access and Parking Study. Submitted by. 600 Wilshire Blvd., Suite 1050 Los Angeles, CA
 City of Hermosa Beach Beach Access and Parking Study Submitted by 600 Wilshire Blvd., Suite 1050 Los Angeles, CA 90017 213.261.3050 January 2015 TABLE OF CONTENTS Introduction to the Beach Access and Parking
Spatiotemporal Analysis of Urban Traffic Accidents: A Case Study of Tehran City, Iran
 Spatiotemporal Analysis of Urban Traffic Accidents: A Case Study of Tehran City, Iran January 2018 Niloofar HAJI MIRZA AGHASI Spatiotemporal Analysis of Urban Traffic Accidents: A Case Study of Tehran
HAZARD DESCRIPTION... 1 LOCATION... 1 EXTENT... 1 HISTORICAL OCCURRENCES...
 WINTER STORM HAZARD DESCRIPTION... 1 LOCATION... 1 EXTENT... 1 HISTORICAL OCCURRENCES... 3 SIGNIFICANT PAST EVENTS... 4 PROBABILITY OF FUTURE EVENTS... 5 VULNERABILITY AND IMPACT... 5 Hazard Description
Active Traffic & Safety Management System for Interstate 77 in Virginia. Chris McDonald, PE VDOT Southwest Regional Operations Director
 Active Traffic & Safety Management System for Interstate 77 in Virginia Chris McDonald, PE VDOT Southwest Regional Operations Director Interstate 77 at Fancy Gap Mountain Mile markers 0-15 Built in late
Putative Canada Lynx (Lynx canadensis) Movements across I-70 in Colorado
 Movements across I-70 in Colorado") Putative Canada Lynx (Lynx canadensis) Movements across I-70 in Colorado INTRODUCTION March 8, 2012 Jake Ivan, Mammals Researcher Colorado Parks and Wildlife 317 W. Prospect Fort Collins, CO 80526 970-472-4310
Putative Canada Lynx (Lynx canadensis) Movements across I-70 in Colorado INTRODUCTION March 8, 2012 Jake Ivan, Mammals Researcher Colorado Parks and Wildlife 317 W. Prospect Fort Collins, CO 80526 970-472-4310
Relationship between weather factors and survival of mule deer fawns in the Peace Region of British Columbia
 P E A C E R E G I O N T E C H N I C A L R E P O R T Relationship between weather factors and survival of mule deer fawns in the Peace Region of British Columbia by: Nick Baccante and Robert B. Woods Fish
CITY OF NEW LONDON WINTER ROAD & SIDEWALK MAINTENANCE POLICY
 CITY OF NEW LONDON WINTER ROAD & SIDEWALK MAINTENANCE POLICY GENERAL The purpose of this policy is to set up acceptable procedures and policies for the winter maintenance of public areas in the City of
3.12 Geology and Topography Affected Environment
 3 Affected Environment and Environmental Consequences 3.12 Geology and Topography 3.12.1 Affected Environment 3.12.1.1 Earthquakes Sterling Highway MP 45 60 Project Draft SEIS The Kenai Peninsula is predisposed
Montmorency County Traffic Crash Data & Year Trends. Reporting Criteria
 June 2017 Revised 10/3/17 2016 Reporting Criteria Please pay particular attention to the wording when interpreting the three levels of data gathered for this report. Crash The Crash Level analyzes data
Municipal Act, 2001 Loi de 2001 sur les municipalités
 Municipal Act, 2001 Loi de 2001 sur les municipalités ONTARIO REGULATION 239/02 MINIMUM MAINTENANCE STANDARDS FOR MUNICIPAL HIGHWAYS Consolidation Period: From January 25, 2013 to the e-laws currency date.
collision analyses...
 collision analyses. 28 INJURY SUMMARY YEAR COLLISION NON-INJURY INJURY FATAL TOTAL TOTAL PERCENT TOTAL PERCENT TOTAL PERCENT 2004 7410 5124 69.15% 2259 30.49% 27 0.36% 2005 6767 4538 67.06% 2214 32.72%
Dunn County Snow Removal Policy
 Dunn County Snow Removal Policy OVERVIEW With the advent of another winter season in the northern plains comes the possibility of snow, freezing rain and slippery roadways, and area resident s concern
Weather Information for Surface Transportation (WIST): Update on Weather Impacts and WIST Progress
: Update on Weather Impacts and WIST Progress") Weather Information for Surface Transportation (WIST): Update on Weather Impacts and WIST Progress Samuel P. Williamson Office of the Federal Coordinator for Meteorological Services and Supporting Research
Weather Information for Surface Transportation (WIST): Update on Weather Impacts and WIST Progress Samuel P. Williamson Office of the Federal Coordinator for Meteorological Services and Supporting Research
U.S. - Canadian Border Traffic Prediction
 Western Washington University Western CEDAR WWU Honors Program Senior Projects WWU Graduate and Undergraduate Scholarship 12-14-2017 U.S. - Canadian Border Traffic Prediction Colin Middleton Western Washington
Recognition Of Harpooning Danger Is A Very Long And Slow Learning Curve
 Recognition Of Harpooning Danger Is A Very Long And Slow Learning Curve Posting Date: 6-Nov-2016 Figure 1: News media photo from February 21, 2016 of a car that was harpooned by a horizontal railing at
Snow Plow Safety Quick Reference Guide
 PUBLIC WORKS INITIATIVE Snow Plow Safety Quick Reference Guide INTRODUCTION This quick reference guide highlights snow removal/snow plow safety practices. Its purpose is to help prevent personal injury
IOWA COUNTY ORDINANCE NO. 22 IOWA COUNTY SNOW & ICE POLICY
 IOWA COUNTY ORDINANCE NO. 22 IOWA COUNTY SNOW & ICE POLICY AN ORDINANCE REPEALING ESTABLISHING THE POLICY AND LEVEL OF SERVICE IN RESPECT TO CLEARANCE OF SNOW AND ICE AND MAINTENANCE OF IOWA COUNTY S SECONDARY
Dust Storms in Arizona: The Challenge to Ensure Motorist Safety Jennifer Toth, P.E. Deputy Director for Transportation
 Dust Storms in Arizona: The Challenge to Ensure Motorist Safety Jennifer Toth, P.E. Deputy Director for Transportation Arizona Department of Transportation AASHTO Extreme Weather Event Symposium May 21,
Perth County Road Fatal Head-on Collision - A Common and Dangerous Issue
 Perth County Road Fatal Head-on Collision - A Common and Dangerous Issue Posting Date: 25-Aug-2016 Figure 1: View looking east long "Speeders Alley" - a more appropriate name for the long, straight and
H IGHWAY 3 WILDLIFE MORTALITY
 Miistakis Institute for the Rockies H IGHWAY 3 WILDLIFE MORTALITY CONTENTS Introduction 1 Methods 2 Data Limitations 3 Results 3 Discussion 8 Special points of interest: The analysis includes mortality
IN VEHICLES: Do not try to outrun a tornado. Abandon your vehicle and hide in a nearby ditch or depression and cover your head.
 TORNADO SAFETY TORNADO! The very word strikes fear in many people. While a tornado is perhaps nature's most destructive storm, deaths and injuries can be prevented. By following Tornado Safety Rules, lives
STATISTICAL ANALYSIS OF LAW ENFORCEMENT SURVEILLANCE IMPACT ON SAMPLE CONSTRUCTION ZONES IN MISSISSIPPI (Part 1: DESCRIPTIVE)
") STATISTICAL ANALYSIS OF LAW ENFORCEMENT SURVEILLANCE IMPACT ON SAMPLE CONSTRUCTION ZONES IN MISSISSIPPI (Part 1: DESCRIPTIVE) Tulio Sulbaran, Ph.D 1, David Marchman 2 Abstract It is estimated that every
STATISTICAL ANALYSIS OF LAW ENFORCEMENT SURVEILLANCE IMPACT ON SAMPLE CONSTRUCTION ZONES IN MISSISSIPPI (Part 1: DESCRIPTIVE) Tulio Sulbaran, Ph.D 1, David Marchman 2 Abstract It is estimated that every
Whether you are driving or walking, if you come to a flooded road, Turn Around Don't Drown
 Whether you are driving or walking, if you come to a flooded road, Turn Around Don't Drown You will not know the depth of the water nor will you know the condition of the road under the water. Many people
TRAFFIC ALERT FOR WEEK OF February 4 8, 2008
 TRAFFIC ALERT FOR WEEK OF February 4 8, 2008 Highway work zones in the Staunton District The following is a list of highway work that might affect traffic in the Staunton transportation district during
Town of Oconomowoc Snow & Ice Control Policy
 Town of Oconomowoc Snow & Ice Control Policy Introduction The purpose of this policy is to provide a detailed overview of the Town s snow & ice control operations including its goals and objectives. All
Montmorency County Traffic Crash Data & Year Trends. Reporting Criteria
 June 2018 Revised 8/3/2018 2017 Reporting Criteria Please pay particular attention to the wording when interpreting the three levels of data gathered for this report. Crash The Crash Level analyzes data
106 PURDUE ENGINEERING EXTENSION DEPARTMENT
 106 PURDUE ENGINEERING EXTENSION DEPARTMENT distribution by stations can best be studied by examining Figs. 3 and 4. Figure 4 shows the frequency distribution between stations, and Fig. 3 shows the actual
Technical Memorandum #2 Future Conditions
 Technical Memorandum #2 Future Conditions To: Dan Farnsworth Transportation Planner Fargo-Moorhead Metro Council of Governments From: Rick Gunderson, PE Josh Hinds PE, PTOE Houston Engineering, Inc. Subject:
COUNCIL POLICY MANUAL
 COUNCIL POLICY MANUAL SECTION: PUBLIC WORKS SUBJECT: SNOW & ICE CONTROL POLICY 2012/2013 GOAL: Pages: 1 of 10 Approval Date: Dec. 3, 2012 Res. # 1001/2012 To annually identify the winter maintenance costs
ALASKA ITS. Vehicles and Observations in the cloud
 ALASKA ITS Vehicles and Observations in the cloud 1 YOUR PRESENTERS Wilf Nixon, Salt Institute Mark DeVries, Vaisala Dan Schacher, ADOT&PF 2 Today s Agenda A Cloud Based Overview connected and autonomous
Checklist: Deposing the Driver in an Auto Accident
 Checklist: Deposing the Driver in an Auto Accident 1. PERSONAL BACKGROUND All names ever used Present and past residences for 10 years If the deponent has rented a residence, get the name and address of
Identify the letter of the choice that best completes the statement or answers the question.
 Chapter 12 - Practice Questions Multiple Choice Identify the letter of the choice that best completes the statement or answers the question. 1) Never remove a radiator cap on a hot engine because a. the
Project Appraisal Guidelines
 Project Appraisal Guidelines Unit 16.2 Expansion Factors for Short Period Traffic Counts August 2012 Project Appraisal Guidelines Unit 16.2 Expansion Factors for Short Period Traffic Counts Version Date
While all thunderstorms are dangerous, the National Weather Service (NWS) defines a severe thunderstorm as one that:
 defines a severe thunderstorm as one that:") While all thunderstorms are dangerous, the National Weather Service (NWS) defines a severe thunderstorm as one that: Produces hail at least three-quarters of an inch in diameter. Has winds of 58 miles
While all thunderstorms are dangerous, the National Weather Service (NWS) defines a severe thunderstorm as one that: Produces hail at least three-quarters of an inch in diameter. Has winds of 58 miles
W I N T E R STORM HAZARD DESCRIPTION
 W I N T E R STORM HAZARD DESCRIPTION... 1 LOCATION... 2 EXTENT... 2 HISTORICAL OCCURRENCES... 4 SIGNIFICANT PAST EVENTS... 4 PROBABILITY OF FUTURE EVENTS... 5 VULNERABILITY AND IMPACT... 5 HAZARD DESCRIPTION
Unit 1, Lesson 2. What is geographic inquiry?
 What is geographic inquiry? Unit 1, Lesson 2 Understanding the way in which social scientists investigate problems will help you conduct your own investigations about problems or issues facing your community
225 Bush Street Suite 1700 San Francisco, CA phone fax
 225 Bush Street Suite 1700 San Francisco, CA 94104 415.896.5900 phone 415.896.0332 fax www.esassoc.com memorandum date July 29, 2009 to from subject Craig Nikitas, San Francisco Planning Department Daniel
QUANTIFICATION OF THE NATURAL VARIATION IN TRAFFIC FLOW ON SELECTED NATIONAL ROADS IN SOUTH AFRICA
 QUANTIFICATION OF THE NATURAL VARIATION IN TRAFFIC FLOW ON SELECTED NATIONAL ROADS IN SOUTH AFRICA F DE JONGH and M BRUWER* AECOM, Waterside Place, Tygerwaterfront, Carl Cronje Drive, Cape Town, South
Tornadoes Impacting Interstates: Service and Societal Considerations
 Tornadoes Impacting Interstates: Service and Societal Considerations Scott F. Blair NOAA / National Weather Service, Topeka, Kansas Elizabeth P. K. Lunde NOAA / National Weather Service, Topeka, Kansas
Severe Thunderstorms
 Severe Thunderstorms Severe Thunderstorms Explain that, while all thunderstorms are dangerous, the National Weather Service (NWS) defines a severe thunderstorm as one that: Display Slide Th-0 Produces
Monthly Long Range Weather Commentary Issued: APRIL 18, 2017 Steven A. Root, CCM, Chief Analytics Officer, Sr. VP,
 Monthly Long Range Weather Commentary Issued: APRIL 18, 2017 Steven A. Root, CCM, Chief Analytics Officer, Sr. VP, sroot@weatherbank.com MARCH 2017 Climate Highlights The Month in Review The average contiguous
Climate Change Impacts in Alaska: the Weather Perspective
 Climate Change Impacts in Alaska: the Weather Perspective September 18, 2007 NOAA s National Weather Service, Alaska Region James Partain, Chief Environmental and Scientific Services Division NOAA NWS
Driving in Rural Areas. 82 percent of a miles of roadways are rural roads.
 Driving in Rural Areas 82 percent of a miles of roadways are rural roads. Different types of Roadways Rural roads are constructed of many different types of materials. Some are paved Others are not. Different
Responsive Traffic Management Through Short-Term Weather and Collision Prediction
 Responsive Traffic Management Through Short-Term Weather and Collision Prediction Presenter: Stevanus A. Tjandra, Ph.D. City of Edmonton Office of Traffic Safety (OTS) Co-authors: Yongsheng Chen, Ph.D.,
Attachment E: CADP Design Shadow Analysis
 Attachment E: CADP Design Shadow Analysis June 6, 2016 TO: Don Lewis San Francisco Planning Department 1650 Mission Street, Suite 400 San Francisco, CA 94103 SUBJECT: 2060 Folsom Street 17 th & Folsom
The last three sections of the main body of this report consist of:
 Threatened and Endangered Species Geological Hazards Floodplains Cultural Resources Hazardous Materials A Cost Analysis section that provides comparative conceptual-level costs follows the Environmental
Historical Patterns In Loss-of-Control Events At Specific Road Locations
 Historical Patterns In Loss-of-Control Events At Specific Road Locations Posting Date: April 2, 2018 As demonstrated in previous research by Gorski Consulting, police collision data is not likely to be
SYSTEMATIC EVALUATION OF RUN OFF ROAD CRASH LOCATIONS IN WISCONSIN FINAL REPORT
 SYSTEMATIC EVALUATION OF RUN OFF ROAD CRASH LOCATIONS IN WISCONSIN FINAL REPORT DECEMBER 2004 DISCLAIMER This research was funded by the Wisconsin Department of Transportation. The contents of this report
Unit 1, Lesson 3 What Tools and Technologies Do Geographers Use?
 Unit 1, Lesson 3 What Tools and Technologies Do Geographers Use? Geographers use a variety of tools and technologies in investigating geographic questions. Maps and globes both represent the earth, but
WHITE PAPER. Winter Tires
 WHITE PAPER Winter Tires WHITE PAPER Introduction According to the Federal Highway Administration accidents caused by winter weather result in 150,000 injuries and 2,000 deaths each year on average. In
MEP Y7 Practice Book B
 8 Quantitative Data 8. Presentation In this section we look at how vertical line diagrams can be used to display discrete quantitative data. (Remember that discrete data can only take specific numerical
Appendix B. Traffic Analysis Report
 Appendix B Traffic Analysis Report Report No. 14369/TR/WN02 August 2007 SALLINS BYPASS BYPASS OPTIONEERING ANALYSIS - TRAFFIC REPORT Kildare County Council Áras Chill Dara, Devoy Park, Naas, Co Kildare
Climate change in the U.S. Northeast
 Climate change in the U.S. Northeast By U.S. Environmental Protection Agency, adapted by Newsela staff on 04.10.17 Word Count 1,109 Killington Ski Resort is located in Vermont. As temperatures increase
YOUR VEHICLE WINDOWS
 REDUCED VISIBILITY WHENEVER VISIBILITY IS REDUCED DRIVERS NEED MORE TIME TO USE THE IPDE PROCESS. YOU CAN MAINTAIN A SAFE INTENDED PATH OF TRAVEL BY: SLOWING DOWN TO GIVE YOURSELF MORE TIME SCANNING IN
Your Task: Read each slide then use the underlined red or underlined information to fill in your organizer.
 Severe Weather: Tornadoes and Hurricanes Thunderstorms and Lightning S6E4 d. Construct an explanation of the relationship between air pressure, weather fronts, and air masses and meteorological events
Driving at night. Harris Driving school. Harris Driving School
 Harris Driving school Driving at night Harris Driving School Phone: 087 2448951 / 01 2868339 Email: info@harrisdrivingschool.ie Web: www.harrisdrivingschool.ie 1 Driving at Night You ll find you are very
Unit 1 Test - Version A
 Unit 1 Test - Version A 1. Approximately, how many degrees of longitude equal one time zone change? a. 5 b. 10 c. 15 d. 20 e. 25 2. The city of Lewisville has a population of 1,000 people living in 100
Texas A&M University
 Texas A&M University CVEN 658 Civil Engineering Applications of GIS Hotspot Analysis of Highway Accident Spatial Pattern Based on Network Spatial Weights Instructor: Dr. Francisco Olivera Author: Zachry
Tahlequah Public Schools Inclement Weather Transportation Plan
 Tahlequah Public Schools Inclement Weather Transportation Plan Inclement Weather with Ice and Snow From time to time throughout the school year, weather may force a change in the District s normal operating
MONTGOMERY COUNTY SNOW PLAN
 2018 2019 MONTGOMERY COUNTY SNOW PLAN COMMUNICATION DURING SNOW/ICE SITUATIONS Communication will be established prior/during all winter storms between the Sheriff s Office, Public Works Department, and
City of Camrose Winter Road Maintenance Policy
 City of Camrose Winter Road Maintenance Policy The purpose of this policy is to outline the level of service that the City of Camrose delivers regarding the maintenance of roads in winter conditions. 1.
PRELIMINARY DRAFT FOR DISCUSSION PURPOSES
 Memorandum To: David Thompson From: John Haapala CC: Dan McDonald Bob Montgomery Date: February 24, 2003 File #: 1003551 Re: Lake Wenatchee Historic Water Levels, Operation Model, and Flood Operation This
Organized Chain-Up and VSL
 Organized Chain-Up and VSL Jim Mahugh, PE WSDOT SC Region Traffic Engineer North/West Passage VSL Peer Exchange January 28, 2015 Snoqualmie Pass 2 Limits of VSL EB: MP 48.12 to 66.56 WB: MP 46.69 to 66.90
John A. Carlson Snow and Ice Removal
 John A. Carlson Snow and Ice Removal A. Introduction 1. The purpose of the Snow and Ice Removal Operation Plan is to provide all personnel who are involved in snow and ice removal a single source document,
FIGURE 1 Example schematic of flagging model. Study Design and Results
 DEER-FLAGGING MODELS Some experts believe that white-tailed deer raise their tails to expose their white undersurface as a warning communication between their species. One study was found that evaluated
Most people used to live like this
 Urbanization Most people used to live like this Increasingly people live like this. For the first time in history, there are now more urban residents than rural residents. Land Cover & Land Use Land cover
Tornadoes pose a high risk because the low atmospheric pressure, combined with high wind velocity, can:
 Tornadoes are powerful, circular windstorms that may be accompanied by winds in excess of 200 miles per hour. Tornadoes typically develop during severe thunderstorms and may range in width from several
Traffic Accident Analysis of Sun Glare and Twilight Shortly Before and after Sunset in Chiba Prefecture, Japan
 Traffic Accident Analysis of Sun Glare and Twilight Shortly Before and after in Chiba Prefecture, Japan Kenji Hagita a, Kenji Mori b a,b Traffic Science Division, National Research Institute of Police
Alaska Statewide Climate Summary November 2018
 Alaska Statewide Climate Summary November 2018 The following report provides an overview of the November 2018 weather. The report is based on preliminary data from selected weather stations throughout
Effect of Environmental Factors on Free-Flow Speed
 Effect of Environmental Factors on Free-Flow Speed MICHAEL KYTE ZAHER KHATIB University of Idaho, USA PATRICK SHANNON Boise State University, USA FRED KITCHENER Meyer Mohaddes Associates, USA ABSTRACT
Activity 5 Changes Ahoof?
 Activity 5 Changes Ahoof? Forces of Change >> Arctic >> Activity 5 >> Page 1 ACTIVITY 5 CHANGES AHOOF? COULD CLIMATE CHANGE AFFECT ARCTIC CARIBOU? Caribou or Reindeer? They are the same species, but called
Grant Opportunity Monitoring Bi-State Sage-grouse Populations in Nevada
 Grant Opportunity Monitoring Bi-State Sage-grouse Populations in Nevada Proposals are due no later than November 13, 2015. Grant proposal and any questions should be directed to: Shawn Espinosa @ sepsinosa@ndow.org.
Traffic and Road Monitoring and Management System for Smart City Environment
 Traffic and Road Monitoring and Management System for Smart City Environment Cyrel Ontimare Manlises Mapua Institute of Technology Manila, Philippines IoT on Traffic Law Enforcement to Vehicles with the
SUMMARY. ) t, UNIT. Constant velocity represents uniform motion. Acceleration causes a change in velocity.
 t, UNIT. Constant velocity represents uniform motion. Acceleration causes a change in velocity.") UNIT A SUMMARY KEY CONCEPTS CHAPTER SUMMARY 1 Constant velocity represents uniform motion. Distance and Displacement Position-time graphs Average speed and average velocity Positive, negative, and zero
UNIT A SUMMARY KEY CONCEPTS CHAPTER SUMMARY 1 Constant velocity represents uniform motion. Distance and Displacement Position-time graphs Average speed and average velocity Positive, negative, and zero
Geography Class 6 Chapters 3 and
 CHAPTER 3 MOTIONS OF THE EARTH The Earth is always travelling in Space. That makes each person on Earth, a Space Traveller. No one feels the movement of the Earth because humans are too tiny when compared
Implication of GIS Technology in Accident Research in Bangladesh
 Journal of Bangladesh Institute of Planners ISSN 2075-9363 Vol. 8, 2015 (Printed in December 2016), pp. 159-166, Bangladesh Institute of Planners Implication of GIS Technology in Accident Research in Bangladesh
UDOT Weather Program Traffic Operations Center
 UDOT Weather Program Traffic Operations Center Presentation Goals You MUST account for weather in your Traffic Management program Provide you with information on proven tools and strategies You NEED a
Annual Collision Report
 2016 Annual Collision Report Contents The Annual Collision Report is a summary of statistics associated with traffic collisions that occurred in the City of Winnipeg. This information is provided by Manitoba
Produced by Canadian Ice Service of. 2 December Seasonal Outlook Gulf of St Lawrence and East Newfoundland Waters Winter
 Environment Canada Environnement Canada Produced by Canadian Ice Service of Environment Canada 2 December 2010 Seasonal Outlook Gulf of St Lawrence and East Newfoundland Waters Winter 2010-2011 2010 Canadian
Choosing a Safe Vehicle Challenge: Analysis: Measuring Speed Challenge: Analysis: Reflection:
 Activity 73: Choosing a Safe Vehicle Challenge: Which vehicle do you think is safer? 1. Compare the features you listed in the data evidence section to the features listed on the worksheet. a. How are
Winter Maintenance on Ontario s Highways
 Ministry of Transportation Winter Maintenance on Ontario s Highways MTO Eastern Region November 18, 2015, Northumberland County Council Outline 1. Winter Maintenance Areas - Eastern Region 2. Winter Maintenance
MAPS AND THEIR CLASSIFICATION
 MAPPING MAPS AND THEIR CLASSIFICATION WHAT IS A MAP? A map is representation of the Earth's surface, showing how things are related to each other by distance, direction, and size. Maps are a way of showing
Town of Windsor. Department of Public Works
 Town of Windsor Department of Public Works 860.285.1855 TOWN OF WINDSOR PUBLIC WORKS SNOW REMOVAL PLAN In Windsor, as throughout the New England states, winter can bring a variety of weather conditions
In the Matter of the Study of State Police Stop Activity at the Southern end of the New Jersey Turnpike
 In the Matter of the Study of State Police Stop Activity at the Southern end of the New Jersey Turnpike We were retained by the ACLU of New Jersey to determine whether the New Jersey State Police (NJSP)
Innovations in Road Weather. Jon Tarleton Senior Marketing Manager / Meteorologist
 Innovations in Road Weather Jon Tarleton Senior Marketing Manager / Meteorologist How Do We Warn Them About This! 2 We have tried this before! Limited Success Visibility and wet pavement worked well Snow/ice
SNOW REMOVAL POLICY ITASCA COUNTY TRANSPORTATION DEPARTMENT
 ITASCA COUNTY TRANSPORTATION DEPARTMENT Effective Date: November 1, 1989 Revised: November 18, 2014 Policy Number: Operations 89-4 Distribution: Commissioner's Office Engineer's Office All Garages Number
Activity 2.2: Recognizing Change (Observation vs. Inference)
") Activity 2.2: Recognizing Change (Observation vs. Inference) Teacher Notes: Evidence for Climate Change PowerPoint Slide 1 Slide 2 Introduction Image 1 (Namib Desert, Namibia) The sun is on the horizon
Activity 2.2: Recognizing Change (Observation vs. Inference) Teacher Notes: Evidence for Climate Change PowerPoint Slide 1 Slide 2 Introduction Image 1 (Namib Desert, Namibia) The sun is on the horizon
Preparedness Safety Tips
 Preparedness Safety Tips Timely preparation can avert heavy personal, business and government expenditures. Experts agree that the following measures can be effective in dealing with the challenges of
USING THE MILITARY LENSATIC COMPASS
 USING THE MILITARY LENSATIC COMPASS WARNING This presentation is intended as a quick summary, and not a comprehensive resource. If you want to learn Land Navigation in detail, either buy a book; or get
Resolution Number: (2) Resolution Title: Snow Policy Date Signed: 11/26/12. DAVIS COUNTY Snow Policy Resolution
 Resolution Title: Snow Policy Date Signed: 11/26/12. DAVIS COUNTY Snow Policy Resolution") Resolution Number: 112612(2) Resolution Title: Snow Policy Signed: 11/26/12 DAVIS COUNTY Snow Policy Resolution A RESOLUTION TO ESTABLISH THE POLICY AND LEVEL OF SERVICE IN RESPECT TO CLEARANCE OF SNOW
Resolution Number: 112612(2) Resolution Title: Snow Policy Signed: 11/26/12 DAVIS COUNTY Snow Policy Resolution A RESOLUTION TO ESTABLISH THE POLICY AND LEVEL OF SERVICE IN RESPECT TO CLEARANCE OF SNOW
H IG HWAY WINTER OPERATIONS SNOW REMOVAL AND ICE CONTROL POLICY. Revised January 4, 2016
 ! H IG HWAY WINTER OPERATIONS SNOW REMOVAL AND ICE CONTROL POLICY Adopted January 11, 2010 Revised January 4, 2016 Pol icy It is the goal and intent of the Town of Sullivan to provide timely, efficient
AN ARTIFICIAL NEURAL NETWORK MODEL FOR ROAD ACCIDENT PREDICTION: A CASE STUDY OF KHULNA METROPOLITAN CITY
 Proceedings of the 4 th International Conference on Civil Engineering for Sustainable Development (ICCESD 2018), 9~11 February 2018, KUET, Khulna, Bangladesh (ISBN-978-984-34-3502-6) AN ARTIFICIAL NEURAL