Infrared L Band Observations of the Trapezium Cluster: A Census of Circumstellar Disks and Candidate Protostars
|
|
|
- Jemima McCarthy
- 5 years ago
- Views:
Transcription
1 To Appear in the December 2000 Astronomical Journal Infrared L Band Observations of the Trapezium Cluster: A Census of Circumstellar Disks and Candidate Protostars Charles J. Lada arxiv:astro-ph/ v1 17 Aug 2000 Harvard-Smithsonian Center for Astrophysics, 60 Garden Street, Cambridge, MA August A. Muench 1 Department of Astronomy, University of Florida, Gainesville, FL and Harvard-Smithsonian Center for Astrophysics, Cambridge, MA Karl E. Haisch Jr. Department of Astronomy, University of Florida, Gainesville, FL Elizabeth A. Lada Department of Astronomy, University of Florida, Gainesville, FL João F. Alves European Southern Observatory, Karl-Schwartzschild-Strasse 2, Garching Germany Eric V. Tollestrup 2 & S. P. Willner Harvard-Smithsonian Center for Astrophysics, 60 Garden Street, Cambridge, MA ABSTRACT We report the results of a sensitive near-infrared JHKL imaging survey of the Trapezium cluster in Orion. We use the JHKL colors to obtain a census of infrared excess stars in the cluster. Of (391) stars brighter than 12th magnitude in the K and L bands, 80% ± 7% are found to exhibit detectable infrared excess on the J-H, K-L color-color diagram. Examination of a subsample of 285 of these stars with published spectral types yields a slightly higher infrared excess fraction of 85%. We find that 97% of the optical proplyds in the cluster exhibit excess in the JHKL color-color diagram indicating that the most likely origin of the observed infrared excesses is from circumstellar disks. We interpret 1 Smithsonian Predoctoral Fellow 2 present address: Department of Astronomy, Boston University, Boston MA 02215
2 2 these results to indicate that the fraction of stars in the cluster with circumstellar disks is between 80-85%, confirming earlier published suggestions of a high disk fraction for this young cluster. Moreover, we find that the probability of finding an infrared excess around a star is independent of stellar mass over essentially the entire range of the stellar mass function down to the hydrogen burning limit. Consequently, the vast majority of stars in the Trapezium cluster appear to have been born with circumstellar disks and the potential to subsequently form planetary systems, despite formation within the environment of a rich and dense stellar cluster. We identify 78 stars in our sample characterized by K-L colors suggestive of deeply embedded objects. The spatial distribution of these objects differs from that of the rest of the cluster members and is similar to that of the dense molecular cloud ridge behind the cluster. About half of these objects are detected in the short wavelength (J and H) bands and these are found to be characterized by extreme infrared excess. This suggests that many of these sources could be protostellar in nature. If even a modest fraction fraction (i.e., 50%) these objects are protostars, then star formation could be continuing in the molecular ridge at a rate comparable to that which produced the foreground Trapezium cluster. Subject headings: clusters: galactic, circumstellar disks, Trapezium, star formation, infrared: stars 1. Introduction The discovery of small amplitude Doppler periodicities in the spectra of a number of nearby, sunlike, stars has established the existence of extra-solar planets beyond doubt (Marcy & Butler 1999). However, we do not yet know how common planetary systems are in the Galaxy. Obtaining a meaningful census via direct and indirect detections of planetary systems is a formidable challenge which will likely require the development of new technological capabilities such as precision photometric and astrometric observations from space. On the other hand, an estimate of the frequency of planetary systems is indirectly possible via observations of protoplanetary systems. Such observations are feasible with existing technology, even from the ground. The low inclinations and eccentricities of the planets around the sun have long suggested that the solar system formed in a disk of dust and gas which surrounded the sun in its earliest stages of evolution. Moreover, theory suggests that circumstellar disk formation is the natural consequence of star formation in rotating collapsing protostellar clouds (Shu, Adams & Lizano 1987) and that protoplanetary disks should be relatively common in the Galaxy. A protoplanetary disk is considerably easier to detect than a planetary system with a similar mass of solid material (Beckwith & Sargent 1996). Indeed, circumstellar disks have been directly and indirectly observed around numerous young stellar objects via optical, infrared, centimeter, and millimeter-wave observations (e.g., Beckwith 1999; Menard & Bertout 1999; Lada 1999a; Wilner et al. 2000) and even resolved
3 3 in optical and millimeter-wavelength images (McCaughrean & O Dell 1996; Dutrey et al. 1996). Thus obtaining a statistically meaningful census of circumstellar disks around young stars may be a very efficient first step toward determining the the frequency of planetary systems in the Galaxy. One particularly efficient method of producing meaningful measurements of disk frequencies around young stars is to obtain multi-wavelength, infrared imaging surveys of young stellar clusters. Circumstellar disks are bright infrared emitters and produce emission in excess of that emitted by the photospheres of young stars. Such infrared excess is readily measured with near-infrared imaging observations. Young clusters contain hundreds of young target stars spanning nearly the full range of stellar mass within a relatively small angular extent on the sky. Infrared imaging surveys can thus obtain a complete sampling of cluster members in relatively modest observing times. Infrared color-color diagrams, constructed from multi-wavelength imaging surveys, have been shown to be a useful tool for identifying infrared excesses and candidate circumstellar disks around stars in young clusters (Lada & Adams 1992). JHK color-color diagrams have been the most commonly employed to investigate infrared excess and circumstellar disk frequency in young clusters. Such studies have produced evidence which suggests that the frequency of infrared (JHK) excess sources decreases with cluster age on timescales on the order of only a few million years, and this potentially sets important constraints on both the lifetimes of circumstellar disks and the duration of the planet building phase within them (Lada & Lada 1995; Lada, Alves & Lada 1996; Lada 1999b). However, JHK observations do not extend to long enough wavelength to enable either a complete or unambiguous census of circumstellar disks in young clusters for two reasons. First, the magnitude of the near-infrared excess produced by a star/disk system depends on the parameters such as the disk inclination, accretion rate and presence and size of inner disk holes (Adams, Lada, & Shu 1987; Lada & Adams 1992; Meyer, Calvet & Hillenbrand 1997), and not all the star/disk systems in a young stellar population are expected to exhibit large enough excesses to be detected in a JHK color-color diagram (Lada & Adams 1992; Kenyon & Hartmann 1995; Hillenbrand et al. 1998). Second, a JHK excess can be produced by other phenomena such as extended emission from reflection nebulae and H II regions, which are common in regions of recent star formation (e.g., Haisch, Lada & Lada 2000, hereafter HLL). The magnitude of the infrared excess produced by a disk rapidly increases with wavelength, and L band (3.5 µm) is likely the optimum wavelength for detecting infrared excesses from protoplanetary disks with ground-based telescopes (HLL). Existing imaging detectors are capable of detecting the photospheres of relatively low mass stars in nearby regions, and circumstellar disks produce sufficiently strong L band excess that almost all stars that have disks can be identified with JHKL (or HKL) observations, independent of inclination, disk accretion rates, etc. (Kenyon & Hartmann 1995). Moreover, extraneous emission from reflection nebulae, HII regions, etc. is reduced at this wavelength. This paper is the second in a series which investigate the frequency and evolution of circumstellar disks using L band observations of nearby young clusters. The first paper (HLL) reported results
4 4 of an L band survey of NGC 2024, a heavily embedded and extremely young cluster in Orion. This paper reports the results of a JHK and L band imaging survey of the famous Trapezium cluster also in Orion. The Trapezium cluster is a very rich cluster within the Great Orion Nebula. Its members provide a statistically meaningful sample of nearly the entire spread of the stellar mass function. The cluster is somewhat older than NGC 2024 but not as embedded in molecular material, and it is much better studied over a wide range of wavelength (e.g., Herbig & Terndrup 1986; Churchwell et al. 1987; Felli et al. 1993; McCullough et al. 1995; Stauffer et al. 1994; Ali & DePoy 1995; Hillenbrand 1997). There is ample observational evidence for a large population of star/disk systems in the Trapezium cluster. Indeed, the resolved HST images of silhouetted disks within the cluster (McCaughrean & O Dell 1996) are perhaps the most compelling demonstration for the existence of circumstellar disks around young stars yet obtained. However, the size of the disk population in this cluster is uncertain. Around the O star θ 1 C Ori, centimeter-wave radio observations (Churchwell et al. 1987; Felli et al. 1993) and optical imaging both from the ground (Laques & Vidal 1979) and with HST (O Dell, Wen & Hu 1993) revealed what appear to be numerous photo-evaporating disks in the inner region of the cluster. A detailed comparison of these data with deep, high resolution infrared (I & K band) images suggested that the fraction of stars with disks in this part of the cluster is > 25-50% and could even be as high as 100% (Stauffer et al. 1994). A detailed analysis of near-infrared IJHK band observations of the larger ONC (Orion Nebula Cluster) by Hillenbrand et al. (1998) suggested a similarly high disk fraction, estimated to be 55-90%. This estimate was supported indirectly by observations of Ca II emission lines which suggested disk accretion occuring in about 70% of the stars in the larger cluster. Infrared L band observations could both confirm and considerably improve upon these estimates of disk frequencies. According to Hillenbrand et al. (1998) only 43 of 1600 visible stars in the ONC cluster have published L measurements and more complete L band observations...would provide more robust estimates of disk frequencies among both visible and optically obscured young stellar populations. Earlier, McCaughrean et al. (1996) briefly noted an estimate of 60-80% for the Trapezium disk fraction based on a very rough analysis of L band imaging observations, suggesting that more detailed L band data and analysis could indeed produce a relatively accurate disk census for the cluster. The L band imaging survey reported here confirms these expectations. We derive a significantly improved and very high disk frequency of %, for the Trapezium region. The stars in the Trapezium cluster formed at a relatively high rate (e.g., Lada, Alves & Lada 1996). The cluster is in very close proximity to, but not deeply embedded in, a dense molecular cloud. Its physical association with the molecular cloud raises the interesting issue of the extent to which star formation is still continuing in the cluster region. Recently, Palla & Stahler (1999) have presented evidence indicating that the star formation rate in this cluster has been accelerating with time. However, they postulate a sharp decline in the present day star formation rate due to O star formation. Have most of the stars which will be members of this cluster already formed?
5 5 Or is rapid star formation continuing to add significant numbers to the cluster population within the remaining molecular gas? Knowledge of the protostellar population in the cloud is essential to address these questions. Protostars are expected to exhibit large L band excesses and very red colors indicative of deeply embedded objects. Our L band observations are both long enough in wavelength and sufficiently sensitive to provide a preliminary reconnaissance of the protostellar population in this cluster/cloud region. Section 2 discusses the instrumentation employed for this experiment and the data acquisition and reduction procedures used. Section 3 describes the results and analysis of our observations and Section 4 discusses their implications. Section 5 summarizes the primary findings. 2. Observations 2.1. Instrumentation Observations of the Trapezium cluster were obtained at the Fred Lawrence Whipple Observatory on Mt. Hopkins, Arizona, using the 1.2m (48in) f/8 Ritchey-Chretien reflector telescope and in conjunction with SAO s dual channel infrared camera, STELIRCAM (Tollestrup & Willner 1998). STELIRCAM consists of two InSb detector arrays. Each is fed from a dichroic mirror that separates wavelengths longer and shorter than 1.9 µm into two independent imaging channels for simultaneous observations on the sky. Three separate magnifications can be selected by moving different cold lens assemblies into the beam. For our JHKL survey we selected a field of view of with a resolution of 0.6 per pixel. The magnification is the same for both arrays and both channels simultaneously view approximately the same field on the sky. For all of these observations, the J Barr (1.25 µm), H Barr (1.65 µm), K Barr (2.2 µm), and L Barr (3.5 µm) filters were used Data Acquisition and Reduction JHKL band images of the Trapezium cluster were obtained on 14, 15, and 16 December 1997 and JHL images on 04 and 05 November In both observing runs the cluster was imaged in a square mosaic pattern approximately centered on the O7 star HD (θ 1 C Orionis: R.A.= ; DEC.= ; J2000). The individual mosaic images consist of nine separate STELIRCAM fields arranged in a three by three grid. The 1997 fields were spatially overlapped by 34 ( 25% of the array) in both right ascension and declination providing for accurate positional placement of mosaiced fields as well as redundancy for the photometric measurements of sources located in the overlapped regions. The resulting mosaiced field covered an area of 36 arcmin 2 (i.e., 6.55 by 6.55 ) but because the two arrays were not exactly coincident on the sky the actual area covered simultaneously at all wavelengths was slightly smaller. Typically, the dual channel
6 6 camera was configured to obtain either simultaneous H and K band or J and L band observations. Nine off-cluster control fields were also observed in 1997 December to determine accurate sky and flat field calibration frames and measure the colors of field stars. The control fields for these observations were centered at R.A.= ; DEC.= J2000 and were determined to be free of molecular material by inspection of the Palomar Sky Survey Prints and the 100 micron dust opacity maps of Wood, Myers & Daugherty (1994). Our observing procedure was to intersperse observations of control fields with observations of cluster fields. Typically control field observations were obtained after three consecutive positions in the cluster mosaic were imaged. Each position in the mosaic was observed in a 9 point dither pattern with small, 12 offsets between dithers. The integration times and co-additions per dither were 15 seconds with 4 coadditions for J, H and K bands, and 0.1 seconds with 400 co-additions at L band, yielding total integration times of 9 minutes for JHK and 6 minutes at L band. Dark frames were observed at the beginning and end of each night, using the same combinations of integration times and co-additions as the observed images. Elias et al. (1982) infrared standard stars were observed throughout the night at JHKL wavelengths. These included HD , HD , HD 18881, HD 40335, HD 44612, HD 84800, HD Magnitudes are reported in the instrumental system of STELIRCAM. Large temporal background variations at L band (due to window dust, instrument/telescope flexture, and detector anomalies), coupled with the relatively long integration times employed and significant extended L band emission from the HII region made it difficult to determine accurate sky levels across the L band mosaic image. As a result the 1997 data proved to be of relatively poor photometric quality and could not be used to construct a mosaic image of sufficient quality to provide a useful image of extended nebulous emission. Therefore additional L band images were obtained in the telescope nodding mode on 4 and 5 November 1998 to improve the sky subtraction and our ability to faithfully image the extended L band emission from the Orion nebula. In this paper we only use this latter data set for the L band measurements. Short integration J and H observations were simultaneously obtained to extend the dynamic range of observations in those bands and improve the photometry of bright sources. For each field in the 3 x 3 mosaic grid observed in November 1998 we obtained a single exposure and then nodded the telescope to a sky position 450 west of the cluster where an identical exposure was obtained. After repeating this sequence for all 9 positions in the grid, the center of the grid was shifted by a small dither ( 5-10 in a random direction) and the entire mosaic was observed again. This was repeated a total of 18 times. For 9 passes the camera was configured to acquire simultaneous J and L band observations and for the remaining 9 passes H and L observations. The integration times for a single position were 1.0 second with 12 coadds at J and H bands and 0.1 seconds with 100 coadds at L band. The total integration time for each field was 3 minutes in the L band. Overlaps of 20 between positions in this mosaic provided a total area of approximately 7.0 by 7.0 at J,H and L bands, or slightly larger than the 1997 observations. These images
7 7 were observed only near transit, with a range of airmass of only 1.25 to However, since no L band standards were obtained for the November observations, the L band photometry was calibrated internally using 34 stars whose L band magnitudes were independently obtained from observations with the NASA Infrared Telescope Facility (IRTF) on Manua Kea Hawaii in February The resulting uncertainty in the calibrated L photometry was 0.05 magnitudes. For 14 stars with previous L band photometry in the literature the magnitudes agree with the calibrated November photometry to within the 0.05 magnitude calibration uncertainty. Finally, the entire set of November 1998 photometry was directly compared to the more noisy but independently calibrated 1997 December observations (for which simultaneous L band observations of standards were obtained) and found to agree but within a larger uncertainty due to the poor photometric quality of the 1997 data set. All data were reduced using standard routines in the Image Reduction and Analysis Facility (IRAF) and the Interactive Data Language (IDL). An average dark frame was constructed from the darks taken at the beginning and end of each night s observations. This dark frame was subtracted from all target observations to yield dark subtracted images. After appropriate linearization, all dark subtracted target frames were then processed by subtracting the appropriate sky frame and dividing by the flat field. For the 1997 observations, sky frames were constructed from the offcluster control field images by median filtering the nine dithered observations obtained at each off field position. Flat field frames were constructed by normalizing the median sky frames. For the nodded 1998 observations, sky frames were constructed by median combining the nearest 9 sky positions in time to the target observation. Each sky frame was checked to confirm that all stars had been removed by this process. The sky frames were then normalized to produce flat fields for each target frame. The resulting frames were individually inspected to ensure that the best sky subtraction and flat field had been used. Finally all target frames for a given position in the cluster were registered and combined to produce the final image of each field. Sources were extracted from each of our images using the automated source extractor DAOFIND in IRAF. The detection threshold was set to be 5 σ above the average sky noise in an image. Each image was then inspected by eye to recover sources missed by DAOFIND. Photometry was then obtained for all the identified sources using PSF fitting routines in the DAOPHOT package (Stetson 1987) in IRAF. The primary motivation for using PSF fitting photometry was to mitigate the effect of small scale variations in the background sky due to the extended emission of the Orion nebula. This was made possible by use of special sky-fitting routines within the DAOPHOT package as briefly described below. For the JHK images twenty bright, unsaturated and isolated stars were selected in each of the nine individual images for the construction of a master PSF for that mosaic position. For the L band observations a single PSF was constructed for the entire mosaic image from 30 bright, unsaturated and isolated stars within the mosaic field. This was possible because the PSF did not vary across the mosaic due to the manner in which the observations were obtained. (As described earlier, the entire 3 x 3 mosaic was observed in one pass with short (10 seconds) individual integration times. The
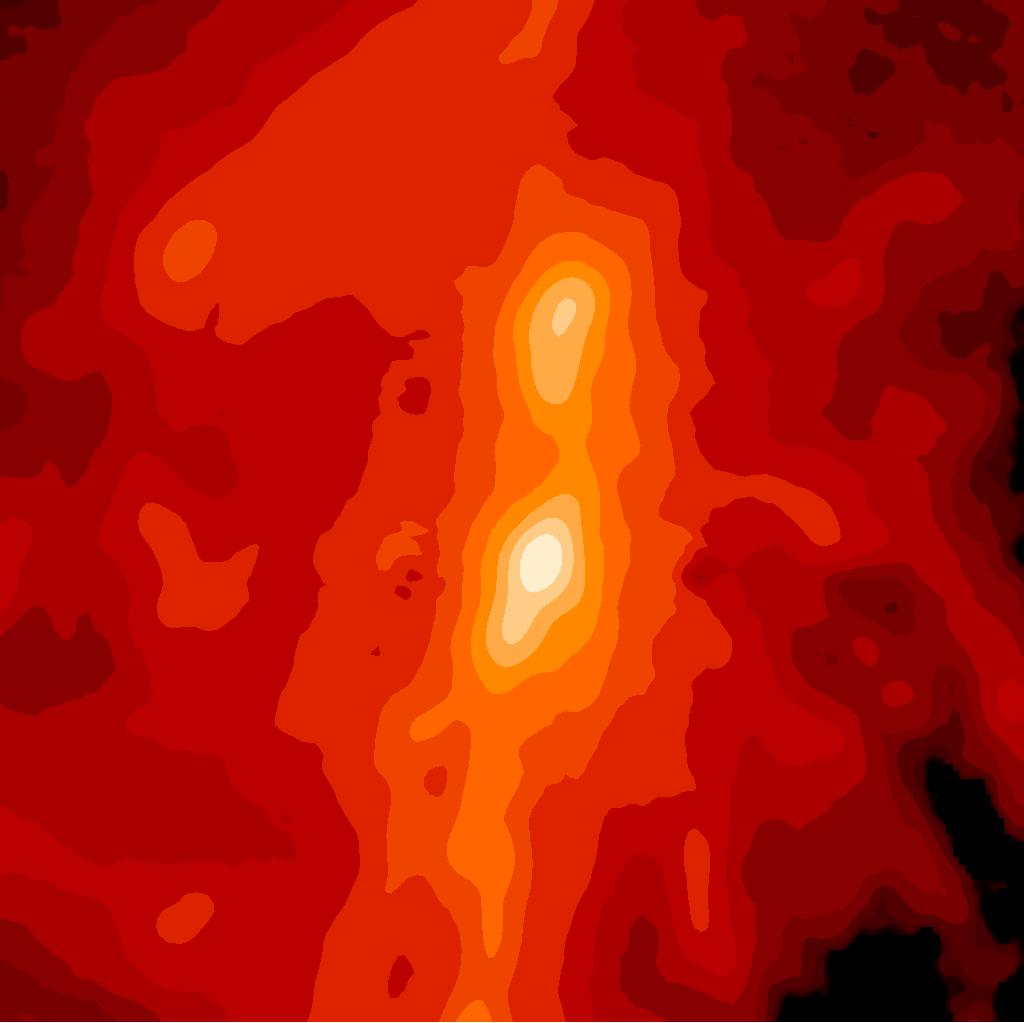
8 8 final mosaic was constructed from median filtering 18 separate passes.) Sky-fitting routines were employed to improve the subtraction of nebulous emission from the stellar profiles. These routines iteratively obtain estimates for the local sky by removal of target stars and re-measurement of the residual sky (Parker 1991). Artificial stars added to a very nebulous K band image showed a factor of two improvement in the photometric errors with the sky-fitting option. All sources were placed in a single positional grid. Absolute positions for our survey stars were established by comparison with the positions for 45 infrared sources determined by K. Luhman (private communication). The relative positional uncertainty in the derived coordinates was found to be 0.2 arc seconds. The entire data base of our survey observations, including complete photometry and positions of all sources will be published in a separate contribution (Muench et al. 2000). 3. Results and Analysis 3.1. Images Figure 1a shows our JHK mosaic image of the Trapezium cluster. This is a false color image with J band coded as blue, H band as green and K band as red. The image is displayed in the standard orientation with North at the top and West on the right. The four famous Trapezium stars are in the center of the image. The distinctive reddish nebulosity northwest of the Trapezium stars marks the location of the well known Kleinmann-Low/IRC2 protostellar region. Figure 1b shows the L band mosaic image constructed from our observations. Extended L band emission is evident throughout the region with the well known bright bar prominent in the southeast. The extended L band nebulosity is due to emission from a prominent dust emission feature at 3.3 microns which originates from small grains (PAHs) which are excited by UV radiation from the OB stars in the cluster (e.g., Sellgren 1981; Duley & Williams 1981; Geballe et al. 1989). Comparison of the two images shows a clear displacement of the position of the bar in the L band image relative to the JHK image. The L band emission is located further downstream from the exciting Trapezium stars than the J band emission which dominates the emission in the JHK image. While the J band emission traces the ionized gas of the HII region, the L band emission appears to originate within the photodissociation region at the interface between the HII region and the molecular cloud from which the cluster is emerging (Geballe et al. 1989; Roche, Aitken & Smith 1989). Another interesting extended feature apparent in the L band map is a long and thin cometlike structure which appears to emanate from one of the infrared sources approximately 56 arc seconds to the east and 14 arc seconds to the north of θ 1 C Ori. This source is located within a narrow dark filament at the bottom edge of the well known dark bay which is prominently seen in optical images (for example, see the HST WFPC image of Orion Nebula). In Figure 2 we show a close up view of this feature in both the L and J bands. The narrow dark filament or lane is clearly evident in the J band image, although there is no trace of the cometary structure. The
9 9 cometary feature appears most clearly in the L band image and is extended at a position angle of 313 o from the infrared source, nearly orthogonal to the dark filament. The cometary tail extends for roughly 21 or 9400 AU from the star and is very red, hardly visible in the K or H band images. Although morphologically similar to many of the proplyds observed by HST in this nebula, the L band cometary feature is considerably longer than any of the optical proplyds and moreover does not point back to θ 1 C Ori, the primary ionizing source of the proplyd population. In addition the associated stellar component is identified as a non-nebulous star in the proplyd survey of O Dell and Wong (1996), and it does not appear as a radio source in the Felli et al. (1993 ) survey. On the other hand, this star has a strong L band infrared excess indicative of a circumstellar disk. This cometary feature could be a jet ejected by the star/disk system at its apex, but its very red color would be still difficult to explain. Our data do not allow us to further constrain the nature of this interesting feature. Narrow-band images (e.g., H 2 ) could reveal shock excited emission within this object and test the interesting proposition that it may be a jet. Within the region surveyed, we detected above our 10 σ detection limits 548 L sources (m L < 12.0), 729 K sources (m K < 16.8), 695 H sources (m H < 17.7), and 600 J sources (m J < 18.5). Of these 10 sigma detections, 595 were simultaneously detected at JHK, 490 simultaneously at JHKL and 46 only at HK. Five sources were detected only at L band. Overall a total of 734 distinct sources were detected Color-Color Diagrams: The Infrared Excess Fraction Figures 3 and 4 show the JHK and JHKL color-color diagrams for those (391) sources with both K and L < 12 magnitudes. By selecting sources in this way, our survey only includes those sources whose photospheres are detectable at both K and L bands. This insures a meaningful determination of the excess/disk fraction in this cluster. Almost all the stars with K < 12 magnitudes have photometric uncertainties less than 0.1 magnitudes in the J, H and K bands. The typical source in our sample is also characterized by photometric uncertainties less than 0.2 magnitudes at L band. Furthermore, we excluded from our sample any source with an uncertainty greater than 0.25 magnitudes at L band. The solid curve is the locus of colors corresponding to main sequence stars which range in spectral type from early O to M5 (Bessell & Brett 1988). The solid straight line extending from the main sequence curve is the locus of colors of classical T Tauri stars (Meyer, Calvet & Hillenbrand 1997). The three dashed parallel lines define the reddening bands for main sequence stars and classical T Tauri stars (CTTS), respectively. These lines are parallel to the reddening vector given by the Cohen et al. (1981) reddening law which we have adopted for this study. All stars which fall to the right of the main sequence reddening band possess infrared excess and are circumstellar disk candidates. In the JHK diagram 50% ± 7% of the stars are found to display colors indicative of infrared (K band) excess. In the JHKL diagram, 80% ± 7% of the stars
10 10 are found to have infrared (L band) excess. The fraction of stars falling in the excess region of the color-color diagram is sensitive to the adopted reddening law and to a lesser extent to the photometric system used to derive the reddening law. We have determined JHK and JHKL excess fractions for two other reddening laws (obtained in different photometric systems) (Koornneef 1983; Rieke & Lebofsky 1985) and find JHK excess fractions of 50% and 49% and JHKL excess fractions of 78% and 75%, respectively. These values are within the quoted (statistical) uncertainties of our determinations using the Cohen et al. (1981) extinction law in the STELIRCAM photometric system The K-L Distribution: Candidate Protostars Many of the reddest and most heavily extincted stars will not be detectable at J or H band and will not appear in the color-color diagrams. Therefore it is useful to examine the distribution of K-L colors of the stars in our survey. Figure 5 displays the frequency distribution of K-L color for the 603 stars in our sample detected in both bands. Fifty-seven of these objects were not detected at either J or H. The distribution of the 603 stars detected in both bands has a broad but prominent peak at K-L 0.9 magnitudes. This distribution is very similar to that in NGC 2024 derived by HLL. There is no peak near zero color similar to that found by Kenyon & Hartmann (1995) for YSOs in Taurus and characteristic of non-excess or diskless (Class III or WTTS) stars. The shift of the peak to relatively large K-L color is primarily due to infrared excess emission and to a lesser extent to reddening. It would require about 25 magnitudes of visual extinction to produce a K-L color of 1.0 magnitude in a naked, diskless star but examination of the color-color diagrams shows that the vast majority of stars in the cluster have extinctions well under 10 visual magnitudes. Thus, for the Trapezium cluster, the presence of infrared excess emission is the primary cause of this shift to larger values of the K-L color. In the Taurus population of YSOs, objects with K-L > 1.5 magnitudes are almost always protostellar in nature (Kenyon & Hartmann 1995). In order to compile a catalog of potential protostellar objects in the Trapezium region we consider those sources in our survey with similarly large K-L colors. In the Trapezium we find 94 stars with K-L > 1.5. Of these, 59 (63%) are also detected in the J and H bands. Twenty-one of these latter objects possess anomalous colors in the JHKL color-color diagram (see discussion in 3.4 below), likely due to source variability, and/or photometry contaminated by unresolved stellar pairs. These sources are not likely to be protostellar objects. However, 28 of the 38 non-anomalous very red sources detected in all four bands are located to the right of the CTTS reddening band above the termination of the (unreddened) CTTS locus. Sources in this part of the color-color diagram possess extreme excess emission which is often characteristic of protostellar (Class I; see Lada (1999a)) objects. Such sources are frequently embedded in bright infrared reflection nebulae which can shift otherwise heavily reddened sources into this region of color-color diagram by depressing the J-H color relative to the K-L color. Sources in this region therefore can be appropriately considered as candidate protostars. The remaining
11 11 10 very red sources detected in all bands are located for the most part high within the CTTS reddening band. The colors of these sources are also consistent with those of protostellar objects, and they can also be considered as reasonable candidates for protostellar status. There are 35 sources with K-L > 1.5 that were not detected in either J or H band (and cannot be placed on the color- color diagram). These are also candidate protostars. Although some of these sources could be non-protostellar objects that are more embedded than stars of similar K-L color in Taurus, it would take approximately 40 magnitudes of visual extinction to produce a K-L color of 1.5 magnitudes for a naked star and at least 15 magnitudes for a Class II PMS star with a disk. Finally, there are also 5 objects detected only in L band, and limits on their K-L color significantly exceed 1.5 magnitudes. Altogether we identify 78 candidate protostars from the list of sources with K-L colors in excess of 1.5 magnitudes. The positions and JHKL photometry for these 78 candidate protostars are listed in Table 1. Figure 6 (a and b) compares the spatial distribution of the 78 protostellar candidates with that of the cluster membership as a whole. Inspection of Figure 6a suggests that the protostellar candidates are more spatially confined within the mapped area than are the general cluster members. Figure 6b compares the surface density distribution of the protostellar candidates with that of all other stars in the cluster. The two distributions are clearly different. The surface density distribution of the general cluster membership is dominated by a single peak, coincident with the Trapezium stars. Away from this peak the distribution falls smoothly off with a slight elongation toward the northwest. In contrast, the surface density distribution of the protostellar candidates is characterized by a more spatially extended and elongated maximum which appears double peaked and is clearly offset from the Trapezium stars (and the peak of the cluster surface density distribution). In addition the overall protostellar surface density distribution appears more elongated than that of the general cluster membership with an orientation in the southwest to northeast direction. Figure 7 compares the distribution of the protostellar candidates with that of millimeter-wave continuum emission from dust in the background molecular cloud (Johnstone & Bally 1999). The protostellar candidate sources have a distribution which is for the most part, coincident with and very similar in extent to that of dust in the well known molecular ridge at the back edge of the cluster. This spatial correspondence with the molecular cloud suggests that this group of sources is physically related to the molecular cloud and more deeply embedded in it than typical cluster members. This is consistent with the identification of these sources as potential protostars. Because protostellar objects can also be characterized by K-L colors < 1.5 magnitudes and can fall into the CTTS region of the color-color diagram, our estimate of the total protostellar population could be a lower limit. On the other hand, it is not clear what fraction of sources located to the right of the plotted CTTS locus and/or with K-L > 1.5 are true protostars. We note that a number of proplyds and a few late type stars fall to the right of the CTTS locus (see section 4.0 below) and they are not likely to be protostellar in nature. Whether or not a significant fraction of the candidate protostars in Table 1 are true protostellar objects remains to be determined. Longer wavelength infrared observations with good spatial resolution are necessary
12 12 to enable a more robust indentification of protostellar objects in this cluster Stars with Anomalous K-L Colors In the JHKL color-color diagram approximately 27 sources (7% of the sample) have colors which place them in forbidden regions either to the left of the main sequence reddening band or below and to the right of the CTTS reddening band. (Figure 8 shows the locations of the various zones the JHKL color-color diagram of the Trapezium cluster.) This is almost three times as many sources as the ten sources which fall into similar regions of the JHK color-color diagram. The typical causes for the presence of stars in these two forbidden regions are large photometric errors and contamination of photometry due to unresolved binaries. Of the 27 anomalous sources, 5 are near our L band detection limit and likely characterized by relatively large photometric L band uncertainties. Most of these sources are in the forbidden zone to the left of the main sequence reddening band. Another 4 objects were found to be blended stars or sources which were found to be multiple objects in the Hillenbrand (1997) database but are unresolved in our images. Thus these two effects account for at least a third of the anomalous sources. For our data set another factor that could result in a star s placement in one of the forbidden regions is source variability. This is because the L band observations used in our survey were obtained roughly a year after the JHK observations. To evaluate the possibility of variability as a cause of anomalous stellar colors we compared our JHK observations with those in the compilation of Hillenbrand et al (1998). Of the 256 sources with JHK magnitudes in both our catalog and the Hillenbrand et al. compilation, 25 or 10% had fluxes which differed in all three wavelength bands by more than 0.2 magnitudes. Of these 12 (or 5% of the entire sample of 256 sources) differed by more than 0.5 magnitudes in all three bands. Thus source variability could be responsible for placing as many as 5-10% of the sources in our sample in the anomalous regions of the color-color diagram and this factor alone could account for all the sources with anomalous colors. Indeed, 10 of the 27 sources in the two forbidden zones did vary by more than 0.2 magnitudes in the comparison of our JHK data set with that of Hillenbrand et al. Finally, it is very unlikely that variability can account for the vast majority of infrared sources located in the excess region (CTTS and protostellar) of the JHKL color-color diagram since the expected fraction of variables (5-10%) is small compared to the fraction of infrared excess stars and, moreover, already can account for the all sources in the forbidden regions. 4. Discussion Combining L band photometry with JHK observations has enabled us to determine a more robust estimate of the fraction of stars with infrared excess in the Trapezium than has hitherto been possible. Formally we measure an excess fraction of 80% ± 7%. Examination of our control fields
13 13 suggests that contamination by background sources with m K < 12 is insignificant, especially given the large extinction provided by the Orion Molecular Cloud. Thus, the excess fraction we measure corresponds to the excess fraction of the cluster membership. If the infrared excesses originate in circumstellar disks, then the vast majority of stars in the Trapezium cluster are presently surrounded by and consequently were formed with circumstellar disks. Our measurements, therefore, appear to confirm earlier suggestions of a high disk frequency in this young cluster (Stauffer et al. 1994; Hillenbrand et al. 1998). The assumption of a disk origin for the measured infrared excesses is bolstered by examination of the observed JHKL colors of sources otherwise known to be star/disk systems both in the Taurus dark clouds and the Trapezium cluster itself. For example, HLL analyzed observations obtained and compiled by Kenyon & Hartmann (1995) of known star/disk (class II) sources in the Taurus clouds and found JHKL and JHK excess fractions of 100% and 69%, respectively. We derive very similar statistics from our JHKL colors of the proplyd population in the Trapezium cluster. Proplyds are small but resolved nebulous sources observed in optical HST images around numerous stars in the Trapezium cluster (O Dell, Wen & Hu 1993; O Dell & Wong 1996). Theoretical considerations indicate that these nebulous objects are most likely photoevaporating envelopes of circumstellar disks (Johnstone, Hollenbach & Bally 1998; Bally et al. 1998) indicating that the associated stars have such disks. In our imaging survey we found infrared sources associated with 112 of 139 proplyds listed by (O Dell & Wong 1996) for the area covered by our images. Of these 112, 96 were simultaneously detected in the JHKL bands and Figure 9 shows their positions in the JHKL color-color diagram. We find 97% of the proplyd stars to have infrared excess. Furthermore we find that only 70% of the proplyds exhibit infrared excess in the JHK color-color diagram. Together these results indicate that JHKL observations are capable of indentifying most, if not all, the circumstellar disk sources in a stellar population. (The close correspondence of JHK and JHKL excess fractions between class II sources in Taurus and proplyds in Orion confirms that source variability has probably not had a significant effect on our ability to measure excess produced by circumstellar disks in the Trapezium cluster.) The overall distributions of Trapezium excess sources in both the JHK and JHKL infrared color-color diagrams (Figures 3 & 4) are very similar to the corresponding distributions of both the proplyd population in the Trapezium cluster (Figure 9) and class II sources in the Taurus cloud (see Figure 8 of HLL). The overall behavior of the Trapezium excess sources in the JHK and JHKL diagrams is also consistent with the predictions of circumstellar disk models (Meyer, Calvet & Hillenbrand 1997). Taken together these facts appear to provide compelling evidence that the infrared excess sources in the Trapezium cluster represent a population of circumstellar disk systems and that JHKL observations provide an accurate census of that population. As mentioned earlier, there is a population of radio sources in the cluster whose emission is also thought to arise in the ionized envelopes of photoevaporated disks (Churchwell et al. 1987; Felli et al. 1993). We detected infrared counterparts for 39 of the 50 VLA sources within the boundaries of our imaging survey. Thirty-three were detected in all four infrared bands. Their locations are shown
14 14 on the color-color diagram in Figure 9. Most of them are associated with proplyds, independently confirming the identification of the radio sources as photoevaporating disks. Not surprisingly, we find that 87% of the VLA sources have infrared excesses. This fraction is somewhat lower than that for the proplyd population and may indicate that some of the radio sources are associated with diskless stars. Indeed, none of the radio sources without infrared excess is associated with a proplyd. Published spectral types are available for 285 stars within the region we imaged (Hillenbrand et al. 1998). With knowledge of these spectral types an improved estimate of the disk fraction can be made for this cluster. The vast majority (80%) of these spectroscopically observed stars are characterized by spectral types M3 and earlier. Since we have set the boundary of the reddening band at the color of an M5 star, the excess fraction we have derived for the cluster as a whole (80%) from our JHKL observations likely underestimates the true excess fraction. Figure 10 shows the color-color diagram for all the M stars in our imaged region identified by Hillenbrand (1997). Two different boundaries for the main sequence reddening band are drawn at the locations of an M3 and M5 star, respectively. Stars with spectral types later than M3 are represented as solid circles, while stars with spectral types between M0 and M3 are represented by open symbols. The fraction of M0-M3 stars that fall in the infrared excess region bounded by the (appropriate) M3 reddening band is 87% ± 12% and the fraction of M4-M6 stars found in the reddening band bounded by the M5 boundary is 82% ± 17%. Although the same within the respective uncertainties, these fractions are both formally higher than the 80% determined for the whole population measured from the M5 reddening boundary. Moreover, the fraction of O-M3 stars that fall into the excess region as measured from the M3 boundary, is 84% ± 8%. Although all the above estimates agree within the uncertainties, the results suggest that the actual infrared excess/disk fraction in the Trapezium cluster is close to 85% and somewhat higher than our original formal estimate of 80%. More significantly, the high excess fraction is independent of the spectral type or mass of stars in the cluster. Table 2 lists the excess/disk fractions as a function of spectral type (counting from the M5 boundary). Circumstellar disks appear to form with equally high frequency (within the uncertainties) around all stars with spectral types of F and later, essentially across the entire span of the stellar initial mass function down to the hydrogen burning limit. This is similar to the situation in NGC 2024 where HLL found the disk fraction to also be independent of stellar mass. The earliest type stars in the Trapezium, however, appear to have a lower disk frequency than the later type stars, although the number of stars in the sample with spectral types A or earlier is small. The overall disk frequency we measure for the Trapezium is essentially the same as that (86%) derived by HLL from similar L band observations of the NGC 2024 cluster which is also located in Orion at the same distance from the sun. Both clusters are very young, although the members of NGC 2024 are more deeply embedded, and suffer more differential extinction than the Trapezium stars. Taken together the measurement of similarly high disk frequencies in the two clusters suggests that disk formation is a natural consequence of star formation for all stellar
15 15 masses even in the environment of a dense stellar cluster. Moreover, the timescale for significant inner disk evolution must be longer than the age of the Trapezium cluster, about 10 6 years. In contrast, JHK observations of NGC 2362 and optical spectroscopic studies of the λ Ori suggest very low disk frequencies (< 5%: Alves et al. 2000; Dolan & Mathieu 1999) for those clusters. This in turn suggests that significant inner disk evolution does occur on timescales shorter than yrs, the estimated mean ages of these clusters. Because this important timescale constrains the duration of planet building within circumstellar disks, a more robust determination of it is clearly desirable. We anticipate improved estimates once L band observations of more clusters in our sample are analyzed. There are 78 potential protostars in the Trapezium out of some 603 stars detected in both K and L bands (Table 1). The fraction of protostellar (candidate) sources in the Trapezium is about 13%, which is similar to the protostellar candidate fraction of about 14% derived from L band observations of NGC 2024 by HLL. For a cluster age of years, the lifetime of the protostellar stage would be approximately 10 5 years in the Trapezium if all the candidate sources turned out actually to be protostars. This is typical (within factors of 2) of protostellar lifetimes found in Taurus, Ophiuchus, and NGC Stated another way, if a significant fraction (i.e., 50%) of the protostellar candidates in the Trapezium are true protostars, with lifetimes comparable to those in other regions, then our observations are consistent with a relatively constant star formation rate in the cluster up to the current epoch. Thus, star formation could be continuing in the molecular cloud behind the Orion Nebula a rate similar to that which gave rise to the foreground cluster! The molecular ridge behind the Trapezium is part of a more extended molecular cloud which connects with the OMC 1, OMC 2, and OMC 3 clouds to the north. The extended ridge is also a site of intense protostellar activity containing at least a dozen Class 0 objects and outflow sources (Chini et al. 1997; Yu, Bally & Devine 1997; Johnstone & Bally 1999). This suggests a similarly high rate of star formation in the extended ridge, given that the lifetimes of Class 0 objects are about an order of magnitude shorter than those of Class I protostars. Recently Palla & Stahler (1999) have re-analyzed the ages for the stars in the Orion Nebula Cluster and have suggested that the rate of star formation in this region has been accelerating with time with the most vigorous episode taking place in the last two million years. They have also suggested that the formation of O stars in the cluster should squelch further star formation with the result that the star formation rate should be drastically decreased at present or in the near-future. Palla and Stahler estimate that the timescale for this steep decline should be less than 10 6 years. If the above estimate of the protostellar population is close to the true size, then it appears that the predicted rapid decline has not yet occured (primarily because the O stars have not completely cleared the region of dense star forming gas). However, our identifications of protostars in the Trapezium region are not secure, and longer wavelength observations are necessary to obtain a more accurate estimate of the protostellar population in the cluster and a more robust determination of the current star formation rate in the cloud behind it.
16 16 5. Summary We have obtained a sensitive L band (3.4 µm) survey of a 36 arcmin 2 region centered on the Trapezium cluster in Orion. We have used these observations in conjunction with new JHK imaging observations of the same region to produce a relatively unambiguous census of the circumstellar disk population in the cluster and to compile a list of candidate protostars within the region. The primary results and conclusions derived from our study can be summarized as follows: 1. We detected 391 stars in the surveyed region with K and L < 12.0 magnitudes. From analysis of the JHKL color-color diagram we find that 80% ± 7% of the stars exhibit detectable excess emission and are likely surrounded by circumstellar disks. A subsample of 285 of these stars for which there are published spectral types, has a slightly higher excess/disk fraction of 85%. More significantly, within our statistical uncertainties, this high excess/disk fraction is independent of spectral type for stars with spectral types between F-M. Thus the probability of disk formation around a star at the time of its birth is both extremely high and independent of stellar mass across essentially the entire stellar mass spectrum down to the hydrogen burning limit. The disk fraction (42%) for the higher mass O, B and A stars is lower however, and may suggest either a lower probability for disk formation or more rapid disk dispersal times for these stars. Overall the results presented in this paper confirm and improve upon previous studies which also suggested a high disk fraction in the cluster. 2. Of known proplyds in our surveyed region, 97% have infrared L band excess. The fraction of radio continuum emitting stellar systems with L band excess is found to be 87%. These results provide additional confirmation for our identification of infrared excess sources with circumstellar disks, and they illustrate the effectiveness of L band observations for obtaining an accurate census of star/disk systems in the cluster. 3. The disk fraction in the Trapezium cluster is very similar to that (86% ± 8%) recently obtained from a sensitive L band survey of NGC 2024, the other rich and very young embedded cluster in Orion (Haisch, Lada & Lada 2000). Thus our results confirm the findings of the NGC 2024 study, which suggested that, independent of mass, stellar birth in the environment of a rich and dense cluster does not diminish the probability of disk formation around a new star. Indeed, in both these clusters, the vast majority of stars, spanning essentially the entire range of the stellar mass function, were born with circumstellar disks and consequently the potential to form planetary systems. Moreover, the high disk frequencies found in these two clusters indicate that disk lifetimes are on the order of the age of the clusters, 10 6 years, or longer. 4. Seventy-eight of the sources in our survey possess K-L colors typical of deeply embedded (A V magnitudes) young stellar objects. Only about half of these stars are detectable at the J and H bands, but most of these are characterized by extreme infrared excess falling outside the CTTS region (see Figure 3 & 4) of the JHKL color-color diagram. The spatial distribution of these very red stars is very similar to that of the dense molecular ridge behind the cluster. These properties are characteristic of protostellar objects, and we identify these objects as candidate
17 17 protostars (Class I objects). If the size of the protostellar population is even a modest fraction of our candidate protostar sample, then star formation may be continuing within the molecular ridge at a rate similar to that which produced the stars in the foreground Trapezium cluster. Sensitive, longer wavelength observations with good spatial resolution are necessary to determine the fraction of L band candidates that are truly protostellar in nature and evaluate the present level of star forming activity in the Trapezium region. We thank Doug Johnstone for providing us with the 850 µm map of the OMC 1 region. EAL acknowledges support from a Research Corporation Innovation Award and a Presidential Early Career Award for Scientists and Engineers (NSF AST ). AM is a Smithsonian Predoctoral Fellow. K.E.H. gratefully acknowledges support from a NASA Florida Space Grant Fellowship and an ISO grant through JPL # We also acknowledge support from an ADP (WIRE) grant NAG REFERENCES Adams, F.C., Lada, C.J. & Shu, F.H. 1987, ApJ, 312, 788. Ali, B. & DePoy, D.L. 1995, AJ, 110, Alves, J., Lada, C.J., Lada, E.A., & Muench, A.A in preparation. Bally, J., Sutherland, R.S., Devine, D. & Johnstone, D AJ, 116, 293. Beckwith, S.V.W. 1999, in The Origin of Stars and Planetary Systems, eds. C.J. Lada & N.D. Kylafis, Kluwer: Dordrecht, p Beckwith, S.V.W., & Sargent, A.I. 1996, Nature, 383, 139. Bessell, M.S. & Brett, J.M PASP, 100, Chini, R., Reipurth, B., Ward-Thompson, D., Bally, J., Nyman, L.A., Sievers, A., & Billawala, Y. 1997, ApJ, 474, 135. Churchwell, E.B., Felli, M., Wood, D.O.S. & Massi, M. 1987, ApJ, 321, 516. Cohen, J.G., Frogel, J.A., Persson, S.E. & Elias, J.H ApJ, 249, 500. Dolan, C.J. & Mathieu, R.D. 1999, AJ, 118, Dougados, C., Léna, P., Ridgeway, S.T., Christou, J.C., & Probst, R.G., 1993, ApJ, 406, 112. Duley, W.W., & Williams, D.A. 1981, MNRAS, 196, 269.
18 18 Dutrey, A., Guilloteau, S. Duvert, G., Prato, L., Simon, M., Schuster, K. & Menard, F. 1996, A&A, 309, 493. Elias, J.H., Frogel, J.A., Matthews, K. & Neugebauer, G. 1982, AJ, 87, Felli, M. Taylor, G.B., Catarzi, M., Churchwell, E.B., & Kurtz, S. 1993, å, 101, 127. Geballe, T.R., Tielens, A.G.G.M., Allamandola, L.J., Moorhouse, A. & Brand, P.W.J.L. 1989, ApJ, 341, 278. Haisch, K.E., Lada E.A. & Lada, C.J. 2000, AJ, (submitted March 2000). Hayward, T.L. & McCaughrean, M.J AJ,113, 346. Herbig G.H. & Terndrup D.M. 1986, ApJ, 307, 609. Hillenbrand, L.A. 1997, AJ, 113, Hillenbrand, L.A., Strom, S.E., Calvet, N., Merrill, K.M., Gatley, I., Makidon, R.B., Meyer, M.R., & Skrutskie, M.F., 1998 AJ, 116, 118. Johnstone, D., Hollenbach, D. & Bally J ApJ, 449, 758. Johnstone, D. & Bally J ApJ, 510, 49. Kenyon, S.J. & Hartmann, L. 1995, ApJS, 101, 117. Koornneef, J A&A, 128, 84. Lada, C.J. & Adams, F. C. 1992, ApJ, 393, 278. Lada, C.J. 1999a, in The Origin of Stars and Planetary Systems, eds. C.J. Lada & N.D. Kylafis, Kluwer: Dordrecht, p Lada, C.J., Alves, J.A., & Lada, E.A. 1996, AJ, 111, Lada, E.A. 1999b, in The Origin of Stars and Planetary Systems, eds. C.J. Lada & N.D. Kylafis, Kluwer: Dordrecht, p Lada, E.A. & Lada, C.J. 1995, AJ, 109, Laques, P. & Vidal, J.-L. 1979, å, 73, 97. Marcy, G.W., & Butler, R.P. 1999, in The Origins of Stars and Planetary Systems, eds. C.J. Lada & N.D. Kylafis, Kluwer: Dordrecht, p McCullough, P.R. et al. 1995, ApJ, 438, 394. Meyer, M.R., Calvet, N., & Hillenbrand, L.A. 1997, AJ, 114, 233.
19 19 McCaughrean, M.J. & O Dell, C.R. 1996, AJ, 111, McCaughrean, M.J., Rayner, J., Zinnecker, H. & Stauffer, J. 1996, in Disks and Outflows Around Young Stars, eds. Steven Beckwith, Jakob Staude, Axel Quetz & Antonella Natta, Springer- Verlag: Berlin, p. 33. Menard, F. & Bertout, C. 1999, in The Origin of Stars and Planetary Systems, eds. C.J. Lada & N.D. Kylafis, Kluwer: Dodrecht, p Muench, A.A., Alves, J., Haisch, K., Lada, C.J. & Lada, E.A. 2000, in preparation. Mundy, L.G., Scoville, N., Bååth, L.B., Masson, C.R., & Woody, D.P. 1986, ApJ, 304, L51. O Dell, C.R., Wen, Z. & Hu, X. 1993, ApJ, 410, 696. O Dell, C.R. & Wong, S.K. 1996, AJ, 111, 846. Palla, F. & Stahler, S.W. 1999, ApJ, 525, 772. Parker, J.W.M. 1991, PASP, 103, 243. Rieke, G. & Lebofsky, M ApJ, 288, 618. Roche, P.F., Aitken, D.K. & Smith, C.H. 1989, MNRAS, 236, 485. Sellgren, K. 1981, ApJ, 245, 138. Shu, F.H., Adams, F.C., & Lizano, S. 1987, ARA&A25, 23. Stauffer, J.R., Prosser, C.F., Hartmann, L. & McCaugrean M.J AJ, 108, Stetson, P.B PASP, 99, Tollestrup, E.V. & Willner, S.P. 1998, Proceedings of SPIE, 3354, 502. Wilner, D.J., Ho, P.T.P., Kastner, J.H. & Rodriguez. L.F. 2000, ApJ, in press. Wood, D.O.S., Myers, P.C. & Daugherty, D.A. 1994, ApJS, 95, 457. Yu, K.C., Bally, J. & Devine, D. 1997, ApJ, 485, 45. This preprint was prepared with the AAS L A TEX macros v5.0.
20 20 Table 1. Candidate Protostellar Sources. ID RA (J2000) DEC (J2000) L J-H H-K K-L Candidates detected at only 3.5µm a > > > > > 2.87 JHKL Candidates: K-L > 1.5; J-H >
21 21 Table 1 Continued ID RA (J2000) DEC (J2000) L J-H H-K K-L KL Candidates: No J or H, K-L >
22 22 Table 1 Continued ID RA (J2000) DEC (J2000) L J-H H-K K-L a K-L upper limits calculated assuming K > 14.0 magnitude.
23 23 Table 2. IR Excess Fraction vs Spectral Type Spectral Type(s) 1 N Region 2 N Detect 3 JHK Excess (%) JHKL Excess (%) 4 OBA FG K M M0 - M M4 - M All Spectral types taken from Hillenbrand (1997). 2 Number of stars with Spectral Types within survey boundaries. 3 Number of stars with Spetcral Types and JHKL Photometry. 4 Counting from the M5 boundary of the reddening band and using the Cohen et al. (1981) IR reddening law.
24 24 Figure Captions Fig. 1. a) A false color JHK image of the Trapezium region within the Great Orion Nebula. K band (2.2 µm) emission is coded as red, H band (1.65 µm) emission as green and J band (1.25 µm) emission as blue. b) The L band (3.5 micron) mosaic image of the Trapezium cluster Both images were constructed from the 3 3 mapping mosaic described in the text and have resolutions of 0.6 /pixel with seeing of FWHM. Fig. 2. a) Close up L band image of the extended comet or jet-like feature found northeast of θ 1 C Ori and under the Dark Bay prominent in optical images of the Trapezium cluster. Also plotted are contours of relative surface brightness which are spaced at intervals of dex. b) J band image of the same field. The cometary feature does not appear on the J band image although a dark lane which is roughly orthogonal to it is very prominent. Relative surface brightness contours of the dark lane are plotted spaced and in intervals of 0.15 dex. Fig. 3. JHK color-color diagram for the Trapezium cluster. The locus of points representing the intrinsic infrared colors of main sequence stars is represented by a solid curved line. The locus of intrinsic colors of giant stars is represented as a dotted line which partially overlaps with the main sequence locus. The locus of unreddened Classical T Tauri star colors (Meyer, Calvet & Hillenbrand 1997) is represented by a solid straight line. Dot-dashed lines represent the boundaries of the two reddening bands and are parallel to the reddening vector. The length of the arrow, also drawn parallel to the reddening vector, corresponds to the displacement produced by 10 magnitudes of visual extinction. Stars which fall to the right of the main sequence reddening band possess infrared excess. This diagram plots the positions of all stars in our survey with K and L magnitudes < 12.0 and with L band photometric uncertainties < Fig. 4. JHKL color-color diagram of all Sources with K = L < 12.0 and with L errors < Otherwise same as figure 3. Fig. 5. Frequency distribution of all sources in our survey detected in both the K and L bands. Those sources lacking either J or H band photometry are indicated. Fig. 6. a) Spatial distributions of cluster sources (open circles) and candidate protostars (filled circles). The protostellar candidates appear to be more spatially confined than the main cluster population. Large white stars label the locations of bright stars with spectral types B3 and earlier. Large black stars mark the positions of sources detected only at L band. b) Surface density distributions of cluster sources (grey scale) and candidate protostars (contours). The two distributions are clearly different. These maps were constructed from star counts obtained by sampling the source distributions at the Nyquist interval with a square box 0.1 pc (51.6 arc sec) in size. For the grey scale plot, the levels are spaced at intervals of 500 stars pc 2 starting from a level of 750 stars pc 2. For the contour map the contours are spaced at intervals of 100 stars pc 2 starting from a level of 350 stars pc 2. The peaks in the two distributions reach values of 4250 and 750 stars pc 2, respectively.
25 25 Fig. 7. Comparison of the distribution of protostellar candidate sources with the 850µm SCUBA map from Johnstone and Bally (1999). Symbols are the same as in Figure 6. In addition, the CS J = 1 2 continuum sources from Mundy et al (1986) are plotted with triangles and the locations of the IRC2 and BN-KL proto-stellar sources (Dougados et al. 1993) are shown with crosses. The north-south distribution of the candidate proto-stellar objects closely follows the dust continuum map which traces the location of the dense star forming gas in the OMC-1 cloud complex. Fig. 8. JHKL color-color diagram of the cluster with the positions of sources with anomalous colors indicated by filled circles. The various zones of the diagram discussed in the text are also shown. Fig. 9. JHKL color-color diagram for all detected proplyd (O Dell & Wong 1996) and radio sources (Felli et al. 1993). Examination of this diagram shows that 97% of the optical proplyds exhibit infrared excess emission. This excess emission originates in circumstellar disks around the proplyd stars and this plot illustrates the effectiveness of using the JHKL color-color diagram to identify circumstellar disk sources. Filled circles inside of open circles represent radio sources identified as proplyds. Examination of the figure indicates that 87% of the radio emitting stars possess infrared excess which originates in circumstellar disks. Fig. 10. The locations of M stars in the JHKL color-color diagram. Spectral types were taken from Hillenbrand (1997). A total of 121 of 129 M0-M3 stars and 56 of 62 M4-M6 stars were detected at all JHK and L wavelengths. Plotted are four reddening vector boundaries set by the colors of giants, M3/A0 dwarfs, M5 dwarfs and the tip of the CTTS locus, respectively.
26 26
27 27
28 28
29 29
30 30
Near-Infrared Imaging Observations of the Orion A-W Star Forming Region
 Chin. J. Astron. Astrophys. Vol. 2 (2002), No. 3, 260 265 ( http: /www.chjaa.org or http: /chjaa.bao.ac.cn ) Chinese Journal of Astronomy and Astrophysics Near-Infrared Imaging Observations of the Orion
arxiv:astro-ph/ v1 26 Jan 2001
 Submitted to Astron. J. Circumstellar Disks in the IC 348 Cluster Karl E. Haisch Jr. 1,2 and Elizabeth A. Lada 2,3 Dept. of Astronomy, University of Florida, 211 SSRB, Gainesville, FL 32611 arxiv:astro-ph/0101486v1
Star Formation. Spitzer Key Contributions to Date
 Star Formation Answering Fundamental Questions During the Spitzer Warm Mission Phase Lori Allen CfA John Carpenter, Caltech Lee Hartmann, University of Michigan Michael Liu, University of Hawaii Tom Megeath,
Star Formation. Answering Fundamental Questions During the Spitzer Warm Mission Phase
 Star Formation Answering Fundamental Questions During the Spitzer Warm Mission Phase Lori Allen CfA John Carpenter, Caltech Lee Hartmann, University of Michigan Michael Liu, University of Hawaii Tom Megeath,
Part III: Circumstellar Properties of Intermediate-Age PMS Stars
 160 Part III: Circumstellar Properties of Intermediate-Age PMS Stars 161 Chapter 7 Spitzer Observations of 5 Myr-old Brown Dwarfs in Upper Scorpius 7.1 Introduction Ground-based infrared studies have found
Disk Frequencies and Lifetimes in Young Clusters
 To appear in Ap.J. Letters Disk Frequencies and Lifetimes in Young Clusters Karl E. Haisch Jr. 1,2,3,4 and Elizabeth A. Lada 3,5 Dept. of Astronomy, University of Florida, 211 SSRB, Gainesville, FL 32611
Submillimeter studies of circumstellar disks in Taurus and Orion
 Revealing the Molecular Universe: One Telescope is Never Enough ASP Conference Series, Vol. VOLUME, 2006 D. C. Backer & J. L. Turner Submillimeter studies of circumstellar disks in Taurus and Orion Jonathan
Star formation : circumstellar environment around Young Stellar Objects
 Bull. Astr. Soc. India (2005) 33, 327 331 Star formation : circumstellar environment around Young Stellar Objects Manoj Puravankara Inter-University Centre for Astronomy and Astrophysics, Pune - 411007,
Lecture 26 Low-Mass Young Stellar Objects
 Lecture 26 Low-Mass Young Stellar Objects 1. Nearby Star Formation 2. General Properties of Young Stars 3. T Tauri Stars 4. Herbig Ae/Be Stars References Adams, Lizano & Shu ARAA 25 231987 Lada OSPS 1999
A Tale of Star and Planet Formation. Lynne Hillenbrand Caltech
 A Tale of Star and Planet Formation Lynne Hillenbrand Caltech Vermeer s The Astronomer (1688) Mauna Kea (last week) photos by: Sarah Anderson and Bill Bates Context: Our Sun The Sun is a completely average
Two new T Tauri stars and a candidate FU Orionis star associated with Bok globules
 Astron. Astrophys. 320, 167 171 (1997) ASTRONOMY AND ASTROPHYSICS Two new T Tauri stars and a candidate FU Orionis star associated with Bok globules J.L. Yun 1, M.C. Moreira 1, J.F. Alves 1, and J. Storm
AST 6336, Interstellar Medium, Spring 2015
 AST 6336, Interstellar Medium, Spring 2015 Young stellar clusters (lectures by Nicola Da Rio ndario@ufl.edu) January 2, 4, 2015 Star formation A molecular cloud may become unsupported gas pressure + magnetic
Astr 2310 Thurs. March 23, 2017 Today s Topics
 Astr 2310 Thurs. March 23, 2017 Today s Topics Chapter 16: The Interstellar Medium and Star Formation Interstellar Dust and Dark Nebulae Interstellar Dust Dark Nebulae Interstellar Reddening Interstellar
Stellar Birth. Stellar Formation. A. Interstellar Clouds. 1b. What is the stuff. Astrophysics: Stellar Evolution. A. Interstellar Clouds (Nebulae)
") Astrophysics: Stellar Evolution 1 Stellar Birth Stellar Formation A. Interstellar Clouds (Nebulae) B. Protostellar Clouds 2 C. Protostars Dr. Bill Pezzaglia Updated: 10/02/2006 A. Interstellar Clouds 1.
Astrophysics: Stellar Evolution 1 Stellar Birth Stellar Formation A. Interstellar Clouds (Nebulae) B. Protostellar Clouds 2 C. Protostars Dr. Bill Pezzaglia Updated: 10/02/2006 A. Interstellar Clouds 1.
Introduction to SDSS -instruments, survey strategy, etc
 Introduction to SDSS -instruments, survey strategy, etc (materials from http://www.sdss.org/) Shan Huang 17 February 2010 Survey type Status Imaging and Spectroscopy Basic Facts SDSS-II completed, SDSS-III
Analyzing Spiral Galaxies Observed in Near-Infrared
 Analyzing Spiral Galaxies Observed in Near-Infrared Preben Grosbøl European Southern Observatory Karl-Schwarzschild-Str. 2, D-85748 Garching, Germany Abstract A sample of 54 spiral galaxies was observed
The Protostellar Luminosity Function
 Design Reference Mission Case Study Stratospheric Observatory for Infrared Astronomy Science Steering Committee Program contacts: Lynne Hillenbrand, Tom Greene, Paul Harvey Scientific category: STAR FORMATION
Topics for Today s Class
 Foundations of Astronomy 13e Seeds Chapter 11 Formation of Stars and Structure of Stars Topics for Today s Class 1. Making Stars from the Interstellar Medium 2. Evidence of Star Formation: The Orion Nebula
Clicker Question: Clicker Question: What is the expected lifetime for a G2 star (one just like our Sun)?
?") How Long do Stars Live (as Main Sequence Stars)? A star on Main Sequence has fusion of H to He in its core. How fast depends on mass of H available and rate of fusion. Mass of H in core depends on mass
How Long do Stars Live (as Main Sequence Stars)? A star on Main Sequence has fusion of H to He in its core. How fast depends on mass of H available and rate of fusion. Mass of H in core depends on mass
AST 101 INTRODUCTION TO ASTRONOMY SPRING MIDTERM EXAM 2 TEST VERSION 1 ANSWERS
 AST 101 INTRODUCTION TO ASTRONOMY SPRING 2008 - MIDTERM EXAM 2 TEST VERSION 1 ANSWERS Multiple Choice. In the blanks provided before each question write the letter for the phrase that best answers the
A near?infrared study of the Orion Nebula with DENIS. around the Trapezium obtained with the DENIS camera during the protosurvey period.
 A near?infrared study of the Orion Nebula with DENIS. E. COPET 1, D. ROUAN 1, N.EPCHTEIN 1 1 Observatoire de Paris-DESPA, Meudon, France ABSTRACT. We present new near-infrared star counts in the J and
PMS OBJECTS IN THE STAR FORMATION REGION Cep OB3. II. YOUNG STELLAR OBJECTS IN THE Ha NEBULA Cep B
 Astrophysics, Vol. 56, No. 2, June, 2013 PMS OBJECTS IN THE STAR FORMATION REGION Cep OB3. II. YOUNG STELLAR OBJECTS IN THE Ha NEBULA Cep B E. H. Nikoghosyan Models for the spectral energy distributions
Guiding Questions. The Birth of Stars
 Guiding Questions The Birth of Stars 1 1. Why do astronomers think that stars evolve (bad use of term this is about the birth, life and death of stars and that is NOT evolution)? 2. What kind of matter
The HII Regions of Sextans A
 Publications of the Astronomical Society of the Pacific 6: 765-769, 1994 July The HII Regions of Sextans A Paul Hodge 1 Astronomy Department, University of Washington, Seattle, Washington 98195 Electronic
Stars, Galaxies & the Universe Lecture Outline
 Stars, Galaxies & the Universe Lecture Outline A galaxy is a collection of 100 billion stars! Our Milky Way Galaxy (1)Components - HII regions, Dust Nebulae, Atomic Gas (2) Shape & Size (3) Rotation of
The Milky Way Galaxy. Some thoughts. How big is it? What does it look like? How did it end up this way? What is it made up of?
 Some thoughts The Milky Way Galaxy How big is it? What does it look like? How did it end up this way? What is it made up of? Does it change 2 3 4 5 This is not a constant zoom The Milky Way Almost everything
Formation and Evolution of Planetary Systems
 Formation and Evolution of Planetary Systems Meyer, Hillenbrand et al., Formation and Evolution of Planetary Systems (FEPS): First Results from a Spitzer Legacy Science Program ApJ S 154: 422 427 (2004).
Guiding Questions. Stellar Evolution. Stars Evolve. Interstellar Medium and Nebulae
 Guiding Questions Stellar Evolution 1. Why do astronomers think that stars evolve? 2. What kind of matter exists in the spaces between the stars? 3. What steps are involved in forming a star like the Sun?
Young stellar objects and their environment
 Recent Advances in Star Formation: Observations and Theory ASI Conference Series, 2012, Vol. 4, pp 107 111 Edited by Annapurni Subramaniam & Sumedh Anathpindika Young stellar objects and their environment
Chapter 11 The Formation and Structure of Stars
 Chapter 11 The Formation and Structure of Stars Guidepost The last chapter introduced you to the gas and dust between the stars that are raw material for new stars. Here you will begin putting together
Physics Homework Set 2 Sp 2015
 1) A large gas cloud in the interstellar medium that contains several type O and B stars would appear to us as 1) A) a reflection nebula. B) a dark patch against a bright background. C) a dark nebula.
18. Stellar Birth. Initiation of Star Formation. The Orion Nebula: A Close-Up View. Interstellar Gas & Dust in Our Galaxy
 18. Stellar Birth Star observations & theories aid understanding Interstellar gas & dust in our galaxy Protostars form in cold, dark nebulae Protostars evolve into main-sequence stars Protostars both gain
Stellar evolution Part I of III Star formation
 Stellar evolution Part I of III Star formation The interstellar medium (ISM) The space between the stars is not completely empty, but filled with very dilute gas and dust, producing some of the most beautiful
Transiting Exoplanet in the Near Infra-red for the XO-3 System
 Transiting Exoplanet in the Near Infra-red for the XO-3 System Nathaniel Rodriguez August 26, 2009 Abstract Our research this summer focused on determining if sufficient precision could be gained from
CARBON MONOXIDE EMISSION FROM NEBULOSITY ASSOCIATED WITH HERBIG Be AND Ae TYPE STARS
 1973ApJ185L67L THE ASTROPHYSICAL JOURNAL, 185:L67-L70, 1973 October 15 1973 The American Astronomical Society All rights reserved Printed in USA CARBON MONOXIDE EMISSION FROM NEBULOSITY ASSOCIATED WITH
The Interstellar Medium. Papillon Nebula. Neutral Hydrogen Clouds. Interstellar Gas. The remaining 1% exists as interstellar grains or
 The Interstellar Medium About 99% of the material between the stars is in the form of a gas The remaining 1% exists as interstellar grains or interstellar dust If all the interstellar gas were spread evenly,
arxiv:astro-ph/ v1 20 Nov 2003
 Astronomy & Astrophysics manuscript no. ngc2316 June 11, 2018 (DOI: will be inserted by hand later) Near infrared imaging of NGC 2316 P. S. Teixeira 1, S. R. Fernandes 1, J. F. Alves 2, J. C. Correia 1,
Constraining the Evolution of Molecular Gas in Weak-Line T-Tauri Stars. 1. Motivation
 Constraining the Evolution of Molecular Gas in Weak-Line T-Tauri Stars 1. Motivation The formation of planets from protoplanetary disks is greatly influenced by the presence or absence of gas in these
The Fate of Discs in Dense Star Clusters
 Hoher List, 2. December 2006 The Fate of Discs in Dense Star Clusters The Perspective Universität zu Köln, I. Physikalisches Institut UNIVERSITÄT Motivation protoplanetary discs: important for late stages
Payne-Scott workshop on Hyper Compact HII regions Sydney, September 8, 2010
 Payne-Scott workshop on Hyper Compact HII regions Sydney, September 8, 2010 Aim Review the characteristics of regions of ionized gas within young massive star forming regions. Will focus the discussion
Scientists Make Highest Resolution Photos Ever of the Night Sky
 Embargoed for Release until Aug 21 noon EDT Scientists Make Highest Resolution Photos Ever of the Night Sky Astronomers at the University of Arizona, Arcetri Observatory in Italy, and at the Carnegie Observatory
AST4930: Star and Planet Formation. Syllabus. AST4930: Star and Planet Formation, Spring 2014
 AST4930: Star and Planet Formation Lecture 1: Overview Assoc. Prof. Jonathan C. Tan jt@astro.ufl.edu Bryant 302 Syllabus AST4930: Star and Planet Formation, Spring 2014 Assoc. Prof. Jonathan C. Tan (jt
FLAMINGOS SPECTROSCOPY OF NEW LOW-MASS MEMBERS OF THE YOUNG CLUSTER IC 348
 The Astrophysical Journal, 618:810 816, 2005 January 10 # 2005. The American Astronomical Society. All rights reserved. Printed in U.S.A. FLAMINGOS SPECTROSCOPY OF NEW LOW-MASS MEMBERS OF THE YOUNG CLUSTER
Energy Sources of the Far IR Emission of M33
 Energy Sources of the Far IR Emission of M33 Hinz, Reike et al., ApJ 154: S259 265 (2004). Presented by James Ledoux 24 µm 70 µm 160 µm Slide 1 M33 Properties Distance 840kpc = 2.7 Mlyr (1'' ~ 4 pc) Also
High Redshift Universe
 High Redshift Universe Finding high z galaxies Lyman break galaxies (LBGs) Photometric redshifts Deep fields Starburst galaxies Extremely red objects (EROs) Sub-mm galaxies Lyman α systems Finding high
Extrasolar Planets: Molecules and Disks
 Extrasolar Planets: Molecules and Disks The basic question: Is our solar system typical of what we should affect around other stars (inhabited or not), or is it an unusual freak? One approach is to look
The Birth Of Stars. How do stars form from the interstellar medium Where does star formation take place How do we induce star formation
 Goals: The Birth Of Stars How do stars form from the interstellar medium Where does star formation take place How do we induce star formation Interstellar Medium Gas and dust between stars is the interstellar
Our Galaxy. Milky Way Galaxy = Sun + ~100 billion other stars + gas and dust. Held together by gravity! The Milky Way with the Naked Eye
 Our Galaxy Milky Way Galaxy = Sun + ~100 billion other stars + gas and dust Held together by gravity! The Milky Way with the Naked Eye We get a special view of our own galaxy because we are part of it!
High Energy Processes in Young Stellar Objects
 High Energy Processes in Young Stellar Objects Ji Wang Department of Astronomy, University of Florida, Gainesville, Fl 32601 jwang@astro.ufl.edu Received ; accepted 2 ABSTRACT In this paper, I present
Energy. mosquito lands on your arm = 1 erg. Firecracker = 5 x 10 9 ergs. 1 stick of dynamite = 2 x ergs. 1 ton of TNT = 4 x ergs
 Energy mosquito lands on your arm = 1 erg Firecracker = 5 x 10 9 ergs 1 stick of dynamite = 2 x 10 13 ergs 1 ton of TNT = 4 x 10 16 ergs 1 atomic bomb = 1 x 10 21 ergs Magnitude 8 earthquake = 1 x 10 26
V International Astronomy Olympiad
 EURO-ASIAN ASTRONOMICAL SOCIETY V International Astronomy Olympiad 20-27. 10. 2000. SAO RAS, Nizhnij Arkhyz Theoretical round. Problems to solve Group A. 1. As you know, the most widely used calendar in
The in-orbit wavelength calibration of the WFC G800L grism
 The in-orbit wavelength calibration of the WFC G800L grism A. Pasquali, N. Pirzkal, J.R. Walsh March 5, 2003 ABSTRACT We present the G800L grism spectra of the Wolf-Rayet stars WR45 and WR96 acquired with
T Tauri Phase of Young Brown Dwarfs
 T Tauri Phase of Young Brown Dwarfs Ray Jayawardhana University of Toronto Primary collaborators:subu Mohanty, Aleks Scholz, David Barrado y Navascues, Gibor Basri Key Observational Question: Do Young
Chapter 9. The Formation and Structure of Stars
 Chapter 9 The Formation and Structure of Stars The Interstellar Medium (ISM) The space between the stars is not completely empty, but filled with very dilute gas and dust, producing some of the most beautiful
Age Distributions of Low Mass Stars in the Rho Ophiuchi and Upper Scorpius Associations
 Age Distributions of Low Mass Stars in the Rho Ophiuchi and Upper Scorpius Associations John Keller University of Missouri St. Louis Dr. Bruce Wilking Abstract The young star forming molecular cloud of
Universe Now. 9. Interstellar matter and star clusters
 Universe Now 9. Interstellar matter and star clusters About interstellar matter Interstellar space is not completely empty: gas (atoms + molecules) and small dust particles. Over 10% of the mass of the
Stellar Life Cycle in Giant Galactic Nebula NGC 3603
 Stellar Life Cycle in Giant Galactic Nebula NGC 3603 edited by David L. Alles Western Washington University e-mail: alles@biol.wwu.edu Last Updated 2009-11-20 Note: In PDF format most of the images in
Interstellar Medium and Star Birth
 Interstellar Medium and Star Birth Interstellar dust Lagoon nebula: dust + gas Interstellar Dust Extinction and scattering responsible for localized patches of darkness (dark clouds), as well as widespread
The HST Set of Absolute Standards for the 0.12 µm to 2.5 µm Spectral Range
 Instrument Science Report CAL/SCS-010 The HST Set of Absolute Standards for the 0.12 µm to 2.5 µm Spectral Range L. Colina, R. Bohlin, D. Calzetti, C. Skinner, S. Casertano October 3, 1996 ABSTRACT A proposal
6. Interstellar Medium. Emission nebulae are diffuse patches of emission surrounding hot O and
 6-1 6. Interstellar Medium 6.1 Nebulae Emission nebulae are diffuse patches of emission surrounding hot O and early B-type stars. Gas is ionized and heated by radiation from the parent stars. In size,
Exploring the substellar IMF in the Taurus cloud
 Mem. S.A.It. Vol. 76, 253 c SAIt 2005 Memorie della Exploring the substellar IMF in the Taurus cloud New brown dwarfs in the Taurus star forming region S. Guieu 1, C. Dougados 1, J.-L. Monin 1,4, E. Magnier
The Milky Way Galaxy and Interstellar Medium
 The Milky Way Galaxy and Interstellar Medium Shape of the Milky Way Uniform distribution of stars in a band across the sky lead Thomas Wright, Immanuel Kant, and William Herschel in the 18th century to
Astronomy 1 Fall 2016
 Astronomy 1 Fall 2016 Lecture11; November 1, 2016 Previously on Astro-1 Introduction to stars Measuring distances Inverse square law: luminosity vs brightness Colors and spectral types, the H-R diagram
Measuring Radial Velocities of Low Mass Eclipsing Binaries
 Measuring Radial Velocities of Low Mass Eclipsing Binaries Rebecca Rattray, Leslie Hebb, Keivan G. Stassun College of Arts and Science, Vanderbilt University Due to the complex nature of the spectra of
The skin of Orion. Molecular Astrophysics: The Herschel and ALMA era PRESS RELEASE
 Molecular Astrophysics: The Herschel and ALMA era PRESS RELEASE The skin of Orion 9- October- 2015 Imaging Orion in ionized carbon emission. Among the brightest emissions from the interstellar medium and
PhD course originally developed by René Liseau Updated to Master level course by Alexis Brandeker
 Part III Early stages in stellar tll evolution PhD ii ll d l db R éli PhD course originally developed by René Liseau Updated to Master level course by Alexis Brandeker Early stages in stellar tll evolution
arxiv:astro-ph/ v1 21 Nov 2005
 Spitzer Observations of IC 348: The Disk Population at 2-3 Million Years. Charles J. Lada, August A. Muench, K. L. Luhman, Lori Allen, Lee Hartmann, Tom Megeath, Philip Myers & Giovanni Fazio arxiv:astro-ph/0511638v1
arxiv:astro-ph/ v2 30 Apr 2003
 A Census of the Young Cluster IC 348 1 K. L. Luhman 2, John R. Stauffer 3, A. A. Muench 4, G. H. Rieke 5, E. A. Lada 6, J. Bouvier 7, and C. J. Lada 8 ABSTRACT arxiv:astro-ph/0304409v2 30 Apr 2003 We presentanew
Our Galaxy. We are located in the disk of our galaxy and this is why the disk appears as a band of stars across the sky.
 Our Galaxy Our Galaxy We are located in the disk of our galaxy and this is why the disk appears as a band of stars across the sky. Early attempts to locate our solar system produced erroneous results.
Photometric Studies of GEO Debris
 Photometric Studies of GEO Debris Patrick Seitzer Department of Astronomy, University of Michigan 500 Church St. 818 Dennison Bldg, Ann Arbor, MI 48109 pseitzer@umich.edu Heather M. Cowardin ESCG/Jacobs
PART 3 Galaxies. Gas, Stars and stellar motion in the Milky Way
 PART 3 Galaxies Gas, Stars and stellar motion in the Milky Way The Interstellar Medium The Sombrero Galaxy Space is far from empty! Clouds of cold gas Clouds of dust In a galaxy, gravity pulls the dust
High mass star formation in the Herschel era: highlights of the HOBYS key program
 Recent Advances in Star Formation ASI Conference Series, 2012, Vol. 4, pp 55 62 Edited by Annapurni Subramaniam & Sumedh Anathpindika High mass star formation in the Herschel era: highlights of the HOBYS
Keeping an Eye on the Young: Monitoring T Tauri Stars
 Keeping an Eye on the Young: Monitoring T Tauri Stars T Tauri stars are young (0.5-5 Myr), low mass (0.1-1 solar mass) stars. They are typically found in close association with the gas & dust clouds out
Number of Stars: 100 billion (10 11 ) Mass : 5 x Solar masses. Size of Disk: 100,000 Light Years (30 kpc)
 Mass : 5 x Solar masses. Size of Disk: 100,000 Light Years (30 kpc)") THE MILKY WAY GALAXY Type: Spiral galaxy composed of a highly flattened disk and a central elliptical bulge. The disk is about 100,000 light years (30kpc) in diameter. The term spiral arises from the external
THE MILKY WAY GALAXY Type: Spiral galaxy composed of a highly flattened disk and a central elliptical bulge. The disk is about 100,000 light years (30kpc) in diameter. The term spiral arises from the external
Astro Fall 2012 Lecture 8. T. Howard
 Astro 101 003 Fall 2012 Lecture 8 T. Howard Measuring the Stars How big are stars? How far away? How luminous? How hot? How old & how much longer to live? Chemical composition? How are they moving? Are
Chapter 11 The Formation of Stars
 Chapter 11 The Formation of Stars A World of Dust The space between the stars is not completely empty, but filled with very dilute gas and dust, producing some of the most beautiful objects in the sky.
arxiv:astro-ph/ Mar 2000
 Accepted by The Astronomical Journal for July 2000 Publication High Resolution Near-Infrared Spectra of Protostars Thomas P. Greene 1 NASA / Ames Research Center M.S. 245-6, Moffett Field, CA 94035-1000
ASTRONOMY. Chapter 18 THE STARS: A CELESTIAL CENSUS PowerPoint Image Slideshow
 ASTRONOMY Chapter 18 THE STARS: A CELESTIAL CENSUS PowerPoint Image Slideshow FIGURE 18.1 Variety of Stars. Stars come in a variety of sizes, masses, temperatures, and luminosities. This image shows part
Where do Stars Form?
 Where do Stars Form? Coldest spots in the galaxy: T ~ 10 K Composition: Mainly molecular hydrogen 1% dust EGGs = Evaporating Gaseous Globules ftp://ftp.hq.nasa.gov/pub/pao/pressrel/1995/95-190.txt Slide
The Interstellar Medium (ch. 18)
") The Interstellar Medium (ch. 18) The interstellar medium (ISM) is all the gas (and about 1% dust) that fills our Galaxy and others. It is the raw material from which stars form, and into which stars eject
The Interstellar Medium (ch. 18) The interstellar medium (ISM) is all the gas (and about 1% dust) that fills our Galaxy and others. It is the raw material from which stars form, and into which stars eject
Interstellar Dust and Gas
 Interstellar Dust and Gas In 1783 William Herschel began a survey of the heavens using an 18 ¾ inch reflector of his own construction. His goal was to discover new star clusters, nebulae, and double stars.
The Universe o. Galaxies. The Universe of. Galaxies. Ajit Kembhavi IUCAA
 Hello! The Universe of Galaxies The Universe o Galaxies Ajit Kembhavi IUCAA Galaxies: Stars: ~10 11 Mass: ~10 11 M Sun Contain stars, gas and dust, possibly a supermassive black hole at the centre. Much
Collecting Light. In a dark-adapted eye, the iris is fully open and the pupil has a diameter of about 7 mm. pupil
 Telescopes Collecting Light The simplest means of observing the Universe is the eye. The human eye is sensitive to light with a wavelength of about 400 and 700 nanometers. In a dark-adapted eye, the iris
ASTRONOMY 460: PROJECT INTRO - GALACTIC ROTATION CURVE
 ASTRONOMY 460: PROJECT INTRO - GALACTIC ROTATION CURVE Snežana Stanimirović, October 6, 2014 1. Introduction This project has two goals: we want to measure the Milky Way (or Galactic) rotation curve by
Effects of Massive Stars
 Effects of Massive Stars Classical HII Regions Ultracompact HII Regions Stahler Palla: Sections 15.1, 15. HII Regions The salient characteristic of any massive star is its extreme energy output, much of
Star Formation. Stellar Birth
 Star Formation Lecture 12 Stellar Birth Since stars don t live forever, then they must be born somewhere and at some time in the past. How does this happen? And when stars are born, so are planets! 1 Molecular
Journal Club Presentation on The BIMA Survey of Nearby Galaxies. I. The Radial Distribution of CO Emission in Spiral Galaxies by Regan et al.
 Journal Club Presentation on The BIMA Survey of Nearby Galaxies. I. The Radial Distribution of CO Emission in Spiral Galaxies by Regan et al. ApJ, 561:218-237, 2001 Nov 1 1 Fun With Acronyms BIMA Berkely
Ram Pressure Stripping in NGC 4330
 The Evolving ISM in the Milky Way & Nearby Galaxies Ram Pressure Stripping in NGC 4330 Anne Abramson 1 & Jeffrey D. P. Kenney 1 1 Astronomy Department, Yale University, P.O. Box 208101 New Haven, CT 06520-8101
The Star Formation Observatory (SFO)
") Beyond JWST... STScI, Mar 26 27 2009 Slide 1 The Star Formation Observatory (SFO) From Cosmic Dawn to Our Solar System: A Next-Generation UV Optical Space Facility for the Study of Star Formation Rolf
Beyond JWST... STScI, Mar 26 27 2009 Slide 1 The Star Formation Observatory (SFO) From Cosmic Dawn to Our Solar System: A Next-Generation UV Optical Space Facility for the Study of Star Formation Rolf
The Life and Death of Stars
 The Life and Death of Stars A Star Is Born Not everyone agrees, but it is generally thought that stars originate from nebulae (clouds of dust and gas). Almost inevitably, a nebula will "collapse" into
Astronomy 102: Stars and Galaxies Examination 3 April 11, 2003
 Name: Seat Number: Astronomy 102: Stars and Galaxies Examination 3 April 11, 2003 Do not open the test until instructed to begin. Instructions: Write your answers in the space provided. If you need additional
Testing circumstellar disk lifetimes in young embedded clusters associated with the Vela Molecular Ridge ABSTRACT
 A&A 516, A52 (2010) DOI: 10.1051/0004-6361/200913671 c ESO 2010 Astronomy & Astrophysics Testing circumstellar disk lifetimes in young embedded clusters associated with the Vela Molecular Ridge F. Massi
Lecture 2: Molecular Clouds: Galactic Context and Observational Tracers. Corona Australis molecular cloud: Andrew Oreshko
 Lecture 2: Molecular Clouds: Galactic Context and Observational Tracers Corona Australis molecular cloud: Andrew Oreshko Classification of Young Stellar Objects (YSOs) Spectral Index Hartmann: Accretion
Stellar Life Cycle in Giant Galactic Nebula NGC edited by David L. Alles Western Washington University
 Stellar Life Cycle in Giant Galactic Nebula NGC 3603 edited by David L. Alles Western Washington University e-mail: alles@biol.wwu.edu Introduction NGC 3603 is a giant HII region in the Carina spiral arm
Quasars and Active Galactic Nuclei (AGN)
") Quasars and Active Galactic Nuclei (AGN) Astronomy Summer School in Mongolia National University of Mongolia, Ulaanbaatar July 21-26, 2008 Kaz Sekiguchi Hubble Classification M94-Sa M81-Sb M101-Sc M87-E0
Quasars and Active Galactic Nuclei (AGN) Astronomy Summer School in Mongolia National University of Mongolia, Ulaanbaatar July 21-26, 2008 Kaz Sekiguchi Hubble Classification M94-Sa M81-Sb M101-Sc M87-E0
A100 Exploring the Universe: The Milky Way as a Galaxy. Martin D. Weinberg UMass Astronomy
 A100 Exploring the Universe: The Milky Way as a Galaxy Martin D. Weinberg UMass Astronomy astron100-mdw@courses.umass.edu November 12, 2014 Read: Chap 19 11/12/14 slide 1 Exam #2 Returned and posted tomorrow
arxiv: v1 [astro-ph.sr] 14 Oct 2018
![arxiv: v1 [astro-ph.sr] 14 Oct 2018](/thumbs/93/118021561.jpg "arxiv: v1 [astro-ph.sr] 14 Oct 2018") Draft version October 16, 218 Typeset using LATEX twocolumn style in AASTeX62 IN-SYNC. VIII. Primordial Disk Frequencies in NGC 1333, IC 348, and the Orion A Molecular Cloud Yuhan Yao, 1, 2 Michael R.
Draft version October 16, 218 Typeset using LATEX twocolumn style in AASTeX62 IN-SYNC. VIII. Primordial Disk Frequencies in NGC 1333, IC 348, and the Orion A Molecular Cloud Yuhan Yao, 1, 2 Michael R.
GALAXIES. Hello Mission Team members. Today our mission is to learn about galaxies.
 GALAXIES Discussion Hello Mission Team members. Today our mission is to learn about galaxies. (Intro slide- 1) Galaxies span a vast range of properties, from dwarf galaxies with a few million stars barely
Lecture 25 The Milky Way Galaxy November 29, 2017
 Lecture 25 The Milky Way Galaxy November 29, 2017 1 2 Size of the Universe The Milky Way galaxy is very much larger than the solar system Powers of Ten interactive applet 3 Galaxies Large collections of
Astronomy. Optics and Telescopes
 Astronomy A. Dayle Hancock adhancock@wm.edu Small 239 Office hours: MTWR 10-11am Optics and Telescopes - Refraction, lenses and refracting telescopes - Mirrors and reflecting telescopes - Diffraction limit,