An observational correlation between stellar brightness variations and surface gravity
|
|
|
- Janel Morris
- 5 years ago
- Views:
Transcription
1 An observational correlation between stellar brightness variations and surface gravity Fabienne A. Bastien 1, Keivan G. Stassun 1,2, Gibor Basri 3, Joshua Pepper 1,4 1 Department of Physics & Astronomy, Vanderbilt University, 1807 Station B, Nashville, TN Physics Department, Fisk University, th Ave. N, Nashville, TN Astronomy Department, University of California, Hearst Field Annex, Berkeley, CA Physics Department, Lehigh University, 27 Memorial Dr. W, Bethlehem, PA Surface gravity is one of a star's basic properties, but it is difficult to measure accurately, with typical uncertainties of per cent if measured spectroscopically 1,2 and per cent photometrically 3. Asteroseismology measures gravity with an uncertainty of about two per cent but is restricted to relatively small samples of bright stars, most of which are giants 4,5,6. The availability of high-precision measurements of brightness variations for >150,000 stars 7,8 provides an opportunity to investigate whether the variations can be used to determine surface gravities. The Fourier power of granulation on a star s surface correlates physically with surface gravity 9,10 ; if brightness variations on timescales of hours arise from granulation 11, then such variations should correlate with surface gravity. Here we report an analysis of archival data that reveals an observational correlation between surface gravity and the root-mean-square brightness variations on timescales of less than eight hours for stars with temperatures of K, log of surface gravities of (cgs units), and having overall brightness variations <3 parts per thousand. A straightforward
2 observation of optical brightness variations therefore allows a determination of the surface gravity with a precision of <25 per cent for inactive Sun-like stars at main-sequence to giant stages of evolution. Brightness variations of Sun-like stars are driven by many factors, including granulation 12, oscillations 11, rotation and magnetic activity 13. As they evolve from high surface gravity (g) dwarfs to low-g giants, their convective zones deepen, they rotate more slowly, their magnetic activity diminishes, and their oscillation and granulation timescales increase, all of which will change the nature of the brightness variations. It has been previously demonstrated that the power in granulation (as traced by the Fourier spectrum of the brightness variations) is inversely proportional to ν max, the peak frequency of Sun-like acoustic oscillations 9,12. Given that ν max is itself proportional to g 11, it follows that g should manifest in brightness variations on timescales that trace granulation. Although physically we expect this, it is not immediately apparent that brightness variations can be used as an effective determinant of g because other phenomena not directly related to g most importantly spots, plage and other sources of brightness variations driven by the star s magnetic activity probably dominate the observed brightness variations. It is therefore necessary to filter out the brightness variations arising from these phenomena, which occur on timescales of hours to days, while preserving the brightness variations related to granulation and g on timescales of minutes to hours. Using long cadence (30 minute) light curves from Quarter 9 of NASA's Kepler Mission 14, and representing them using the Filtergraph data visualization tool 15, we observe clear patterns in the evolutionary properties of stars encoded in three simple measures of their brightness variations 8 (Fig. 1): Range (R var ), number of zero crossings (X 0 ), and root-mean-square on time scales
3 shorter than 8 hours (to which we refer hereafter as 8-hr flicker, or F 8 ). Relating these measures to g determined asteroseismically for a sample of Kepler stars 4, we find distinctive features that highlight the way stars evolve in this three-dimensional space, making up an evolutionary diagram of photometric variability. Within this diagram we find a vertical cloud of points, largely made up of high-g dwarfs, that show large R var, small X 0, and low F 8 values. We observe a tight sequence of stars a flicker floor sequence that defines a prominently protruding lower envelope in R var spanning gravities from dwarfs to giants. Sun-like stars of all evolutionary states evidently move onto this sequence only when they have a large X 0, which in turn implies low stellar activity. We find that g is uniquely encoded in F 8, yielding a tight correlation between the two (Fig. 2). Moreover, using 11 years of SOHO Virgo 16,17 light curves of the Sun and sampling them at the same cadence as the Kepler long-cadence light curves, we find that the Sun s (constant) g is also measurable using F 8, which remains invariant throughout the 11-year solar activity cycle even while the Sun's R var and X 0 change significantly from the spot-dominated solar maximum to the nearly spotless solar minimum. From the Sun s behavior we infer that a large portion of the Kepler stars vertical scatter within the vertical cloud at the left of the diagram may be driven by solar-type cyclic activity variations. Most importantly, the Sun s true g fits our empirical relation, and the g value of any Sun-like Kepler star from dwarf to giant may be inferred from this relation with an accuracy of dex (Supplementary Information). Asteroseismic analyses derive g from the properties of stellar acoustic oscillations 4,18,19,20. Given that near-surface convection drives both these oscillations and granulation, and given the brightness variability time scales to which F 8 is sensitive, we suggest that a combination of different
4 types of granulation (with typical solar time scales from ~30 minutes to ~30 hours 21 ) drives the manifestation of g in this metric. The precise time scales of these phenomena in solar-type stars depend strongly on the stellar evolutionary state and hence also on g 5,9,10,22. Acoustic oscillations, whose amplitudes are sensitive to g 5, may provide an increasingly important contribution to F 8 as stars evolve into subgiants and giants and the amplitudes and time scales of these oscillations increase 5,9,10. At some point, the pressure-mode and granulation time scales cross 9, which may lead to a breakdown of our F 8 -g relation at very low values of g. By using F 8 to measure g, we can construct a photometric variability evolutionary diagram for most stars observed by Kepler, even for stars well beyond the reach of asteroseismic and spectroscopic analysis (Fig. 3). By coding this diagram according to the stellar temperature and rotation period, we may trace the physical evolution of Sun-like stars as follows: stars begin as main-sequence dwarfs with large photometric R var values and small X 0 values, presumably driven by simple rotational modulation of spots at relatively short rotation periods. As the stars spin down to longer rotation periods, their brightness variations first become steadily "quieter" (systematically lower R var ) but then become suddenly and substantially more complex (larger X 0 ) as they reach the flicker floor. Some stars reach the floor only after beginning their evolution as low-g subgiants, having moved to the right (higher F 8 ) as their effective temperatures begin rapidly dropping. Other stars join the sequence while still dwarfs; these are easily identified in our diagram by the drastically increased X 0 at very low F 8. Evidently some dwarf stars become magnetically quiet while still firmly on the main sequence, whereas others do not reach the floor until they begin to swell considerably. We note that the Sun seems to approach the flicker floor at solar minimum; its R var value becomes quite low and its X 0 value strongly increases (Fig. 1).
5 A star s main-sequence mass and initial spin probably determine where along the flicker floor sequence it ultimately arrives, because the slope of a star's trajectory in our diagram is essentially determined by the ratio of its spin-down time scale (downward motion) and structural evolutionary time scale (rightward motion). Regardless, once on the floor all stars evolve along this sequence and stay on it as they move up to the red giant branch, their effective temperatures steadily dropping as their surfaces rapidly expand. Despite their very slow rotation as subgiants and giants on the flicker floor sequence, their photometric R var is steadily driven upwards by the increasing F 8, which reflects the stars continually decreasing g. The increasing R var and F 8 values of subgiants and giants on the flicker floor is probably the result of the increasingly important contribution of radial and non-radial pulsations to the overall brightness variations 22,23. A few stars appear as outliers to the basic picture we have presented here; these are seen towards the right of the vertical cloud of points in our evolutionary diagram (Fig. 3). Some active dwarfs have higher F 8 than expected for their g values. Frequent strong flares can boost F 8 as currently defined, and some hotter dwarfs are pulsators with enough power near 8 hours to increase their F 8 values. A few such cases appear also in the asteroseismic sample (Fig. 1). Some lower g stars have R var above the flicker floor owing to the presence of magnetic activity 24, slow radial pulsations or secular drifts. Finally, a few outliers are simply due to data anomalies. As our technique is refined, these exceptions should be treated carefully before assigning a F 8 -based g value, particularly for high-f 8 stars for which R var is greater than ~3ppt. They constitute a small fraction of the bulk sample, and most of them can be identified as one of the above cases. Common to all of the stars along the flicker floor is the virtual absence of spot activity as compared to their higher R var counterparts; short-time scale phenomena such as granulation and oscil-
6 lations dominate the brightness variations. Given that spots probably suppress acoustic oscillations in the Sun and other dwarf stars 5,26,27,28, the large X 0 of stars along this sequence may partly reflect the ability of short-time scale processes to manifest more strongly now that large spots no longer impede them, along with the increasing complexity of the convective variations. As the stars evolve into full-fledged red giants and beyond, the principal periodicity in their brightness variations increasingly reflects shorter-period oscillations, as opposed to their inherently long-period rotation, because oscillations become dominant over magnetic spots. It may be possible to differentiate between stars with similar g but different internal structures (e.g., first-ascent red giants versus helium burning giants) through application of a sliding timescale of F 8 as a function of g, where the sliding timescale would capture the changing physical granulation timescales with evolutionary state 20. Moreover, the behavior of stars on the flicker floor may explain the source of radial velocity jitter that now hampers planet detection through radial velocity measurements 28.
7 References 1. Valenti, J. & Fischer, D. A. Spectroscopic properties of cool stars (SPOCS). I F, G, and K dwarfs from Keck, Lick, and AAT planet search programs. Astrophys. J. 159, (2005). 2. Ghezzi, L. et al. Stellar parameters and metallicities of stars hosting Jovian and Neptunian mass planets: a possible dependence of planetary mass on metallicity. Astrophys. J. 720, (2010). 3. Brown, T. M., Latham, D. W., Everett, M. E. & Esquerto, G. A. Kepler Input Catalog: photometric calibration and stellar classification. Astron. J., 142, (2011). 4. Chaplin, W. J. et al. Ensemble asteroseismology of solar-type stars with the NASA Kepler mission. Science, 332, (2011). 5. Huber, D. et al. Testing scaling relations for solar-like oscillations from the main sequence to red giants using Kepler data. Astrophys. J., 743, (2011). 6. Stello, D. et al. Asteroseismic classification of stellar populations among 13,000 red giants observed by Kepler. Astrophys. J., 765, L41-L45 (2013). 7. Basri, G. et al. Photometric variability in Kepler target stars: the Sun among stars a first look. Astrophys. J., 713, L155-L159 (2010). 8. Basri, G. et al. Photometric variability in Kepler target stars. II. An overview of amplitude, periodicity, and rotation in the First Quarter data. Astron. J., 141, (2011). 9. Mathur, S. et al. Granulation in red giants: observations by the Kepler mission and three-dimensional convection simulations. Astrophys. J., 741, (2011).
8 10. Kjeldsen, H. & Bedding, T. R. Amplitudes of solar-like oscillations: a new scaling relation. Astron. Astrophys. 529, L8-L11 (2011). 11. Brown, T. M., Gilliland, R. L., Noyes, R. W. & Ramsey, L. W. Detection of possible p- mode oscillations on Procyon. Astrophys. J., 368, (1991). 12. Gilliland, R. L. et al. Kepler mission stellar and instrument noise properties. Astrophys. J. Suppl., 197, 6-24 (2011). 13. Strassmeier, K. G. Starspots. Astron. Astrophys. Rev. 17, (2009). 14. Borucki, W. J. et al. Kepler planet-detection mission: introduction and first results. Science 327, (2010). 15. Burger, D. et al. An interactive web application for visualization of astronomy datasets. Astron. Comput., in press. 16. Frohlich, C. et al. First results from VIRGO, the experiment for helioseismology and solar irradiance monitoring on SOHO. Sol. Phys. 170, 1-25 (1997). 17. Basri, G., Walkowicz, L. M. & Reiners, A. Comparison of Kepler photometric variability with the Sun on different timescales. Astrophys. J., 769, (2013). 18. Brown, T. M. & Gilliland, R. L. Asteroseismology. Ann. Rev. Astron. Astrophys. 32, (1994). 19. Christensen-Dalsgaard, J. Physics of solar-like oscillations. Sol. Phys. 220, (2004). 20. Chaplin, W. J. & Miglio, A. Asteroseismology of solar-type and red giant stars. Ann. Rev. Astron. Astrophys., 51, in press.
9 21. Dumusque, X., Udry, S., Lovis, C., Santos, N. C. & Monteiro, M. J. P. F. G. Planetary detection limits taking into account stellar noise. I. Observational strategies to reduce stellar oscillation and granulation effects. Astron. Astrophys. 525, (2011). 22. Kjeldsen, H. & Bedding, T. R. Amplitudes of stellar oscillations: the implications for asteroseismology. Astron. Astrophys. 293, (1995). 23. Henry, G. W., Fekel, F. C., Henry, S. M. & Hall, D. S. Photometric variability in a sample of 187 G and K giants. Astrophys. J. Suppl., 130, (2000). 24. Gilliland, R. L. Photometric oscillations of low-luminosity red giant stars. Astron. J., 136, (2008). 25. Schroder, C., Reiners, A. & Schmitt, J. H. M. M. Ca II HK emission in rapidly rotating stars. Evidence for an onset of the solar-type dynamo. Astron. Astrophys., 493, Chaplin, W. J., Elsworth, Y., Isaak, G. R., Miller, B. A. & New, R. Variations in the excitation and damping of low-l solar p modes over the solar activity cycle. Mon. Not. R. Astron. Soc., 313, (2000). 27. Komm, R. W., Howe, R. & Hill, F. Solar-cycle changes in Gong p-mode widths and amplitudes Astrophys. J., 531, (2000). 28. Chaplin, W. J. et al. Evidence for the impact of stellar activity on the detectability of solarlike oscillations observed by Kepler. Astrophys. J., 732, L5-L10 (2011). 29. Bastien, F. A. et al. A comparison between radial velocity variations, chromospheric activity and photometric variability in Kepler stars. Astron. J., submitted.
10 30. Pinsonneault, M. et al. A revised effective temperature scale for the Kepler Input Catalog. Astrophys. J. Suppl., 199, (2012). Acknowledgements The research described in this paper makes use of Filtergraph 29, an online data visualization tool developed at Vanderbilt University through the Vanderbilt Initiative in Data-intensive Astrophysics (VIDA). We acknowledge discussions with Phillip Cargile, Kenneth Carpenter, William Chaplin, Daniel Huber, Martin Paegert, Manodeep Sinha and David Weintraub. We thank Daniel Huber and Travis Metcalfe for sharing the average asteroseismic parameters of Kepler stars with us. F. A. B. acknowledges support from a NASA Harriet Jenkins Fellowship and a Vanderbilt Provost Graduate Fellowship. Author Contributions F. A. B. and K. G. S. contributed equally to the identification and analysis of the major correlations. F. A. B. principally wrote the first version of the manuscript. K. G. S. prepared the figures. G. B. calculated the variability statistics of the Kepler light curves and performed an independent check of the analysis. J. P. checked against biases in the datasets. All authors contributed to the interpretation of the results and to the final manuscript.
11 Author Information Reprints and permissions information is available at The authors declare no competing financial interests. Correspondence and requests for materials should be addressed to F. A. B. at Supplementary Information is linked to the online version of the paper at

12 Figures Figure 1: Simple measures of brightness variations reveal a fundamental flicker sequence of stellar evolution. We establish the evolutionary states of stars with three simple measures of brightness variations 8. The abscissa, 8-hr flicker (F 8 ), measures brightness variations on time scales of 8 hours or less. The ordinate, R var, yields the largest amplitude of the photometric variations in a 90-day timeframe. X 0 (symbol size; ranging from 0.01 to 2.1 crossings per day), conveys the large-scale complexity of the light curve. We correct both R var and F 8 for their dependence on Kepler magnitude ( Kepmag ). Color represents asteroseismically determined g. We observe two populations of stars: a vertical cloud composed of high-g dwarfs and some subgiants, and a tight sequence, the flicker floor, spanning an extent in g from dwarfs to giants. The
13 typically large R var values of stars in the cloud, coupled with their simpler light curves (small X 0 ), implies brightness variations driven by rotational modulation of spots. In contrast, large X 0 values characterize stars on the sequence. The F 8 values of stars in this sequence increase inversely with g because the physical source of F 8 is sensitive to g. R var also increases with F 8 along the floor, because F 8 is a primary contributor to R var (as opposed to starspots above the floor). Stars with a given F 8 value cannot have R var less than that implied by F 8 itself: quiet stars accumulate on the flicker floor because they are prevented from going below it by the statistical definition of the two quantities. Stars above the floor have larger amplitude variations on longer time scales that set R var. The large star symbol with vertical bars and the inset show the Sun s behavior over the course of its 11-year magnetic cycle. The Sun s F 8 value is largely invariant over the course of its cycle, just as its g value is invariant.

14 Figure 2: Stellar surface gravity manifests in a simple measure of brightness variations. The same stars from Fig. 1 with Kepler Quarter 9 data. Asteroseismically determined 4 g shows a tight correlation with F 8. Color represents the R var of the stars brightness variations; outliers tend to have large brightness variations. Excluding these outliers, a cubic polynomial fit through the Kepler stars and through the Sun (large star symbol) shows a median absolute deviation of 0.06 dex and a root-mean-square deviation of 0.10 dex (Supplementary Information). To simulate how the solar g would appear in the archival data we use to measure g for other stars, we divide the solar data into 90-day quarters. Our F 8 -g relation measured over multiple quarters then yields a median solar g of with a median absolute deviation of dex and an RMS error of dex (the true solar g is 4.438).
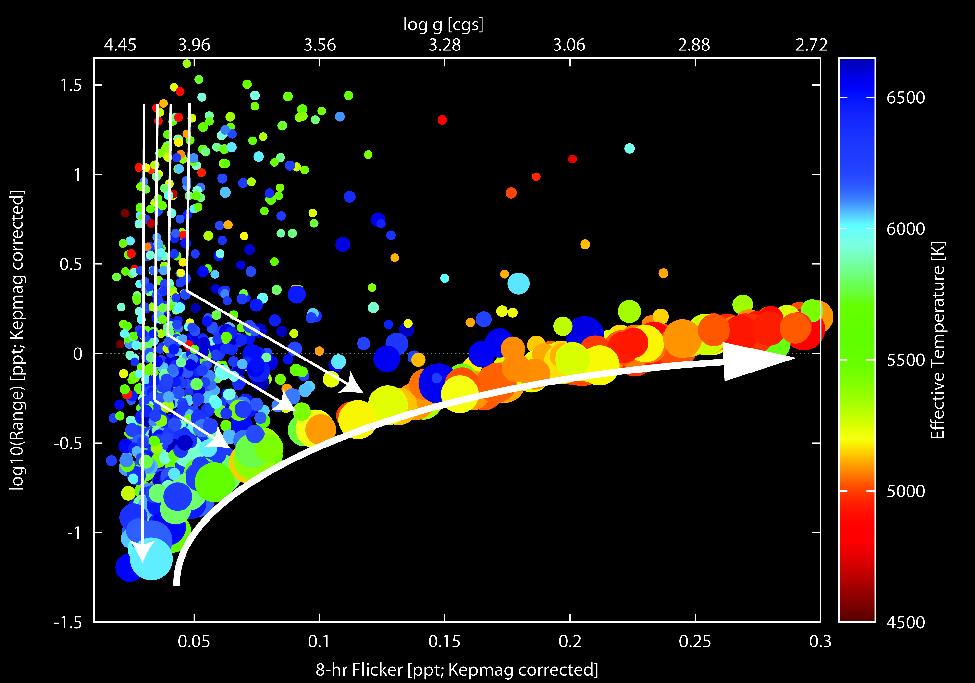
15
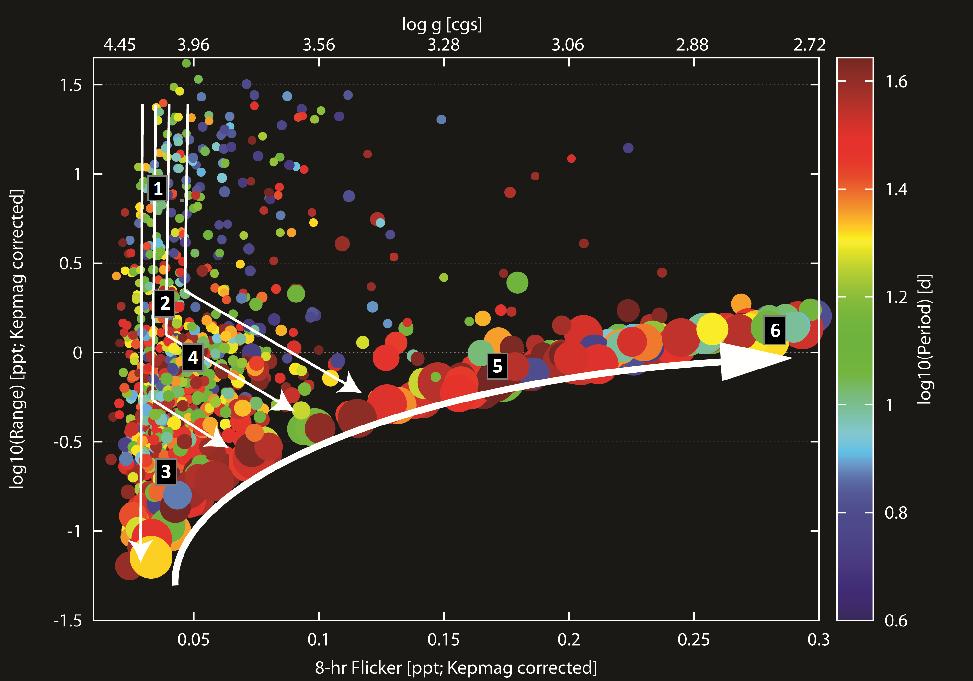
16 Figure 3: An integrative view of stellar evolution in a new diagram of brightness variations. Same as Figure 1 but for Kepler stars lacking asteroseismic g. We include a g scale at the top (from conversion of the F 8 scale at bottom via our calibrated relationship). Here, we selected stars with Kepler magnitudes between 11.0 and in order to limit the sample to ~1000 stars for visual clarity (1,012 points are shown). We removed objects that are potentially blended (Kepler flux contamination greater than 0.05) as well as those that may be galaxies (Kepler star-galaxy flag other than 0). Arrows schematically indicate the evolutionary paths of Sun-like stars in this diagram. Stars generally move from top to bottom, as the overall brightness fluctuations due to spots decrease with time, and then from left to right as their g values decrease. All stars even-
17 tually arrive on the flicker floor sequence and evolve along it. Top: Color represents effective temperature. Stars cool as they evolve from left to right, from dwarfs to red giants. We restricted the effective temperatures to be K, using the revised temperature scale for Kepler stars 30. Bottom: Same as top, but color-coded by the dominant periodicity in the light curve. We limited the sample to stars with dominant periods longer than 3 days (to eliminate very rapidly rotating active stars) and shorter than 45 days (half the Kepler 90-day data interval). This period traces rotation for unevolved stars and pulsations for evolved ones. Dwarfs generally show the expected spin-down sequence with decreasing R var (correlated with the level of surface magnetic activity). Subgiants and giants broadly display very slow rotation as expected.
18 Supplementary Information Asteroseismic measurement of surface gravities (g): We used as our sample the first ensemble asteroseismic analysis of Kepler stars 4. The ν and ν max values from that work were shared with us privately by the authors (D. Huber and T. Metcalfe, priv. comm.). ν max refers to the central frequency of the solar-like p-mode oscillations, where the power is greatest, while ν, the large frequency separation, measures the sound travel time across the star's diameter 20. Taking these, together with the revised stellar effective temperatures 30, we applied the standard scaling relations that transform them into mass and radius 4 to calculate g. Seismic parameters are now available for several thousand stars 5,6 and will be used in a future calibration of our F 8 -g relation. Detailed description of how each of the photometric variability measures is calculated We employ the following three variability statistics 8 in this work. We use as our starting point for all of these Kepler Quarter 9 PDC-MAP data: Range (R var ): obtained by sorting the pipeline-reduced Kepler light curve by differential intensity and measuring the range between the 5th and 95th percentile. This quantity traces the stellar surface spot coverage. Number of zero crossings (X 0 ): computed by smoothing the light curve by 10 hour (20 point) bins and counting the number of times the resultant light curve crosses its median value. It provides an assessment of the complexity of the light curve. For example, spots produce variations larger than the high-frequency noise resulting in a small X 0 8-hour flicker (F 8 ): determined by performing a 16-point (8 hour) boxcar smoothing of the light curve, subtracting it from the original light curve and measuring the root-meansquare (RMS) of the result. We handle data gaps by interpolating across any missing 30- minute data bins. The result is a somewhat decreased F 8 because it is zero in these interpolated segments. In practice the data gaps are so few and small that the impact on the overall F 8 is negligible. We, at present, do not employ sigma-clipping. There are rare cases in which a few light curve points are extreme enough to boost the RMS, but are clipped from the R var. Such cases can appear below the flicker floor we have described. Examples include a quiet star with a deep transiting planet, or one very large instrumental spike affecting only a few points. F 8 measures stellar variability on time scales of 8 hours or less. Details on how the solar data were put into Kepler equivalent form We used SOHO Virgo 16 light curves, whose passband is similar to that of Kepler 17. We took light curves spanning an entire solar cycle to examine the influence of changing spot activity (i.e. changing R var ) over the course of a stellar magnetic cycle on our findings. We divided the SOHO light curve into 90 day segments, to simulate the length of a Kepler quarter, and we sampled each segment to achieve an effective cadence of 30 minutes, similar to the cadence of the Kepler long-cadence light curves. We note that the actual derived F 8 depends on the filter used and the treatment of the solar data. The solar brightness variations are largest in the blue filter, moderate in the green filter, and smallest in the red filter (as expected for the temperature of the Sun). One finds, for instance, a roughly 30% larger F 8 than the value reported here when considering solely the green filter data.
19 Thus, previous analyses have used a sum of the green and red filter data (which is more nearly the same as a broadband filter), and we now use the TSI white data (which is also a broadband realization of the solar variations). Figure S1: Kepler Magnitude correction: The measures of brightness variations that we use all show dependencies on stellar brightness. Fainter stars naturally exhibit larger brightness variability in R var and F 8 simply due to increased photon noise. Not accounting for this results in an overestimate of F 8 (equivalently, an underestimate of g). We therefore correct these measures using empirical relations obtained from the entire sample of Kepler Quarter 9 light curves. We fit each of the brightness variability measures versus stellar apparent magnitude in the Kepler bandpass ( Kepmag or K p ) using a simple 4th order polynomial fit to the lower envelope of points, defined as the bottom 0.5-th percentile of points in 0.1 magnitude wide bins. These polynomial relations were then subtracted in quadrature from the measured brightness variation measures, and these corrected variability measures are identified in all figures as Kepmag corrected. The final Kepler magnitude relation used in this work is: min (log 10 F 8 )= K p K p K p 3
20 where K p is the Kepler magnitude, and the fit applies for 7 < K p < 14. The final F 8 that we use is obtained by subtracting this min(f 8 ) from the measured F 8 in quadrature (the quadrature subtraction is performed linearly, not logarithmically). Figure S2: Details on g versus F 8 fit relation: We draw our gold standard sample from the first published asteroseismic analysis of Kepler stars 5 (we note that there are now over 10,000 seismically analyzed Kepler stars that will permit our relations to be extended further in future work). From these, we used as our base sample the 542 stars (gray points) possessing both asteroseismically determined masses and radii and Quarter 9 long-cadence light curves from which we could compute our variability statistics 8. These stars have Kepler magnitudes brighter than 12, effective temperatures 30 between 4500 < Teff < 6650 K, and a Kepler flux contamination flag of less than Most of the outliers from the trend are stars with very short periods (likely short-period pulsators or rapidly rotating active stars) and/or large brightness excursions (R var ). Therefore, we removed from the polynomial fit 10 stars with Period < 3 days and 19 additional stars with R var > 2.5 ppt. The remaining 503 stars (black) were fitted with a cubic polynomial (solid curve). F 8 was corrected for the dependence on Kepler magnitude as above. The large star symbol at lower left represents the Sun with g = 4.44 and a median F 8 of ppt over the entire 11-year solar activity cycle. The polynomial fit
21 was forced through the solar value since there are few asteroseismic stars with g as high as the Sun, however the fit passes within 0.05 dex of the solar value even without forcing the fit. The final polynomial fit relation is: log 10 g= x x x 3 where x = log 10 (F 8 ) and F 8 is in units of ppt. The root-mean-square of the g residuals about the polynomial fit is 0.10 dex and the median absolute deviation is 0.06 dex. Figure S3: Examples of light curves in different regions of the photometric variability evolutionary diagram: Top: The photometric evolutionary diagram, showing the regions from which we draw our sample light curves. Middle: Six examples of light curves from Quarter 9 with different R var and F 8. The black curves show the differential intensity in units of parts per thousand. The red curves show the result of applying a boxcar smoothing of 16 points (8 hours). Thus, the F 8 is the RMS difference between the black and red curves. The first three stars are taken from the left hand edge of Figure S3, top, at the top, middle, and bottom of the dwarf stars (labeled 1-3). Though most stars in this region are likely dwarfs, a small fraction of giants with very low g (typically also with very large R var ) contaminate this region. One could enhance the determination of g for dwarfs with R var > 2.5 ppt by considering additional diagnostics present in the same light curve data. For example, the true dwarfs that dominate the upper left part of the diagram have large R var and are therefore active. They thus should exhibit strong periodicity on timescales expected for rotation of active dwarfs (i.e., Prot < 20 d). The second set of three stars are at evenly spaced locations along the flicker floor in that figure, moving out to higher F 8 and R var (labeled 4-6). The Kepler IDs of each star are indicated. Bottom: A 10-day section of the light curves, to bring out more details. The R var and F 8 values for the six stars are listed here also for reference (cf. Table below). We also include the temperatures 30 and the g from both the Kepler Input Catalog and our F 8 relation.
22
23
24
25 Star Kepler ID Effective Temperature 30 (K) Kepler Magnitude R var (ppt) F 8 (ppt) Magnitudecorrected F 8 (ppt) g (cgs) from KIC g (cgs) from F
Convection in Cool Stars, as Seen through Kepler's Eyes
 Convection in Cool Stars, as Seen through Kepler's Eyes Fabienne A. Bastien (Hubble Fellow, Penn State) Keivan G. Stassun (Vanderbilt), Gibor Basri (Berkeley), Jason Wright (Penn State), Joshua Pepper
Supporting Online Material for
 www.sciencemag.org/cgi/content/full/science.1201939/dc1 Supporting Online Material for Kepler-Detected Gravity-Mode Period Spacings in a Red Giant Star P. G. Beck,* T. R. Bedding, B. Mosser, D. Stello,
Probing Stellar Structure with Pressure & Gravity modes the Sun and Red Giants. Yvonne Elsworth. Science on the Sphere 14/15 July 2014
 Probing Stellar Structure with Pressure & Gravity modes the Sun and Red Giants Yvonne Elsworth Science on the Sphere 14/15 July 2014 Evolving stars are building blocks of the galaxy and their cores are
arxiv: v1 [astro-ph.sr] 10 Dec 2015
![arxiv: v1 [astro-ph.sr] 10 Dec 2015](/thumbs/84/89731292.jpg "arxiv: v1 [astro-ph.sr] 10 Dec 2015") Draft version December 14, 2015 Preprint typeset using L A TEX style emulateapj v. 5/2/11 A GRANULATION FLICKER -BASED MEASURE OF STELLAR SURFACE GRAVITY Fabienne A. Bastien 1,2, Keivan G. Stassun 3,4,
Draft version December 14, 2015 Preprint typeset using L A TEX style emulateapj v. 5/2/11 A GRANULATION FLICKER -BASED MEASURE OF STELLAR SURFACE GRAVITY Fabienne A. Bastien 1,2, Keivan G. Stassun 3,4,
The Solar Interior and Helioseismology
 The Solar Interior and Helioseismology Bill Chaplin, School of Physics & Astronomy University of Birmingham, UK STFC Advanced Summer School, 2016 Sep 6 University of Sheffield http://solarscience.msfc.nasa.gov/predict.shtml
arxiv: v1 [astro-ph] 3 Jul 2008
![arxiv: v1 [astro-ph] 3 Jul 2008](/thumbs/88/114997315.jpg "arxiv: v1 [astro-ph] 3 Jul 2008") Transiting Planets Proceedings IAU Symposium No. 253, 2008 c 2008 International Astronomical Union DOI: 00.0000/X000000000000000X Measurements of Stellar Properties through Asteroseismology: A Tool for
Transiting Planets Proceedings IAU Symposium No. 253, 2008 c 2008 International Astronomical Union DOI: 00.0000/X000000000000000X Measurements of Stellar Properties through Asteroseismology: A Tool for
Asteroseismology with the Kepler mission
 Comm. in Asteroseismology Vol. 150, 2007 Asteroseismology with the Kepler mission J. Christensen-Dalsgaard, 1,2 T. Arentoft, 1,2 T. M. Brown, 3 R. L. Gilliland, 4 H. Kjeldsen, 1,2 W. J. Borucki, 5 D. Koch
UC Berkeley UC Berkeley Previously Published Works
 UC Berkeley UC Berkeley Previously Published Works Title Radial velocity variations of photometrically quiet, chromospherically inactive kepler stars: A link between RV jitter and photometric flicker Permalink
arxiv: v1 [astro-ph.sr] 10 Dec 2018
![arxiv: v1 [astro-ph.sr] 10 Dec 2018](/thumbs/92/108310118.jpg "arxiv: v1 [astro-ph.sr] 10 Dec 2018") Draft version December 12, 2018 Preprint typeset using L A TEX style emulateapj v. 01/23/15 PREDICTING GRANULATION FLICKER AND RADIAL VELOCITY JITTER FROM SPECTROSCOPIC OBSERVABLES Jamie Tayar Institute
Draft version December 12, 2018 Preprint typeset using L A TEX style emulateapj v. 01/23/15 PREDICTING GRANULATION FLICKER AND RADIAL VELOCITY JITTER FROM SPECTROSCOPIC OBSERVABLES Jamie Tayar Institute
Observed solar frequencies. Observed solar frequencies. Selected (two) topical problems in solar/stellar modelling
 topical problems in solar/stellar modelling") Selected (two) topical problems in solar/stellar modelling Stellar Astrophysics Centre Improving solar physics by studying other stars Günter Houdek The effect of the surface layers on the oscillation
Selected (two) topical problems in solar/stellar modelling Stellar Astrophysics Centre Improving solar physics by studying other stars Günter Houdek The effect of the surface layers on the oscillation
SEARCHING FOR MAGNETIC ACTIVITY IN SOLAR-LIKE STARS OBSERVED BY KEPLER
 SEARCHING FOR MAGNETIC ACTIVITY IN SOLAR-LIKE STARS OBSERVED BY KEPLER Lauren Balliet Clarion University of Pennsylvania Space Science Institute : Savita Mathur LASP National Science Foundation IMPORTANCE
Stellar noise: physics and mechanisms
 Stellar noise: physics and mechanisms Ignasi Ribas Institut de Ciències de l Espai (CSIC IEEC, Barcelona) Leiden, October 2012 Stellar signal: physics and mechanisms Ignasi Ribas Institut de Ciències de
arxiv: v1 [astro-ph.sr] 22 Aug 2014
![arxiv: v1 [astro-ph.sr] 22 Aug 2014](/thumbs/79/79091908.jpg "arxiv: v1 [astro-ph.sr] 22 Aug 2014") 18th Cambridge Workshop on Cool Stars, Stellar Systems, and the Sun Proceedings of Lowell Observatory (9-13 June 2014) Edited by G. van Belle & H. Harris Using Transiting Planets to Model Starspot Evolution
18th Cambridge Workshop on Cool Stars, Stellar Systems, and the Sun Proceedings of Lowell Observatory (9-13 June 2014) Edited by G. van Belle & H. Harris Using Transiting Planets to Model Starspot Evolution
Asteroseismology with WFIRST
 Asteroseismology with WFIRST Daniel Huber Institute for Astronomy University of Hawaii Sagan Workshop August 2017 Crash Course in Asteroseismology Crash Course in Asteroseismology? unnamed author, sometime
Synergies & Opportunities for SONG in the TESS Era
 Synergies & Opportunities for SONG in the TESS Era Daniel Huber Institute for Astronomy, University of Hawaiʻi SONG Workshop, Tenerife October 2018 TESS Mission: Introduction & First Results Transiting
Supporting Online Material for
 www.sciencemag.org/cgi/content/full/332/6026/213/dc1 Supporting Online Material for Ensemble Asteroseismology of Solar-Type Stars with the NASA Kepler Mission W. J. Chaplin,* H. Kjeldsen, J. Christensen-Dalsgaard,
arxiv: v1 [astro-ph.sr] 20 Dec 2013
![arxiv: v1 [astro-ph.sr] 20 Dec 2013](/thumbs/84/89731290.jpg "arxiv: v1 [astro-ph.sr] 20 Dec 2013") THE ASTROPHYSICAL JOURNAL, 2014, IN PRESS Preprint typeset using LATEX style emulateapj v. 04/17/13 STELLAR GRANULATION AS THE SOURCE OF HIGH-FREQUENCY FLICKER IN KEPLER LIGHT CURVES STEVEN R. CRANMER
THE ASTROPHYSICAL JOURNAL, 2014, IN PRESS Preprint typeset using LATEX style emulateapj v. 04/17/13 STELLAR GRANULATION AS THE SOURCE OF HIGH-FREQUENCY FLICKER IN KEPLER LIGHT CURVES STEVEN R. CRANMER
Asteroseismology & Exoplanets: A Kepler Success Story
 Asteroseismology & Exoplanets: A Kepler Success Story Daniel Huber SETI Institute / NASA Ames Research Center U Chicago Astronomy Colloquium April 2014 Collaborators Bill Chaplin, Andrea Miglio, Yvonne
SUPPLEMENTARY INFORMATION
 doi:10.1038/nature10612 1. Supplementary Notes 1.1 Data and data analysis The analysis of the three stars presented in this report is based on 510 days of consecutive photometric observations (quarters
Interferometry & Asteroseismology of Solar-like Stars
 Interferometry & Asteroseismology of Solar-like Stars (+ their Connection to Exoplanets) Daniel Huber NASA Ames Research Center Feb 11 2014 Supergiants Giants Hot Dwarfs White Dwarfs Cool Dwarfs Griffith
arxiv: v1 [astro-ph.sr] 8 Sep 2014
![arxiv: v1 [astro-ph.sr] 8 Sep 2014](/thumbs/92/110806019.jpg "arxiv: v1 [astro-ph.sr] 8 Sep 2014") Exploiting the open clusters in the Kepler and CoRoT fields Karsten Brogaard, Eric Sandquist, Jens Jessen-Hansen, Frank Grundahl, and Søren Frandsen arxiv:1409.2271v1 [astro-ph.sr] 8 Sep 2014 Abstract
Exploiting the open clusters in the Kepler and CoRoT fields Karsten Brogaard, Eric Sandquist, Jens Jessen-Hansen, Frank Grundahl, and Søren Frandsen arxiv:1409.2271v1 [astro-ph.sr] 8 Sep 2014 Abstract
Asteroseismology of red giants Observed by the Kepler Mission. Christina Hedges Mentors Savita Mathur Keith MacGregor Michael Thompson
 Asteroseismology of red giants Observed by the Kepler Mission Christina Hedges Mentors Savita Mathur Keith MacGregor Michael Thompson Contents Introduction to Asteroseismology Aims of Summer Project Pipeline
arxiv:astro-ph/ v1 17 Dec 2003
 Electromagnetic Signals from Planetary Collisions Bing Zhang and Steinn Sigurdsson arxiv:astro-ph/0312439 v1 17 Dec 2003 Department of Astronomy & Astrophysics, Penn State University, University Park,
Asteroseismology of Exoplanet Host Stars
 Asteroseismology of Exoplanet Host Stars Daniel Huber Institute for Astronomy, University of Hawaii Know Thy Star, Know Thy Planet October 2017 Crash Course in Asteroseismology for more details: Aerts,
Do red giants have short mode lifetimes?
 Mem. S.A.It. Vol. 77, 406 c SAIt 2006 Memorie della Do red giants have short mode lifetimes? D. Stello 1,2,3, H. Kjeldsen 1, T. R. Bedding 2, and D. Buzasi 3 1 Institute for Fysik og Astronomi (IFA), Aarhus
REDUCED LIGHT CURVES FROM CAMPAIGN 1 OF THE K2 MISSION
 Preprint typeset using L A TEX style emulateapj v. 12/16/11 REDUCED LIGHT CURVES FROM CAMPAIGN 1 OF THE K2 MISSION Andrew Vanderburg 1,2 Harvard Smithsonian Center for Astrophysics, 6 Garden St., Cambridge,
TESS Proposal on behalf of TASC WG 4 Cadence: 2-min sampling
 TESS Proposal on behalf of TASC WG 4 Cadence: 2-min sampling Title: A survey of rapidly oscillating Ap stars Abstract: The magnetic, and chemically peculiar nature of the rapidly oscillating Ap (roap)
Helioseismology. Bill Chaplin, School of Physics & Astronomy University of Birmingham, UK
 Helioseismology Bill Chaplin, School of Physics & Astronomy University of Birmingham, UK STFC Advanced Summer School, 2014 Sep 1 University of Dundee http://solarscience.msfc.nasa.gov/predict.shtml http://solarscience.msfc.nasa.gov/predict.shtml
Seminar: Measurement of Stellar Parameters with Asteroseismology
 Seminar: Measurement of Stellar Parameters with Asteroseismology Author: Gal Kranjc Kušlan Mentor: dr. Andrej Prša Ljubljana, December 2017 Abstract In this seminar I introduce asteroseismology, which
arxiv: v1 [astro-ph.sr] 20 Oct 2016
![arxiv: v1 [astro-ph.sr] 20 Oct 2016](/thumbs/90/104116717.jpg "arxiv: v1 [astro-ph.sr] 20 Oct 2016") On the detectability of solar-like oscillations with the NASA TESS mission arxiv:.00v [astro-ph.sr] 20 Oct 20 Tiago L. Campante,2, School of Physics and Astronomy, University of Birmingham, Edgbaston,
On the detectability of solar-like oscillations with the NASA TESS mission arxiv:.00v [astro-ph.sr] 20 Oct 20 Tiago L. Campante,2, School of Physics and Astronomy, University of Birmingham, Edgbaston,
Asteroseismology of the Open Clusters NGC 6791, NGC 6811, and NGC 6819 from 19 months of Kepler photometry
 GREAT-ESF Workshop The World of Clusters Padova, Italy, 23-26 September 2013 Asteroseismology of the Open Clusters NGC 6791, NGC 6811, and NGC 6819 from 19 months of Kepler photometry Enrico Corsaro Postdoctoral
Stellar Signals in Radial Velocity Measurements
 Stellar Signals in Radial Velocity Measurements ToE Porto 2014 0.1 0.2 0.3 0.4 0.5 0.6 +5.34824e4 Xavier Dumusque ~10 years Magnetic Cycle Magnetic Cycle Active Regions Rotational period ~30 days Magnetic
Solar-like oscillations in intermediate mass stars
 Solar-like oscillations in intermediate mass stars Victoria Antoci SAC (Stellar Astrophysics Centre), Aarhus University, Denmark Why are intermediate mass stars so important? Credit: Kupka & Weiss1999
arxiv: v1 [astro-ph.sr] 12 Sep 2011
![arxiv: v1 [astro-ph.sr] 12 Sep 2011](/thumbs/89/100751499.jpg "arxiv: v1 [astro-ph.sr] 12 Sep 2011") Mon. Not. R. Astron. Soc. 000, 1 6 (2011) Printed 4 September 2017 (MN LaT E X style file v2.2) Frequency dependence of the large frequency separation of solar-like oscillators: Influence of the Helium
Mon. Not. R. Astron. Soc. 000, 1 6 (2011) Printed 4 September 2017 (MN LaT E X style file v2.2) Frequency dependence of the large frequency separation of solar-like oscillators: Influence of the Helium
Lines of Hydrogen. Most prominent lines in many astronomical objects: Balmer lines of hydrogen
 The Family of Stars Lines of Hydrogen Most prominent lines in many astronomical objects: Balmer lines of hydrogen The Balmer Thermometer Balmer line strength is sensitive to temperature: Most hydrogen
The physics of red-giant oscillations
 The physics of red-giant oscillations Marc-Antoine Dupret University of Liège, Belgium The impact of asteroseismology across stellar astrophysics Santa Barbara, 24-28 oct 2011 Plan of the presentation
Supplementary Figure 1 Comparison of the distribution of S indices measured by LAMOST (red) and the distribution measured by Isaacson & Fischer 57
 and the distribution measured by Isaacson & Fischer 57") Supplementary Figure 1 Comparison of the distribution of S indices measured by LAMOST (red) and the distribution measured by Isaacson & Fischer 57 (black). Isaacson and Fischer observe more high-activity
Supplementary Figure 1 Comparison of the distribution of S indices measured by LAMOST (red) and the distribution measured by Isaacson & Fischer 57 (black). Isaacson and Fischer observe more high-activity
Diffusion and helioseismology
 Diffusion and helioseismology Jørgen Christensen-Dalsgaard Institut for Fysik og Astronomi, Aarhus Universitet & Danish AsteroSeismology Centre (DASC) Eddington (1926): The internal constitution of the
The impact of stellar oscillations on doppler velocity planet searches
 Mon. Not. R. Astron. Soc. 386, 516 520 (2008) doi:10.1111/j.1365-2966.2008.13061.x The impact of stellar oscillations on doppler velocity planet searches S. J. O Toole, 1 C. G. Tinney 1,2 and H. R. A.
Spots and white light ares in an L dwarf
 Mem. S.A.It. Vol. 84, 1147 c SAIt 213 Memorie della Spots and white light ares in an L dwarf J. E. Gizis 1, A. J. Burgasser 2, E. Berger 3, P. K. G. Williams 3, F. J. Vrba 4, K. L. Cruz 5,6, and S. Metchev
Kepler Stellar Properties Catalog Update for Q1-Q17 Transit Search
 Kepler Stellar Properties Catalog Update for Q1-Q17 Transit Search KSCI-19083 Stellar Properties Working Group 05 February 2014 NASA Ames Research Center Moffett Field, CA 94035 Prepared by: Date: 2/6/14
TESS and Galactic Science
 TESS and Galactic Science! Keivan Stassun!! WFIRST Meeting! 18 November 2014! 1! Preliminary TESS Mission Schedule! Activity! Date! Status! Systems Requirement Review! 12-13 Feb 2014! Completed! Preliminary
STELLAR ROTATION AND MAGNETIC ACTIVITY:
 STELLAR ROTATION AND MAGNETIC ACTIVITY: USING ASTEROSEISMOLOGY Rafael A. García Service d Astrophysique, CEA-Saclay, France Special thanks to: S. Mathur, K. Auguston, J. Ballot, T. Ceillier, T. Metcalfe,
arxiv: v2 [astro-ph.sr] 7 Nov 2017
![arxiv: v2 [astro-ph.sr] 7 Nov 2017](/thumbs/93/118038918.jpg "arxiv: v2 [astro-ph.sr] 7 Nov 2017") DRAFT VERSION MARCH 6, 2018 Typeset using L A TEX preprint2 style in AASTeX61 EMPIRICAL, ACCURATE MASSES AND RADII OF SINGLE STARS WITH TESS AND GAIA KEIVAN G. STASSUN, 1, 2 ENRICO CORSARO, 3 JOSHUA A.
DRAFT VERSION MARCH 6, 2018 Typeset using L A TEX preprint2 style in AASTeX61 EMPIRICAL, ACCURATE MASSES AND RADII OF SINGLE STARS WITH TESS AND GAIA KEIVAN G. STASSUN, 1, 2 ENRICO CORSARO, 3 JOSHUA A.
Modelling stellar micro-variability
 Image: GOES-12 / SXI composite of Venus 2004 transit Modelling stellar micro-variability S. Aigrain (IoA, Cambridge) F. Favata (ESA/ESTEC), G. Gilmore (IoA, Cambridge) Outline Motivation in the context
The Pulsation Properties of the Double-Mode RR Lyrae Variable V79 in Messier 3
 336 The Pulsation Properties of the Double-Mode RR Lyrae Variable V79 in Messier 3 Christine M. Clement Department of Astronomy and Astrophysics, University of Toronto, Toronto, ON, M5S 3H8, Canada Mike
arxiv: v1 [astro-ph.sr] 3 Aug 2016
![arxiv: v1 [astro-ph.sr] 3 Aug 2016](/thumbs/78/77262862.jpg "arxiv: v1 [astro-ph.sr] 3 Aug 2016") The asteroseismic potential of TESS: exoplanet-host stars T. L. Campante 1,2 campante@bison.ph.bham.ac.uk arxiv:1608.01138v1 [astro-ph.sr] 3 Aug 2016 and M. Schofield 1,2, J. S. Kuszlewicz 1,2, L. Bouma
The asteroseismic potential of TESS: exoplanet-host stars T. L. Campante 1,2 campante@bison.ph.bham.ac.uk arxiv:1608.01138v1 [astro-ph.sr] 3 Aug 2016 and M. Schofield 1,2, J. S. Kuszlewicz 1,2, L. Bouma
Calibrating Core Overshooting in Low-Mass Stars with Kepler Data
 Calibrating Core Overshooting in Low-Mass Stars with Kepler Data S. Deheuvels 1,2 1 Université de Toulouse; UPS-OMP; IRAP; Toulouse, France 2 CNRS; IRAP; 14, avenue Edouard Belin, F-31400 Toulouse, France
Asteroseismology of Red Giants. Josefina Montalbán Université de Liège
 Asteroseismology of Red Giants Josefina Montalbán Université de Liège Stellar oscillations Oscillation mode Variations of v r : spectroscopy Variations of luminosity: photometry Basic properties Lamb Frequency:
Chapter 8: The Family of Stars
 Chapter 8: The Family of Stars Motivation We already know how to determine a star s surface temperature chemical composition surface density In this chapter, we will learn how we can determine its distance
Characterization of the exoplanet host stars. Exoplanets Properties of the host stars. Characterization of the exoplanet host stars
 Characterization of the exoplanet host stars Exoplanets Properties of the host stars Properties of the host stars of exoplanets are derived from a combination of astrometric, photometric, and spectroscopic
Modelling Brightness Variability of Sun-Like Stars
 Modelling Brightness Variability of Sun-Like Stars V. Witzke, A. I. Shapiro, S. K. Solanki, N. A. Krivova Cool Stars 20 Fundamental Properties of Cool Stars August 1st, 2018 Veronika Witzke (MPS) 2018
The Kepler Exoplanet Survey: Instrumentation, Performance and Results
 The Kepler Exoplanet Survey: Instrumentation, Performance and Results Thomas N. Gautier, Kepler Project Scientist Jet Propulsion Laboratory California Institute of Technology 3 July 2012 SAO STScI 2012
Discovering Exoplanets Transiting Bright and Unusual Stars with K2
 Discovering Exoplanets Transiting Bright and Unusual Stars with K2 PhD Thesis Proposal, Department of Astronomy, Harvard University Andrew Vanderburg Advised by David Latham April 18, 2015 After four years
II. Results from Transiting Planets. 1. Global Properties 2. The Rossiter-McClaughlin Effect
 II. Results from Transiting Planets 1. Global Properties 2. The Rossiter-McClaughlin Effect Planet Radius Most transiting planets tend to be inflated. Approximately 68% of all transiting planets have radii
What does helioseismology tell us about the Sun?
 What does helioseismology tell us about the Sun? Jørgen Christensen-Dalsgaard Department of Physics and Astronomy, University of Aarhus & Danish AsteroSeismology Centre (DASC) Sir Arthur Stanley Eddington:
Rømer Science Mission Plan
 Institute of Physics and Astronomy, University of Aarhus Rømer Science Mission Plan Danish Small Satellite Programme Document No.(issue): MONS/IFA/MAN/PLN/0001(1) Date: 2001-05-29 Prepared by: Jørgen Christensen-Dalsgaard,
ASTRONOMY QUIZ NUMBER 11
 ASTRONOMY QUIZ NUMBER. Suppose you measure the parallax of a star and find 0. arsecond. The distance to this star is A) 0 light-years B) 0 parsecs C) 0. light-year D) 0. parsec 2. A star is moving toward
Astronomy Exam 3 - Sun and Stars
 Astronomy Exam 3 - Sun and Stars Study online at quizlet.com/_4zgp6 1. `what are the smallest group of stars in the H-R diagram 2. A star has a parallax of 0.05". what is the distance from the earth? white
SUPPLEMENTARY INFORMATION
 1. Identification of classical Cepheids: We identified three classical Cepheids amongst the 45 short-period variables discovered. Our sample includes classical Cepheids, type II Cepheids, eclipsing binaries
Flare stars across the H R diagram
 doi:10.1093/mnras/stu2651 Flare stars across the H R diagram L. A. Balona South African Astronomical Observatory, PO Box 9, Observatory 7935, Cape Town, South Africa Accepted 2014 December 11. Received
arxiv: v1 [astro-ph.ep] 5 Nov 2017
![arxiv: v1 [astro-ph.ep] 5 Nov 2017](/thumbs/88/115377505.jpg "arxiv: v1 [astro-ph.ep] 5 Nov 2017") Noise Sources in Photometry and Radial Velocities Mahmoudreza Oshagh arxiv:1711.01564v1 [astro-ph.ep] 5 Nov 2017 Abstract The quest for Earth-like, extrasolar planets (exoplanets), especially those located
Noise Sources in Photometry and Radial Velocities Mahmoudreza Oshagh arxiv:1711.01564v1 [astro-ph.ep] 5 Nov 2017 Abstract The quest for Earth-like, extrasolar planets (exoplanets), especially those located
Granulation in stars. solar granulation. Thomas IAU GA Beijing, Aug Wednesday, January 2, 13
 Granulation in stars Thomas Kallinger @ IAU GA Beijing, Aug 2012 solar granulation granulation in the Sun the solar signal... SOHO/NASA activity granulation pulsation the solar background... simple model
Radiation Zone. AST 100 General Astronomy: Stars & Galaxies. 5. What s inside the Sun? From the Center Outwards. Meanderings of outbound photons
 AST 100 General Astronomy: Stars & Galaxies 5. What s inside the Sun? From the Center Outwards Core: Hydrogen ANNOUNCEMENTS Midterm I on Tue, Sept. 29 it will cover class material up to today (included)
SONG overview. Jørgen Christensen-Dalsgaard Department of Physics and Astronomy Aarhus University
 SONG overview Jørgen Christensen-Dalsgaard Department of Physics and Astronomy Aarhus University The SONG concept Network of 8 telescopes with a global distribution Long, nearly continuous observations
Date of delivery: 29 June 2011 Journal and vol/article ref: IAU Number of pages (not including this page): 5
: 5") Date of delivery: 29 June 2011 Journal and vol/article ref: IAU 1101577 Number of pages (not including this page): 5 Author queries: Typesetter queries: Non-printed material: The Physics of Sun and Star
Date of delivery: 29 June 2011 Journal and vol/article ref: IAU 1101577 Number of pages (not including this page): 5 Author queries: Typesetter queries: Non-printed material: The Physics of Sun and Star
ASTRONOMY 1 EXAM 3 a Name
 ASTRONOMY 1 EXAM 3 a Name Identify Terms - Matching (20 @ 1 point each = 20 pts.) Multiple Choice (25 @ 2 points each = 50 pts.) Essays (choose 3 of 4 @ 10 points each = 30 pt 1.Luminosity D 8.White dwarf
Asterseismology and Gaia
 Asterseismology and Gaia Asteroseismology can deliver accurate stellar radii and masses Huber et al 2017 compare results on distances from Gaia and asteroseismology for 2200 Kepler stars Asteroseismology
Enhancing Our Understanding of Ultracool Dwarfs with Arecibo Observatory
 Enhancing Our Understanding of Ultracool Dwarfs with Arecibo Observatory Arecibo Observatory has recently been involved in searches for bursts of radio emission from ultracool dwarfs, which bridge the
Based on the reduction of the intensity of the light from a star with distance. It drops off with the inverse square of the distance.
 6/28 Based on the reduction of the intensity of the light from a star with distance. It drops off with the inverse square of the distance. Intensity is power per unit area of electromagnetic radiation.
arxiv: v3 [astro-ph.sr] 10 Jul 2013
![arxiv: v3 [astro-ph.sr] 10 Jul 2013](/thumbs/78/76940622.jpg "arxiv: v3 [astro-ph.sr] 10 Jul 2013") ERRATUM TO THIS PAPER IS ATTACHED IN APPENDIX. Preprint typeset using LATEX style emulateapj v. 5/2/11 A REVISED EFFECTIVE TEMPERATURE SCALE FOR THE KEPLER INPUT CATALOG MARC H. PINSONNEAULT 1, DEOKKEUN
ERRATUM TO THIS PAPER IS ATTACHED IN APPENDIX. Preprint typeset using LATEX style emulateapj v. 5/2/11 A REVISED EFFECTIVE TEMPERATURE SCALE FOR THE KEPLER INPUT CATALOG MARC H. PINSONNEAULT 1, DEOKKEUN
HARPS-N Contributions to the Mass-Radius
 HARPS-N Contributions to the Mass-Radius Diagram for Rocky Exoplanets David Latham for the HARPS-N team HARPS-N Collaboration Francesco Pepe, Andrew Collier Cameron, David W. Latham, Emilio Molinari, Stéphane
The BRITE satellite and Delta Scuti Stars: The Magnificent Seven
 Comm. in Asteroseismology Vol. 152, 2008 The BRITE satellite and Delta Scuti Stars: The Magnificent Seven M. Breger Institut für Astronomie, Türkenschanzstrasse 17, 1180 Vienna, Austria Abstract This paper
A Pathway to Earth-like Worlds:
 A Pathway to Earth-like Worlds: Overcoming Astrophysical Noise due to Convection Dr. Heather Cegla!! Dr. Chris Watson, Dr. Sergiy Shelyag, Prof. Mihalis Mathioudakis A Pathway to Earth-like Worlds: CoRoT
List of submitted target proposals
 List of submitted target proposals Hans Kjeldsen, KASOC, Aarhus University - October 17, 2008 - Below is the complete list of target proposals submitted for the first targets selection round (October 2008).
arxiv: v1 [astro-ph.im] 4 Dec 2014
![arxiv: v1 [astro-ph.im] 4 Dec 2014](/thumbs/84/89105815.jpg "arxiv: v1 [astro-ph.im] 4 Dec 2014") Preprint typeset using L A TEX style emulateapj v. 5/2/11 REDUCED LIGHT CURVES FROM CAMPAIGN 0 OF THE K2 MISSION Andrew Vanderburg 1,2 Harvard Smithsonian Center for Astrophysics, 60 Garden St., Cambridge,
Preprint typeset using L A TEX style emulateapj v. 5/2/11 REDUCED LIGHT CURVES FROM CAMPAIGN 0 OF THE K2 MISSION Andrew Vanderburg 1,2 Harvard Smithsonian Center for Astrophysics, 60 Garden St., Cambridge,
arxiv: v1 [astro-ph.sr] 2 Dec 2015
![arxiv: v1 [astro-ph.sr] 2 Dec 2015](/thumbs/95/125366569.jpg "arxiv: v1 [astro-ph.sr] 2 Dec 2015") Astronomy & Astrophysics manuscript no. gl581ha c ESO 18 September, 18 Periodic Hα variations in GL 581: Further evidence for an activity origin to GL 581d A. P. Hatzes Thüringer Landessternwarte Tautenburg,
Astronomy & Astrophysics manuscript no. gl581ha c ESO 18 September, 18 Periodic Hα variations in GL 581: Further evidence for an activity origin to GL 581d A. P. Hatzes Thüringer Landessternwarte Tautenburg,
Design Reference Mission. DRM approach
 Design Reference Mission The Design Reference Mission (DRM) is a set of observing programs which together provide a tool to assist with tradeoff decisions in the design of the E-ELT (examples of observing
Helioseismology: GONG/BiSON/SoHO
 Helioseismology: GONG/BiSON/SoHO Asteroseismology: Solar-like oscillations in other stars Study stars of different Masses, Ages and Chemical Composition Stellar Structure and Evolution Solar-like oscillations
arxiv: v1 [astro-ph.sr] 12 May 2016
![arxiv: v1 [astro-ph.sr] 12 May 2016](/thumbs/91/107676833.jpg "arxiv: v1 [astro-ph.sr] 12 May 2016") DRAFT VERSION OCTOBER 20, 2018 Preprint typeset using LATEX style emulateapj v. 8/13/10 PROBING THE DEEP END OF THE MILKY WAY WITH KEPLER: ASTEROSEISMIC ANALYSIS OF 854 FAINT RED GIANTS MISCLASSIFIED AS
DRAFT VERSION OCTOBER 20, 2018 Preprint typeset using LATEX style emulateapj v. 8/13/10 PROBING THE DEEP END OF THE MILKY WAY WITH KEPLER: ASTEROSEISMIC ANALYSIS OF 854 FAINT RED GIANTS MISCLASSIFIED AS
Stellar Evolution. Eta Carinae
 Stellar Evolution Eta Carinae Evolution of Main Sequence Stars solar mass star: from: Markus Bottcher lecture notes, Ohio University Evolution off the Main Sequence: Expansion into a Red Giant Inner core
Astr 5465 Feb. 6, 2018 Today s Topics
 Astr 5465 Feb. 6, 2018 Today s Topics Stars: Binary Stars Determination of Stellar Properties via Binary Stars Classification of Binary Stars Visual Binaries Both stars visible Only one star visible Spectroscopic
The Structure of the Sun. CESAR s Booklet
 How stars work In order to have a stable star, the energy it emits must be the same as it can produce. There must be an equilibrium. The main source of energy of a star it is nuclear fusion, especially
arxiv: v2 [astro-ph.ep] 29 Nov 2015
![arxiv: v2 [astro-ph.ep] 29 Nov 2015](/thumbs/88/114880921.jpg "arxiv: v2 [astro-ph.ep] 29 Nov 2015") Astronomy in Focus, Volume 1 XXIXth IAU General Assembly, August 2015 Piero Benvenuti, ed. c 2015 International Astronomical Union DOI: 00.0000/X000000000000000X Asteroseismology of Exoplanet Host Stars
Astronomy in Focus, Volume 1 XXIXth IAU General Assembly, August 2015 Piero Benvenuti, ed. c 2015 International Astronomical Union DOI: 00.0000/X000000000000000X Asteroseismology of Exoplanet Host Stars
The Hertzprung-Russell Diagram. The Hertzprung-Russell Diagram. Question
 Key Concepts: Lecture 21: Measuring the properties of stars (cont.) The Hertzsprung-Russell (HR) Diagram (L versus T) The Hertzprung-Russell Diagram The Stefan-Boltzmann Law: flux emitted by a black body
Exploring the Rotation-Activity Relation of M-type main sequence stars with PLATO
 Exploring the Rotation-Activity Relation of M-type main sequence stars with PLATO Stefanie Raetz 1 B. Stelzer 1,2, M. Damasso 3, D. Peterson 4, D. Pizzocaro 5,6, A. Scholz 7 and S. P. Matt 8 1 IAAT Tübingen;
THE AGE OF THE KIC SYSTEM. James MacDonald and D. J. Mullan Department of Physics and Astronomy, DE 19716, USA
 THE AGE OF THE KIC 7177553 SYSTEM James MacDonald and D. J. Mullan Department of Physics and Astronomy, DE 19716, USA ABSTRACT KIC 7177553 is a quadruple system containing two binaries of orbital periods
7. The Evolution of Stars a schematic picture (Heavily inspired on Chapter 7 of Prialnik)
") 7. The Evolution of Stars a schematic picture (Heavily inspired on Chapter 7 of Prialnik) In the previous chapters we have seen that the timescale of stellar evolution is set by the (slow) rate of consumption
7. The Evolution of Stars a schematic picture (Heavily inspired on Chapter 7 of Prialnik) In the previous chapters we have seen that the timescale of stellar evolution is set by the (slow) rate of consumption
L = 4 d 2 B p. 4. Which of the letters at right corresponds roughly to where one would find a red giant star on the Hertzsprung-Russell diagram?
 Fall 2016 Astronomy - Test 3 Test form B Name Do not forget to write your name and fill in the bubbles with your student number, and fill in test form B on the answer sheet. Write your name above as well.
L = 4 d 2 B p. 1. Which outer layer of the Sun has the highest temperature? A) Photosphere B) Corona C) Chromosphere D) Exosphere E) Thermosphere
 Photosphere B) Corona C) Chromosphere D) Exosphere E) Thermosphere") Fall 2016 Astronomy - Test 3 Test form A Name Do not forget to write your name and fill in the bubbles with your student number, and fill in test form A on the answer sheet. Write your name above as well.
Fall 2016 Astronomy - Test 3 Test form A Name Do not forget to write your name and fill in the bubbles with your student number, and fill in test form A on the answer sheet. Write your name above as well.
The Later Evolution of Low Mass Stars (< 8 solar masses)
") The Later Evolution of Low Mass Stars (< 8 solar masses) http://apod.nasa.gov/apod/astropix.html The sun - past and future central density also rises though average density decreases During 10 billion
The Later Evolution of Low Mass Stars (< 8 solar masses) http://apod.nasa.gov/apod/astropix.html The sun - past and future central density also rises though average density decreases During 10 billion
LESSON 1. Solar System
 Astronomy Notes LESSON 1 Solar System 11.1 Structure of the Solar System axis of rotation period of rotation period of revolution ellipse astronomical unit What is the solar system? 11.1 Structure of the
Monitoring the Behavior of Star Spots Using Photometric Data
 Monitoring the Behavior of Star Spots Using Photometric Data P. Ioannidis 1 and J.H.M.M. Schmitt 1 1 Hamburger Sternwarte, Gojenbergsweg 112, 21029 HH - Germany Abstract. We use high accuracy photometric
arxiv: v2 [astro-ph.sr] 26 Feb 2014
![arxiv: v2 [astro-ph.sr] 26 Feb 2014](/thumbs/80/81435224.jpg "arxiv: v2 [astro-ph.sr] 26 Feb 2014") Astronomy& Astrophysics manuscript no. Activity_Fstars_accepted c ESO 2018 March 9, 2018 Magnetic activity of F stars observed by Kepler S. Mathur 1, 2, R. A. García 1, J. Ballot 3, 4, T. Ceillier 1, D.
Astronomy& Astrophysics manuscript no. Activity_Fstars_accepted c ESO 2018 March 9, 2018 Magnetic activity of F stars observed by Kepler S. Mathur 1, 2, R. A. García 1, J. Ballot 3, 4, T. Ceillier 1, D.
PLATO Follow-up. Questions addressed. Importance of the follow-up. Importance of the follow-up. Organisa(on*&*Progress*Report
 PLATO Follow-up Organisa(on*&*Progress*Report Questions addressed A next generation transit mission will be efficient only with ground-based help S. Udry University of Geneva (Geneva Observatory) Needs
UMR8109, Université Pierre et Marie Curie, Université Denis Diderot, Obs. de Paris, Meudon Cedex, France.
 On-line abstract: The 11-year activity cycle of the Sun is a consequence of a dynamo process occurring beneath its surface. We analyzed photometric data obtained by the CoRoT space mission, showing solar
What is the solar system?
 Notes Astronomy What is the solar system? 11.1 Structure of the Solar System Our solar system includes planets and dwarf planets, their moons, a star called the Sun, asteroids and comets. Planets, dwarf
SEQUENCING THE STARS
 SEQUENCING THE STARS ROBERT J. VANDERBEI Using images acquired with modern CCD cameras, amateur astronomers can make Hertzsprung-Russell diagrams from their own images of clusters. In this way, we can
Combining WASP and Kepler data: the case of the δ Sct star KIC
 doi:10.1093/mnras/stv364 Combining WASP and Kepler data: the case of the δ Sct star KIC 7106205 Dominic M. Bowman, 1 Daniel L. Holdsworth 2 and Donald W. Kurtz 1 1 Jeremiah Horrocks Institute, University
Exoplanets and The Transiting Exoplanet Survey Satellite (TESS)
") Exoplanets and The Transiting Exoplanet Survey Satellite (TESS) Ryan J. Oelkers Monday, June 25, 2018 QuarkNET 2018 It is estimated that nearly all stars in the Milky Way Galaxy have 1-1.5 planets orbiting
Exoplanets and The Transiting Exoplanet Survey Satellite (TESS) Ryan J. Oelkers Monday, June 25, 2018 QuarkNET 2018 It is estimated that nearly all stars in the Milky Way Galaxy have 1-1.5 planets orbiting