High Speed Imaging of Edge Turbulence in NSTX
|
|
|
- Julian Heath
- 5 years ago
- Views:
Transcription
1 High Speed Imaging of Edge Turbulence in NSTX S.J. Zweben, R. Maqueda 1, D.P. Stotler, A. Keesee 2, J. Boedo 3, C. Bush 4, S. Kaye, B. LeBlanc, J. Lowrance 5, V. Mastrocola 5, R. Maingi 4, N. Nishino 6, G. Renda 5, D. Swain 4, J. Wilgen 4 and the NSTX Team Princeton Plasma Physics Laboratory, Princeton, NJ 1 Los Alamos National Laboratory, Los Alamos, NM 2 West Virginia University, Morgantown, WV 3 UCSD, San Diego, CA 4 Oak Ridge National Laboratory, Oak Ridge, TN 5 Princeton Scientific Instruments Inc, Monmouth Junction, NJ 6 Hiroshima University, Hiroshima, Japan Abstract The 2-D radial vs. poloidal structure and motion of edge turbulence in NSTX were measured by using high-speed imaging of the visible light emission from a localized neutral gas puff. Edge turbulence images are shown and analyzed for Ohmic, L-mode and H-mode plasma conditions. Typical edge turbulence poloidal correlation lengths as measured using this technique are 4±1 cm and autocorrelation times are 40±20 µsec in all three regimes. The relative fluctuation level is typically smaller in H-mode than in L- mode, and transitions from H- to L-mode and can occur remarkably quickly ( 30 µsec). The 2-D images often show localized regions of strong light emission which move both poloidally and radially through the observed region at a typical speed of 10 5 cm/sec, and sometimes show a spatially coherent mode with a poloidal wavelength of 15 cm. 1
2 1. Introduction Turbulence in the edge region of tokamaks and other magnetized plasmas has been measured for many years, yet the theoretical understanding of the experimental observations has so far been qualitative at best [see Ref. 1-4 for reviews]. This topic has recently become important to the progress of magnetic fusion since the edge plasma conditions will play a significant role in both the plasma-wall interaction and the global plasma performance. During the past few years powerful 3-D computational simulations based on nonlinear fluid models of edge turbulence have become available [5-11], and so it should now be possible to make quantitative comparisons of edge turbulence data with such simulations. The purpose of this paper is to present experimental data on edge turbulence in NSTX as a step toward future quantitative comparisons with relevant theory and numerical simulation. The main results of the present paper are contained in the 2-D images of edge turbulence, which show the radial vs. poloidal structure and motion in greater spatial detail than previous measurements. These images show the usual turbulent (i.e. random) looking structure in most cases, but also show a variety of coherent (i.e. non-random or intermittent) structures, which are difficult to analyze using conventional statistical methods. These results also show a reduction of the relative fluctuation level in many (but not all) H-mode images with respect to those in Ohmic and L-mode plasmas. Of course, the cause and significance of these results cannot be understood without turbulence theory or simulation, which is not yet completed for NSTX edge plasmas. Previous 2-D measurements of edge turbulence were made using Langmuir probe arrays [12-14], thermal lithium beam imaging [15], beam emission spectroscopy [16], and gas puff imaging [17-20]. The present paper uses the gas puff imaging (GPI) technique, which is described in detail in Ref. 20. The new feature of the present measurements is the use of an ultra-high speed camera capable of recording the 2-D structure and motion with high space and time resolution in the radial vs. poloidal plane. A similar (but somewhat lower resolution) camera was used briefly on Alcator C-Mod [19]. Wide angle images taken using fast cameras on NSTX [17] and MAST [21] have also shown that the edge light emission from the plasma has a very long (many meter) correlation length along the magnetic field and a short (few-cm-scale) correlation length across the magnetic field B, similar to previous tokamak images on TFTR[22] and ASDEX [23]. Very long parallel correlation lengths have also been seen with probes in the scrape-off layer on JET [24]. This nearly 2-D nature of edge turbulence allows the radial vs. poloidal structure to be imaged with GPI by viewing along a magnetic field line. A generic feature of edge turbulence seen in NSTX and many previous devices is its "intermittency". As extensively documented by recent probe measurements in DIII-D [25-27], the edge fluctuations often depart from a Gaussian distribution and feature a significant number of events above the standard deviation, particularly in the scrape-off 2
3 layer outside the separatrix. This intermittency has been characterized using conditional averaging, with the result that moving, intermittent coherent structures are convected through the edge/sol of magnetically confined plasmas and carry a large fraction of the total transport, as discussed in [25] and references therein. Another generic feature of edge turbulence is its apparent "universality". As perhaps first noted by Chen in 1965 [28], the frequency spectrum of turbulence has a similar shape in many types of magnetized plasmas, including various types of gas discharges, linear machines, and toroidal fusion devices [29-32]. Some information on the scaling of edge turbulence within a given device is available [33,34], but a clear identification of the dominant driving and damping mechanisms has not emerged from the data. Not surprisingly, the present results on edge turbulence in NSTX share many features in common with these previous devices. The outline of this paper is as follows: Section 2 reviews the gas puff imaging diagnostic, Sec. 3 describes the experimental results, and Sec. 4 presents a discussion which includes a comparison with other diagnostics, experiments, and with theory. 2. Gas Puff Imaging Diagnostic The gas puff imaging (GPI) diagnostic on NSTX views the edge turbulence in the radial vs. poloidal plane near the outer edge of the plasma. This diagnostic and its interpretation have recently been presented elsewhere [20] so only a relatively brief discussion will be presented here. 2.1 Hardware The GPI diagnostic in NSTX is illustrated in Fig. 1(a). A 30 cm long gas manifold is mounted on the outer wall behind the RF limiter shadow and oriented to produce a cloud of gas extending along the local poloidal direction at the plasma edge. Note that the magnetic field line in NSTX and other spherical tori is inclined 35º-55º with respect to the toroidal direction at the outer midplane. The gas puff which leaves this manifold is viewed from along the edge magnetic field lines through a reentrant port about 70 cm away. This view was chosen since edge turbulence is highly correlated along a magnetic field line in NSTX [17] and other machines [22-25]. Thus the gas puff is used to localize the light emission to obtain a cross-section of the turbulence in the radial vs. poloidal plane. For these experiments the image of the gas cloud is transferred to a Princeton Scientific Instruments PSI-4 camera [35] using a lens and mirror inside the reentrant port and a 400 x 400 coherent fiber optic bundle. This image is centered near the magnetic separatrix (which is the boundary between open and closed field lines) about 17º above the outer midplane, as shown in Fig. 1(b). The camera has a 32 cm poloidal x 16 cm radial viewing area perpendicular to the magnetic field at the gas cloud. 3
4 The PSI-4 camera used for these experiments has a specialized CCD which continuously stores the preceding 28 frames on the chip itself. Each frame is made up of 160 x 80 pixels and framing rates up to 10 6 frames/sec can be obtained with << 1 µsec delay between frames. The net quantum efficiency of the CCD is 30% in the visible, the noise level is 14 photoelectrons/pixel with a full-well of 25,000 photoelectrons/pixel, and the signals are digitized at 14 bits. The framing rate in NSTX was typically set at 10 µsec/frame to capture motion with an autocorrelation time of 40±20 µsec. The same optical system was previously used with 1 khz framing cameras with a 10 µsec exposure time [20]. A typical frame from the PSI-4 camera on NSTX is shown in Fig 2. This image was made by viewing the He gas puff through a HeI optical filter (587.6 nm, 5 nm wide). Similar images are obtained with a D 2 puff and a deuterium Balmer alpha (D a ) filter, but normally He was used since the signal/background ratio is larger for HeI for than for D a (without the He puff the image is black). The 160x80 pixel camera frame is indicated by the rotated white rectangle, and HeI light intensity is displayed using an 8 bit false color scale (left). The physical scale and orientation with respect to the local radially outward direction is shown, along with the toroidal projection of the RF antenna, which acts as the outer limiter in these experiments, and the magnetic separatrix as calculated by EFIT. The GPI gas manifold is located 3 cm radially outside the shadow of the RF limiter at this poloidal location. The spatial resolution of the optics in the imaging system was 0.4 cm over the whole field of view, as measured by the apparent size of a point light source (< 0.1 cm diameter) located in the object plane, and was set by the camera pixel size. However, the spatial resolution for turbulence structure in the plasma was dominated by the geometrical relationships between the viewing angle, the magnetic field lines, and the size of the gas cloud [20]. The typical radial averaging of 2±1 cm depends on the radial angle between the sightline and the toroidal extent of the gas cloud, which was measured from a side view using another camera. The poloidal averaging of cm depends on the poloidal angle of the (fixed) sightline with respect to the magnetic field line, which was minimized for the experiments below by optimizing the field line angle. For analysis, each image was first normalized to an in-vessel "white plate" calibration frame to remove vignetting and irregularities in the CCD camera. The data was then digitally smoothed over 3x3 pixels (0.6 cm) around each pixel, after first replacing each pixel by the median over its surrounding 3x3 pixels to remove saturated pixels produce by neutron/gamma noise during NBI discharges. Finally, each pixel was normalized to its average of all 28 frames in that shot to remove the spatial structure of the gas cloud. The smallest features visible in the resulting images were typically 1-2 cm FWHM (see Fig. 2). This image data was supplemented by a set of up to 13 individual detectors for time series data. These detectors each viewed a different 1.5 cm diameter region of the same image as the camera (using an optical beamsplitter). The light from each of these 4
5 "chord" data signals was measured by a photomultiplier/preamp with a bandwidth of 100 KHz (i.e. 2 µsec e-folding time), and the chords were digitized at 500,000 samples/sec for 64,000 samples (0.128 sec). 2.2 Origin of the Light Emission The amount of light emitted in the spectral line associated with a radiative transition from neutral atom state p to state q in a plasma depends on the neutral density and the local electron density and temperature and can be written as S pq = n o f p (n e, T e ) A pq [1] where n o is the ground state neutral density and A pq is the radiative decay rate of the p to q transition. For GPI, the local n o is determined by the neutral gas puff, which is constant over the turbulence timescale ( 2-10 µsec) and slowly varying over the turbulence space scale ( 2-10 cm). The function f p (n e,t e ) is the ratio of the density of state p to the ground state density. For electron densities and temperatures typical of the edge of fusion plasmas, this ratio is determined by the balance between electron impact excitation, deexcitation, ionization, recombination, and radiative decay. Collisional-radiative codes which model this balance for helium have been described by Fujimoto [36] and Goto [37]. The HeI (587.6 nm) line used in these experiments results from the 3 3 D to 2 3 P transition and has A = 7.1 x 10 7 s -1. Thus, the local light emission rate should follow the local changes in density and temperature due to fluctuations in the frequency range of interest ( 1 MHz). The DEGAS 2 neutral transport code [38,39] has been used to estimate n 0 and to calculate the time-averaged light emission expected for He GPI in NSTX, as shown for a typical case in Fig. 3. The inputs to this code are the edge density and temperature profiles measured by Thomson scattering, shown by smoothed fits at the bottom of Fig. 3, the magnetic surface geometry as calculated by EFIT, the approximate gas manifold geometry, and the effective rates obtained from the He collisional-radiative model [36,37]. The Monte Carlo routine in DEGAS 2 code follows neutrals in 3-D and calculates the HeI (587.6 nm) light emission. The present simulation assumes toroidal symmetry and does not replicate the experimental camera view. Instead, the simulation results are presented as plots in the radial-poloidal plane. The peak of the calculated HeI emission occurs at T e 20 ev, and agrees with the measured time-averaged HeI emission for the same discharge (#108322) to within 1 cm, as shown in Fig. 3. However, the width of the calculated emission is significantly narrower than the measured emission, most likely due to the simplified geometry in DEGAS 2 and to the effect of turbulence on the light emission. A similar level of agreement was obtained between DEGAS 2 and the D a light emission profile during GPI in Alcator C-Mod [19,39]. According to Eq. 1, local fluctuations in HeI light emission S could be due to fluctuations in n e, T e, or n o. The dependence of S on n e and T e near the center of the emission cloud dependence is roughly S µ n e 0.5 T e 0.7, but these exponents vary with n e and 5
6 T e (see Sec. IV.A). The interpretation is somewhat simplified if the electron density and temperature fluctuations are in phase, as expected theoretically and approximately verified using Langmuir probes in DIII-D [26] and TEXT [40]. However, even then it is difficult to directly unfold the density fluctuations from the light emission fluctuations when the n e and T e fluctuations are large. The possible influence of a varying neutral density caused by the turbulence itself was discussed in [39] for deuterium GPI in Alcator C-Mod, and should be similar for He in NSTX. For example, a large positive density or temperature perturbation could ionize some of the He neutrals and lead to a decrease in the neutral density and HeI light emission radially inside this perturbation (i.e. "shadowing"), somewhat similar to the "edge" effect seen in BES measurements [16]. This has been simulated using DEGAS 2 with simplified models for density and temperature perturbations. The spatial structure of the resulting HeI light fluctuation patterns has so far been found to be close to the structure of the assumed density or temperature perturbations (although the relative fluctuation levels are different). Experimentally, the shadowing effect would produce a radial dipole-type structure in which a high density at larger radius would be correlated with a small density at smaller radius, and vice versa. However, there is little or no sign of such shadowing in either the image data or the chord data. In the present paper the experimental results will be presented and analyzed in terms of the HeI light emission itself without attempting to unfold the underlying density or temperature fluctuations. However, the space-time structure of the turbulence seen in these images should be similar to the structure of the underlying plasma turbulence, based on numerical simulations (Sec. IV.A) and comparisons with other edge turbulence diagnostics (Sec. IV.B). For a more quantitative comparison between theory and simulation, an atomic physics/neutral model such as DEGAS 2 can be used as a "postprocessor" to calculate the expected GPI images from the turbulence model results, thus avoiding the need to directly unfold the temperature and density fluctuations from the GPI data. This procedure has been done with some success for GPI data from Alcator C- Mod [19] and will be done for NSTX when theoretical simulations become available. 2.3 Experimental limitations and uncertainties A major limitation in these results is the relatively small range of space and time covered by the present GPI diagnostic. In particular, the emission of HeI emission occurs only where the electron temperature is T e 5-50 ev, which corresponds to a radial range of only 3-8 cm (FWHM) in NSTX. This turns out to be 1-2 radial correlation lengths, thus making it difficult to determine the radial k-spectrum. The poloidal resolution of this system is presently limited to 1 cm by GPI geometry (for optimum viewing angles), thus limiting the k-ressolution to the region 4 cm -1. The framing rate and duration of the imaging was constrained by the number of camera frames per shot (28), which made it difficult evaluate the time evolution during a discharge. The usual frame integration time of 10 µsec was chosen minimize blurring of fast moving features yet allow the motion to be seen over several autocorrelation times. 6
7 A major uncertainty in the present data is the location of the magnetic separatrix with respect to the GPI imaging area. Modeling based on the SOL power balance in NSTX [41] suggests that the separatrix electron temperature should be roughly ev for the L-mode and H-mode cases and ev for the Ohmic cases, depending on input assumptions. However, the separatrix determined by EFIT is presently located in regions where T e 5-20 ev (see Fig. 6), i.e. 1-2 centimeters farther out than expected from power balance. This discrepancy is not yet resolved. Also, the angle of the calculated separatrix in the plane of the GPI image is up to 7º different from the angle of the GPI light emission line in H-modes, which may be due to errors in the EFIT reconstruction or in the GPI geometric calibration (or, it may be a real difference). As described above, a general limitation in these results is the uncertain relationship between density and temperature fluctuations, both of which can contribute to fluctuations in the measured HeI light emission. However, if these fluctuations are correlated, as expected for turbulent fluid motion dominated by ExB advection with negligible magnetic flutter, then the resulting structure of the HeI light emission should be similar to both of them (see Sec. IV.A). Another uncertainty in the interpretation of the HeI light emission is the possible effect of metastable states on the spectrum; however, since images in D a look similar to HeI(587.6 nm) images (see Sec. 3.4), this is unlikely to be a dominant effect. The gas puff used for imaging the turbulence in these GPI measurements does not seem to perturb either the plasma edge or the edge turbulence itself [20]. The evidence for the lack of a perturbing effect is: (a) the insensitivity of the turbulence with respect to the strength of the He gas puff seen in the GPI diagnostic itself (Sec. 3.2), (b) the similar turbulence seen in GPI measurements with He or D 2 puffs (Sec. 3.4), and (c) the insensitivity of the edge turbulence measured by other NSTX diagnostics with or without the GPI He puff (Sec. 4.2). The maximum He puff rate in NSTX of 6x10 20 atoms/sec is much smaller than atoms/sec used for the strong puffing case analyzed for TEXTOR [42]. 3. Experimental Results This section describes the measurements and analysis of the space vs. time patterns of the HeI light emission seen with GPI in NSTX. Typical image data and image analysis is presented in Sec. 31, time series data and analysis from the discrete detectors are presented in Sec. 3.2, discussion of possible coherent structures is presented in Sec. 3.3, and other imaging results are described in Sec The relationship between the light emission fluctuations and the underlying density and temperature fluctuations is discussed in Sec A general description of the NSTX device can be found elsewhere [43]. Figure 4 illustrates time dependences for a typical NSTX discharge, where R=90 cm, a=65 cm, B=3.5 kg, I=850 ka, and 1.7 MW of NBI was on from sec (#108980). Other 7
8 global parameters for this shot are k 1.8, q(a) 8, t E 30 ms, and b T =10%. The plasma current and line-averaged density are approximately constant over ms, as shown in the top two traces. The He puff for GPI starts at 0.27 s and the PSI camera was triggered at 0.29 s in this shot. 3.1 Image Data A list of the discharges used for image analysis in this paper is shown in Table 1. Most of these were taken on the same day (5/13/02). Many of these discharges had neutral beam injection (NBI), but none had high-harmonic fast wave heating. Typical parameters for one of these discharges are listed in Table 2, and a typical equilibrium was shown in Fig. 1. Animations of these images can be seen on the web site in Ref. 44. Three examples of the high-speed images of HeI light emission in NSTX are shown in Fig 5. These particular images are for an (a) Ohmic discharge, (b) L-mode discharge, and (c) a quiescent period during an H-mode discharge. In each case there are 10 successive frames taken at 10 µsec/frame with the same field of view and color scale as shown in Fig. 1. However, the images in Fig. 5 are not rotated (for compactness), so the radially outward direction is toward the upper right, as shown by the arrow in the first frame of (b). The approximate separatrix location is shown in the last image of each sequence. For the image analysis below it was assumed that the local poloidal direction was along the line of constant HeI emission in the H-mode case (Fig. 5 bottom), but small uncertainties in this angle do not change the results significantly (see below). The Ohmic discharge in Fig. 5(a) shows the normal behavior of these images, which largely consist of bright 5 cm diameter emission regions which change shape and move across the field of view within 50 µsec (5 frames). The L-mode discharge in Fig. 5(b) has similar features but the emission pattern is somewhat narrower in the radial direction. The H-mode case in Fig. 5(c) was captured during a quiescent period and has a very narrow and nearly constant emission region; other H-mode images are not so quiescent (see Secs. 3.2 and 3.3). Analysis of the images from these three discharges is shown in Fig. 6. For this figure the images were first rotated to the radial vs. poloidal direction (as for Fig. 1), and then sliced into boxes 0.6 cm radially x 18 cm in the poloidal direction. At the top of Fig. 6 are the HeI intensity levels "I" averaged over the poloidal length of each box and over all 28 frames for that shot (Fig. 3(a) shows the analysis region). In the next row are the relative fluctuation levels "di/i" derived as follows: first, each individual 2-D frame is normalized by the time-average over all 28 2-D frames in that shot to minimize the effects of the finite size of the He gas cloud; second, the rms deviations within each poloidal box from its average are calculated for each frame; and third, these rms deviations for each box are averaged over all 28 frames of the shot. In the next row are the poloidal correlation lengths L pol derived as follows: first, each individual 2-D frame is normalized by the time-average over all 28 2-D frames to minimize the effects of the finite size of the He gas cloud; second, the unnormalized poloidal cross-correlation 8
9 functions (i.e. covariances) are calculated for each box for each frame; third, these covariances are summed for each box over all 28 frames; and fourth, the FWHM of the resulting poloidal cross-correlation function is defined at L pol for that box. At the bottom are the density and temperature data from the Thomson scattering diagnostic for these shots at a time within about 1 ms of the GPI image data. The average HeI light emission peaks near T e 10 ev in each case, approximately as expected from the DEGAS 2 modeling (Fig. 3). The radial width of this emission is approximately 8 cm FWHM for the Ohmic case, 6 cm for the L-mode case, and 3 cm for the H-mode case. This width is most likely determined by the electron temperature and density profiles, which determine the local excitation rates, and these in turn are determined in part by the edge transport in a particular discharge. Roughly speaking, the HeI emission is localized in regions where T e 5-50 ev in NSTX. The location of the last closed flux surfaces (LCFS) are indicated at the top, each with estimated uncertainties of 1-2 cm. The L-mode and H-mode plasmas are lower single-null diverted, while the Ohmic plasma is limited on the inner wall. The relative HeI fluctuation levels for the Ohmic and L-mode plasmas were in the range 10-60% and increased monotonically toward the wall. The fluctuation level in this particular H-mode image sequence was only 5-10% in the center of the relatively narrow HeI emission cloud. The poloidal correlation lengths L pol as shown in the third row of Fig. 5 were typically 4±1 cm and approximately constant vs. radius in the region of brightest HeI emission. The correlation lengths appear to decrease away from the brightest region of the H-mode case, but this may be due to the relatively low signal/noise level for these small fluctuation levels. Figure 7 shows the relationship between L pol and di/i for a larger set of discharges (see Table 1), as evaluated near the radial peak of the HeI emission cloud for each case. Some H-mode shots have fluctuation levels comparable to Ohmic shots; other H-mode cases (not shown) had fluctuation levels below 5%, at which point the evaluation of L pol was difficult. In general, the poloidal correlation lengths were in the range L pol 4±1 cm, with no obvious variation among discharge types, and the relative fluctuation levels were lower on average in H-mode plasmas than Ohmic or L-mode plasmas. Fig. 8 illustrates the poloidal k-spectral amplitude for the three cases of Figs These spectra were obtained from FFTs of the poloidal spatial distributions near the radial peak of the HeI emission cloud, after normalizing each frame as a whole to the time-averaged frame for each discharge. The shapes of these three k-spectra are similar, but with the H-mode case having a significantly lower total fluctuation level. These spectra have not been corrected for the k-spectral resolution of the diagnostic, which is expected to reduce the amplitude significantly only above k pol 4 cm -1. Fig. 9 shows the time-averaged correlation lengths as a function of the angle in the radial vs. poloidal plane for a set of typical Ohmic and L-mode discharges. In each case this L(cm) is the FWHM of the correlation function calculated in a 0.6 cm wide by 12 cm long box rotated about the point "x" shown in Fig. 3(a), after normalizing by the 9
10 time-averaged frame in each case. There is a trend for the radial correlation lengths to be slightly shorter than the poloidal correlation lengths, but not by much more than the frame-to-frame variation within a single shot (shown by the error bars). The emission clouds for H-mode plasmas are too narrow in radius for the angular variation to be estimated this way. The dependence of edge turbulence on plasma density during the Ohmic discharges of Table 1 is shown in Fig. 10. Here the relative fluctuation levels and poloidal correlation lengths are plotted near the radial peak R peak of the HeI emission cloud as a function of the line averaged density <n e >. There was no significant change in di/i or L pol with density in this range, which goes up to 0.8 times the Greenwald density [45]. There is, however, a general shift of the radial peak of this emission to smaller major radius as the density increases, as shown at the bottom of the figure, which is partly due to an inward shift of the separatrix R sep at higher density, and probably also to a decrease in edge temperature with increasing density. 3.2 Time Series Data As described in Sec. 3.1, the image could be optically split and sent to a set of discrete fibers each of which viewed a 1.5 cm diameter area at the HeI emission cloud in the plasma. Since these chords sample a region much smaller than a correlation length, they can be used for time series analysis of the local turbulence properties. Typical results from a radial array of 7 chords each separated by 2 cm near the poloidal centroid of the HeI emission cloud are shown in Fig. 11. The He puff begins at 0.16 sec in this case, which was an Ohmic plasma with B=3 kg and I=700 ka (similar to the Ohmic cases of Table 1). The slow-time evolution is shown at the top and a fast timescale for part of these signals is shown at the bottom. The location of each chord is specified by the major radius of its magnetic flux surface as measured along the outer midplane, i.e. R MP. The separatrix for this shot is at R MP 149±1 cm, i.e. most of these chords are inside the separatrix. The radial profile of the relative fluctuation level di/i for this same shot is shown in Fig 12. This profile shows di/i increasing from 10% inside the separatrix to 90% outside the separatrix, which is qualitatively similar to the image analysis for the Ohmic case in Fig. 6 (the chordal time series data can be analyzed somewhat farther out in radius than the image data). Also shown in Fig. 12 is the similarity of the radial profiles of di/i just after the start of the He gas puff (0.165 sec) and near its peak (0.2 sec), showing that the GPI signals are insensitive to at least a factor-of-four change in the He flow rate [20]. The radial fluctuation profiles seen in this chord array for L-mode and H-mode plasmas are also qualitatively similar to those in the image analysis of Fig. 6. A time series analysis of two chords from this same Ohmic discharge is shown in Fig. 13. This analysis uses 10,000 times points between sec for one of the outer channels (R=150 cm) and an inner channel (R=144 cm). Both chords show short 10
11 autocorrelation times of t A 32 µsec and 24 µsec, respectively (t A is defined as the HWHM of the autocorrelation function), with no longer-time correlations visible. The power spectra are nearly flat below between 0.1 and 10 khz, except for some MHD modes (these spectra have been corrected for the amplifier frequency response). The probability distribution functions (PDFs) have a Gaussian shape on the inner channels and an "intermittent" non-gaussian shape in the outer channels. The autocorrelation times, frequency spectra, and PDFs in H-mode and L-mode plasmas were roughly similar to those for Ohmic plasmas. The most interesting information in the time dependent chord signals concerns the transition from H-to-L mode and vice versa, since there are (so far) no PSI camera images which captured these transitions. An example of the variation of the radial array signals during an H-L transition is shown in Fig. 14. The He gas enters during the H- mode phase at 0.18 sec and the H-L transition occurs at sec in this case. The transition was correlated with a large pulse of HeI light which propagates outward across this array at a speed of 10 6 cm/sec, as shown at the bottom of Fig. 14. This pulse occurs over a very short timescale of 30 µsec, which is comparable to the autocorrelation time of the L-mode turbulence. There is also a growing oscillation on the middle channel just before this pulse, which may be a trigger to this event. It is likely that edge profile changes are also occurring over this timescale, so it is difficult to interpret these changes quantitatively. Only a few cases of this type have been captured so far, so is not clear that this is universal feature of the H-L transition. An example of the GPI chord signals during an L-H transition is shown in Fig. 15, where the He gas enters at 0.39 sec and the H-mode transition is at sec. For the chords at R MP = 153 cm and 151 cm the average brightness decreases within 100 µs after the transition, as expected for positions where HeI is not emitted during the H-mode (see Fig. 5), and at R MP = 149 cm the average brightness increases at the H-mode transition, corresponding to region where the HeI light is bright during the H-mode. There are no obvious precursors to the H-mode transition in this or the few other cases seen so far. Most of the fluctuations after the H-mode onset in chord at R MP =149 cm are correlated with a coherent mode seen on the Mirnov signals at 20 khz, and unlikely to be related to the H-mode transition (see Sec. 3.3). Finally, during H-modes there are often edge localized modes (ELMs) of varying sizes which appear as transient bursts in the D a light emision [46]. Examples of the GPI HeI chord light signals during an H-mode with large ELMs are shown in Fig. 16. Most of the fluctuations seen in these chords appear to be independent of the large ELM events, as shown at the bottom. The bursts seen in the GPI chords (particularly in the outermost channels as shown) typically last 100 µsec, and often (but not always) propagate outward at 10 5 cm/sec. These are very likely the same as the localized coherent structures seen in the imaging system during H-modes (Sec. 3.3). However, there does seem to be some correlation of the large ELMs with an increase in bursts in the outermost channel, as shown at the bottom, probably due to an increase in edge density due to the ELM. Also, it is possible that the GPI bursts are correlated with small, localized, and/or fast D a bursts which are not resolved by the present D a detectors (which have a frequency response of 2 khz). 11
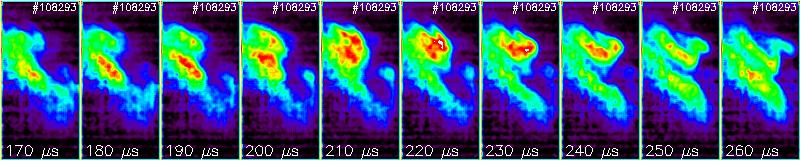
12 3.3 Coherent Structure and Motion One of the motivations for imaging plasma turbulence is to search for "coherent structures", which may loosely be defined as self-organized and relatively long-lived structures which exist within fully developed turbulence. In neutral fluids coherent structures are often seen as vortices, e.g. in near-wall turbulence [47], but they can have many different forms such as "bubbles", "spikes", "mushrooms", "fingers", "hairpins", "jets", "rings", etc [48]. Such structures are generally difficult to detect with single-point measurements except by statistical techniques such as conditional sampling, which average over many events. Examples of such non-random structure within plasma turbulence include "blobs" [49] or "intermittent plasma objects" [25-27], quasi-coherent modes [50], zonal flows [51], and perhaps avalanches [52]. Some examples of localized structures in the high speed images from NSTX are illustrated in Figs. 17. Here a blob is defined as a strong local maximum in the HeI light emission which moves over a distance larger than its own diameter (i.e. the red-white regions in these images). The images in Fig. 17(a)-(c) are from the Ohmic shots in Table 1, while (d) was from neutral beam heated case (fixed circles and diagonal lines have been added for reference). In (a) the blob moves radially outward and then seems to disappear; in (b) the blob first moves radially outward and then slightly upward (electron diamagnetic drift direction); in (c) the blob moves radially outward and then downward, and in (d) the blob enters from the top of the image, then moves downward, then radially outward, and finally downward. In general, these blobs move both radially and poloidally and change shape and size significantly over their lifetime within this field of view. Some analysis of this type of blob motion is shown in Fig. 18, which is based on a set of 22 discharges (mostly from Table 1). In each frame a blob was operationally defined as any region above an arbitrary threshold (typically 0.7 times the maximum brightness in that region). The blobs were tracked over all frames in each shot, and their properties were collected in a database of 146 tracks with an average length of 6-7 frames for each track. In the top row is the distribution of radial vs. poloidal velocities of the blobs as determined from the relative motion of blob centers between two successive frames during the tracking of a blob. At the bottom is the radial velocity vs. the intensity of the blobs, where the intensity is the average over these two frames normalized to the average over all (28) frames. The average blob area was cm 2, and the average lifetime within this field of view was µsec. The distribution of inferred blob velocities is rather broad, as shown at the top of Fig. 18, with mean velocity magnitudes of Ôv pol 1.2x10 5 cm/sec and Ôv rad 0.5x10 5 cm/sec, with slightly more blobs moving radially outward (to the right) than inward and more moving in the ion grad-b drift direction (downward) than the electron drift direction. The poloidal velocity distributions increase slightly toward the ion drift direction during L- and H-mode plasmas. The radial and poloidal velocity distributions are similar in the Ohmic case, but in L-mode and especially in H-mode the radial distribution appears to be narrower. However, this may in part be due to the narrower 12
13 range of radii viewed by GPI in these cases; for example, in H-mode any radial velocity 3 cm/10 µsec 3 km/sec would be difficult to track since the radial range of the GPI images are only 3 cm wide (see Fig. 6). Based on the plots of intensity vs. radial velocity at the bottom of Fig. 18, there seems to be no correlation between the radial velocity and intensity in this data set. More analysis is required to determine the physical and statistical significance of these blobs and their motion. For example, it is not clear how well these local maxima correspond to the density blobs discussed in recent theory [53], since the HeI light emission can be affected by temperature as well as density fluctuations. Also, the identification of coherent structures as statistically significant events probably requires additional analysis to determine the extent to which such blobs might be due to random fluctuations. Some other examples of coherent motion in these images are shown in Fig. 19. Figure 19(a) shows an ELM-free H-mode in which a coherent mode with a poloidal wavelength of 15 cm, and Fig. 19(b) shows a continuation of this same sequence in which a blob forms and moves radially outward. Figure 19(c) shows another ELM-free H-mode in which has a similar wave-like structure with blob-like maxima which move poloidally through the frames. Finally, Fig. 19(d) shows an L-mode case in which a blob at the lower right moves upward along the diagonal line, while at the same time two blobs radially inside and outside of it move downwards along that line, all three crossing near the circle shown. This behavior might be related to a "zonal flow" in which oppositely directed poloidal flows are generated by the turbulence itself. These and other interesting structures and motions are most easily appreciated in the videos [44]. The coherent edge modes seen in Fig. 19(a) and (c) are not correlated with any MHD activity at the frequency of this wave ( 10 khz), so this structure is most likely a "quasi-coherent" edge density fluctuation seen on DIII-D and Alcator C-Mod [25,50]. In other discharges which have large coherent MHD activity in H-mode (e.g. #108478) there is often a few-cm radial oscillation of the HeI light emitting region at the same frequency but without any poloidal variation, which is most likely due to the magnetic flux surface movements associated with these low-n MHD modes (e.g. tearing modes). 3.4 Other Imaging Results Some imaging and chord results were obtained using a deuterium puff with a D a filter instead of a He puff with a HeI (587.6 nm) filter. In general, the D a images and time series results were similar to the He results described above. For example, in a set of 10 discharges during one run day with a deuterium GPI puff, the same image analysis as in Sec. 3.1 (near the radial peak of the D a images) showed a mean poloidal correlation length of 4±0.5 cm and an RMS fluctuation level of 0.09±0.02. This is well within the range of the results of Fig. 7. Half of these shots had an exposure time of 10 µsec/frame (as for the He results) and half had an exposure time of 5 µsec/frame, but the results were very similar with either gating time. The time series, autocorrelation functions, 13
14 frequency spectra, and PDFs of the fast chord signals in D a were also similar to those in seen He (Figs. 11 and 13). The spatial location of the D a emission was similar to the HeI emission, and the background D a light level without the deuterium puff was only 10% of the peak level during the deuterium puff. When no optical filter and no gas puff was used, the resulting image was a combination of the natural radiation from the outer plasma edge and the recycling light from the wall tile surface near the upper divertor plate. Often this image showed elongated filaments moving across the wall surface, similar to images made using a fast divertor camera on NSTX [54]. Sometimes it appeared as if these filaments were intersecting the tiles and "splashing" over an area of several cm. In preparation for a laser-induced fluorescence measurement of edge turbulence, an attempt was also made to image the singly ionized argon ion line using a nm line filter. With the same argon gas pressure in the manifold as used for helium, the ArII(488.2 nm) light was about 4 times dimmer than the HeI(587.6 nm) light, so images could be seen clearly only with a 20 µsec exposure time. These images looked at least qualitatively similar to the images made in He and D, with localized structures moving poloidally and radially through the field of view. The radiation level appeared to increase significantly during the Ar puff and it is possible that was cooling the plasma edge. 4. Discussion The measurements described in Sec. 3 can in principle be used to test theoretical models of edge turbulence using an atomic/neutral physics model such as DEGAS 2 to calculate the expected HeI light emission fluctuations based on theoretically predicted density and temperature fluctuations. Of course, this comparison could only be made for statistical quantities such as correlation lengths and power spectra, although coherent structures could also be defined and compared as well. This process has been attempted with some success in Alcator C-Mod [19], but has not yet been done for NSTX since theoretical simulations are not yet available. Simulations of the general relationship between HeI light fluctuations and plasma fluctuations are described in Sec. IV.A. Comparisons of these GPI results with other edge fluctuation measurements on NSTX are described in Sec. IV.B, comparisons with other experiments are described in Sec. IV.C, comparisons with theory are discussed in Sec. IV.D, and the Conclusions are in Sec. IV.E. 4.1 Simulation of HeI fluctuations vs. plasma fluctuations The relationship between fluctuations in the HeI light emission and the underlying electron density and temperature fluctuations depends upon the atomic physics of the specific transition, as discussed in Sec At each point in radial profile the emissivity 14
15 can be approximated for a specific transition by S µ n e a T e b, where a and b are determined by a collisional radiative model of HeI [36,37]. An example of these exponents vs. radius for a typical NSTX discharge is shown in Fig. 20(a), along with the calculated HeI (587.6nm) emission for this case (same discharge as for Fig. 3). Near the peak emission these exponents are a 0.5 and b 0.7, but they range over -0.5 a,b 4 for the whole region of emission. The effect of the atomic physics exponents on the structure of the observed turbulence was simulated by assuming the various 1-D k-spectra for the spatial structure of ñ, as shown in Fig. 20(b). For each spectrum the relative correlation lengths and fluctuation levels of the resulting emissivity S = ñ a e were calculated as a function of a by averaging over an ensemble of the assumed k-spectra with random phases and a total rms fluctuation level of 24%. The calculated correlation lengths of the resulting emissivity were found to be nearly independent of the assumed a over the range -2 a 4, as shown in Fig. 20(c), while the relative fluctuation level varied nearly linearly with IaI, as shown in Fig. 20(d). In addition, the calculated k-spectrum of the emissivity is also approximately the same as the assumed k-spectrum of ñ, as illustrated by the dashed line corresponding to case (1) of Fig. 20(b). Finally, the calculated correlation lengths are approximately invariant even when a is varied over space in this range, as it would be for the radial correlations (after normalizing to the average values at each point, as done in the data analysis). A similar set of conclusions hold for the T e dependence of S (i.e. b). Thus the correlation lengths and k-spectra of the measured HeI light emission should be very similar to those of the underlying turbulence, assuming that the density and temperature fluctuations are approximately in phase, as expected theoretically for ExB driven advection, and sometimes observed experimentally [26,40]. Also, since k- space is identical to frequency space in this model, the autocorrelation times and frequency spectra of the measured HeI light emission should also be very similar to that of the underlying turbulence. Exceptions to this would occur for the unlikely cases where a n +a T 0, or if the density and temperature fluctuations had different spectra. On the other hand, the interpretation of the measured fluctuation levels of HeI light emission will depend on the assumed a, which in turn will depend on the details of the density and temperature profiles. If the density fluctuations dominate the temperature fluctuations, then the measured HeI profiles should be similar to the underlying ñ profiles since 0.5 a 1. However, in general the quantitative interpretation of fluctuation levels from GPI measurements is difficult without a more accurate measurement of the average temperature and density profiles. Simulations of the 2-D spatial structure of the underlying turbulence and the resulting HeI light emission show that there is an increased rms fluctuation level for large "a", as in Fig. 20(d), but there is also an increase in the apparent intermittency of the images due to ds/dn µ a. Thus the probability distribution functions (PDFs) of the measured HeI light (e.g. in Fig. 13) can be sensitive to the atomic physics; for example, the non-gaussian PDF at large R may in part be due to the sensitive dependence of HeI emission on temperature fluctuation at low T e. However, the local maxima retain their 15
16 identity independent of a, and so the gross structure of the 2-D images and the tracking of blobs should be fairly independent of the atomic physics. One area of interpretation not accounted for in these simple simulations is the dependence of the He neutral fraction on the radius, as illustrated in Fig. 3. To a first approximation the neutral density is constant at each point in space, so its value should not affect the interpretation of the relative fluctuations in HeI light emission. However, some non-linear interaction between the fluctuations and the neutral density is possible for large fluctuation levels, as discussed in Sec Simulations of this effect made using DEGAS 2 have so far shown that the spatial structure of the fluctuations is relatively insensitive to this effect [39]. 4.2 Comparisons with other NSTX diagnostics This section presents some comparisons of the GPI results of Sec. 3 with other available information on edge fluctuations in NSTX. At present there is at least qualitative agreement among these diagnostics, but detailed quantitative comparisons are difficult and beyond the scope of the present paper. The most direct comparison of GPI is with the fast divertor camera, which viewed the toroidal vs. poloidal structure of the D a recycling light near the bottom of the NSTX vessel at 40,000 frames/sec [33]. These images showed fluctuating "filaments" of light emission a few centimeters wide in the poloidal direction aligned nearly along the magnetic field, which were stronger in L-mode than the H-mode. This is at least qualitatively similar to the GPI results even though the spatial location of the GPI measurements was different. The divertor camera also showed variations in this filamentation with different types of ELMs, which has not yet be seen in the GPI images. For some discharges of Table 1 the two Thomson scattering laser pulses, each 8 ns wide, were fired 400 µsec apart so that the short-timescale variations in electron density Dn and electron temperature DT could be measured (each channel viewed an area <1 cm poloidal by cm radial). Since this time difference is larger than the autocorrelation time and shorter than the discharge evolution timescale these fluctuations most likely are due to edge turbulence (although MHD effects are not excluded). At the top of Fig. 21 are the measured Dn/n and DT/T as a function of the major radius R MP, where n and T are the average values over two nearby times during the GPI measurements. These relative fluctuation levels of 10-60% are roughly consistent with the fluctuation levels seen in GPI for these shots (see Fig. 7). In the middle of Fig. 21 are the standard deviations s n /n and s T /T expected for these measurements, where these s's are the square root of the sum of the squares of the error bars of the two individual measurements (not including the uncertainty in the mean value, which increases these s's by 5%). At the bottom is the measured variation normalized to this statistical uncertainty. These measured variations appear statistically significant; for example, at R MP = 146 and 148 cm about 2/3 of the points in the bottom graph are above one standard deviation for both n and T (only 1/3 of the points should be above one standard deviation 16
17 due to statistical uncertainty). The signs of these variations are equally positive and negative, as expected for turbulent fluctuations, but interestingly there was no apparent correlation between the signs of Dn e and DT in this data (if true, this might complicate the GPI interpretation). Strong edge fluctuations on a fast timescale have also been seen in the Thomson Scattering measurements in ASDEX Upgrade [55]. Another diagnostic which measured edge turbulence in NSTX is the ORNL edge reflectometer system [56], which consists of an x-mode reflectometers at the outer midplane which can be run at two different frequencies for measuring edge turbulence. The power spectra of phase fluctuations from the high frequency channel measuring density fluctuations at 3.5x10 12 cm -3 is shown in Fig. 22 along with the power spectra from a GPI fast chord. Both measurements were localized near R MP =150 cm for this typical L-mode shot (#108980). The GPI and reflectometer power spectra have a similar shape over the frequency range khz, although there is somewhat more power below 10 khz in the reflectometer. Also, the reflectometer signals are very similar before and during the GPI He puff (0.268 sec vs sec), showing that the He puff is not affecting the edge turbulence measured by this reflectometer. Similar results were obtained in the low frequency channel. Edge turbulence in NSTX was also measured using the UCSD fast probe, which was able to transiently penetrate to just outside the separatrix near the outer midplane. The power spectra of ion saturation current fluctuations from this probe are shown in Fig. 23, along with the power spectra from a GPI fast chord, both for typical H-mode shots (#109037,39). The shapes of the GPI and probe power spectra are roughly similar over the frequency range khz, although the GPI signals are somewhat lower in the khz range. Also, the probe spectra are similar with and without the GPI He puff and the relative fluctuation level seen in the ion saturation current is in both cases (# and #109039, respectively), showing that the He puff is not significantly affecting the edge turbulence as measured by this probe. 4.3 Comparison with other Experiments A similar gas puff imaging diagnostic of edge turbulence has been used on Alcator C-Mod [19], mainly with deuterium gas and a D a filter. The images of edge turbulence in C-Mod look qualitatively similar to those seen in NSTX, but the correlation lengths are significantly smaller, i.e. L pol 1 cm in C-Mod vs. L pol 4 cm in NSTX, and the autocorrelation times are significantly shorter, i.e. 10 µsec in C-Mod vs. 40 µsec in NSTX. This trend toward longer correlation lengths at lower B fields is consistent with many previous results [1-4,34]. Both NSTX and Alcator C-Mod showed highly localized coherent structures which move both poloidally and radially through the edge, with a preference for radially outward motion. Edge turbulence has been measured near the outer midplane of DIII-D using both Langmuir probes and beam emission spectroscopy (BES)[25-27]. The probes revealed strongly intermittent turbulence in the scrape-off layer, while the BES detected localized 17
18 perturbations moving poloidally and radially through near the separatrix. The "intermittent plasma objects" (IPOs) in the SOL were characterized by non-gaussian PDFs, similar the GPI results in Fig. 13. The motion of IPOs was measured using conditional sampling of probe data and showed a radial speed km/sec, which is similar to the radial blob speeds in NSTX (Fig. 18), and the spatial scale of the structures seen with BES is 2 cm, which is somewhere between the size of those seen in NSTX and in Alcator C-Mod. Similar intermittent structure has been seen in other devices [31, 32, 49]. The average edge turbulence level in the H-mode is somewhat smaller than in L- mode in NSTX (Fig. 7), similar to probe measurements in DIII-D [25-27] and PBX-M [57]. However, GPI measurements in Alcator C-Mod showed nearly the same fluctuation level in H-modes and L-modes [19], probably because those measurements were in the SOL whereas the GPI measurements in NSTX were mainly inside the separatrix. The poloidal correlation lengths of edge turbulence in L-modes and H-modes were similar in NSTX (Fig. 6), as were radial correlation lengths in L-mode and H-mode edge plasmas in ASDEX [58]. The shape of the k-spectra in Fig. 8 are at least qualitatively similar to those measured with previous imaging systems in TEXTOR [15], C-Mod [19], and with probes [23,33]. The wave-like structures in the H-modes seen in Fig. 19 may be related to the quasi-coherent mode observed in H-mode plasmas in tokamaks [26,50,57] (also sometimes called an edge localized oscillation or EDA oscillation). The distinguishing features of this mode are its edge localization and its nearly coherent frequency spectrum. In NSTX this mode is identified by its periodic poloidal structure with a wavelength of 15 cm, in contrast with the usual incoherent turbulent structure in NSTX with a correlation length of 4 cm. The cause of this mode in NSTX is presently unknown. 4.4 Connections to Theoretical Models It is obvious that quantitative connections to specific theoretical models must be made in order to understand and interpret the results of this paper. The best quantitative connection would be a comparison of these imaging results with a turbulence simulation results from codes such as described in Ref. [5-11], although qualitative connections with simplified theoretical models would perhaps be more useful in understanding the basic physics. For example, BOUT [6] is a boundary turbulence code which calculates the nonlinear saturated state of edge turbulence in diverted toroidal plasma based on a 3-D nonlinear two-fluid (collisional) model, given the time-averaged plasma edge profiles and magnetic geometry. A BOUT simulation made for the outer midplane of NSTX using assumed edge profiles [6] produced several results at least qualitatively similar to the measured edge turbulence, namely: (a) the turbulence size scale perpendicular to B is a few centimeters in both radial and poloidal directions, while the parallel correlation length is many meters, (b) the autocorrelation time was µs and the frequency 18
19 spectrum is close to that observed in the fast chord signals, and (c) fluctuation levels in the edge were typically in the range of 10%. No other specific edge turbulence simulations have yet been made for NSTX. Future comparisons with this or other turbulence simulation codes could start by using the measured plasma profiles and turbulence for an actual NSTX discharge. The simplest procedure would be to import the turbulence simulation results into DEGAS 2 and then calculate the expected space-time patterns of HeI light emission to compare with the GPI data. Of course only statistical quantities such as the correlation lengths can be compared and not the individual images from a single shot. This already been has been done for GPI measurements in C-Mod [19]. After this, scans over the relevant dimensionless edge parameters (Table 2) can be used to further test this comparison. Another general approach is to use simplified analytic models rather than a full turbulence simulation to interpret the data. For example, a recent model of scrape-off layer blobs [53] made predictions which can be tested with the imaging data from this experiment. Similarly, recent L-H transition models [59] should be testable using data from this and similar experiments. Other theoretical ideas which could be tested concern self-organized criticality (SOC) [60], the effect of the divertor plate contact on turbulence in the SOL [61], the interplay between self-generated zonal flows and intermittent transport events [9], and the effect of flux-driven as opposed to gradient-driven turbulence [10]. In the absence of quantitative theoretical comparisons, some ordering of the data can also be obtained by comparing them with simple theoretical scalings for edge turbulence such as those discussed previously [1-4,33,34]. For example, the usual "drift wave" scaling k pol r s is approximately consistent with the measured k pol 1 cm -1 (Fig. 7) and r s 0.25 cm (Table 2). Similarly, the usual "mixing length" estimate ñ/n 1/k rad L n is roughly consistent with the typical fluctuation level of di/i 30% (Fig. 6) with k rad 1 cm -1 and L n 2 cm (Table 1). The resistive ballooning mode (RBM) scale length in NSTX for the parameters of Table 2 is L RBM = 1 cm, which is about 1/4 the observed correlation length in NSTX. However, it is clear from previous work [19] that the linear instability scale length is not necessarily the same as the non-linear correlation length of the RBM turbulence. 4.5 Conclusions This paper described the results of high-speed 2-D imaging of the edge turbulence in NSTX made using a gas puff imaging (GPI) diagnostic. This diagnostic measured the fluctuations in HeI light emission in the region where T e 5-50 ev near the outer midplane separatrix. Simple modeling showed that the space-time structure of the measured HeI light emission should be similar to that of the underlying plasma density and temperature fluctuations. The main results of this paper can be summarized as follows: 19
20 a) the poloidal correlation lengths of edge turbulence as seen by GPI were L pol 4±1 cm in Ohmic, L-mode, and H-mode plasmas (Fig. 7), and the shapes of the poloidal k-spectra were similar in these three regimes (Fig. 8), b) the edge turbulence seen by GPI often had an intermittent character, with a non- Gaussian probability distribution function in the outer edge (Fig. 13), and with localized coherent structures seen moving through the edge in 2-D (Figs. 17,18), c) the relative fluctuations levels were lower on average in H-mode than in L-mode or Ohmic plasmas (Fig. 7), with intermittent coherent structures appearing during H- mode even without the presence of ELMs (Fig. 16), d) transitions from H-L and L-H mode were seen as very rapid ( 100 µsec) changes in the GPI signal levels and relative fluctuation levels (Figs. 14,15) e) the frequency spectrum of GPI fluctuations was similar to that of the edge reflectometer and Langmuir probes (Figs. 22 and 23) and consistent with fluctuations seen in the Thomson scattering diagnostic (Fig. 21). So far, the edge turbulence measured near the outer midplane of NSTX appears to be similar to edge turbulence seen previously in larger aspect ratio tokamaks or stellarators. This is too not surprising given the similarity of edge turbulence seen among other types of magnetized plasmas. However, many possible influences on edge turbulence remain to be explored in NSTX; for example, the effects of plasma rotation, RF heating, impurity content, magnetic geometry, and wall surface conditions. Many open questions also remain concerning the physics of edge turbulence in general. It is not yet clear what the dominant driving and damping mechanisms are for this turbulence, so careful scans and comparisons with theoretical simulations are needed. The cause of the H-mode transition is still unclear, so it would be useful obtain 2-D images which capture the L-H and H-L transitions and to compare these with theory. The density limit is not understood, so the density scan should be pushed nearer the experimental density limit. The causes of the intermittent coherent structures need to be clarified both experimentally and theoretically. Perhaps the most important open issue concerns the general relationship between the edge profiles, edge turbulence, and edge transport, since the edge conditions are known to affect both the plasma-wall interactions and the global plasma performance. For example, the larger than expected cross-field particle transport recently observed in the SOL [62] can strongly increase the main chamber recycling and affect the design of future tokamak divertors. It would also be useful to develop active edge turbulence control methods which could clarify these relationships, and to couple edge turbulence models to core turbulence models for a more complete simulation of turbulent transport. 20
21 Acknowledgments: This work was performed under DOE contract #DE-AC02-76CHO3073. Amy Keesee was supported by a DOE Fusion Energy Sciences Fellowship. We thank the following people for valuable discussions and/or support for this work: M. Bell, R. Bell, B. Davis, E. Fredrickson, M. Gilmore, K. Hallatschek, G. Hammett, D. Johnson, R. Kaita, S. Kubota, H. Kugel, F. Levinton, J. Myra, W. Nevins, M. Ono, M. Peng, B. Rogers, L. Roquemore, S. Sabbagh, J. Strachan, D. Stutman, E. Synakowski, J.L. Terry, G. Wurden, and X. Xu. 21
22 Figure captions: 1) Gas puff imaging diagnostic geometry in NSTX. In (a) is a sketch of the vessel interior showing the reentrant viewport, the manifold from which the gas puff emerges, and the approximate angle of the local magnetic field. In (b) is the area of the GPI view indicated by the rectangle just above the outer midplane near the separatrix. 2) Single image of the HeI(587.6 nm) light emission as viewed by the PSI camera with an exposure time of 10 µsec, oriented so that the local radially outward direction is toward the right 260 µs). The 160x80 pixel PSI camera frame indicated by the white rectangle covers an area 32 cm x 16 cm in the poloidal vs. radial directions. The gas manifold is located 3 cm radially outside the toroidal shadow of the RF antenna, which acts as the outboard limiter in these experiments. The intensity of the HeI light is indicated by the false color scale at the left. The separatrix location as calculated by EFIT is shown by the dashed white line. 3) Radial profiles in the edge region of a typical NSTX discharge (#108322) as a function of the major radius in NSTX. The smoothed profiles of n e and T e from Thomson scattering are at the bottom, and the calculated profiles of the neutral Helium density n(heº) and HeI(587.6 nm) line emission from DEGAS 2 are at the top. The measured HeI light emission for this shot is shown by circles in the top part. The separatrix is approximately at R MP = 148.5±1 cm in this case, where R MP refers to the outer midplane crossing point of the flux surface. 4) Time evolution of a typical discharge in NSTX (#108980). At the top is the plasma current, in the middle is the line average density, and at the bottom is the HeI light emission from the GPI He gas puff. The He gas puff enters the plasma at 0.27 s and the fast image capture was at s. 5) Typical time sequences of images taken in HeI light with the PSI camera at 10 µs/frame showing 10 of the 28 frames per shot. These images cover the same area as the tilted rectangle in Fig. 2 and have the same color scale, but are oriented with the radially outward direction toward the upper right (see arrow in left middle panel). Case (a) is an Ohmic discharge (#108293), case (b) is an L-mode (# ), and (c) is a quiescent period during an H-mode (#108316). The area used for image analysis is shown in the upper left frame, and the separatrix locations as calculated by EFIT are shown in the frames at the right. 6) Time-averaged radial profiles of the HeI light intensity I (top), its relative fluctuation level di/i, the poloidal correlation length of the fluctuations L pol, and the Thomson scattering data for n e and T e for the three discharges of Fig. 4. The first three quantities are averaged over the 28 frames in the PSI camera data for each of these shots. The approximate separatrix locations are shown at the top. 7) Relationship between the poloidal correlation lengths L pol vs. di/i for the shots in Table I, evaluated near the radial peak of the HeI emission and averaged over the 28 22
23 frames of PSI data for each shot. Typical variations from frame-to-frame within each shot are shown by the (rms) error bars. There is no significant variation in the average L pol between Ohmic, L-mode, and H-mode cases in this data, but the H-mode cases tend to have a lower fluctuation level. 8) Time-averaged poloidal k-spectra for the shots of Fig. 5 as evaluated using the PSI images near the radial peak of the HeI emission. There is no significant difference between the shape of the k-spectra between these three cases, but the fluctuation level is lower in this relatively quiescent H-mode case. 9) Correlation lengths of the turbulence as a function of the orientation angle in the poloidal vs. radial plane. The analysis was done by rotating the images around the point labeled with an "x" within the box in first image of Fig. 4(a). The correlation length in the radial direction is slightly smaller than in the poloidal direction, but only marginally within the frame-to-frame variations with a shot (error bars). These discharges are Ohmic and L-modes cases from Table 1 (#108243, 321 and 322 are L-mode, the others are Ohmic). 10) Variation of the poloidal correlation length and relative fluctuation levels during an Ohmic density scan at constant current and field (B=3 kg, I= ka). The horizontal variable is the line averaged density, and each point is the average over the 28 frames in the PSI data evaluated near the radial peak of the HeI light emission. There is little or no significant variation in the turbulence observed over this range, which extends up to n e 0.8 times the Greenwald density limit. However, the peak of the HeI light emission shifts outward at lower density, in part due to an inward shift of the separatrix. 11) Typical signals from the radial array of fast GPI chords which viewed HeI light emission in the same area of the plasma as the PSI camera. Each chord views a region of 1.5 cm diameter near the poloidal centroid of the HeI light emission cloud. The top plot shows the He gas puff entering the discharge at 0.16 s, and the bottom plot shows an expanded timescale of the top plot. The separatrix was approximately at a midplane major radius of R MP = 150 cm for this Ohmic shot (#105637). 12) Radial profile of the relative fluctuation level from the radial chord array for the Ohmic discharge of Fig. 11. The profile shape is similar to that seen in the image data for different Ohmic discharge (Fig. 6). The fluctuation level is very similar just after the start of the He puff (0.165 s) and at the peak of the He puff (0.2 s), over which time the He puff rate varies by about a factor-of-four. 13) Time series analysis of the HeI emission fluctuations in the radial array of chords shown in Fig. 10. At the left is the chord at R MP =150 cm, at the right is the chord at R MP =144 cm, and both analyses are done with 10,000 time points ( sec). The autocorrelation times are 32 µs and 24 µs, respectively, and the frequency spectra show a flat region between 0.1 and 10 khz (except for some MHD near 1 khz), and a decrease in power of 100 between 10 khz and 100 khz. The signal level without a He puff is 23
24 below this scale. The probability distribution functions are non-gaussian in the outermost channel and Gaussian in the inner channel. 14) Time dependence of the HeI light emission during an H-L transition as seen in the radial array of fast GPI chords. The He puff enters at 0.18 s and the three panels show successive close-ups around the H-L transition at s. During the H-mode the emission is localized in the chords at R MP = cm, while during the L-mode the radial profile is broader, as seen also in Figs. 5 and 6. There is a 30 µs long outwardly propagating pulse just at the H-L transition in this case (#105710), in which the separatrix is at R MP 150 cm. 15) Time dependence of the signals during an L-H transition as seen in three of the fast GPI chords. The signal levels in the outer two chords in this case (#108589) drop within 100µs at the H-mode transition and have no obvious precursors. An apparently unrelated 20 khz MHD mode is visible on the inner channel during the H-mode phase in this discharge. The D a signal at the bottom has a response time of only 0.5 ms. 16) Time dependence of the GPI fast chord signals during ELMs in an H-mode shot (#108460). Between the ELMs there is a continuous but intermittent turbulence in the outer GPI channels, similar to that seen in Ohmic discharges (Fig. 11). During the ELMs there is only a modest change in this turbulence, e.g. an increase in the amplitude of the bursts outside the separatrix, which was at R MP 153±1 cm in this case. 17) Examples showing the motion localized structures of the HeI light emission as seen in the PSI camera images taken at 10 µs/frame. Cases (a)-(c) are Ohmic discharges (#108289, , ), and case (d) had 3.3 MW of NBI (#108979). The blobs move both radially and poloidally and change shape and size significantly over their lifetime within this field of view (fixed circles and diagonal lines have been added for reference). Only 10 of the 28 frames in each shot are shown. 18) Analysis of blob motion in the PSI camera data for a set of 22 shots. In the top row are the instantaneous velocities of the blobs in the radial vs. poloidal plane as determined from the relative motion of the local maxima between two successive frames (the radially outward and ion diamagnetic directions are shown at the upper left). At the bottom is the radial velocity vs. the intensity of the blobs, where the intensity is the average over the two frames normalized to the average over all (28) frames. 19) Examples of coherent structure as seen in the PSI camera images taken at 10 µs/frame, all with NBI at I=900 ka. Cases (a) is an H-mode with a radially oscillating wave-like structure (#108466), case (b) shows the next 10 frames from the same shot as in (a) with a blob forming and moving outward, case (c) is an H-mode with a poloidally modulated wave-like structure (#108488), and case (d) is an L-mode with counterpropagating blobs (#108609). The diagonal lines and fixed circles are for reference. 20) Simulations of the relationship between an assumed spectrum of density fluctuations ñ and the corresponding HeI light emission S µ ñ a. In part (a) is the calculated HeI radial 24
25 profile and local exponents of density and temperature for a typical NSTX discharge (#108322). In part (b) are three assumed ñ(k) for these simulations. In part (c) are the calculated correlation lengths of S as a function of the assumed alpha, averaged over 10 realizations with random phases for each k and an average fluctuation level of 24% (rms/mean). In part (d) are the calculated fluctuation levels (rms/mean) vs. alpha. The calculated S(k) for spectrum (1) with alpha=2 is shown by the dashed line in part (b), averaged over 100 realizations. 21) Fluctuations in the Thomson scattering edge data for 11 shots in Table 1. The top panels show the differences between the measured electron density and temperature at two times 0.4 msec apart, normalized to their average. The middle panel shows the expected standard deviation in these differences normalized to their average, and the bottom panel shows the measured differences normalized to the expected statistical differences. The mean variation is about twice the expected standard deviation, implying a statistically significant fluctuation level. 22) Comparison of the edge turbulence power spectra measured by the ORNL reflectometer and the GPI fast chords during a typical NSTX L-mode shot (#108980). This reflectometer has a cutoff at 3.5x10 12 cm -3, which roughly corresponds to the position GPI chord radius shown (R MP 150 cm). The spectra of the reflectometer signals and GPI signals are roughly similar, as are the reflectometer signals before (0.268 s) and during (0.288 s) the He puff. The two reflectometer spectra have the same gain, and the GPI spectra are normalized to the reflectometer spectra. 23) Comparison of the edge turbulence power spectra measured by the UCSD fast probe and a GPI edge channel for typical H-mode shots in NSTX. The probe data for the shot labeled with "x" was taken before the GPI He puff 0.31 s), while the probe data labelled with " " was taken during a GPI He puff 0.41 s). All spectra are normalized to have the same total power between 1 and 100 khz. The GPI spectrum was obtained from 10,000 points for shot # between s at R=150 cm. The spectra of the probe signals and GPI signals are roughly similar, and the probe signals are similar with and without the He puff. 25
26 Table 1: Shot list (all 10 µsec gating, He puff) Shot # t(ms) B*(kG) I(kA) <n e > # P(MW) Type Ohmic L-mode Ohmic Ohmic Ohmic Ohmic Ohmic Ohmic Ohmic Ohmic Ohmic Ohmic Ohmic Ohmic Ohmic L-mode L-mode L-mode L-mode L-mode L-mode H-mode H-mode L-mode L-mode L-mode * B at major radius of plasma # line averaged density (/10 13 cm -3 ) 26
27 Table 2: Typical NSTX Parameters Shot s B(0)=3.5 kg I= 900 ka T e (0)=1 kev n e (0)= 2.5x10 13 cm - 3 <n e > = 2x10 13 cm -3 (line averaged) Outer edge (R MP =146 cm) n e 5x10 12 cm -3 T e 13 ev b 10-3 L n 2 cm r s 0.25 cm n ei 6x10 6 s -1 L c 5 m* l ei /L c 0.05 q(local)=(b T /B pol )(R/a) 2 L RBM 1 cm # * connection length to divertor # resistive ballooning mode scale 27
28 References: [1] Endler, M., J. Nucl. Materials (1999) p. 84 [2] Carreras, B.A., IEEE Trans. Plasma Sci. 25, 1281 (1997) [3] Wootton, A.J. et al,, Phys. Fluids B2, 2879 (1990) [4] Liewer, P.C., Nucl. Fusion 25, 543 (1985) [5] Rogers, B.N, Drake, J.F., and Zeiler, A. Phys, Rev. Lett. 81, 4396 (1998) [6] Xu, X.Q. et al, New J. Physics 4, 53.1 (2002) [7] Scott, B.D., New J. Physics 4, 52.1 (2003) [8] Hallatschek, K., Zeiler, A., Phys. Plasmas 7, 2554 (2000) [9] Beyer, P. et al, Phys. Rev. Lett. 85, 4892 (2000) [10] Sarazin, Y. and Ghendrih, Ph., Phys. Plasmas 5, 4214 (1998) [11] Benkadda, S et al, Nucl. Fusion 41, 995 (2001) [12] Zweben, S.J. and Gould, R.W., Nucl. Fusion 23, 825 (1983) [13] Bleuel, J. et al, New J. Physics 4, 38.1, (2002) [14] Martines, E., Hron, M., and Stockel, J., Plasma Phys. Cont. Fusion 44, 351 (2002) [15] Huber, A., Nedospasov, A.V., Samm, U., Schweer, B., J. Nucl. Mat , 546 (1999) [16] McKee, G.R, Fenzi, C., Fonck, R.J., and Jakubowski, M., Rev. Sci, Inst 74, 2014 (2003) [17] Maqueda, R.J. et al, Rev. Sci. Inst. 72, 931 (2001) [18] Zweben, S.J. et al, Phys. Plasmas 9, 1981(2002) [19] Terry, J.L. et al, "Observations of the Turbulence in the Scrape-off Layer of Alcator C-Mod and Comparisons with Simulation", to be pub. in Phys. Plasmas (2003) [20] Maqueda, R.J. et al, Rev. Sci. Inst. 74, 2020 (2003) [21] Sykes, A. et al, Nucl. Fusion 41, 1423 (2001) [22] Zweben, S.J. and Medley, S.S., Phys. Fluids B 1, 2058 (1989) [23] Endler, M. et al, Nucl. Fusion 35, 1307 (1995) [24] Thomsen, H. et al, Phys. Plasmas 9, 1233 (2002) [25] Boedo, J. et al, Phys. Plasmas 8, 4826 (2001) [26] Rudakov, D.L. et al, Plasma Phys. Cont. Fusion 44, 717 (2002) [27] Boedo, J. et al, J. Nucl. Materials , 813(2003) [28] Chen, F.F., Phys. Rev. Lett. 15, 381 (1965) [29] Tsui, H. et al, Phys. Fluids B 5, 2491 (1993) [30] Pedrosa, M.A. et al, Phys. Rev. Lett. 82, 3621 (1999) [31] Grulke, O. and Klinger, T., New J. Physics 4, 67.1 (2002) [32] Antar, G.Y. et al, Phys. Plasmas 10, 419 (2003) [33] Zweben, S.J. and Gould, R.W., Nucl. Fusion 23, 1625 (1983) [34] Rhodes, T.L, Ritz, C.P., and Bengtson, R.D., Nucl. Fusion 33, 1147 (1993) [35] Princeton Scientific Instruments, Inc., Monmouth Junction, NJ USA [36] Fujimoto, T., JQSRT 21, 439 (1979) [37] Goto, M., JQSRT 76, 331 (2003) [38] Stotler, D.P. and Karney, C.F.F., Contrib. Plasma Phys. 34 (1994) 392. [39] Stotler, D.P. LaBombard, B,. Terry, J.L, and Zweben, S.J. J. Nucl. Mater (2003) [40] Meier, M.A. et al, Phys. Rev. Lett. 87, 500 (2001) 28
29 [41] Maingi, R. et al et al, H-mode Research in NSTX, submitted to Nucl. Fusion (2002) [42] Reiser, D. and Tokar, M.Z., Contrib. Plasma Phys. 42, 401 (2002) [43] Ono, M. et al, Nucl. Fusion 41, 1435 (2001) [44] GPI images at [45] Greenwald, M., Plasma Phys. Cont. Fusion 44, R27 (2002) [46] Bush, C.E. et al, "Configuration and Heating Power Dependence of Edge Parameters and H-Mode Dynamics in NSTX", to be published in Phys. Plasmas (2003) [47] Schoppa, W. and Hussain, F., J. Fluid Mechanics 453 (2002) 57 [48] Zabusky, N.J., Ann. Rev. Fluid Mech. 495 (1999) [49] Zweben, S.J., Phys. Fluids 28, 974 (1985) [50] Mazurenko, A. et al, Phys. Rev. Lett. 89, (2002) [51] Jakubowski, M, Fonck, R.J., and McKee G.R., Phys. Rev. Lett. 89, [52] Politzer, P.A. et al, Phys. Plasmas 9, 1962 (2002) [53] D'Ippolito, D., Myra, J., Krasheninnikov, S., Phys. Plasmas 9, 222 (2002) [54] Nishino, N. et al, Journal of Plasma and Fusion Research (Japan), Rapid Communication RC 0030, Dec. '02 ( [55] Jacobi, M. et al, 29 th EPS Conference on Plasma Phys. and Contr. Fusion, Montreux, June 2002, ECA Vol. 26B, P-1,122 [56] Wilgen, J.B et al, Bull. Am. Phys. Soc. 47, #9, 171 (Nov. 2002) [57] Tynan, G. et al, Phys Plasmas 1, 3301 (1994) [58] Kurzan, B. et al. Plasma Phys. Cont. Fusion, 42, 237 (2000) [59] Malkov, M.A. and Diamond, P.H. "Analytic Theory of L-H Transport Bifurcation for a Simple Model of Coupled Particle and Heat Fluxes", submitted to Phys. Plasmas (2002) [60] Garcia, L., Carreras, B.A., and Newman, D.E., Phys. Plasmas 9, 841 (2002) [61] Nedospasov, A.V. J. Nucl. Mat , 90 (1992) [62] LaBombard, B. et al et al, Phys. Plasmas 8, 2107 (2001) 29
30 (a) (b) GPI view Fig. 1
 0 142 144 146 148 150 152 R MP")
31 200 sep. out DEGAS HeI n(he o ) GPI HeI 0 Fig n e /10 11 cm T e (ev) R MP (cm) Fig. 3
32 I (ka) n e (cm -3 ) GPI signal (rel.) seconds Fig. 4

 Fig.")
33 (a) 200 x cm 0 (b) out (c) Fig. 5
34 Ohmic (#108293) L-mode (#108322) H-mode (#108316) I (rel.) di/i cm 6 cm 3 cm LCFS LCFS LCFS 0.4 I (rel.) di/i I (rel.) di/i L pol (cm) 4 2 L pol (cm) 4 2 L pol (cm) T e n e n e (/10 11 cm -3 ) n e 10 T e (ev) R MP (cm) R MP (cm) R MP (cm) 10 T e Fig. 6
35 8 6 L pol (cm) OH L-mode H-mode di/i (rel.) Fig. 7
36 Spectral amplitude (rel.) ~ noise level OH L-mode H-mode k pol (cm -1 ) Fig. 8
37 6 4 L(cm) Poloidal Angle (deg.) Radial Fig. 9
38 di/i L pol (cm) R peak (cm) R sep (cm) <n e >/10 13 cm -3 Fig. 10
 150 148 146 144 142 140 138 Time (sec) Fig.")
39 R MP (cm) He puff # R MP (cm) Time (sec) Fig. 11
40 # di/i (rel.) 0.2 sec sec LCFS R MP (cm) Fig. 12
41 R MP =150 cm R MP =144 cm Fig. 13
42 R MP (cm) # H L R MP (cm) R MP 146 (cm) Time (sec) Fig. 14
43 153 # R MP (cm) D a 153 R MP (cm) D a Time (msec) Fig. 15
44 157 # R MP (cm) D a 157 # R MP (cm) D a Time (sec) Fig. 16


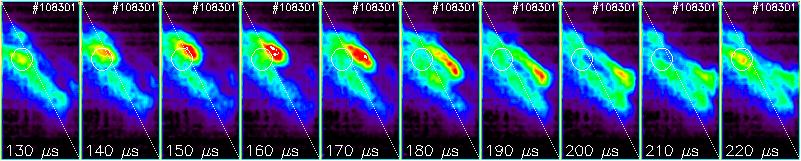
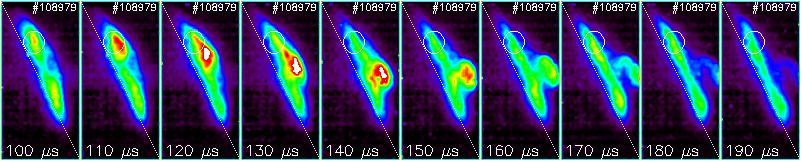
45 (a) (b) out out (c) (d) Fig. 17
46 4 Ohmic out 4 L-mode 4 H-mode V pol (km/sec) 0-4 ion V pol (km/sec) 0-4 V pol (km/sec) V rad (km/sec) V rad (km/sec) V (km/sec) rad V rad (km/sec) V rad (km/sec) V rad (km/sec) Intensity (rel.) Intensity (rel.) Intensity (rel.) Fig. 18
 (c)")


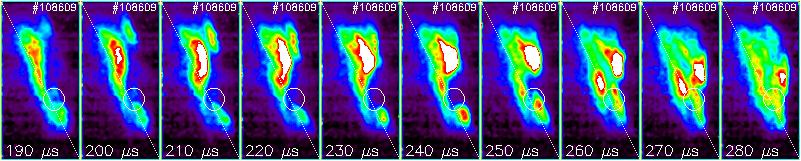
47 (a) out (b) (c) (d) Fig. 19
Blob sizes and velocities in the Alcator C-Mod scrapeoff
 P1-59 Blob sizes and velocities in the Alcator C-Mod scrapeoff layer R. Kube a,b,*, O. E. Garcia a,b, B. LaBombard b, J. L. Terry b, S. J. Zweben c a Department of Physics and Technology, University of
Invited Review Article: Gas Puff Imaging Diagnostics of Edge Plasma Turbulence in Magnetic Fusion Devices. X Science LLC, Plainsboro, NJ 08536, USA
 Invited Review Article: Gas Puff Imaging Diagnostics of Edge Plasma Turbulence in Magnetic Fusion Devices S.J. Zweben 1, J.L. Terry 2, D.P. Stotler 1, R.J. Maqueda 3 1 Princeton Plasma Physics Laboratory,
Development of a New Gas Puff Imaging Diagnostic on the HL-2A Tokamak
 Development of a New Gas Puff Imaging Diagnostic on the HL-2A Tokamak B.Yuan a,b, M.Xu b,*, Y.Yu a,*, L.Zang b, R.Hong c, C.Chen b, Z.Wang b,l.nie b, R.Ke b, D.Guo b, Y.Wu a,b, T.Long b, S.Gong a,b, H.Liu
Edge Zonal Flows and Blob Propagation in Alcator C-Mod P5.073 EPS 2011
 Edge Zonal Flows and Blob Propagation in Alcator C-Mod S.J. Zweben 1, J.L. Terry 2, M. Agostini 3, B. Davis 1, O. Grulke 4,J. Hughes 2, B. LaBombard 2 D.A. D'Ippolito 6, R. Hager 5, J.R. Myra 6, D.A. Russell
Varia%ons in Edge and SOL Turbulence in NSTX
 Varia%ons in Edge and SOL Turbulence in NSTX S.J. Zweben 1*, W.M. Davis 1, S.M. Kaye 1, J.R. Myra 2, R.E. Bell 1, B.P LeBlanc 1, R.J. Maqueda 1**, T. Munsat 3, S.A. Sabbagh 4, Y. Sechrest 3, D.P. Stotler
Connections between Particle Transport and Turbulence Structures in the Edge and SOL of Alcator C-Mod
 Connections between Particle Transport and Turbulence Structures in the Edge and SOL of Alcator C-Mod I. Cziegler J.L. Terry, B. LaBombard, J.W. Hughes MIT - Plasma Science and Fusion Center th 19 Plasma
Flow measurements in the Scrape-Off Layer of Alcator C-Mod using Impurity Plumes
 Flow measurements in the Scrape-Off Layer of Alcator C-Mod using Impurity Plumes S. Gangadhara,. Laombard M.I.T. Plasma Science and Fusion Center, 175 Albany St., Cambridge, MA 2139 USA Abstract Accurate
L-to-H power threshold comparisons between NBI and RF heated plasmas in NSTX
 Research Supported by L-to-H power threshold comparisons between NBI and RF heated plasmas in NSTX T.M. Biewer 1, R. Maingi 1, H. Meyer 2, R.E. Bell 3, C. Bush 1, S. Kaye 3, S. Kubota 3, B. LeBlanc 3,
Plasma Fusion Center Massachusetts Institute of Technology Cambridge, MA Burrell, K.H. General Atomics PO Box San Diego, CA
 PFC/JA-95-28 Edge Turbulence Measurements during the L- to H-Mode Transition by Phase Contrast Imaging on DIII-Dt Coda, S.; Porkolab, M.; Plasma Fusion Center Massachusetts Institute of Technology Cambridge,
Scaling of divertor heat flux profile widths in DIII-D
 1 Scaling of divertor heat flux profile widths in DIII-D C.J. Lasnier 1, M.A. Makowski 1, J.A. Boedo 2, N.H. Brooks 3, D.N. Hill 1, A.W. Leonard 3, and J.G. Watkins 4 e-mail:lasnier@llnl.gov 1 Lawrence
L-mode filament characteristics on MAST as a function of plasma current measured using visible imaging
 1 9/2/16 L-mode filament characteristics on MAST as a function of plasma current measured using visible imaging A. Kirk, A.J. Thornton, J.R. Harrison, F. Militello, N.R. Walkden and the MAST Team and the
Plasma Science and Fusion Center
 Plasma Science and Fusion Center Turbulence and transport studies in ALCATOR C Mod using Phase Contrast Imaging (PCI) Diagnos@cs and Comparison with TRANSP and Nonlinear Global GYRO Miklos Porkolab (in
Relating the L-H Power Threshold Scaling to Edge Turbulence Dynamics
 Relating the L-H Power Threshold Scaling to Edge Turbulence Dynamics Z. Yan 1, G.R. McKee 1, J.A. Boedo 2, D.L. Rudakov 2, P.H. Diamond 2, G. Tynan 2, R.J. Fonck 1, R.J. Groebner 3, T.H. Osborne 3, and
EXD/P3-13. Dependences of the divertor and midplane heat flux widths in NSTX
 1 Dependences of the ertor and plane heat flux widths in NSTX T.K. Gray1,2), R. Maingi 2), A.G. McLean 2), V.A. Soukhanovskii 3) and J-W. Ahn 2) 1) Oak Ridge Institute for Science and Education (ORISE),
Divertor Heat Flux Reduction and Detachment in NSTX
 1 EX/P4-28 Divertor Heat Flux Reduction and Detachment in NSTX V. A. Soukhanovskii 1), R. Maingi 2), R. Raman 3), R. E. Bell 4), C. Bush 2), R. Kaita 4), H. W. Kugel 4), C. J. Lasnier 1), B. P. LeBlanc
Density Limit and Cross-Field Edge Transport Scaling in Alcator C-Mod
 EX/D- Density Limit and Cross-Field Edge Transport Scaling in Alcator C-Mod B. LaBombard ), M. Greenwald ), R.L. Boivin ), B..A. Carreras 3), J.W. Hughes ), B. Lipschultz ), D. Mossessian ), C.S. Pitcher
INTERMITTENT TURBULENCE AND COHERENT
 INTERMITTENT TURBULENCE AND COHERENT STRUCTURES IN LAPD AND ET Troy A. Carter Dept. of Physics and Astronomy, UCLA acknowledgments: D. Pace, B. Brugman, R. Taylor, L. Schmitz, G. Morales, J. Maggs, M.
Some Notes on the Window Frame Method for Assessing the Magnitude and Nature of Plasma-Wall Contact
 Some Notes on the Window Frame Method for Assessing the Magnitude and Nature of Plasma-Wall Contact Peter Stangeby 4 September 2003 1. Fig. 1 shows an example of a suitable magnetic configuration for application
Alcator C-Mod. Particle Transport in the Scrape-off Layer and Relationship to Discharge Density Limit in Alcator C-Mod
 Alcator C-Mod Particle Transport in the Scrape-off Layer and Relationship to Discharge Density Limit in Alcator C-Mod B. LaBombard, R.L. Boivin, M. Greenwald, J. Hughes, B. Lipschultz, D. Mossessian, C.S.
Alcator C-Mod. Particle Transport in the Alcator C-Mod Scrape-off Layer
 Alcator C-Mod Particle Transport in the Alcator C-Mod Scrape-off Layer B. LaBombard, R.L. Boivin, B. Carreras, M. Greenwald, J. Hughes, B. Lipschultz, D. Mossessian, C.S. Pitcher, J.L. Terry, S.J. Zweben,
3-D Random Reconnection Model of the Sawtooth Crash
 3-D Random Reconnection Model of the Sawtooth Crash Hyeon K. Park Princeton Plasma PhysicsN Laboratory Princeton University at IPELS, 2007 Cairns, Australia August 5-9, 2007 Collaboration with N.C. Luhmann,
Study of B +1, B +4 and B +5 impurity poloidal rotation in Alcator C-Mod plasmas for 0.75 ρ 1.0.
 Study of B +1, B +4 and B +5 impurity poloidal rotation in Alcator C-Mod plasmas for 0.75 ρ 1.0. Igor Bespamyatnov, William Rowan, Ronald Bravenec, and Kenneth Gentle The University of Texas at Austin,
Pedestals and Fluctuations in C-Mod Enhanced D α H-modes
 Pedestals and Fluctuations in Enhanced D α H-modes Presented by A.E.Hubbard With Contributions from R.L. Boivin, B.A. Carreras 1, S. Gangadhara, R. Granetz, M. Greenwald, J. Hughes, I. Hutchinson, J. Irby,
MHD-Induced Alpha Particle Loss in TFTR. S.J. Zweben, D.S. Darrow, E.D. Fredrickson, G. Taylor, S. von Goeler, R.B. White
 MHD-Induced Alpha Particle Loss in TFTR S.J. Zweben, D.S. Darrow, E.D. Fredrickson, G. Taylor, S. von Goeler, R.B. White Princeton Plasma Physics Laboratory, P.O. Box 451, Princeton, NJ 8543 Abstract MHD-induced
Formation of High-b ECH Plasma and Inward Particle Diffusion in RT-1
 J Fusion Energ (2010) 29:553 557 DOI 10.1007/s10894-010-9327-6 ORIGINAL RESEARCH Formation of High-b ECH Plasma and Inward Particle Diffusion in RT-1 H. Saitoh Z. Yoshida J. Morikawa Y. Yano T. Mizushima
Propagation of Radio Frequency Waves Through Fluctuations in Plasmas
 PSFC/JA-15- Propagation of Radio Frequency Waves Through Fluctuations in Plasmas A. K. Ram K. Hizanidis a and S. Valvis a a National Technical University of Athens (part of HELLAS) School of Electrical
Direct drive by cyclotron heating can explain spontaneous rotation in tokamaks
 Direct drive by cyclotron heating can explain spontaneous rotation in tokamaks J. W. Van Dam and L.-J. Zheng Institute for Fusion Studies University of Texas at Austin 12th US-EU Transport Task Force Annual
DIAGNOSTICS FOR ADVANCED TOKAMAK RESEARCH
 DIAGNOSTICS FOR ADVANCED TOKAMAK RESEARCH by K.H. Burrell Presented at High Temperature Plasma Diagnostics 2 Conference Tucson, Arizona June 19 22, 2 134 /KHB/wj ROLE OF DIAGNOSTICS IN ADVANCED TOKAMAK
Convective transport by intermittent blob-filaments: comparison of theory and experiment
 Convective transport by intermittent blob-filaments: comparison of theory and experiment D. A. D Ippolito 1, J. R. Myra 1 and S. J. Zweben 2 1Lodestar Research Corporation, Boulder, Colorado 2Princeton
Driving Mechanism of SOL Plasma Flow and Effects on the Divertor Performance in JT-60U
 EX/D-3 Driving Mechanism of SOL Plasma Flow and Effects on the Divertor Performance in JT-6U N. Asakura ), H. Takenaga ), S. Sakurai ), G.D. Porter ), T.D. Rognlien ), M.E. Rensink ), O. Naito ), K. Shimizu
1 EX/P6-5 Analysis of Pedestal Characteristics in JT-60U H-mode Plasmas Based on Monte-Carlo Neutral Transport Simulation
 1 Analysis of Pedestal Characteristics in JT-60U H-mode Plasmas Based on Monte-Carlo Neutral Transport Simulation Y. Nakashima1), Y. Higashizono1), H. Kawano1), H. Takenaga2), N. Asakura2), N. Oyama2),
Characterization of Edge Stability and Ohmic H-mode in the PEGASUS Toroidal Experiment
 Characterization of Edge Stability and Ohmic H-mode in the PEGASUS Toroidal Experiment M.W. Bongard, J.L. Barr, M.G. Burke, R.J. Fonck, E.T. Hinson, J.M. Perry, A.J. Redd, D.J. Schlossberg, K.E. Thome
Initial Investigations of H-mode Edge Dynamics in the PEGASUS Toroidal Experiment
 Initial Investigations of H-mode Edge Dynamics in the PEGASUS Toroidal Experiment M.W. Bongard, R.J. Fonck, K.E. Thome, D.S. Thompson 55 th Annual Meeting of the APS Division of Plasma Physics University
Progress in characterization of the H-mode pedestal
 Journal of Physics: Conference Series Progress in characterization of the H-mode pedestal To cite this article: A W Leonard 2008 J. Phys.: Conf. Ser. 123 012001 View the article online for updates and
Investigation of causes for the discrepancy between the measured and modeled helium emissions using a gas puff imaging diagnostic
 Investigation of causes for the discrepancy between the measured and modeled helium emissions using a gas puff imaging diagnostic S. Baek, J. Terry, D. P. Stotler*, D. Brunner, B. LaBombard MIT Plasma
Impurity accumulation in the main plasma and radiation processes in the divetor plasma of JT-60U
 1 EX/P4-25 Impurity accumulation in the main plasma and radiation processes in the divetor plasma of JT-6U T. Nakano, H. Kubo, N. Asakura, K. Shimizu and S. Higashijima Japan Atomic Energy Agency, Naka,
Scaling of divertor heat flux profile widths in DIII-D
 LLNL-PROC-432803 Scaling of divertor heat flux profile widths in DIII-D C. J. Lasnier, M. A Makowski, J. A. Boedo, S. L. Allen, N. H. Brooks, D. N. Hill, A. W. Leonard, J. G. Watkins, W. P. West May 20,
ArbiTER studies of filamentary structures in the SOL of spherical tokamaks
 ArbiTER studies of filamentary structures in the SOL of spherical tokamaks D. A. Baver, J. R. Myra, Research Corporation F. Scotti, Lawrence Livermore National Laboratory S. J. Zweben, Princeton Plasma
Phase ramping and modulation of reflectometer signals
 4th Intl. Reflectometry Workshop - IRW4, Cadarache, March 22nd - 24th 1999 1 Phase ramping and modulation of reflectometer signals G.D.Conway, D.V.Bartlett, P.E.Stott JET Joint Undertaking, Abingdon, Oxon,
GA A22443 STUDY OF H MODE THRESHOLD CONDITIONS IN DIII D
 GA A443 STUDY OF H MODE THRESHOLD CONDITIONS IN DIII D by R.J. GROEBNER, T.N. CARLSTROM, K.H. BURRELL, S. CODA, E.J. DOYLE, P. GOHIL, K.W. KIM, Q. PENG, R. MAINGI, R.A. MOYER, C.L. RETTIG, T.L. RHODES,
Effect of divertor nitrogen seeding on the power exhaust channel width in Alcator C-Mod
 Effect of divertor nitrogen seeding on the power exhaust channel width in Alcator C-Mod B. LaBombard, D. Brunner, A.Q. Kuang, W. McCarthy, J.L. Terry and the Alcator Team Presented at the International
Comparison of Pellet Injection Measurements with a Pellet Cloud Drift Model on the DIII-D Tokamak
 Comparison of Pellet Injection Measurements with a Pellet Cloud Drift Model on the DIII-D Tokamak T.C. Jernigan, L.R. Baylor, S.K. Combs, W.A. Houlberg (Oak Ridge National Laboratory) P.B. Parks (General
Characterization of neo-classical tearing modes in high-performance I- mode plasmas with ICRF mode conversion flow drive on Alcator C-Mod
 1 EX/P4-22 Characterization of neo-classical tearing modes in high-performance I- mode plasmas with ICRF mode conversion flow drive on Alcator C-Mod Y. Lin, R.S. Granetz, A.E. Hubbard, M.L. Reinke, J.E.
Effect of non-axisymmetric magnetic perturbations on divertor heat and particle flux profiles
 1 EXD/P3-01 Effect of non-axisymmetric magnetic perturbations on divertor heat and particle flux profiles J-W. Ahn 1, J.M. Canik 1, R. Maingi 1, T.K. Gray 1, J.D. Lore 1, A.G. McLean 1, J.-K. Park 2, A.L.
Overview of Tokamak Rotation and Momentum Transport Phenomenology and Motivations
 Overview of Tokamak Rotation and Momentum Transport Phenomenology and Motivations Lecture by: P.H. Diamond Notes by: C.J. Lee March 19, 2014 Abstract Toroidal rotation is a key part of the design of ITER
Experimental investigation of the parallel structure of fluctuations in the scrape-off layer of Alcator C-Mod
 Experimental investigation of the parallel structure of fluctuations in the scrape-off layer of Alcator C-Mod O. Grulke Max Planck Institute for Plasma Physics, Greifswald Branch, EURATOM Association,
FAR SCRAPE-OFF LAYER AND NEAR WALL PLASMA STUDIES IN DIII D
 GA A24724 FAR SCRAPE-OFF LAYER AND NEAR WALL PLASMA STUDIES IN DIII D by D.L. RUDAKOV, J.A. BOEDO, R.A. MOYER, N.H. BROOKS, R.P. DOERNER, T.E. EVANS, M.E. FENSTERMACHER, M. GROTH, E.M. HOLLMANN, S. KRASHENINNIKOV,
Partially Coherent Fluctuations in Novel High Confinement Regimes of a Tokamak
 Partially Coherent Fluctuations in Novel High Confinement Regimes of a Tokamak István Cziegler UCSD, Center for Energy Research Center for Momentum Transport and Flow Organization Columbia Seminar Feb
Estimating the plasma flow in a recombining plasma from
 Paper P3-38 Estimating the plasma flow in a recombining plasma from the H α emission U. Wenzel a, M. Goto b a Max-Planck-Institut für Plasmaphysik (IPP) b National Institute for Fusion Science, Toki 509-5292,
Nuclear Fusion Energy Research at AUB Ghassan Antar. Physics Department American University of Beirut
 Nuclear Fusion Energy Research at AUB Ghassan Antar Physics Department American University of Beirut Laboratory for Plasma and Fluid Dynamics [LPFD) Students: - R. Hajjar [Physics] - L. Moubarak [Physics]
SUMMARY OF EXPERIMENTAL CORE TURBULENCE CHARACTERISTICS IN OH AND ECRH T-10 TOKAMAK PLASMAS
 SUMMARY OF EXPERIMENTAL CORE TURBULENCE CHARACTERISTICS IN OH AND ECRH T-1 TOKAMAK PLASMAS V. Vershkov, L.G. Eliseev, S.A. Grashin. A.V. Melnikov, D.A. Shelukhin, S.V. Soldatov, A.O. Urazbaev and T-1 team
Physics of the detached radiative divertor regime in DIII-D
 Plasma Phys. Control. Fusion 41 (1999) A345 A355. Printed in the UK PII: S741-3335(99)97299-8 Physics of the detached radiative divertor regime in DIII-D M E Fenstermacher, J Boedo, R C Isler, A W Leonard,
Edge Rotational Shear Requirements for the Edge Harmonic Oscillation in DIII D Quiescent H mode Plasmas
 Edge Rotational Shear Requirements for the Edge Harmonic Oscillation in DIII D Quiescent H mode Plasmas by T.M. Wilks 1 with A. Garofalo 2, K.H. Burrell 2, Xi. Chen 2, P.H. Diamond 3, Z.B. Guo 3, X. Xu
Effects of q(r) on the Alpha Particle Ripple Loss in TFTR
 on the Alpha Particle Ripple Loss in TFTR") Effects of q(r) on the Alpha Particle Ripple Loss in TFTR S.J. Zweben, D.S. Darrow, S. Batha, R.V. Budny, M. Diesso, H. W. Herrmann, J. Giarrusso, M. Redi, H. Takahashi, S. von Goeler, R.B. White, and
Effects of q(r) on the Alpha Particle Ripple Loss in TFTR S.J. Zweben, D.S. Darrow, S. Batha, R.V. Budny, M. Diesso, H. W. Herrmann, J. Giarrusso, M. Redi, H. Takahashi, S. von Goeler, R.B. White, and
Fusion Nuclear Science Facility (FNSF) Divertor Plans and Research Options
 Divertor Plans and Research Options") Fusion Nuclear Science Facility (FNSF) Divertor Plans and Research Options A.M. Garofalo, T. Petrie, J. Smith, V. Chan, R. Stambaugh (General Atomics) J. Canik, A. Sontag, M. Cole (Oak Ridge National Laboratory)
Fusion Nuclear Science Facility (FNSF) Divertor Plans and Research Options A.M. Garofalo, T. Petrie, J. Smith, V. Chan, R. Stambaugh (General Atomics) J. Canik, A. Sontag, M. Cole (Oak Ridge National Laboratory)
Fusion Development Facility (FDF) Divertor Plans and Research Options
 Divertor Plans and Research Options") Fusion Development Facility (FDF) Divertor Plans and Research Options A.M. Garofalo, T. Petrie, J. Smith, M. Wade, V. Chan, R. Stambaugh (General Atomics) J. Canik (Oak Ridge National Laboratory) P. Stangeby
Fusion Development Facility (FDF) Divertor Plans and Research Options A.M. Garofalo, T. Petrie, J. Smith, M. Wade, V. Chan, R. Stambaugh (General Atomics) J. Canik (Oak Ridge National Laboratory) P. Stangeby
Studies of H Mode Plasmas Produced Directly by Pellet Injection in DIII D
 Studies of H Mode Plasmas Produced Directly by Pellet Injection in by P. Gohil in collaboration with L.R. Baylor,* K.H. Burrell, T.C. Jernigan,* G.R. McKee, *Oak Ridge National Laboratory University of
Current Drive Experiments in the HIT-II Spherical Tokamak
 Current Drive Experiments in the HIT-II Spherical Tokamak T. R. Jarboe, P. Gu, V. A. Izzo, P. E. Jewell, K. J. McCollam, B. A. Nelson, R. Raman, A. J. Redd, P. E. Sieck, and R. J. Smith, Aerospace & Energetics
GA A22863 PLASMA PRESSURE AND FLOWS DURING DIVERTOR DETACHMENT
 GA A22863 PLASMA PRESSURE AND FLOWS DURING DIVERTOR DETACHMENT by M.J. SCHAFFER, J.A. BOEDO, N.H. BROOKS, R.C. ISLER, and R.A. MOYER AUGUST 1998 DISCLAIMER This report was prepared as an account of work
TRANSPORT PROGRAM C-MOD 5 YEAR REVIEW MAY, 2003 PRESENTED BY MARTIN GREENWALD MIT PLASMA SCIENCE & FUSION CENTER
 TRANSPORT PROGRAM C-Mod C-MOD 5 YEAR REVIEW MAY, 2003 PRESENTED BY MARTIN GREENWALD MIT PLASMA SCIENCE & FUSION CENTER C-MOD - OPPORTUNITIES AND CHALLENGES Prediction and control are the ultimate goals
Drift-Driven and Transport-Driven Plasma Flow Components in the Alcator C-Mod Boundary Layer
 Drift-Driven and Transport-Driven Plasma Flow Components in the Alcator C-Mod Boundary Layer N. Smick, B. LaBombard MIT Plasma Science and Fusion Center PSI-19 San Diego, CA May 25, 2010 Boundary flows
Helium-3 transport experiments in the scrape-off layer with the Alcator C-Mod omegatron ion mass spectrometer
 PHYSICS OF PLASMAS VOLUME 7, NUMBER 11 NOVEMBER 2000 Helium-3 transport experiments in the scrape-off layer with the Alcator C-Mod omegatron ion mass spectrometer R. Nachtrieb a) Lutron Electronics Co.,
Statistical Analysis of Fluctuation Characteristics at High- and Low-Field Sides in L-mode SOL Plasmas of JT-60U
 1 EX/P4-18 Statistical Analysis of Fluctuation Characteristics at High- and Low-Field Sides in L-mode SOL Plasmas of JT-60U N. Ohno1), H. Tanaka1), N. Asakura2), Y. Tsuji1), S. Takamura3), Y. Uesugi4)
Transport Improvement Near Low Order Rational q Surfaces in DIII D
 Transport Improvement Near Low Order Rational q Surfaces in DIII D M.E. Austin 1 With K.H. Burrell 2, R.E. Waltz 2, K.W. Gentle 1, E.J. Doyle 8, P. Gohil 2, C.M. Greenfield 2, R.J. Groebner 2, W.W. Heidbrink
Observation of Neo-Classical Ion Pinch in the Electric Tokamak*
 1 EX/P6-29 Observation of Neo-Classical Ion Pinch in the Electric Tokamak* R. J. Taylor, T. A. Carter, J.-L. Gauvreau, P.-A. Gourdain, A. Grossman, D. J. LaFonteese, D. C. Pace, L. W. Schmitz, A. E. White,
OVERVIEW OF THE ALCATOR C-MOD PROGRAM. IAEA-FEC November, 2004 Alcator Team Presented by Martin Greenwald MIT Plasma Science & Fusion Center
 OVERVIEW OF THE ALCATOR C-MOD PROGRAM IAEA-FEC November, 2004 Alcator Team Presented by Martin Greenwald MIT Plasma Science & Fusion Center OUTLINE C-Mod is compact, high field, high density, high power
Overview Impact of 3D fields (RMP) on edge turbulence and turbulent transport
 on edge turbulence and turbulent transport") Trilateral Euregio Cluster Overview Impact of 3D fields (RMP) on edge turbulence and turbulent transport TEC Yuhong Xu Laboratory for Plasma Physics, Ecole Royale Militaire - Koninklijke Militaire School,
Trilateral Euregio Cluster Overview Impact of 3D fields (RMP) on edge turbulence and turbulent transport TEC Yuhong Xu Laboratory for Plasma Physics, Ecole Royale Militaire - Koninklijke Militaire School,
(Motivation) Reactor tokamaks have to run without disruptions
 Reactor tokamaks have to run without disruptions") Abstract A database has been developed to study the evolution, the nonlinear effects on equilibria, and the disruptivity of locked and quasi-stationary modes with poloidal and toroidal mode numbers m=2
Abstract A database has been developed to study the evolution, the nonlinear effects on equilibria, and the disruptivity of locked and quasi-stationary modes with poloidal and toroidal mode numbers m=2
Active and Passive MHD Spectroscopy on Alcator C-Mod
 Active and Passive MHD Spectroscopy on Alcator C-Mod J A Snipes, D A Schmittdiel, C Boswell, A Fasoli *, W Burke, R S Granetz, R R Parker, S Sharapov #, R Vieira MIT Plasma Science and Fusion Center, Cambridge,
Local Plasma Parameters and H-Mode Threshold in Alcator C-Mod
 PFC/JA-96-42 Local Plasma Parameters and H-Mode Threshold in Alcator C-Mod A.E. Hubbard, J.A. Goetz, I.H. Hutchinson, Y. In, J. Irby, B. LaBombard, P.J. O'Shea, J.A. Snipes, P.C. Stek, Y. Takase, S.M.
channel system which covers both sides of the laser line. Coverage on both sides of the spectrum allows for
 Large-Area Avalanche Photodiode Detector Array Upgrade for a Ruby-Laser Thomson Scattering System T.M. Biewer, D.J. Den Hartog, D.J. Holly Department of Physics, University of Wisconsin-Madison M.R. Stoneking
On the physics of shear flows in 3D geometry
 On the physics of shear flows in 3D geometry C. Hidalgo and M.A. Pedrosa Laboratorio Nacional de Fusión, EURATOM-CIEMAT, Madrid, Spain Recent experiments have shown the importance of multi-scale (long-range)
Particle and Energy Transport in the SOL of DIII-D and NSTX
 1 EX/P4-2 Particle and Energy Transport in the SOL of DIII-D and NSTX J.A. Boedo 1), R.J. Maqueda 2), D.L. Rudakov 1), G.R. McKee 3), H. Kugel 4), R. Maingi 5), N. Crocker 6), R.A. Moyer 1), V.A. Soukhanovskii
Power Balance and Scaling of the Radiated Power in the Divertor and Main Plasma of Alcator C-Mod
 PFC/JA-94-15 Power Balance and Scaling of the Radiated Power in the Divertor and Main Plasma of Alcator C-Mod J.A. Goetz, B. Lipschultz, M.A. Graf, C. Kurz, R. Nachtrieb, J.A. Snipes, J.L. Terry Plasma
Progress of Confinement Physics Study in Compact Helical System
 1st IAEA Fusion Energy Conference Chengdu, China, 16-1 October, 6 IAEA-CN-149/ EX/5-5Rb Progress of Confinement Physics Study in Compact Helical System S. Okamura et al. NIFS-839 Oct. 6 1 EX/5-5Rb Progress
Development of a High-Speed VUV Camera System for 2-Dimensional Imaging of Edge Turbulent Structure in the LHD
 Development of a High-Speed VUV Camera System for 2-Dimensional Imaging of Edge Turbulent Structure in the LHD Masaki TAKEUCHI, Satoshi OHDACHI and LHD experimental group National Institute for Fusion
Measurements of rotational transform due to noninductive toroidal current using motional Stark effect spectroscopy in the Large Helical Device
 REVIEW OF SCIENTIFIC INSTRUMENTS 76, 053505 2005 Measurements of rotational transform due to noninductive toroidal current using motional Stark effect spectroscopy in the Large Helical Device K. Ida, a
Plasma Spectroscopy in ISTTOK
 Plasma Spectroscopy in ISTTOK J. Figueiredo 1, R. B. Gomes 1, T. Pereira 1, H. Fernandes 1, A. Sharakovski 2 1 Associação EURATOM/IST, Centro de Fusão Nuclear, IST, 1049-001 Lisboa, Portugal 2 Association
Electrode and Limiter Biasing Experiments on the Tokamak ISTTOK
 Electrode and Limiter Biasing Experiments on the Tokamak ISTTOK C. Silva, H. Figueiredo, J.A.C. Cabral,, I. Nedzelsky, C.A.F. Varandas Associação Euratom/IST, Centro de Fusão Nuclear, Instituto Superior
Understanding Edge Harmonic Oscillation Physics Using NIMROD
 Understanding Edge Harmonic Oscillation Physics Using NIMROD J. King With contributions from S. Kruger & A. Pankin (Tech-X); K. Burrell, A. Garofalo, R. Groebner & P. Snyder (General Atomics) Work supported
Edge and Internal Transport Barrier Formations in CHS. Identification of Zonal Flows in CHS and JIPPT-IIU
 Edge and Internal Transport Barrier Formations in CHS S. Okamura, T. Minami, T. Akiyama, T. Oishi, A. Fujisawa, K. Ida, H. Iguchi, M. Isobe, S. Kado, K. Nagaoka, K. Nakamura, S. Nishimura, K. Matsuoka,
Characteristics of the H-mode H and Extrapolation to ITER
 Characteristics of the H-mode H Pedestal and Extrapolation to ITER The H-mode Pedestal Study Group of the International Tokamak Physics Activity presented by T.Osborne 19th IAEA Fusion Energy Conference
Formation and Long Term Evolution of an Externally Driven Magnetic Island in Rotating Plasmas )
") Formation and Long Term Evolution of an Externally Driven Magnetic Island in Rotating Plasmas ) Yasutomo ISHII and Andrei SMOLYAKOV 1) Japan Atomic Energy Agency, Ibaraki 311-0102, Japan 1) University
Formation and Long Term Evolution of an Externally Driven Magnetic Island in Rotating Plasmas ) Yasutomo ISHII and Andrei SMOLYAKOV 1) Japan Atomic Energy Agency, Ibaraki 311-0102, Japan 1) University
PREDICTIVE MODELING OF PLASMA HALO EVOLUTION IN POST-THERMAL QUENCH DISRUPTING PLASMAS
 GA A25488 PREDICTIVE MODELING OF PLASMA HALO EVOLUTION IN POST-THERMAL QUENCH DISRUPTING PLASMAS by D.A. HUMPHREYS, D.G. WHYTE, M. BAKHTIARI, R.D. DERANIAN, E.M. HOLLMANN, A.W. HYATT, T.C. JERNIGAN, A.G.
L-Mode and Inter-ELM Divertor Particle and Heat Flux Width Scaling on MAST
 CCFE-PR(13)33 J. R. Harrison, G. M. Fishpool and A. Kirk L-Mode and Inter-ELM Divertor Particle and Heat Flux Width Scaling on MAST Enquiries about copyright and reproduction should in the first instance
D.J. Schlossberg, D.J. Battaglia, M.W. Bongard, R.J. Fonck, A.J. Redd. University of Wisconsin - Madison 1500 Engineering Drive Madison, WI 53706
 D.J. Schlossberg, D.J. Battaglia, M.W. Bongard, R.J. Fonck, A.J. Redd University of Wisconsin - Madison 1500 Engineering Drive Madison, WI 53706 Concept Overview Implementation on PEGASUS Results Current
GA A22337 INITIAL OPERATION OF THE DIVERTOR THOMSON SCATTERING DIAGNOSTIC ON DIII D
 GA A22337 INITIAL OPERATION OF THE DIVERTOR THOMSON SCATTERING by T.N. CARLSTROM, C.L. HSIEH, R.E. STOCKDALE, D.G. NILSON, and D.N. HILL MAY 1996 GA A22337 INITIAL OPERATION OF THE DIVERTOR THOMSON SCATTERING
Diagnostics for Burning Plasma Physics Studies: A Status Report.
 Diagnostics for Burning Plasma Physics Studies: A Status Report. Kenneth M. Young Princeton Plasma Physics Laboratory UFA Workshop on Burning Plasma Science December 11-13 Austin, TX Aspects of Plasma
Understanding Turbulence is a Grand Challenge
 The Turbulent Structure of a Plasma Confined by a Magnetic Dipole B. A. Grierson M.W. Worstell, M.E. Mauel ICC 28 Reno, NV 1 Understanding Turbulence is a Grand Challenge Ubiquitous in natural and laboratory
Active and Fast Particle Driven Alfvén Eigenmodes in Alcator C-Mod
 Active and Fast Particle Driven Alfvén Eigenmodes in Alcator C-Mod JUST DID IT. J A Snipes, N Basse, C Boswell, E Edlund, A Fasoli #, N N Gorelenkov, R S Granetz, L Lin, Y Lin, R Parker, M Porkolab, J
Analyses of Visible Images of the Plasma Periphery Observed with Tangentially Viewing CCD Cameras in the Large Helical Device
 Analyses of Visible Images of the Plasma Periphery Observed with Tangentially Viewing CCD Cameras in the Large Helical Device M. SHOJI, T. WATANABE, S. MASUZAKI, H. YAMADA, A. KOMORI and LHD Experimental
Spatio-temporal investigations on the triggering of pellet induced ELMs
 Spatio-temporal investigations on the triggering of pellet induced ELMs G. Kocsis, S. Kálvin, P.T. Lang*, M. Maraschek*, J. Neuhauser* W. Schneider*, T. Szepesi and ASDEX Upgrade Team KFKI-RMKI, EURATOM
Reduction of Turbulence and Transport in the Alcator C-Mod Tokamak by Dilution of Deuterium Ions with Nitrogen and Neon Injection
 Reduction of Turbulence and Transport in the Alcator C-Mod Tokamak by Dilution of Deuterium Ions with Nitrogen and Neon Injection M. Porkolab, P. C. Ennever, S. G. Baek, E. M. Edlund, J. Hughes, J. E.
Development of an experimental profile database for the scrape-off layer
 Development of an experimental profile database for the scrape-off layer M. Groth, 1 G.D. Porter, 1 W.M. Meyer, 1 A.W. Leonard, 2 T.H. Osborne, 2 D.P. Coster, 3 A. Kallenbach, 3 M. Wischmeier 3 N.H. Brooks,
Highlights from (3D) Modeling of Tokamak Disruptions
 Modeling of Tokamak Disruptions") Highlights from (3D) Modeling of Tokamak Disruptions Presented by V.A. Izzo With major contributions from S.E. Kruger, H.R. Strauss, R. Paccagnella, MHD Control Workshop 2010 Madison, WI ..onset of rapidly
Highlights from (3D) Modeling of Tokamak Disruptions Presented by V.A. Izzo With major contributions from S.E. Kruger, H.R. Strauss, R. Paccagnella, MHD Control Workshop 2010 Madison, WI ..onset of rapidly
II: The role of hydrogen chemistry in present experiments and in ITER edge plasmas. D. Reiter
 II: The role of hydrogen chemistry in present experiments and in ITER edge plasmas D. Reiter Institut für Plasmaphysik, FZ-Jülich, Trilateral Euregio Cluster Atomic and Molecular Data for Fusion Energy
Invessel Calibration of the Alcator C-Mod MSE Diagnostic
 Invessel Calibration of the Alcator C-Mod MSE Diagnostic Steve Scott (PPPL) Howard Yuh, Bob Granetz, Jinseok Ko, Ian Hutchinson (MIT/PSFC) APS/DPP Meeting Savannah, GA November 2004 Introduction Previously,
Fluctuation statistics in the scrape-off layer of Alcator C-Mod
 Fluctuation statistics in the scrape-off layer of Alcator C-Mod R. Kube, O. E. Garcia, B. LaBombard, and J. L. Terry We study long time series of the ion saturation current and floating potential, obtained
This is a repository copy of Radial localization of edge modes in Alcator C-Mod pedestals using optical diagnostics.
 This is a repository copy of Radial localization of edge modes in Alcator C-Mod pedestals using optical diagnostics. White Rose Research Online URL for this paper: http://eprints.whiterose.ac.uk/539/ Version:
Rapid changes of turbulence propagation direction in the edge of
 Rapid changes of turbulence propagation direction in the edge of I. Cziegler, J. L. Terry MIT Plasma Science and Fusion Center APS Division of Plasma Physics Dallas TX, November 8 Motivations for edge/sol