Invited Review Article: Gas Puff Imaging Diagnostics of Edge Plasma Turbulence in Magnetic Fusion Devices. X Science LLC, Plainsboro, NJ 08536, USA
|
|
|
- Irma Dean
- 5 years ago
- Views:
Transcription
1 Invited Review Article: Gas Puff Imaging Diagnostics of Edge Plasma Turbulence in Magnetic Fusion Devices S.J. Zweben 1, J.L. Terry 2, D.P. Stotler 1, R.J. Maqueda 3 1 Princeton Plasma Physics Laboratory, Princeton NJ 08540, USA 2 MIT, Cambridge, MA 02139, USA 3 X Science LLC, Plainsboro, NJ 08536, USA Abstract Gas puff imaging (GPI) is a diagnostic of plasma turbulence which uses a puff of neutral gas at the plasma edge to increase the local visible light emission for improved space-time resolution of plasma fluctuations. This paper reviews gas puff imaging diagnostics of edge plasma turbulence in magnetic fusion research, with a focus on the instrumentation, diagnostic cross-checks, and interpretation issues. The gas puff imaging hardware, optics, and detectors are described for about 10 GPI systems implemented over the past ~15 years. Comparison of GPI results with other edge turbulence diagnostic results are described and many common features are observed. Several issues in the interpretation of GPI measurements are discussed, and potential improvements in hardware and modeling are suggested. Copyright Notice and Acknowledgment: Notice: This manuscript is based upon work supported by the U.S. Department of Energy, Office of Science, Office of Fusion Energy Sciences, and has been authored by Princeton University under Contract Number DE-AC02-09CH11466 with the U.S. Department of Energy. The publisher, by accepting the article for publication acknowledges, that the United States Government retains a non-exclusive, paid-up, irrevocable, world-wide license to publish or reproduce the published form of this manuscript, or allow others to do so, for United States Government purposes. Princeton Plasma Physics Laboratory 1
2 I. Introduction This paper reviews gas puff imaging (GPI) diagnostics of edge plasma turbulence in magnetic fusion research, with a focus on instrumentation, diagnostic cross-checks, and interpretation issues. The gas puff imaging hardware, optics, and detectors are described for the ~10 GPI systems which have been implemented over the past ~15 years. Comparison of GPI results with other edge turbulence diagnostic results are described, and many common features are observed. Several issues in the interpretation of GPI measurements are discussed, and potential improvements in hardware and modeling are suggested. After this Introduction, Sec. II gives a general overview of GPI, Sec. III describes the diagnostic hardware, Sec. IV describes diagnostic cross-checks, Sec. V describes GPI interpretation issues, and Sec. VI is a Discussion, including a summary and list of potential improvements. I.A Motivation and background The motivation for GPI diagnostics is to obtain high resolution data on the spacetime structure of the edge turbulence in magnetic fusion devices. The term edge in this paper refers to the radial region near the magnetic separatrix (or last closed magnetic flux surface), where the electron temperature is roughly T e ~ ev and where the neutral atoms used in GPI are not completely ionized. The region from the separatrix to the wall is called the scrape-off layer (SOL), and is connected to a wall along a magnetic field line. The edge region just inside the separatrix is hotter and on closed flux surfaces, but GPI can still be used there to the extent that neutrals penetrate (usually within a few centimeters). Both of these edge regions are discussed in this paper. Edge turbulence is important in determining the particle and energy confinement and the plasma-wall interactions in present toroidal magnetic fusion devices. For example, the high confinement H-mode regime of tokamaks and stellarators is generally associated with a reduction in the edge turbulence just inside the magnetic separatrix, and the width of the scrape-off-layer is at least partially dependent on turbulent transport just outside the magnetic separatrix. These effects will also be important for the successful operation of future magnetic fusion devices such as ITER. Edge turbulence in magnetic fusion devices has been measured using many diagnostics including Langmuir probes, electromagnetic scattering, visible imaging, and heavy ion beams. The overall result since the 1970 s is that the edge plasma turbulence has a high relative fluctuation level (~10-100%), and has a 3-D structure which is highly elongated along B (the magnetic field direction) [1,2]. The causes of edge turbulence have been generically identified as drift-wave and/or interchange instabilities, which are created and sustained by the temperature and/or density gradients in the edge plasma, and the associated radial transport is due the ExB motion driven by electric field fluctuations. However, due to the difficulty of turbulence measurements and the complexity of nonlinear computational simulations, the quantitative connection between experiment and theory is still under investigation, e.g. [3]. 2
3 Gas puff imaging uses a puff of neutral gas to increase the local light emission level for improved optical imaging of the space-time structure of the edge plasma turbulence. The gas puff also localizes the region viewed to a nearly 2-D plane within the 3-D structure of the turbulence filaments, i.e. to the plane perpendicular to the local magnetic field direction (see Sec. II.A for a description of the GPI geometry). The spatial scales measurable by GPI range from the ion gyroradius of ~ cm up to the radial size scale of the edge region of ~ 1-10 cm, and the observed frequency range is ~ 1 khz to ~ 1 MHz. Thus edge turbulence as studied with GPI ranges over at least two orders of magnitude in space and timescales, over which there is a broadband spectrum of size-scale and frequency, sometimes accompanied by discrete coherent modes. I.B History of fast imaging in magnetic fusion The first high speed imaging of plasma fluctuations in magnetic fusion devices was done in the s using rotating mirror and streak cameras, e.g. on high-beta plasmas [4]. However, these images showed mainly large-scale MHD instabilities such as kink modes, and not the smaller-scale turbulent structure. Imaging of soft x-rays emitted from the hot plasma core better localized the internal plasma fluctuations, but these results were also dominated by large-scale MHD instabilities such as tearing modes and not the smaller-scale turbulence. The earliest images of tokamak plasma turbulence were made in the ASDEX and DITE tokamaks using high-speed movie film photography [5-7]. Relatively bright fieldaligned filaments of visible light emission were observed continuously near deuterium or methane gas puff locations at the outer edge of the tokamak. Although these movies did not resolve the filament motion, they did suggest that the filaments are always present but are normally invisible and are illuminated by the presence of atoms or ions emitting visible radiation [5]. It was natural to suspect that these visible filaments in the tokamak edge were associated with edge density fluctuations being measured with Langmuir probes and microwaves scattering at that time, and which were theoretically expected to have a filamentary structure [1,7]. This was confirmed using a poloidal array of visible light detectors in the Caltech tokamak, in which the light fluctuations were highly correlated with nearby Langmuir probe measurements of edge density fluctuations [8]. Clear edge filaments were later observed in fast-gated intensified camera images of light emission from the inner bumper limiter (high-field region) of the large tokamak TFTR [9]. Subsequently, poloidal arrays of deuterium Balmer- light emission measurements were made in the ASDEX tokamak and the W7-AS stellarator in the vicinity of a gas puffing valve at the outer midplane [10,11]. These Balmer- fluctuations had similar correlation times, poloidal length scales and poloidal velocities to the density fluctuations measured using a poloidal array of Langmuir probes near the outer midplane. 3
4 Thus by early 2000 s it appeared that optical imaging could be used to measure new features of the edge turbulence of magnetic fusion devices, such as the 2-D radial vs. poloidal structure of the turbulent filaments and the motion of coherent blob structures in the SOL. This led to the parallel development and first results of gas puff imaging systems on the NSTX [12,13] and Alcator C-Mod tokamaks [14-17]. An overview of GPI is given in Sec. II. I.C Passive turbulence imaging without a gas puff Before discussing GPI in detail, it worth noting the advantages and limitations of turbulence imaging without an explicit gas puff. Results of such passive imaging can be quite remarkable and useful; for example, imaging of the Earth s auroral turbulence [18] or the Sun s atmosphere [19]. The obvious limitations of passive imaging are that the source of light is not under control, and that the fluctuations are integrated along a lineof-sight. Passive visible imaging of turbulence has been done in linear magnetized plasmas by viewing along the magnetic field, in which the turbulence is assumed to be constant over the parallel scale of the machine. For example, imaging of the unfiltered light emitted by CSDX in an argon plasma showed fluctuating 2-D structures in the radial vs. poloidal plane, which had a statistically significant correlation coefficient (~0.5) with local density fluctuations measured by a Langmuir probe [20,21]. More recent passive imaging measurements in CSDX used ArI and ArII line filters and identified coherent modes and multiple instabilities during the route to fully developed turbulence [22,23], and turbulence in linear devices was also imaged with a fast camera in Mirabelle [24] and LAPD [25]. Fast passive imaging has also been done in the small toroidal device TORPEX using a hydrogen plasma, but without an interference filter [26]. A 4 khz interchange mode seen by Langmuir probes was also seen in camera images, and the images were tomographically reconstructed to resolve small-scale structures. A gas puff and camera intensifier were added to improve the system, and a higher cross-correlation (~0.8) was found between the light emission fluctuations and the interchange turbulence in the probe array [27]. Tangential passive imaging of visible light (mainly H ) was also done in the QUEST device in a simple torus configuration, showing blob formation and propagation similar to that in a tokamak SOL [28]. High speed camera imaging of neutral hydrogen recycling near a limiter was done in the TJ-II stellarator, and the 2-D motion of plasma blobs was observed within the shear layer [29,30]. High speed imaging was also done in the TJ-K stellarator using tangential viewing without filters, but with a small depth of field to minimize the effects due to integration along the line of sight [31,32]. The blobs structures seen in the TJ-K camera were similar to those seen by probes. Passive imaging of edge light emission of Balmer- light from the midplane SOL 4
5 has been done in the MAST spherical tokamak, in which the separatrix is far from the vessel wall and the ambient neutral density is high in the SOL [33,34]. The properties of the MAST filaments derived from these passive images are generally similar to those seen using GPI on NSTX (a similar device), and are also well correlated with Langmuir probe signals. Passive imaging results were also obtained from the QUEST spherical tokamak, including a detailed analysis of the statistical properties of the edge turbulence [35]. Tangential passive imaging of the filamentary structure of ELMs at 150 khz has recently been reported by the COMPASS tokamak [36]. Finally, fast visible imaging of Balmer- light was recently done near the X-point and lower divertor regions in MAST [37] and Alcator C-Mod [38]. Clear filaments with complex dynamics were observed near the inner divertor leg, in the private flux zone and in the SOL outside of the outer divertor leg. Spiral-shaped bands have also been observed in the LiI emission at the divertor plate surface in NSTX which were highly correlated with midplane GPI images taken simultaneously, and were explained as the field-aligned footprints of SOL blobs [39]. Similar turbulence images near the divertor and wall in NSTX-U were recently made using CIII and D light in the SOL [40]. In summary, passive imaging of turbulence can be useful in linear devices, but is limited in toroidal devices by the line-of-sight integration over the emission sources, which are usually not well localized. Although passive imaging has the advantage of being intrinsically non-perturbative, the 2-D imaging of edge turbulence is more easily done using a controlled gas puff in the GPI configuration, as described below. II. Overview of GPI A long-term development of the GPI diagnostic was started in parallel on the Alcator C-Mod and NSTX tokamaks [12-17]. Since then there have been many hardware improvements and successful applications to other magnetic fusion devices, but the basic features of the instrumentation and interpretation of the data remain the same. This section gives an brief overview of the GPI diagnostic systems in magnetic fusion devices. The basic geometry is described in Sec. II.A, some examples of GPI turbulence images are in Sec. II.B, and a summary of what GPI can measure is in Sec. II.C. The choice of the GPI gas is discussed in Sec. II.D, and the GPI spatial resolution is discussed in Sec. II.E. and the interpretation of GPI signals is discuss in Sec. II.F. Further details on each of these topics are given in Secs. III Sec. V. II.A GPI geometry The basic idea behind gas puff imaging (GPI) is illustrated in Fig. 1(a). At the left is a highly idealized picture of a single 3-D plasma edge turbulence filament, which is aligned along B, the magnetic field direction. Also shown schematically is a neutral gas 5
6 puff cloud intersecting this filament within a small length along the filament. If the neutral atom light emission from the filament increases significantly within this gas cloud, then the 2-D radial vs. poloidal structure of the filament in the plane perpendicular to B should be visible when viewed from along the local B direction (labeled GPI view ). Ideally, the gas cloud should be a narrow sheet beam perpendicular to the magnetic field in order to optimize the spatial resolution of the magnetic field-aligned structures as seen in GPI. The 2-D cross-section of the filament perpendicular to B is the circular region labeled blob in this generic figure. Although the term blob is generally used to mean the 2-D cross-section of relatively isolated density filaments in the SOL of tokamaks, similar magnetic-field-aligned plasma fluctuations of variable amplitude exist both inside and outside the magnetic separatrix in tokamaks and other toroidal devices. The determination of the structure and motion of these edge plasma fluctuations is the goal of GPI. A more specific illustration of the GPI geometry is shown in Fig. 1(b). The structures in yellow are edge density fluctuations aligned along the magnetic field near the separatrix, as taken from the turbulence simulation code XGC-1 run for DIII-D [41]. The gray is the GPI gas cloud shape from DEGAS 2, and the yellow glow is where the filaments intersect the computed gas cloud. In this case the radial width of the GPI gas cloud is smaller than its poloidal or toroidal width. Other examples of GPI usage are mentioned in Sec. II.C. Thus GPI measures the 2-D structure of edge plasma turbulence by localizing the measurement using a gas puff, and by interpreting the neutral line emission from that puff assuming that the turbulence is aligned parallel to B. The assumption of a long parallel structure is firmly based on the theoretical idea of rapid motion of electrons along B, and confirmed by measurements showing a high correlation of density fluctuations parallel to B. This GPI cross-beam imaging technique is generically similar to other plasma diagnostic methods such as beam emission spectroscopy (BES) [41a] and planar laser induced flourescence (LIF) [41b]. Obviously an important requirement for the GPI diagnostic is that the gas puff does not significantly perturb the local plasma or the edge turbulence itself (see Sec. V.F). II.B Examples of GPI images Some examples of GPI edge turbulence images from four tokamaks are shown in Figs Each of these figures also shows a different method of presenting the data, as described below. Figure 2 shows GPI images from the NSTX tokamak made over a 24 cm (radial) x 30 cm (poloidal) region near the outer midplane using a D 2 gas puff and a Balmer- filter, with a 2.1 µsec camera exposure time [42]. At the top is an example of a typical L- mode image showing the complex turbulence structure, and at the bottom is an H-mode 6
7 image later in the same shot, which is nearly quiescent (turbulence-free). In both cases the raw camera data is displayed using the same false linear color scale (white as maximum and black as zero), with the poloidal direction vertical, the radial direction horizontal (outward to the right), and the magnetic separatrix shown by the dashed line. This data was analyzed in detail only within the orange boxes, since D emission was too small in the low electron temperature region near the wall (right of the box), and also too small farther into the hot plasma where the deuterium was largely ionized (left of the box). Thus GPI measures the turbulence within the radial window where the maximum Balmer- emission from the deuterium puff occurs. Figure 3 shows GPI images from the Alcator C-Mod tokamak from two different 6 cm x 6 cm regions taken after puffing D 2 gas with a Balmer- line filter [43]. The lower image is from a GPI view of the region outboard and somewhat above the lower X- point, while the upper image is from a GPI view of the outer midplane region. Both were taken in H-mode plasmas. In this instance the images are normalized with respect to the time-averaged images to show the structure of the relative fluctuation level in a selected image, where white is 1.5 or greater and black is <0.5, and the low signal region far inside the separatrix is forced black. The fluctuation levels are often large in both locations (greater than ±50% ). Note the blob-like structure in the midplane image, while the structures outboard of the X-point are elongated and significantly tilted with respect to the local separatrix. Figure 4 shows a time sequence of GPI images from the TEXTOR tokamak made at the outer midplane using deuterium gas with a Balmer- filter. These frames each cover a 12 cm x 12 cm region and have a camera exposure time of 6 µsec [44]. These images have their time average image subtracted to show more clearly the positive (red) and negative (blue) excursions from the mean signal. The polodial motion of one positive structure is shown by the black dashed line, and the last closed flux surface is shown by the green dashed line, with the radially outward direction toward the left. This data is from an Ohmic discharge. Figure 5 shows a time sequence of GPI images from the ASDEX Upgrade tokamak created using a 2-D conditional averaging (CA) technique based on the normalized light intensity fluctuations [45]. The GPI data was taken again with a deuterium gas puff and Balmer- filter, here with 8 µsec between frames during an inter- ELM period in an H-mode plasma, and over a region of ~5 cm x 5 cm just below the outer midplane. The reference pixel is the small x, the threshold for CA is two times the standard deviation, and 556 trigger events were averaged to produce these averaged images. The positive blob structure shown (red) was born inside the separatrix (dashed line), and on average propagated radially outward (to the right) and poloidally in the ion diamagnetic drift direction (i.e. downward) over ~50 µsec. The fluctuation amplitude is scaled to a maximum at t=0, and a faint negative (hole) structure is also shown in blue. II.C What does GPI measure? 7
8 A list of measurements which have been done using GPI is given in Table 1. The GPI diagnostic is most often used to measure edge turbulence by analyzing the space vs. time patterns of GPI light emission, such as those in Figs For example, the turbulence correlation lengths can be obtained from cross-correlations of the GPI light emission vs. poloidal or radial position, and turbulence velocities can be obtained from time-delayed spatial cross-correlations or Fourier mode analyses. The raw data is often normalized by the time-averaged image before analysis (as in Fig. 3), in order to remove time-independent spatial variations due to the cloud emissivity shape, which are of order unity in the raw image (as in Fig. 2). However, it is important to stress that GPI measures the visible light emitted by neutral atom line radiation from the gas puff, and does not directly measure the electron density or temperature fluctuations. However, is sometimes assumed that the line emission fluctuations are dominated by electron density fluctuations, which are known to be large in the edge and which have properties very similar to the visible light fluctuations measured by GPI. This interpretation is discussed in detail in Sec. II.F and Sec. V.B. The space-time range of GPI turbulence measurements is defined by the region over which the visible neutral line emission has a high signal/noise and signal/background ratio, which is typically within ~0.5-5 cm and ~1-100 µsec (see Table 1). This measurement range corresponds to regions where the electron temperature is above T e ~ 5 ev where the excitation rate of the neutral lines becomes significant, and below T e ~ 200 ev, above which the neutrals are largely ionized (see Sec. II.F). This sensitivity to the atomic physics defines the radial range over which the GPI can make measurements, and is usually located within a few centimeters inside and outside the magnetic separatrix in present magnetic fusion devices. This is a region where the edge turbulence is normally strong and the radial transport due to the turbulence is large. In large fusion devices such as ITER, the neutrals from a gas puff may not penetrate inside the separatrix, so GPI would then be useful only in the SOL. A popular use of GPI is to measure the 2-D structure and motion of discrete plasma blobs or filaments, which form near the magnetic separatrix and move outward into the scrape-off layer (SOL). These structures are highly variable and not well understood, despite much theoretical and experimental analysis [46,47]. The 2-D blob formation and motion into the SOL can be measured by GPI in present devices, and the 2-D motion of the turbulence can be evaluated by various velocimetry methods, as discussed in Sec. V.G. For a full interpretation of the GPI observations of blobs it is also useful to have plasma potential and electric field fluctuation measurements, for example from Langmuir probes. GPI has also been used to measure the quasi-coherent edge oscillations [48-50] and edge localized modes (ELMs) [51,52]. The GPI light signal will respond to any density/temperature perturbations associated with edge instabilities, and also indirectly to any radial movement of edge magnetic flux surfaces which causes local density/temperature perturbations. 8
9 Studies of nonlinear interactions between the two fluctuation fields (density and velocity) have been performed using GPI, where velocimetry of GPI images has been used to infer the turbulent velocity field. This has allowed evaluations of the coupling between Geodesic Acoustic Modes (GAM), zonal flows (ZF), and quasi-coherent edge modes [53], as well as the turbulent kinetic energy transfer between zonal flows and the ambient small scale edge turbulence [54]. These studies of the turbulence dynamics are then used to examine the underlying physics of confinement-mode transitions, e.g. L- mode to H-mode transitions and I-mode to H-mode transitions [55]. Table 1: Measurements done with GPI measurement typical values relative fluctuation level ~ 5-100% frequency spectrum ~ khz autocorrelation time ~ µsec radial correlation length ~ cm poloidal correlation length ~ 1-10 cm parallel correlation length ~ 1-10 m poloidal turbulence velocity ~ 0-10 km/sec radial turbulence velocity ~ 0-3 km/sec zonal flow oscillations ~ 2 20 khz quasi-coherent edge modes ~ khz blob generation rate highly variable blob structure and motion highly variable edge localized modes (ELMs) highly variable II.D Choice of GPI gas and spectral line The neutral gas used for GPI has usually been either deuterium or helium, since these have the lowest atomic number and are generally the least perturbing to the plasma. Since most fusion experiments use deuterium as the main fueling gas, deuterium puffing is sometimes preferable to keep the radiation losses low, and can usually be done without significantly increasing the average plasma density, for example in NSTX [56]. Helium GPI can be used to provide a greater signal-to-background contrast ratio, especially where the background Balmer- light level is high, e.g. at high plasma density or near sources of edge recycling (e.g. in Alcator C-Mod or RFX-Mod). Helium may also produce a more localized GPI gas puff, since a deuterium puff can create high energy neutrals through molecular dissociation and charge exchange. Other gases such as methane or neon might be used as a source of neutral atoms, but these higher Z gases radiate more and tend to perturb the edge plasma. 9
10 It is highly desirable to use a single neutral atom spectral line for GPI, rather than the total visible light emission, in order to have a clear relationship between the line emission rate and the local density and temperature fluctuations (see Sec. II.F). The usual spectral lines for GPI are Balmer- at nm for deuterium and the nm or nm lines for helium, since these are the brightest visible lines. In edge fusion plasmas the Balmer- and HeI nm lines have roughly similar brightness for the same puff rate. Line intensity ratios can also be used to measure the edge density and temperature fluctuations as in the thermal helium beam diagnostic [57], and measurements have been made 2-D edge profiles (not turbulence) using this technique [58]. Ion emission lines such as from HeII, will tend to form an elongated plume along the magnetic field direction, and so would provide a less localized GPI measurement (depending on the species and plasma parameters) [59]. II.E GPI spatial resolution If the GPI gas cloud line emission is very strong compared with the background plasma emission, and if the GPI gas cloud were confined entirely within a 2-D plane perpendicular to B, then the spatial resolution of the GPI would not be limited by the local magnetic field line tilt angle or curvature. At the other extreme, without any GPI gas puff the full 3-D filamentary structure of the background plasma emission would be seen, and it would be difficult to unfold the 2-D structure perpendicular to B. In between these limits, the spatial resolution of the GPI will depend on the viewing geometry, toroidal extent of the gas cloud, and the local magnetic field line geometry. For optimum GPI spatial resolution, the GPI sightline axis should be aligned as closely as possible at the plasma magnetic field line pitch angle within the GPI cloud, as illustrated in Fig. 1(a). However, since the GPI sightline direction varies within a given field of view, and since the plasma magnetic field direction often varies from one shot to another, there is generally a small angle between the GPI sightline and the local B field direction. Focusing on tokamak geometry, if the angle between a GPI sightline and the local B field line is B, the image of a narrow field-aligned filament will be spread along the angle of the misalignment direction (either radial or poloidal) by: Δx ~ L II,cloud tan B [1] where L II,cloud is the approximate length of the GPI gas cloud along the B field line. This assumes that the filament emission is constant along B within the GPI gas cloud, that L II,cloud << R (major radius), and that the optical depth of the line emission is much longer than L II,cloud. For example, if L II,cloud ~10 cm (as might be produced from a gas nozzle located ~10 cm from the central GPI viewing chord), and the misalignment angle is B ~ 6º (as found at the edge of a typical optical system), this limiting resolution would be Δx ~ 1 cm. This spatial resolution Δx will affect the measured turbulence size scale if that scale is comparable to or larger than the turbulence correlation length in that direction. The poloidal angle of the edge B field line can sometimes be adjusted to match 10
11 the GPI sightline by varying the ratio of the plasma current to the toroidal field. In that case, there will be no significant degradation in the poloidal turbulence resolution, at least at that aligned point in the GPI image. However, the minimum radial resolution (i.e. perpendicular to the poloidal direction and to B) will depend on the toroidal field line curvature within the plane of the B field line, i.e. by the radial length Δx rad of the toroidal arc segment within the cloud: Δx rad ~ (L II,cloud ) 2 /8R [2] For example, if L II,cloud =10 cm and R=100 cm, Δx rad ~ 0.1 cm. For most cases this limiting resolution is much smaller than that of the angular misalignment effect in Eq. [1]. For example, in NSTX the distance from the GPI camera lens to the GPI gas cloud is ~70 cm, so even when the GPI optical axis is perfectly aligned with the local magnetic field at the center of the GPI image, the misalignment angle is B ~8º at a distance of 10 cm poloidally from this center, which is still within the 2-D typical imaging region (see Fig. 2). This degree of misalignment will cause a spatial smearing of ~1-2 cm for a calculated gas cloud length of L II,cloud ~ 12 cm, which is relatively small compared with the typical turbulence correlation length of ~ 5 cm in NSTX. However at the edge of even the optimally aligned images in NSTX, or in shots where the edge field lines are not well aligned with the GPI optical axis, this angle can be up to B ~20º, at which point the loss of resolution can affect the shape of the 2-D correlation function, as discussed in detail elsewhere [60,60a]. The range of misalignment also depends on the edge magnetic shear, which is relatively large in NSTX. In general, the exact geometrical resolution of a GPI system can be determined from a 3-D simulation (or measurement) of the GPI gas cloud, the B field line geometry, and the viewing geometry. Other factors which can affect the spatial resolution are the optical resolution and the camera pixel resolution; these can be combined into a single 2- D resolution function describing the total diagnostic spatial resolution as a function of the position within the GPI image. II.F Interpretation of GPI measurements Gas puff imaging measures the neutral atom line emission from a localized deuterium or helium gas puff at the edge of a magnetic fusion plasma. However, the objective of GPI is to visualize the edge plasma turbulence, which consists of plasma density and temperature fluctuations. An understanding of the relationship between the measured visible light fluctuations and the underlying plasma fluctuations is thus required to establish this connection. The intensity of the line emission from neutral atoms in a plasma can be most simply expressed as: 11
12 I = n o f(n e,t e ) [3] where n o is the local neutral atom density, n e and T e are the local electron density and temperature, and the function f is the ratio of the density of the upper level of the radiative transition to the ground state density times the rate of decay of the upper level. For example, for the deuterium Balmer- transition, n 0 is the density of the 1s ground state, n 0 = n D (1s) and [4] where A 3 2 = s -1 is the radiative decay rate (Einstein coefficient) for the transition. To determine the quantity in brackets here, one needs to establish the population distribution of the excited states. Their time evolution can be written as a balance between radiative decay, electron collisional excitation, de-excitation, and ionization. The time scales for the excited state decay and electron collisional processes are much shorter than those of neutral transport. To a good approximation, then, one can set the time derivative in the excited state rate balance equations to zero and solve the resulting set of equations for the excited state densities relative to that of the ground state; this is the collisional radiative approximation [61]. This yields the "population coefficients", such as the one in Eq. (4), as functions of T e, through the temperature dependence of the collisional rate coefficients, and n e, via its appearance in each of the rate balance equations [62 64]. The use of Eq. (3) in interpreting GPI data also assumes that changes in the plasma density and/or temperature are instantly reflected in the rate of light emission, that only the electron impact ionization causes the excitation, and that the photons produced travel unimpeded to the detector. The validity of these assumptions is discussed in Sec. V.C and V.D. Figures 6(a) and (b) show f(n e,t e )/n e for the nm deuterium line and nm helium line used most often for GPI. The former represent the output of a collisional radiative model derived from the one described in [65], with cross sections from [66] and newer cross sections for excitation from the ground state to n=3, 4, and 5 from [67,68]. As with the deuterium electron impact ionization rate, the photon emission rate increases rapidly with temperature below about 10 ev and then peaks at roughly 100 ev. The near overlap of the n e = and cm -3 curves implies that f(n e,t e ) is nearly linear in n e at those densities; however, at higher densities, collisional excitation and de-excitation compete with radiative decay in depopulating the n=3 excited state. Balmer- photons can also be generated during dissociation of D 2 and D 2 +. The effective rate for this process is shown in Fig. 6(a) and will be discussed in more detail in Sec. V.D. 12
13 The helium data were produced by the code documented in [69], which was in turn based on work by Fujimoto [70]. Again, the temperature variation is strong below 10 ev, albeit with a rate lower than that in Fig. 6(a) because of the greater energy required to excite the atom to the upper state of the transition. The presence of the second electron in the system results in a much more complex behavior at higher densities. To help determine the sensitivity of the line emission to density and temperature fluctuations at a given point in parameter space, we define: n ln f lnn e and T ln f [5] lnt e and refer to n and T as the local density and temperature exponents ; that is f n e n T e T [6] The values of these exponents computed from Fig. 6(a) and (b) are shown in Fig. 7(a) (d). At relatively low densities (n e cm -3 for D, n e cm -3 for He) the line emission is nearly proportional to density independent of temperature, i.e. n ~ 1; at higher densities collisional processes reduce the density exponents to less than one. This is demonstrated explicitly at T e = 10 ev in Fig. 7(e). The electron temperature exponents are nearly independent of density below n e cm -3, and T decreases monotonically between T e ~ 1 ev to 100 ev. Thus the response of GPI to local plasma fluctuations depends on both the electron density and temperature fluctuations, which are not normally measured on the space-time scales of the edge turbulence (otherwise GPI would not be needed). The interpretation of GPI is also complicated by the possibility that the local neutral density is itself affected by the fluctuations, e.g. due to depletion by ionization or non-local effects. These issues are discussed in further detail in Secs. V.B and V.E. III. GPI diagnostic hardware This section describes the GPI diagnostic hardware used on the devices listed in Table 2. Most of these are tokamaks or stellarators, two are reversed field pinches (RFP), one is a magnetic mirror device, and one is a simple toroidal device (TORPEX). We first discuss the generic features of the gas puff hardware in Sec. III.A, the optics in Sec. III.B, the detectors in Sec. III.C, and the calibrations in Sec. III.D. Special features for each system are noted in Sec. III.E. Table 2: GPI diagnostic systems 13
14 machine type GPI views GPI gas GPI detectors Alcator C-Mod tokamak 4 D,He Phantom, APD ASDEX tokamak 1 D PM ASDEX-U tokamak 1 D Phantom EAST tokamak 2 He Phantom Gamma 10 mirror 1 H Photron Heliotron J stellarator 1 D Photron NSTX ST 1 D,He Phantom, PM RFX-mod RFP 3 He PM TJ-II stellarator 1 H,He Photron, PSI-5 TEXTOR tokamak 1 D PSI-5 TORPEX toroidal 2 He Photron TPE-RX RFP 3 D PM III.A Gas puff The GPI gas is puffed into the plasma edge, which has a typical ambient neutral pressure of <10-6 bar, although the actual neutral density in the SOL is quite variable and difficult to measure. The GPI gas puff should be large enough to increase the local neutral density significantly (e.g. by x5-10), such that the light emission within the puff volume is bright enough to be measured on a turbulence (few µsec) timescale. The species, flow rate and duration of the gas puff is chosen to produce a good GPI signal while minimally perturbing the plasma edge or the edge turbulence. The simplest GPI gas puffer consists of a neutral gas reservoir, a fast gas valve, and a gas nozzle mounted on the wall inside the vacuum vessel. The gas in the reservoir is at room temperature and the pressure is adjustable up to ~1-2 bar. The valve is typically a piezoelectric which can open or close in 10 msec, and the nozzle can be as simple as a circular hole with ~1 mm diameter. The same gas puff hardware can be used for either deuterium molecules or helium atoms. The GPI gas puff rate will be roughly gas ~ n man v th A hole, where n man is the manifold gas density (which can be much less than the reservoir density for short pulses), v th is the atom speed (which can be higher than room temperature inside the plasma), and A hole is the nozzle hole area. To get a rough estimate of the GPI gas density, we assume the manifold has helium at 0.1 bar, i.e. n man ~ 3x10 18 atoms/cm 3 with v th ~ 10 5 cm/sec (room temperature) and A hole ~ 10-2 cm 2, in which case the gas puff rate is gas ~ 3x10 21 atoms/sec. If this gas expands freely into the chamber without heating, the average gas density would be n o ~ 5x10 13 atoms/cm 3 at ~10 cm from the hole. The actual gas influx rate and its density in the plasma will depend on the chosen manifold pressure and the temperature of the neutrals in the plasma. For example, at the relatively high peak gas puff rate of ~6.6x10 19 deuterium atoms/sec in NSTX [56], the estimated maximum neutral atom density in the GPI cloud is n o ~ 5x10 12 cm -3 (see Sec. V.D), which is ~10 times higher than the local background neutral density as calculated with DEGAS 2 [71]. 14
15 GPI gas nozzles most often consist of many small holes designed to fill the GPI optical field of view in each experiment. For example, NSTX has used a line of thirty ~1 mm diameter holes spaced 1 cm apart on a ~1 cm diameter tube aligned poloidally near the outer midplane [13,56]. TEXTOR has used a nozzle of 100 holes of 0.5 mm diameter and 15 mm length drilled into a 2 cm x 6 cm rectangular matrix [44]. Alcator C-Mod has used a 1 mm diameter capillary tube to bring the GPI gas to a four-hole nozzle near the outer midplane, and single-hole nozzles at the inner wall and outer divertor target [43]. The angular distribution of gas emitted from these nozzles depends on the gas flow regime (Knudsen number) and the shape and distribution of the holes. The smaller the angular spread of the gas along B, the better the spatial resolution of the GPI system (see Sec. II.E). Thermal gas flow through a plane hole can be characterized by a cosine to a power distribution, with an exponent of 1 most commonly used. Laboratory measurements of viscous gas flow through a capillary yielded an exponent of 5/2 [72]. The TEXTOR GPI nozzle is operated in a narrow divergence flow regime with holes of an aspect ratio 30:1, which produces a low angular divergence measured to be ~20º FWHM, i.e. much narrower than the ~120º FWHM expected for a cosine distribution [44]. The spatial uniformity of the GPI gas cloud is also important, and is discussed in Sec. V.A. The minimum GPI gas pulse duration is ~10 msec due to the valve opening and gas transit time from the valve to the nozzle, which is long compared to the ~10 µsec turbulence timescale. Many GPI systems operate with single short gas puff to maximize the signal level for a given gas influx during a plasma shot, but some systems are operated continuously at a lower reservoir pressure and lower puff rate over longer times (e.g. ~0.5 sec in TEXTOR). III.B Optics The optics in GPI systems is designed to form an image of the GPI gas cloud on a fast camera or a set of discrete light detectors. The details of the optical designs are different for each experimental device, so only the general optical issues are reviewed in this section. References to figures of the optical layouts for various specific machines are cited in Sec. III.E. The optical view of the GPI gas puff should be aligned as closely as possible with the edge magnetic field lines, which are generally parallel to the vessel wall. The first optical element in a GPI system is normally a mirror mounted just inside the vessel wall, which deflects the gas cloud image into a small telescope lens, which then transmits the image to the detector through a set of relay lenses and/or a coherent fiber bundle. The image must also be transferred across a vacuum boundary to the detector in air. The vacuum boundary can be a quartz plate in front of the lens, or a vacuum window behind the lens. At the other end of the relay lenses or image bundle are a pair of lenses to 15
16 further de-magnify the image onto a small region of the sensor. Between those lenses the image is usually collimated for transmission through an optical interference line filter. GPI optical systems are optimized for maximum light transmission, since the higher the transmission the lower the amount of gas puffing and the lower the potential perturbing effects. Typical optical elements are f/1.4 or lower, and made of quartz for resistance to radiation-induced darkening from fusion plasmas. The coherent fiber bundles are usually made from ordinary glass (e.g. Schott, Inc.), but can be replaced periodically, depending on the neutron or hard x-ray fluence. The in-vessel GPI bundles in Alcator C-Mod were specially manufactured 5 meter long 57x57 quartz coherent fiber bundle (Fiberoptic Systems, Inc.), which also have better transmission than glass. The interference filters can have up to 80% transmission at the central wavelength of interest if there are no competing impurity lines within ~10 nm FWHM. The in-vessel view of the GPI gas puff normally puts the front-end optics close to the plasma edge, so damage to the front-end mirror by the plasma can become a problem. Another practical problem is the slow coating of mirrors and lenses due to plasmainduced deposition. Most GPI front-end optics have a movable shutter to minimize coatings when the GPI is not in use. When this is not possible, the optics can be protected by a front-end tube to reduce coating from angles outside the telescope viewing angle, as in Alcator C-Mod [14]. The balance between optical access and optics damage is normally resolved by trial-and-error on each machine, since the in-vessel optics are not movable (at least so far). III.C Detectors To image edge turbulence in magnetic fusion devices the light detectors need to have a time resolution of less than ~10 µsec and preferably ~1 µsec. This can be done with either fast cameras or discrete arrays of photodiodes or photomultiplier tubes. As usual there is a trade-off between the number of channels, the sensitivity of each channel, and the cost, which determines the optimal detector approach for each application. Commercial fast cameras (e.g. from Vision Research Inc. or Photron Inc.) can presently record ~64x64 pixel images at framing rates of up to ~400,000 frames/sec, which is sufficient to make images such as those in Figs. 3 and 4. However, the pixels in these camera chips are small (~20 µm) and have a relatively low quantum efficiency (~30%), so their optical sensitivity and signal/noise performance is limited. However, these cameras are excellent for detecting the 2-D structure and motion of the turbulence in the brightest region of the GPI gas cloud, which is generally near the magnetic separatrix. Intensified cameras have been tried, but do not have significantly better signal/noise than internally cooled un-intensified fast cameras. 16
17 An alternative GPI detector is the avalanche photodiode (APD) array, whose detectors can have a larger size and higher quantum efficiency (~80%) than camera pixels. APDs have a variable internal gain. This allows some flexibility in tailoring the gain to the light level incident on a given detector, but requires that the APDs be temperature stabilized, although not to cryogenic temperatures. The internal gain process creates additional noise, lowering the effective quantum efficiency. Nonetheless these detectors have the best signal-to-noise ratio within a certain range of photon flux, ~3x photons/sec [73]. Thus in those regions of low GPI brightness this detection system has significantly better signal-to-noise ratio than the fast cameras. This is observed in C- Mod where both systems view the same gas puff, and the APD-based array is able to see regions of lower emission, in particular into the hotter denser regions inside the LCFS. The APD arrays used at Alcator C-Mod are operated at a sampling rate of 2 MHz (compared to 0.4 MHz for the camera). Commercial APD arrays (Hamamatsu Photonics) are packaged in arrays of 4x8 detectors. One of the C-Mod systems utilizes an closepacked array of 9x10 fibers in the focal plane of the optics viewing the outboard midplane region. The fibers are routed to three such APD arrays, with thin interference filters placed between the fibers and the APD arrays. The 9x10 fiber array views a ~4 cm x 4 cm area in the plasma in front of the GPI nozzle. Thus the spatial resolution of the APD-based system is considerably less than the camera, but the APDs can measure much lower gas puff signals with good signal-to-noise at higher frequencies than the camera. For example, at 0.9 cm inside the separatrix the camera and APDs have a similar frequency spectrum up to ~30 khz, but noise dominates the camera signal above this frequency (at a framing rate of 400 khz), whereas the APD can resolve the spectrum up to its noise floor at ~1 MHz. However, at 0.2 cm outside the separatrix in the same shot, where the GPI signal level is larger, the camera can resolve above its noise floor up to ~100 khz. There is also a very high cross-correlation (>0.9) between the camera and APD signals when viewing the same location outside the separatrix. A third detector is the photomultiplier tube, which has been used in TPE-RX [74], RFX-Mod [75], and NSTX [76]. Phototmultipier tubes have lower quantum efficiency (~10% at the wavelengths of interest), but can be operated with higher electron gain than APDs, and can operate at comparable frequencies. For example, the RFX-Mod system uses two 16 channel PM tubes to form three linear fans through the gas cloud covering 7 cm toroidally x 4 cm radially, and digitized at 10 MHz. The resulting 32 channel data has been tomographically inverted to reconstruct localized structures [77]. Each of these detectors is somewhat sensitive to the neutron and x-ray radiation and electromagnetic fields of magnetic fusion devices. The fast cameras appear to be relatively insensitive to these external noise sources and can operate within a few meters of outer wall of most present day plasma devices, which is required by the limited length of the coherent fiberoptics or relay lenses. The Phantom cameras operate in magnetic fields of ~0.1 T on C-Mod without magnetic shielding. APD arrays are not sensitive to magnetic fields, but will be affected by neutrons if the neutron flux is high enough. Photomultipliers are more sensitive than the cameras or APDs to both radiation and 17
18 magnetic fields, but, like APD-based systems, can be operated at longer distances from the machines using discrete quartz fibers, with detectors mounted inside magnetic and neutron/gamma shielding. An ultimate limit to GPI detection is the number of photons in each spectral line emitted prior to the ionization of a incoming neutral atom, commonly called S/XB. For example, if there were (1/15) Balmer- photons/ionization, as obtained from the collisional radiative model for NSTX conditions [78], as described in Sec. II.F, a deuterium gas puff of ~10 20 D atoms/sec would emit ~ 6x10 18 Balmer- photons/sec, of which ~6x10 14 sec -1 would enter the front lens of a typical GPI optical system (f/1.3 lens with a 25 mm focal length at 50 cm from the cloud). If a detector pixel views ~10-3 of the area of the emission cloud (to obtain ~1000 active pixels per image), it would then see ~6x10 5 photons/pixel/µsec. Assuming a photon detection efficiency of ~0.1, this flux would be large enough to obtain ~0.3% photon noise over an integration time of 2 µsec, which should be sufficient to resolve plasma light fluctuations as low as ~1%. Additional information about S/XB values for other plasmas can be obtained in [79,80]. III.D Calibrations GPI diagnostics normally do not use the absolute gas puffing rate or absolute brightness of the gas cloud to measure the edge turbulence, since the amount of gas or cloud brightness does not (or should not) affect the turbulence properties. However, the GPI gas flow is usually calibrated to compare it with standard gas puff fueling systems, and the brightness is sometimes calibrated to validate the neutral transport codes used to predict the light emission [78]. The total gas flow from a given puff can be measured without the plasma by the rise in vessel pressure with the pumping temporarily shut off, and checked by the decrease in pressure of the GPI gas reservoir at each puff. The time dependence of the gas puff can be inferred from the time dependence of brightness seen in the GPI, but has not yet been directly measured. The angular distribution of the GPI gas puff was measured in a test chamber for the TEXTOR [44], but not (to our knowledge) in situ. The absolute sensitivity and spatial dependence of the GPI light detectors can be calibrated using a standard light source with the optical filter of interest, located either in a test stand or inside the vessel. The spatial registration and optical resolution of the GPI field of view in the vessel are usually measured using a 2-D (or 3-D) test patterns attached to the gas puff nozzle during a machine opening. Figure 8 shows a comparison of the observed GPI light emission during a quiescent NSTX H-mode plasma with a simulated GPI camera image produced by the neutral transport code DEGAS 2 [78,81]. For this comparison, the gas manifold in the simulation is represented in 3-D as ten squares aligned with the pitch of the actual manifold. Electron temperature and density profiles from Thomson scattering are mapped into the GPI field of view using an EFIT magnetic equilibrium. As the D 2 molecules introduced at the simulated manifold penetrate the plasma, they undergo 18
19 ionization, dissociation and elastic scattering. The product atoms are then tracked through the plasma and interact with it via ionization and charge exchange, and the resulting 3-D GPI cloud shape is calculated, including recycling from the nearby walls. The Balmer- photons associated with these processes (Sec. II.F) are accumulated into a synthetic camera image constructed from the spatial calibration data. The resulting 2-D spatial distribution of the GPI light agrees quite well with the calculated distribution, and the absolute brightness agrees to within ~50%. This agreement represents a validation of the GPI calibrations and the DEGAS 2 code for the interpretation of GPI Balmer- light emission, but only with respect to the time-averaged light emission (i.e. not the turbulence). A similarly good level of validation of DEGAS 2 for the 2-D GPI images in helium (587.6 nm) was found for NSTX, but without an absolute calibration [63]. III.E Special features of various GPI systems This section briefly notes some special features of the GPI diagnostic systems listed in Table 1. For further details such as optical system layouts, the reader is referred to the references cited for each device (listed mainly in alphabetical order). On the Alcator C-Mod tokamak in the US, there were four different GPI sightlines, which had either Phantom cameras or APD detectors [14,15,16,43,53,54,55,60,82,83]. The GPI telescopes were mounted onto the interior vessel wall, with a vacuum break just behind the imaging lenses. The in-vessel quartz fiberoptics were enclosed in flexible stainless steel vacuum bellows and the light was brought out through windows to the detectors. One camera and one APD array viewed the same outer midplane gas puff. One APD array viewed a puff on the high field side midplane, where fluctuation levels were low compared with the low field midplane, and one camera viewed a gas puff in the region just outboard and above the lower divertor X- point. The ASDEX tokamak in Germany made the first use of a localized gas puff to make visible emission measurements of edge turbulence [10,11]. Good agreement was found between the turbulence correlation lengths and velocities as measured by the 16 channel photomultiplier detector array and the Langmuir probe fluctuation profiles in the SOL. On the newer ASDEX-Upgrade tokamak in Germany, a Phantom camera was used to measure 2-D images of the turbulence, and a synthetic diagnostic of field-aligned filament geometry used for interpretation of GPI data [45]. The GPI results were similar to those made with a Li-BES diagnostic [84]. The EAST tokamak in China has installed a dual GPI system with two views located ±50º poloidally with respect to the outer midplane, in order to evaluate the up/down symmetry of the turbulence [49,85-87]. The glass fiber bundles are shielded by molybdenum tubes of 10 mm thickness to prevent darkening due to the large hard x-ray flux during LHCD. 19
20 On the Heliotron J stellarator in Japan, the GPI gas puff is located nearby a hybrid Langmuir/magnetic probe for evaluation of cross-correlations with light fluctuations [88,89]. On the Gamma 10 mirror machine in Japan, the GPI puff emission was compared with DEGAS neutral simulation code in mirror machine geometry [90,91] On the NSTX spherical tokamak in the US, a single GPI sightline views a gas puff manifold located just above the outer midplane through a re-entrant window port [12,13,42,50,51,52,56,76,78,92]. This sightline has a wide angle field of view covering ~30 cm in the poloidal direction and ~24 cm in the radial direction. On the RFX-Mod reversed field pinch device in Italy, a single GPI puff at the outer midplane was viewed using photomultiplier arrays from three directions with a twomirror system, and interpreted using tomographic inversion [75,77,93,94,95,96,97]. The light fluctuations seen with GPI were compared with a thermal helium beam line ratio diagnostic of density and temperature fluctuations made using the same helium gas puff. On the TPE-RX field reversed pinch in Japan, the GPI system was similar to that in RFX- Mod, and there was a retractable Langmuir probe array at the same location as the GPI gas cloud for cross-comparison [101,102]. On the TEXTOR tokamak in Germany, a 100 hole GPI puff nozzle provided a low divergence gas cloud for improved spatial resolution [44,98,99]. The GPI optics used quartz relay lenses, and the detector was a 300 frame intensified PSI-5 camera. On the TJ-II stellarator in Spain, the neutral gas cloud created by recycling from the limiters was view by fast cameras, and double imaging was made with an intensified camera to detect fine-scale turbulence structure with an exposure time as low as 0.1 µsec [29,30,100]. Finally, on the TORPEX toroidal plasma device in Switzerland, an intensified tangential view was interpreted using tomographic image reconstruction, and similar fluctuations were seen in visible light emission and Langmuir probes [26,27]. IV. Cross-checks of GPI data The GPI diagnostic can relatively easily provide highly resolved space vs. time data on plasma edge turbulence in magnetic fusion devices. Before discussing some of the GPI diagnostic issues in Sec. V, this section reviews cross-checks which have been done to compare the GPI data with edge turbulence data from other diagnostics. Note that GPI data is already being used to test edge turbulence simulation codes using synthetic GPI diagnostics [3,60,103]. However, since these turbulence codes are very complex and not yet validated, they cannot be used to check the GPI data itself. There also seems to be no experimental configuration in which the GPI diagnostic can be benchmarked against known plasma fluctuations, since even the simplest magnetized plasma instabilities are nonlinear and difficult to understand quantitatively. Thus we are left with cross-checking the GPI data with other edge turbulence diagnostics, each of which each has its own limitations and difficulties in interpretation. 20
21 IV.A GPI vs. Langmuir probes Langmuir probes have been the most common diagnostic for edge plasma turbulence in magnetic fusion devices, since they are easy to build and have a high bandwidth (~ 1 MHz) and good spatial resolution (~ 0.1 cm). Fluctuations in the ion saturation current are usually interpreted as I sat ~ n e T e 1/2 ), and the effect of density and electron temperature fluctuations can sometimes be measured separately [ ]. However, there are usually only a few probes at any given location, and such probes may locally perturb the plasma (usually not well documented). Many comparisons have been done between light emission fluctuations measured without gas puffing and I sat fluctuations in magnetized plasmas, e.g. at Caltech [8], TORPEX [27], CSDX [23], TJ-K [32] and MAST [34]. These have generally shown a high cross-correlation of I sat and visible light fluctuations, even without the explicit line filtering or the localization due to GPI, presumably due to the roughly linear dependence of both diagnostics on the plasma density fluctuations. The first GPI-type measurements in the SOL of ASDEX showed similar frequency spectra and poloidal correlation lengths between Balmer- fluctuations and Langmuir probes [11]. Early GPI measurements in the SOL of Alcator C-Mod also showed that the spectra and relative fluctuation levels seen by GPI were similar to those of a Langmuir probe at the same radius [14, 16]. Early NSTX results also showed a close similarity between GPI and Langmuir probe spectra and fluctuation levels [92], and later results showed a close similarity between GPI and probe turbulence correlation lengths and velocities [107]. Since these probe and GPI measurements were not made at the same locations in these plasmas (and sometimes not in the same shots), more precise cross-checks were not possible. Somewhat more quantitative are cross-correlations measured between fluctuations in GPI and probes on the same magnetic field line, which are made using field line mapping codes along with a search for the best correlation within the 2-D GPI field of view. As illustrated in Fig. 9, on Alcator C-Mod there was a ~76% cross-correlation between GPI emission from an outer midplane view and I sat fluctuations from a reciprocating probe ~3 m away along the same B field line (with >90% cross-correlation for shorter time series), and ~81% cross-correlation between midplane GPI emission and I sat at a divertor-target probe [82]. In NSTX, cross-correlation of GPI images with I sat fluctuations were 0.8 for five fixed Langmuir probes in the SOL located ~1 m along B [108], similar to the Alcator C-Mod results. These cross-checks show that the GPI and probes are basically measuring similar plasma pressure fluctuations, although the mixture of density and temperature fluctuations measured by the each of these two diagnostics is somewhat different. Local cross-checks between GPI and probes within a turbulence correlation length are desirable but difficult due to limited diagnostic access. However, this was tried on 21
22 the TPE-RX reversed field pinch where Langmuir probes could be moved near to the GPI gas nozzle [101,102]. The cross-correlation between GPI and I sat fluctuations at about the same radius was ~55%, with a near-zero time delay between them, roughly as expected if both were measuring density fluctuations. A combined GPI and Langmiur probe was also used on the Heliotron J stellarator, where turbulent bursts of I sat fluctuations were accompanied by filamentary structures seen along the B field in GPI [88,89]. To our knowledge no local comparisons of GPI and probes have been made in a tokamak, although a high correlation was found between passive imaging of edge filaments and nearby probe signals in the Caltech [8] and MAST [34] tokamaks. IV.B GPI vs. beam emission diagnostics Another type of turbulence diagnostic is based on the light emission from injected high energy neutral particle beams, instead of the injected cold gas used in GPI. The principle is similar: the line emission from the neutral beam species depends on the local plasma parameters, especially the electron density, and can be used to measure the local electron density fluctuations. There are two main variants of this diagnostic, one using a low power (~200 W) lithium beam spectroscopy (Li-BES) such as in ASDEX-Upgrade [109], and the other using a high power (~1 MW) deuterium heating beam (BES), such as used in TFTR [110], D-IIID [111], NSTX [112], and MAST [113]. Lithium BES was used to measure density fluctuations in the SOL of the W7-AS stellarator, and it was found that all parameters of the SOL turbulence seen by the Libeam diagnostic agree with Langmuir probe and H measurements [114]. Both GPI and Li-BES were used to evaluate the properties of discrete blobs in the SOL of ASDEX- Upgrade in separate papers [45,84]. The results of the two diagnostics appear to be very similar, e.g. with radial blob widths of ~1 cm and radial blob speeds of ~0.3 km/sec; however, it is difficult to make a direct comparison since these measurements were made at different locations and on different discharges. Edge turbulence measurements using BES and GPI were directly cross-checked in NSTX [115]. This comparison was made using the same discharges and poloidally (but not toroidally) overlapping edge and SOL regions near the outer midplane. Strong crosscorrelations were observed (~70%), and high cross-coherence was seen for frequencies between 5 and 15 khz. Good agreement was also found between correlation length estimates, de-correlation times, and structure velocities in the two diagnostics. However, the relative fluctuation levels seen in GPI exceeded BES fluctuations by a factor of ~9, which was well outside the range of expected uncertainties. In addition, the BES mean intensity was found to be sensitive to the GPI neutral gas puff, and BES normalized fluctuation levels for frequencies between 1 and 10 khz were sometimes observed to increase during the GPI puff. These discrepancies have not yet been understood or resolved. 22
23 IV.C Other diagnostic cross-checks Edge turbulence is also measured in magnetic fusion plasmas by electromagnetic scattering, reflectometry, or phase contrast imaging (PCI). These methods are entirely non-perturbing since negligible EM wave power is absorbed by the plasma, but the interpretation of these diagnostics is difficult and these measurements are usually not well localized spatially. For example, the frequency spectra of an edge reflectometer at the outer midplane of NSTX was found to be very similar to a GPI channel at the same radius [92]. As noted in Sec. II.C., GPI can measure properties of edge quasi-coherent modes, in particular poloidal wavenumbers, radial localization, and (lab) frequency spectra. On C-Mod, the Quasi-coherent Mode (QCM) present in the edge of Enhanced-D H-mode plasmas is observed with diagnostics sensitive to edge density fluctuations, i.e. GPI, a reciprocating Langmuir probe, PCI, and reflectometry [48]. All observe the same peak frequency for the mode. GPI, the probe, and PCI observe a poloidal wavenumber, k pol, that is consistent with a field-aligned mode whose k pol, at the midplane of ~ 1.5 cm -1. The reciprocating probe and GPI measure the radial location and width of the mode. The measured widths are the same (within radial resolution) [106], but the absolute radial location of the mode differs by ~5 mm [106,116]. The absolute location determination depends on the EFIT equilibrium reconstruction to map the measurements to a common radial grid, but the difference is somewhat outside of the estimated EFIT and registration uncertainties. The reasons for the differences are thus still under investigation [117]. Edge electron density and temperature fluctuations can also be measured using a thermal helium beam (THB) diagnostic, which is similar to GPI but measures the intensity ratios of three neutral helium lines. The THB in RFX-Mod is located near to the GPI diagnostic [57,97]. A conditional sampling study of positive density events n e (i.e. blobs) within a slowly rotating helical mode in this RFP showed the local T e perturbation to be inversely correlated with n e, such that T e /T e (-0.3 n e /n e ) for radii r/a ~ This is apparently different than the relationship between T e and n e in tokamak SOL, where T e and n e are positively correlated [ ]. This relationship is important for the interpretation of GPI, as discussed further in Sec. V.B. A cross-correlation coefficient up to ~80% was found between GPI fluctuations at the outer midplane and LiI nm line emission fluctuations measured at the surface of the divertor target plate in NSTX [39]. This high cross-correlation was explained by magnetic field line mapping, in which a blob at the outer midplane SOL was mapped along B to a helical spiral which covers a large toroidal angle at the divertor plate. Similar high correlations between GPI and divertor region turbulence were found using CIII and Balmer- light in the SOL in NSTX-U [40]. The result again suggests that GPI is responding to local density fluctuations, which cause similar line emission fluctuations in all species. 23
24 V. GPI interpretation issues This section discusses some issues which can affect the interpretation of GPI measurements in magnetic fusion devices. These are to some extent open questions and will not be completely resolved here, but additional calculations and/or experiments are suggested. V.A Uniformity of the gas cloud The GPI gas puff flows typically from a gas reservoir at ~1 bar through a nozzle of ~1 mm diameter into a vacuum chamber at <10-6 bar. Is the resulting neutral gas density highly uniform at the GPI measurement location, or does some gas flow instability cause local fluctuations in the neutral cloud density which could be misinterpreted as plasma fluctuations? Note that only the time-dependent nonuniformities will affect the GPI analysis, since the GPI data is usually normalized by the time-averaged cloud emission to remove the expected systematic spatial cloud nonuniformities. The most detailed experimental study of the neutral gas cloud in GPI was done for the TEXTOR system, in which angular distribution of deuterium gas was found to be smoothly varying at a distance of 20 cm from the nozzle exit using a quadrupole mass analyzer [44]. The gas flow regime had an estimated Knudsen number Kn~0.6, i.e. nearly collisionless flow, but possible time-dependent non-uniformity was not discussed. More extensive gas cloud measurements have been made for high-z noble gas targets which are used for high intensity laser-plasma interaction experiments [ ]. Although these gas targets were uniform far from the nozzle tips (as desired for those experiments), some evidence for small-scale vortex motion very near the nozzle tips was observed, although the time dependence was not measured [118]. In rare instances, some vortex or arc-like structure was seen in the GPI light emission very near a single gas nozzle tip in early Alcator C-Mod data. In GPI systems, the neutral gas cloud (without any plasma present) will most likely be spatially uniform in regions where the neutral-neutral mean collisional free path L o of the gas atoms or molecules is larger than the size of the structures to be measured, independent of the gas source. Assuming L o ~ 1/(σn o ), where σ~7x10-16 cm 2 is the hardsphere collisional cross for helium or deuterium molecules and n o is the local gas density, the GPI cloud should therefore be uniform on the scale of L o >100 cm at n o ~10 13 cm -3, which is the maximum estimated gas density in a typical GPI cloud (Sec. V.D). Thus cloud non-uniformities are unlikely to affect the interpretation of cm-scale structures in GPI, at least far from the nozzle tips. Substantial indirect evidence also suggests the absence of GPI cloud nonuniformity effects on the measured turbulence; for example, sudden quiescence in the images at H-mode transitions (e.g. Fig. 2), the high cross-correlation between GPI and remote probe measurements (Sec. IV.A), the outward movement of blobs in the SOL [46], and the independence of GPI results on the gas puffing rate [56]. Nevertheless, it 24
25 would be interesting to measure directly the gas cloud uniformity on the space and time scales of edge turbulence without plasma, as done for gas puff laser targets [118], and also to calculate the expected gas cloud uniformity using a realistic fluid/molecular dynamics simulation code. V.B Relationship to density and temperature fluctuations As discussed in Sec. II.F, the visible line emission fluctuations I measured by GPI depends on both the electron density and temperature fluctuations, so that without an independent knowledge of the relationship of n e to T e it is not possible to infer either of them directly from I. However, if there is a high cross-correlation between n e and T e, then the cross-correlation properties of I should be nearly the same as those of n e. This was shown by numerical examples in which the autocorrelation time of I was nearly the same as that of ( I) γ for -2 < γ < 4 [92]. In a more general imaging context, the independence of cross-correlations on γ is why the apparent size and motion of objects is not greatly affected by nonlinear distortions in the contrast setting of video displays, or by the nonlinear response of the eye. However, the relative fluctuation levels I/I seen in GPI will depend on the both n e /n e and T e /T e (as it does also with Langmuir probes), so n e /n e cannot be inferred from I/I without knowledge of the emission exponents (see Sec II.F), even if n e and T e are well correlated. For example, the increased sensitivity of HeI emission to T e at very low T e (see Fig. 6) implies that I fluctuations can be significantly affected by relatively small T e [121]. There may also be regimes where correlated fluctuations of density and temperature may be "invisible" due to their canceling sensitivities [122]. If n e and T e are uncorrelated, the correlation properties of I will be a weighted mixture of both, and may be representative of neither. Despite these limitations, the GPI results have been directly compared with turbulence theory and simulation using a synthetic diagnostic code which calculates the expected GPI light emission from the n e and T e dependences shown in Fig. 6. In the turbulence simulations done so far it has generally been found that T e and n e are well correlated, since both are dominated by local ExB drifts, so that the turbulence properties calculated using the synthetic diagnostic for I were similar to those of n e [3,60,103,123]. In these papers there has been fairly good agreement (~factor-of-two) between the synthetic GPI diagnostic results based on the turbulence simulations and the actual GPI measurements. However, it is always desirable to cross-check GPI measurements with diagnostics which measure the density or temperature fluctuations, e.g. probes in the SOL. V.C GPI line emission processes 25
26 As described in Sec. II.F, the usual interpretation of the GPI diagnostic assumes that the measured line emission from the gas cloud does not contain significant contributions from molecular processes or impurities, instantaneously responds to changes in the plasma density and/or temperature, and is optically thin, i.e., that one can neglect absorption of light by the cloud itself or by intervening neutral atoms. Dissociation of deuterium molecules and their ions does result in excited products, some in the n=3 state, which can then radiatively decay to produce Balmer- photons. The simplest means of accounting for them is as additional, independent contributions to the total light emission that scale linearly with the D 2 and D 2 + density [17,78]. By assuming that the molecular ions dissociate instantly upon D 2 ionization, the D 2 + density can be expressed as the ratio of its formation to destruction rates times the D 2 density. The total photon emission rate per molecule, the Molecular Contributions curve in Fig. 6(a), can then be obtained from the rates in the literature [124]. The molecular density in the vicinity of the emission cloud can be independently determined through Fulcher band spectroscopy [ ]. Consistent molecular and atom density profiles can be obtained via neutral transport simulations of GPI experiments, such as those described of Alcator C-Mod [17] and NSTX [78]. These works determined the fraction of Balmer- light coming from molecular processes using the rates underlying the Molecular Contributions curve in Fig. 6(a) and found it increasing from >10% at the small R edge of the emission cloud, to ~30% at the emission peak, and to >50% at the large R edge of the cloud. Although not large enough to invalidate the use of Eq. [3] for the qualitative interpretation of Balmer- GPI data, these contributions must be accounted for in quantitative applications and in model validation tests. However, the rates for the relevant processes are not well established; e.g., different sets of data are used in [128,129]. Moreover, Fantz et al. [130] and D. Coster [131] concluded that D 2 and D 2 +, along with their vibrationally excited states, should be incorporated into a comprehensive collisional radiative model together with D and D +, and such models and the issues associated with their construction have been described [132,133]. Janev et al. have reviewed the current state of the required data and conclude that although much of these data are available, more is needed [134]. The time response of the GPI emission can be broken down into three components: 1) transport time scales for the emitting atoms, 2) radiative decay time of the excited state, and 3) time scale for the atomic system to reach equilibrium. The distance traveled by the emitting species in, say, 1 µs ranges from 0.1 cm for a thermal helium atom or deuterium molecule to 5 cm for a 30 ev deuterium atom. However, the more relevant time scale is that for radiative decay. For both the deuterium Balmer- and He nm lines, the radiative decay times are ~0.01 µs, effectively instantaneous. Over that interval, even the 30 ev atom moves only 0.1 cm. At electron densities sufficiently low for the coronal equilibrium approximation to be valid (n e < cm -3 so that f n e ), the time scale for the excited states to reach equilibrium is set by that of radiative decay [135]. 26
27 The situation is more complex at the higher densities more typically encountered in GPI applications. A direct investigation of this question was undertaken in [63] where the accuracy of the time response of Eq. [3] for helium was assessed. More specifically, the presence of the 2 1 S and 2 3 S metastable states points to a possible need for a more complex collisional radiative model in which these states are treated explicitly [70]. Application of the eigenvalue analysis developed in [132] to helium suggests that the simpler model (Eq. [3]) is capable of reproducing sub-microsecond time scales for plasma conditions typical of the center of the emission cloud. In a more specific numerical test with plasma parameters evolving on a 10 microsecond time scale, typical of turbulence auto-correlation times, the light emission from the two collisional radiative models could not be distinguished from that obtained by integrating the full set of atomic state equations. Ma et al. looked at the response of the helium system over a wide range of frequencies and found that the simple CR model is adequate at MHz and slower frequencies [136]. More complex behavior was found at higher frequencies. The temporal characteristics of the hydrogen system were analyzed in [132]. In the absence of molecules, the response time scale for hydrogen is again expected to be ~0.01 µs, much shorter than turbulence time scales. The addition of molecules undoubtedly introduces longer time scales, although we not aware of a quantitative characterization beyond that performed by [132]. In that work, he showed the atom density was evolving on a 10 µs time scale following the introduction of ground state molecules into a cm -3, 7 ev plasma, implying that the emitted light may be varying on turbulence time scales. During normal operation of magnetic fusion devices there are no significant contaminating lines from other species within the spectral line width of the GPI neutral Balmer- or helium 587 nm lines. There is a CII line (657.8 nm) within 2 nm of Balmer-. However, the emission from the GPI puff should overwhelm the intrinsic line emission from the edge plasma. V.D GPI optical thickness This section describes in some detail the issues concerning optical self-absorption of the spectral lines of deuterium and helium in plasmas. The conclusion is that the visible lines used for GPI are normally optical thin in magnetic fusion edge plasmas, so self-absorption is not a problem for the interpretation of GPI in present experiments. The rate at which photons are resonantly absorbed is proportional to the density of atoms in the lower level of that atomic transition. Consequently, lines starting from the ground state are the first to become opaque as the gas density is increased. The effects of the trapping of hydrogen Lyman series lines in recombining divertor and MARFE plasmas have been investigated by several groups, e.g., [ ]. For helium, similar work has been done on linear devices [ ] and tokamaks [64,149]. 27
28 To obtain a rough estimate of the importance of radiation trapping for GPI, one can evaluate the line center absorption coefficient for the Doppler broadened j k transition [e.g. 140] 0,, [7] where f jk is its absorption oscillator strength, jk is its wavelength, N j is the density of state j, T j is its temperature, and is the mass of the emitting atom relative to that of a proton. We note first that the lines used (Balmer- and 587 nm) are optically thin because the density appearing in Eq. [7] is that of an excited state, much smaller than the ground state density. However, it is still important to check the opacity of the primary transition to the ground state (Lyman- and the 1 1 S-2 1 P line (58.4 nm) in He). For DEGAS 2 simulations of NSTX deuterium GPI, the peak atom density in the vicinity of the emission cloud at the relatively high peak puff rate of ~6.6x10 21 D/sec is estimated to be 5x10 12 cm -3 and the atom temperature ~5 ev [56,78]. For the Lyman- line, f 12 = , 12 = nm, giving 0 = 0.17 cm -1. The thickness of the gas cloud in the direction of the detector is L ~15 cm, giving an optical depth of 0 L = 2.6. While this is > 1, our evaluation uses the peak density, both in time and space. Moreover, the much smaller radial thickness of the cloud, ~3 cm, is a relevant consideration. Consequently, radiation trapping is likely inconsequential in this application. For the same gas puff rate, the effects for helium can be much greater for two reasons. First, the helium densities are typically about an order of magnitude larger than those of deuterium, because the latter atoms are products of dissociation and so have higher energy and longer mean free paths in the scrape-off layer. Second, the helium temperatures are much lower due to the lower source energy (~0.03 ev for He vs. ~3 ev for D) and the relative inefficiency of He-D + elastic scattering compared with resonant charge exchange. To make a quantitative comparison with deuterium, we again examine DEGAS 2 simulations of NSTX GPI and find a helium density of 6x10 13 cm -3 at the emission cloud assuming a peak puff rate equal to that of D 2 and a temperature of 0.1 ev. For the 1 1 S-2 1 P He transition (not normally used in GPI), f 12 = 0.276, 12 = 58.4 nm, yielding 0 = 6.61 cm -1. Even with the radial width of 3 cm, one gets an optical depth 0 L = 19.8 >> 1, implying that absorption of this XUV line in this cloud is significant. The actual helium puff rate used in GPI experiments such as Alcator C-Mod [83], NSTX [13] and EAST [85] has typically been ~0.8-6x10 20 atoms/sec, i.e. at least an order of magnitude lower than the NSTX D 2 puff rate assumed above, which would seem to imply a helium XUV line opacity closer to unity. However, making a conclusive determination requires accounting for the details of the GPI system as well as the plasma parameters. DEGAS 2 simulations of calibrated He puffs of ~1x10 20 atoms/sec into C- Mod plasmas yield peak atom densities of ~6x10 13 cm -3 at the nozzle side of the GPI field of view; the He density at the LCFS is smaller by an order of magnitude. Thus, even with the lower puff rate, there may be trapping of the 58.4 nm resonance line close to the nozzle in the C-Mod case. To understand the apparent discrepancy, one needs to note 28
29 first that the gas source in C-Mod is more compact than in NSTX (3 cm vs. 30 cm) and second that the emission volume is much closer to the source (2 3 cm vs cm). In contrast, the helium atom density in the EAST GPI has been estimated to be n o ~10 12 cm -3, too small for trapping of the 58.4 nm resonance line to be significant. Modeling an optically thick system requires incorporating absorption into the collisional radiative model. The simplest approach is via escape factors [e.g. 129,145], although potentially critical geometry and line shape details may be missed. More sophisticated approaches employ direct Monte Carlo photon transport [142] or a nonlocal thermodynamic equilibrium model with line radiation interactions [150,151]. The net effect of the trapping of ground state transition lines is an increase in the population fractions for all of the excited states [f(n e,t e ) in Eq. (3)] and of the effective ionization rate of the system. More importantly, photon absorption renders the collisional radiative calculation (which was used to evaluate the emission exponents in Sec II.C) non-local, vastly complicating the quantitative interpretation of the light emission. The estimation of photon absorption rates for He puffing can also be obtained combining the measurements of 4-5 emission lines and collisional radiative model [152]; this method does not require trapping radius and neutral temperature. In summary, these estimates show that the GPI gas cloud is optically thin for the visible deuterium and helium lines used in the present experiments (with the possible exception being the region just in front of the nozzle). In more general situations, e.g. for XUV line emission, the simplest means of ensuring that a GPI system is optically thin is to use a sufficiently small gas puff rate and to favor deuterium over helium. V.E Shadowing of neutral density by turbulence The usual interpretation of GPI is that the local neutral density of the GPI species is only slowly varying in space and time, and its density is determined only by the gas puff input and by ionization and charge exchange in the plasma. This is the model that produced good agreement with the time-averaged 2-D profile of GPI light emission in Fig. 8. However, localized ne or Te fluctuations within the gas cloud might also modify the instantaneous local density of GPI neutrals via ionization and the other neutral-plasma interaction channels. This effect was previously discussed and simulated as shadowing in the context of deuterium GPI in Alcator C-Mod, using the DEGAS 2 Monte Carlo neutral code and an ad hoc time-independent electron density and temperature perturbations [17]. This shadowing effect in GPI is similar to the edge induced beam noise evaluated for the BES diagnostic [153]. Alternatively, we can imagine these atomic physics processes as transferring some of the structure of the plasma turbulence to the neutral density. The neutral density, and thus the light intensity at those radii will depend on the plasma parameters that have been seen by those molecules and atoms en route from the gas nozzle. In GPI, this effect is most likely reduced with respect to the BES diagnostic by those factors which tend to isotropize the effects of turbulence on the GPI neutrals; namely, the random initial 29
30 gas motion, charge exchange and molecular dissociation (in deuterium), and neutral atom heating (in helium). A result from the DEGAS 2 simulation of NSTX GPI is shown in Fig. 10, taken from Ref. [17], where in (a) the model includes the shadowing effect, and in (b) does not; the result is that the spatial structure of the emission profile in (a) is smeared out relative to the idealized result shown in (b) and relative to that of the perturbed density. This was also recently revisited using a SOL turbulence simulation code with a mono-energetic, one-directional neutral source model in which the GPI simulation of radial fingers in the turbulence model were significantly affected by the shadowing effect in the strong interaction regime, in which the neutral mean free path was smaller than the radial size of the turbulence [154]. The influence of turbulence and blobs on the neutral particle profile has also recently been analyzed in [155-57]. It is difficult to assess the GPI shadowing effect for specific experimental cases without a realistic edge turbulence model coupled to a 3-D Monte Carlo neutral model such as DEGAS 2 or EIRENE. It may also be necessary to include time-dependent effects, since the neutral speed can be near the turbulence propagation speed. Until these simulations are done, the quantitative effects of shadowing on specific GPI diagnostic results are not clear. As far as we know shadowing effects in GPI have not been identified experimentally. However, they might be found as radial anti-correlations in turbulence cross-correlation functions, although this could also be caused by correlation properties of the edge turbulence itself. V.F Gas puff perturbation effects At very high levels of gas puffing there will at some point be a significant perturbation of the edge plasma, either in electron density or temperature. Therefore the GPI gas puff level is normally chosen to be as small as possible consistent with good GPI signal levels. This GPI puff level is normally much lower than the puff level used for pulsed gas fueling of these devices. The gas puff of GPI can also cause perturbations which may be visible in other diagnostics; for example, in BES (see Sec. IV.B) and CHERS in NSTX, if these sightlines are coincidentally near to the GPI neutral cloud. A recent study of the effect of a deuterium GPI puff on the NSTX plasma found no significant perturbation of the measurable plasma edge parameters or edge turbulence (as measured by GPI itself) up to the time of the peak GPI deuterium influx rate of ~6.6x10 21 atoms/sec at ~20 msec after the start of the puff [56]. After this time the GPI gas continued to enter the plasma over ~60 msec, and eventually the edge density and temperature (measured by Thomson scattering) were sometimes perturbed by the GPI puff, depending on the type of plasma. However, no systematic changes in the edge turbulence correlation lengths, correlation times, relative fluctuation levels, or turbulence poloidal velocities as measured by GPI occurred between the very start of the puff at 20 msec before its peak to ~60 msec after the peak. This suggests that the GPI neutrals do not significantly change the flow damping, at least in NSTX. On the TEXTOR tokamak 30
31 there was no significant perturbation in the plasma or edge turbulence at their deuterium GPI puff rate of up to atoms/sec for ~0.5 sec [44]. On the other hand, some small tokamaks such as ADITYA have reported changes in the edge turbulence with gas puffs of ~2x10 21 atoms/sec correlated with decreases in the edge electron temperature due to radiative cooling [158,159]. On other devices such as Alcator C-Mod when operating at low densities 0.8x10 20 m -3 or EAST [85], the normal helium GPI puff of ~10 20 atoms/sec for ~0.2 sec caused a significant ( 20%) rise in plasma electron density, probably due to the recycling of helium. A similar or larger rise in density is caused when a deuterium puff is used for GPI in C-Mod [60]. However, as with NSTX, these density rises did not appear to perturb the edge turbulence significantly. The perturbing effects of the GPI gas puff will depend on the size and density of the device, on the edge plasma transport (which determines the response of the edge to a given particle source), and on the sensitivity of the edge turbulence to the local edge parameters, which tends to be weak [e.g. 45,160,161]. Thus it is difficult to characterize the perturbing effects of the GPI puff in general terms. There may also be different perturbing effects within the puff cloud itself and remotely on the same field line, although fast parallel electron motion tends to strongly correlate the turbulence along B. Specific cross-checks of GPI results with other diagnostics should be made for each device, as described in Sec. IV, and the puff strength should be varied to look for systematic changes in the turbulence vs. puffing rate. The perturbing effects of the gas puff are also difficult to predict theoretically since they depend of the physics of the edge turbulence, which is not well understood. For example, the effects of neutral atoms on the edge stability and rotation has been discussed for many years [e.g. 162,163], but clear experimental confirmation of these theories has not yet been obtained. The effects of gas puffing on other tokamak edge physics such as ELMs, RF wave heating, and divertor operation can also be interesting and important. Therefore further theoretical modeling and experimental validation on the effect of a gas puff on the edge turbulence and transport is certainly appropriate and is ongoing [e.g. 163,164]. V.G Plasma rotation and radial transport from GPI GPI measures the excitation of neutrals by electrons, so cannot directly measure the velocity of plasma ions. However, if the fluctuations in electron density and/or temperature rotate along with the ion fluid motion (e.g. due to ExB drifts), then these fluctuations will appear to move in this direction in GPI. To the extent that fluid rotation dominates this apparent turbulence motion, the GPI can measure this rotation velocity, similarly to BES and Doppler reflectometry diagnostics (which also measure the motion of electron fluctuations). This rotation velocity is superimposed on whatever velocity the turbulent fluctuations have in the fluid rest frame, e.g. due to diamagnetic drift motion. 31
32 The turbulence poloidal velocity in GPI has been inferred from time-dependent cross-correlations, pattern matching, optical flow, and Fourier methods [ ]. Poloidal rotation is observed in GPI in either in the electron or ion diamagnetic direction, as discussed in Sec. II.C. Although there are several difficulties and subtleties in this velocimetry analysis, the observed velocities are near the expected poloidal E rad xb and/or diamagnetic drift speeds of V pol 10 km/sec, i.e. far below the ion sound speed. Fine structure in the GPI poloidal rotation in the SOL of Alcator C-Mod has also been associated with radial electric fields driven by ICRF antennas [169]. Toroidal rotation of plasma ions is also common in tokamaks and stellarators due to toroidally asymmetric neutral beam injection or intrinsic rotation (without any external momentum source). However, in most GPI systems it is not possible to distinguish between the effects of toroidal and poloidal fluid rotation, since toroidal rotation of a helical structure will appear as a poloidal rotation when viewed parallel to the local B. Apparent toroidal rotation of edge turbulence has been observed in the MAST tokamak using a passive filament imaging in the toroidal vs. poloidal plane, but it was not possible to distinguish between toroidal and poloidal motion [34]. In NSTX there was a surprising invariance to NBI power of the poloidal rotation in GPI, suggesting that toroidal rotation at the plasma edge was not dominating the turbulence motion seen in GPI [161]. Parallel rotation (along the magnetic field direction) should not be visible at all in GPI if the turbulence is constant along a field line (i.e. k II ~ 0), and if the GPI view is aligned along B. For example, if k II ~1/qR ~ 10-2 cm -1 for drift-type waves inside the separatrix, at parallel rotation speeds of V II 10 km/sec the GPI would see the parallel structure at f=k II V II /2π 1.5 khz, which is at the low end of the normal turbulent frequency spectrum. No clear indication of parallel rotation in GPI data has yet been observed. Many GPI results have shown radially outward turbulence or blob motion, which is tempting to interpret as radial transport. However, the radial transport due to turbulence actually depends on the local cross-correlations of the density, temperature, and radial fluid velocity fluctuations, and none of which can be directly measured by GPI. Therefore it is difficult to make direct inferences about turbulent transport using GPI results. However, progress in understanding edge transport can be made by comparing GPI results with synthetic diagnostics from theoretical turbulence simulations, which can then be validated to help understand radial transport. VI. Discussion This paper reviewed gas puff imaging (GPI) diagnostics of edge plasma turbulence in magnetic fusion research, with a focus on the instrumentation, diagnostic cross-checks, and interpretation issues. This section contains a brief summary of this 32
33 review, along with potential improvements to this diagnostic and suggested directions for further research. VI.A Summary As discussed in Sec. I, the main motivation for GPI is to obtain high space vs. time resolution of the turbulence in the edge of magnetic fusion devices, where the temperature is T e ~ ev. Passive optical imaging of visible light fluctuations can provide some information on edge fluctuations, but is limited in toroidal devices by the line-of-sight integration over natural emission sources. Thus 2-D imaging of turbulence is more easily done using a controlled neutral gas puff in the GPI configuration. Sec. II gave an overview of GPI, including the basic geometry and several examples of GPI images. A list of edge plasma measurements which have been made using GPI was presented in Table 1. The choices for GPI gas species and spectral line were described, along with limits of GPI spatial resolution. The theoretical dependence of the GPI light emission on the electron density and temperature and its sensitivity to fluctuations was discussed and shown in Figs. 6 and 7. The GPI gas puff hardware, optics, and detectors were described in Sec. III. The GPI diagnostic is relatively simple and flexible, and has been used in several types of magnetic fusion devices, as listed in Table 2. The imaging can be done with commercial high speed cameras, or with arrays of avalanche photodiodes or photomultiplier tubes. The spatial and optical calibration of GPI systems is straightforward. Section IV described various cross-checks of GPI results with other edge turbulence diagnostics. Similar turbulence properties were found with GPI and Langmuir probes on many devices, and high cross-correlation coefficients of ~0.8 were found between GPI and Langmuir probes located on the same B field line. There was also a close similarity between GPI results and other optical diagnostics of edge turbulence. The main difficulties in GPI concern the interpretation of the results in terms of the local plasma density and/or electron temperature fluctuations. All known issues concerning the interpretation of GPI measurements were discussed in Sec. V, including the uniformity of the gas cloud, the response to electron temperature and density fluctuations, optical line emission and absorption, shadowing of the neutral density by turbulence, gas puff perturbation effects, and rotation and transport effects in GPI. The most subtle issues in GPI interpretation concern the possible effects of the gas cloud on the edge turbulence, and of the edge turbulence on the GPI gas cloud. These effects have not yet been identified in existing GPI measurements, and cannot yet be realistically modeled or predicted theoretically. In general, the GPI diagnostic can provide excellent space and time resolution of edge turbulence in magnetic fusion plasmas, but only within limitations set by the hardware and uncertainties in the interpretation of the data. Therefore the results should be cross-checked where possible with other edge turbulence diagnostics as discussed in 33
34 Sec. IV, and should be evaluated for each device with respect to the issues discussed in Sec. V. VI.B Potential improvements Some potential improvements to resolve specific diagnostic and interpretation issues were already mentioned in Sec. V. In this section we summarize and extend this list of potential improvements to GPI hardware and data analysis. The spatial resolution of most GPI systems could be improved by using a collimated gas injector to reduce the angular spread of the gas along B. The parallel extent of the GPI cloud could be measured using a separate camera viewing the cloud perpendicular to B. Off-line measurements of the density distribution in the gas cloud could verify its uniformity on the space and time scales of the turbulence. The GPI gas puff could contain a mixture of deuterium and helium to allow simultaneous 2-D imaging in several spectral lines to help distinguish the effects of electron density and temperature fluctuations. Multiple GPI views at several points along the same B field line might be used to measure the parallel structure of edge turbulence, e.g. to look for ballooning effects at the outer midplane or possible blob variations along B. Remote optical control of viewing angle and zoom in GPI optics would allow searches for smaller-scale (higher-k) structure in various poloidal and radial regions. Simultaneous views of the GPI gas cloud parallel and perpendicular to B should allow measurements of the pitch angle of the magnetic field lines as a function of radius by tracking individual filaments in both views, assuming the filaments lie along B. Imaging ion lines from impurity gas puffs such as methane or neon could be tried, even though ion filaments will extend along the B field line. It would be interesting to have an in-situ calibration the GPI response to electron density and temperature fluctuations using well-understood plasma waves or other diagnostics on the same B field line. Perhaps the radial oscillations due to low frequency MHD modes (or from externally imposed plasma jogs) can be used to calibrate GPI response, assuming the edge profiles shift rigidly with these motions. Other diagnostics such as correlation ECE emission, microwave reflectometry, or high resolution Thomson scattering could supplement the cross-checks of edge turbulence discussed in Sec. IV, although these diagnostics are generally difficult in the plasma edge and SOL. Improved modeling of the GPI diagnostic could be done using coupled 3-D neutral and magnetic field codes to calculate the expected 2-D spatial resolution over the entire image. Simulation of the shadowing effects of turbulence on the neutral cloud could be extended beyond the results discussed in Sec. V.E using a variety of assumed perturbations and background plasma conditions, or input from turbulence simulations. The effects of the neutral gas cloud on plasma parameters could be better calculated using edge transport models such as UEDGE even without specific turbulence simulations. 34
35 The most important and most challenging direction for GPI is to validate and/or improve modeling of edge plasma turbulence in order to predict the performance of fusion devices. This can be done using improved synthetic diagnostics within these codes, allowing direct comparisons with GPI data. It is also important to continue to cross-check GPI results with other edge turbulence diagnostics such as BES, reflectometry and probes, each of which has its own strengths and weaknesses. Supplementary Material See supplementary material for tables of the data shown in Figs. 6 and 7. Acknowledgments: We thank for discussions and support for this review J.M. Muñoz Burgos, W. Davis, A. Diallo, R. Hawryluk, F. Scotti, T. Stoltzfus-Dueck, B. Stratton, G. Wurden, and K.M. Young. We thank D. Pugmire, C.S. Chang, and S. Ku for the XGC-1 output used in Fig. 1(b). We also thank for their expert and helpful comments on this manuscript: M. Agostini, P. Scarin, I. Cziegler, I. Shesterikov, G. Fuchert, O. Grulke, L.M. Shao, and N. Nishino. We thank the NSTX and Alcator C-Mod teams for their long-term support of GPI diagnostic development on these machines. Supported by the U.S. Department of Energy, Office of Science, Office of Fusion Energy Sciences, using User Facility Alcator C-Mod, under Award Number DE-FC02-99ER54512-CMOD, and User Facility NSTX-U under US DOE Contracts DE-AC02-09CH
36 References [1] P.C. Liewer, Nucl. Fusion 25, 543 (1985) [2] S.J. Zweben, J.A. Boedo, O. Grulke, C. Hidalgo, B. LaBombard, R.J. Maqueda, P. Scarin and J.L. Terry, Plasma Phys. Control Fusion 49, S1 (2007) [3] F.D. Halpern, J.L. Terry, S.J. Zweben, B. LaBombard, M. Podesta and P. Ricci, Plasma Phys. Control. Fusion 57, (2015) [4] Methods of Experimental Physics Vol. 9A, Ed. by H.R. Griem and R.H. Lovberg, Academic Press (1970), Ch. 10 [5] D.H.J. Goodall, J. Nucl. Mat. 111 & 112, 11 (1982) [6] H. Niedermeyer, private communication; this movie and GPI movies can be found at [7] C.M. Surko and R.E. Slusher, Science 221, 817 (1983) [8] S.J. Zweben, J. McChesney, R.W. Gould, Nucl. Fusion 23, 825 (1983) [9] S.J. Zweben and S.S. Medley, Phys. Fluids B1, 2058 (1989) [10] M. Endler, L. Giannone, K. McCormick, H. Niedermeyer, A. Rudyj, G. Theimer, N. Tsois, S. Zoletnik, and W7-AS Team, Physica Scripta 51, 610 (1995) [11] M. Endler, H. Hiedermeyer, L. Giannone, E. Holzhauer, A. Rudyj, G. Theimer, N. Tsois, and the ASDEX Team, Nucl. Fusion 35, 1307 (1995) [12] R.J. Maqueda, G.A. Wurden, S.J. Zweben, L. Roquemore, H. Kugel, D. Johnson, S. Kaye, S. Sabbagh, R. Maingi, Rev. Sci. Instrum. 72, 931 (2001) [13] R.J. Maqueda, G.A. Wurden, D.P. Stotler, S.J. Zweben, B. LaBombard, J.L. Terry, J.L. Lowrance, V.J. Mastrocola, G.F. Renda, D.A. D Ippolito, J.R. Myra, N. Nishino, Rev. Sci. Instrum. 74, 2020 (2003) [14] S.J. Zweben, J.L. Terry, B. LaBombard, M. Greenwald, M. Muterspaugh, C.S. Pitcher, K. Hallatschek, R.J. Maqueda, B. Rogers J.L. Lowrance, V.J. Mastrocola, and G. F. Renda, Phys. Plasmas 9, 1981 (2002); [15] J.L. Terry, R. Maqueda, C.S. Pitcher, S.J. Zweben, B. LaBombard, E.S. Marmar, A. Yu. Pigarov, and G. Wurden, J. Nucl. Mater , 757 (2001) [16] J.L. Terry, S.J. Zweben, K. Hallatschek, B. LaBombard, R.J. Maqueda, B. Bai, C.J. Boswell, M. Greenwald, D. Kopon, W.M. Nevins, C.S. Pitcher, B.N. Rogers, D.P. Stotler, 36
37 and X.Q. Xu, Phys. Plasmas 10, 1739 (2003) [17] D.P. Stotler, B. LaBombard, J.L. Terry, S.J. Zweben, J. Nucl. Mater , 1066 (2003) [18] C.C. Chaston, C. Salem, J.W. Bonnell, C.W. Carlson, R. E. Ergun, R. J. Strangeway, and J. P. McFadden, Phys. Rev. Lett. 100, (2008) [19] [20] G.Y. Antar, J.H. Yu, and G. Tynan, Phys, Plasmas 14, (2007) [21] S.H. Muller, C. Theiler, A. Fasoli, I. Furno, B. Labit, G.R. Tynan, M. Xu, Z. Yan and J.H. Yu, Plasma Phys. Control. Fusion 51, (2009) [22] A.D. Light, S. C. Thakur, C. Brandt, Y. Sechrest, G. R. Tynan, and T. Munsat, Phys. Plasmas 20, (2013) [23] S.C. Thakur, C. Brandt, A. Light, L. Cui, J. J. Gosselin, and G. R. Tynan, Rev. Sci. Instrum. 85, 11E813 (2014) [24] C. Brandt, O. Grulke, T. Klinger, J. Negrete Jr., G. Bousselin, F. Brochard, G. Bonhomme, and S. Oldenburger, Phys. Rev. E 84, (2011) [25] T. Carter, private communication 2016 [26] D. Iraji, I. Furno, A. Fasoli, and C. Theiler, Phys. Plasmas 17, (2010) [27] A. Fasoli, A. Burckel, L. Federspiel, I. Furno, K. Gustafson, D. Iraji, B. Labit, J. Loizu, G. Plyushchev, P. Ricci, C. Theiler, A. Diallo, S.H. Mueller, M. Podest`a and F. Poli, Plasma Phys. Control. Fusion 52, (2010) [28] S. Banerjee, H. Zushi, N. Nishino, K. Hanada, S.K. Sharma, H. Honma, S. Tashima, T. Tashima, T. Inoue, K. Nakamura, H. Idei, M. Hasegawa and A. Fujisawa, Nucl. Fusion (2012) [29] J.A. Alonso, S.J. Zweben, P. Carvalho, J.L. de Pablos, E. de la Cal, C. Hidalgo, T. Klinger, B. Ph. van Milligen, R.J. Maqueda, M.A, Pedrosa, C, Silva, M, Spolaore, H, Thomsen and the TJ-II team, Plasma Phys. Control Fusion 48, B465 (2006) [30] D. Carralero, D. Carralero, E. de la Cal, J.L. de Pablos, A. de Coninck, J.A. Alonso, C. Hidalgo, B.Ph. van Milligen, M.A. Pedrosa, J. Nucl. Mat , 457 (2009) [31] G. Fuchert, G Birkenmeier, B Nold, M Ramisch and U Stroth, Plasma Phys. Control. Fusion 55, (2013) 37
38 [32] G. Fuchert, G. Birkenmeier, M Ramisch and U Stroth, Plasma Phys. Control Fusion 58, (2016) [33] B.D. Dudson, N. Ben Ayed, A. Kirk, H.R. Wilson, G. Counsell, X. Xu, M. Umansky, P.B. Snyder, B. Lloyd and the MAST team, Plasma Phys. Control. Fusion 50, (2008) [34] N. Ben Ayed, A. Kirk, B. Dudson, S. Tallents, R.G.L. Vann, H.R. Wilson and the MAST team, Plasma Phys. Control. Fusion 51, (2009) [35] S. Banerjee, H. Zushi, N. Nishino, K. Hanada, M. Ishiguro, S. Tashima, H. Q. Liu, K. Mishra, K. Nakamura, H. Idei, M. Hasegawa, A. Fujisawa, Y. Nagashima, and K. Matsuoka, Phys. Plasmas 21, (2014) [36] R. Pánek, J. Adámek, M. Aftanas, P. Bílková, P. Böhm, F. Brochard, P. Cahyna, J. Cavalier, R. Dejarnac, M. Dimitrova et al, Plasma Phys. Control. Fusion 58, (2016) [37] J.R. Harrison, G. M. Fishpool, A. J. Thornton, N. R. Walkden, and MAST team, Phys. Plasmas 22, (2015) [38] J.L. Terry et al, Nuclear Materials and Energy 10, Available online January 2017, [39] R.J. Maqueda, D.P. Stotler and the NSTX Team, Nucl. Fusion 50, (2010) [40] F. Scotti et al, to be submitted (2017) [41] S. Ku, R. Hager, C.S. Chang, J.M. Kwon, S.E. Parker, J. Comp. Phys. 315, 467 (2016); S. Ku, C.S. Chang and P.H. Diamond, Nuclear Fusion 49, (2009) [41a] G. McKee, R. Ashley, R. Durst, R. Fonck, M. Jakubowski, K. Tritz, K. Burrell, C. Greenfield, and J. Robinson, Rev. Sci. Instrum. 70, 913 (1999) [41b] E.L. Foley and F.M. Levinton, Rev. Sci. Instrum. 84, (2013) [42] S.J. Zweben, R. J. Maqueda, R. Hager, K. Hallatschek, S. M. Kaye, T. Munsat, F. M. Poli, A. L. Roquemore, Y. Sechrest, and D. P. Stotler, Phys. Plasmas 17, (2010) [43] J.L. Terry, S.J. Zweben, M.V. Umansky, I. Cziegler, O. Grulke, B. LaBombard, D.P. Stotler, J of Nucl. Mater , 339 (2009) [44] I. Shesterikov, Y. Xu, M. Berte, P. Dumortier, M. Van Schoor, M. Vergote, B. Schweer, and G. Van Oost, Rev. Sci. Instrum (2013) 38
39 [45] G. Fuchert et al, Plasma Phys. Control. Fusion 56, (2014) [46] D. D Ippolito, J.R. Myra, and S.J. Zweben, Phys. Plasmas 18, (2011) [47] Special Issue on Edge Plasmas in Magnetic Fusion Devices, PPCF 58 (2016) [48] J. Terry, N.P. Basse, I. Cziegler, M. Greenwald, O. Grulke,B. LaBombard, S.J. Zweben, E.M. Edlund, J.W. Hughes, L. Lin, Y. Lin, M. Porkolab, M. Sampsell, B. Veto and S.J.Wukitch, Nucl. Fusion 45, 1321 (2005) [49] H.Q. Wang, G. S. Xu, B. N. Wan, S. Y. Ding, H. Y. Guo, L. M. Shao, S. C. Liu, X. Q. Xu, E. Wang, N. Yan et al, Phys. Rev. Lett. 112, (2014) [50] S. Banerjee, A. Diallo, S.J. Zweben, Phys. Plasmas 23, (2016) [51] R. Maqueda, R. Maingi and NSTX Team, Phys. Plasmas 16, (2009) [52] Y. Sechrest, T. Munsat, D. A. D Ippolito, R. J. Maqueda, J. R. Myra, D. Russell, and S. J. Zweben, Phys. Plasmas 18, (2011) [53] I. Cziegler, P.H. Diamond, N. Fedorczak, P. Manz, G.R. Tynan, M. Xu, R. M. Churchill, A.E. Hubbard, B. Lipschultz, J.M. Sierchio, J.L. Terry, and C. Theiler, Phys. Plasmas 20, (2013) [54] I. Czielger, G.R. Tynan, P H Diamond, A.E. Hubbard, J.W. Hughes, J. Irby and J.L. Terry, Plasma Phys. Control. Fusion (2014) [55] I. Czielger, G.R. Tynan, P H Diamond, A.E. Hubbard, J.W. Hughes, J. Irby and J.L. Terry, et al., 2015 Nucl. Fusion [56] S.J. Zweben, D.P. Stotler, R.E. Bell, W.M. Davis, S.M. Kaye, B.P. LeBlanc, R.J Maqueda, E.T Meier, T. Munsat, Y. Ren, S.A. Sabbagh, Y. Sechrest, D.R. Smith and V Soukhanovskii, Plasma Phys. Control. Fusion 56, (2014) [57] M. Agostini, P. Scarin, R. Cavazzana, L. Carraro, L. Grando, C. Taliercio, L. Franchin, and A. Tiso, Rev. Sci. Inst. 86, (2015) [58] E. de la Cal, J. Guasp and the TJ-II Team, Plasma Phys. Control. Fusion 53, (2011) [59] S. Gangadhara and B. LaBombard, Plasma Phys. Control Fusion 46, 1617 (2004) [60] S. J. Zweben, B. D. Scott, J. L. Terry, B. LaBombard, J. W. Hughes, and D. P. Stotler, Phys. Plasmas 16, (2009) 39
40 [60a] S.J. Zweben, D.P. Stotler, F. Scotti, J.R. Myra, Two-dimensional turbulence cross-correlation functions in the edge of NSTX, (to be submitted) [61] D. R. Bates, A. E. Kingston, and R. W. P. McWhirter, Proc. R. Astron. Soc. London, Ser. A. 267, 297 (1962) [62] D.P. Stotler, D. A. D Ippolito, B. LeBlanc, R. J. Maqueda, J. R. Myra, S. A. Sabbagh, and S. J. Zweben, Contr. Plasma Phys. 44, 294 (2004) [63] D.P. Stotler, J. Boedo, B. LeBlanc, R.J. Maqueda, S.J. Zweben, J. Nucl. Mater , 686 (2007) [64] J. M. Muñoz Burgos, T. Barbui, O. Schmitz, D. Stutman, and K. Tritz, Rev. Sci. Instrum. 87, 11E502 (2016) [65] J.C. Weisheit, J. Phys. B 8, 2556 (1975) [66] R. K. Janev and J. J. Smith, At. Plasma-Mater. Interact. Data Fusion 4, 1 (1993), supplement to the journal Nucl. Fus. [67] I. Bray and A. T. Stelbovics, Phys. Rev. A 46, 6995 (1992) [68] I. Bray, D. V. Fursa, A. S. Kadyrov, A. T. Stelbovics, A. S. Kheifets, and A. M. Mukhamedzhanov, Phys. Rep. 520, 135 (2012) [69] M. Goto, J. Quant. Spectrosc. Radiat. Transfer 76 (2003) 331 [70] T. Fujimoto, J. Quant. Spectrosc. Radiat. Transfer 21 (1979) 439 [71] D.P. Stotler, F. Scotti, R. E. Bell, A. Diallo, B. P. LeBlanc, M. Podestà, A. L. Roquemore, and P. W. Ross, Phys. Plasmas 22, (2015) [72] B. Farizon, M. Barizon, M.J. Gaillard, E. Gerlic, S. Ouaskit, Nucl. Instr. Methods Phys. Res. B 101, 287 (1995) [73] D. Dunai, S. Zoletnik, J. Sárközi, and A. R. Field, Rev. Sci. Instrum. 81, (2010) [74] R. Cavazzana, P. Scarin, G. Serianni, M. Agostini, F. Degli Agostini, V. Cervaro, L. Lotto, Y. Yagi, H. Sakakita, H. Koguchi, and Y. Hirano, Rev. Sci. Instrun. 75, 4152 (2004) [75] M. Agostini, R. Cavazzana, P. Scarin, and G. Serianni, Rev. Sci. Instrum. 78, (2006) [76] A.E. White, S. J. Zweben, M.J. Burin, T.A. Carter, T.S. Hahm and J. A. Krommes, 40
41 R. J. Maqueda, Phys. Plasma 13, (2006) [77] G. Serianni, M. Agostini, R. Cavazzana and P. Scarin, Plasma Phys. Control. Fusion (2007) [78] B. Cao, D.P. Stotler, S. J. Zweben, M. Bell, A. Diallo, and B. LeBlanc, Fusion Science and Technology 64, 29 (2013) and references therein [79] R.E.H. Clark D.H. Reiter (Eds.) Nuclear Fusion Research, Understanding Plasma- Surface Interactions, Springer-Verlag Berlin Heidelberg 2005 [80] K Behringer, H.P. Summers, B. Denne, M. Forrest, and M. Stamp, Plasma Phys. Control. Fusion, 31, 2059 (1989) [81] D.P. Stotler and C.F.F. Karney, Contrib. Plasma Phys. 34, 392 (1994) [82] O. Grulke, J.L. Terry, I. Cziegler, B. LaBombard and O.E. Garcia, Nucl. Fusion 54, (2014) [83] S.J. Zweben, J. L. Terry, M. Agostini, W. M. Davis, A. Diallo, R. A. Ellis, T. Golfinopoulos, O. Grulke, J. W. Hughes, B. LaBombard, M. Landreman, J. R. Myra, D. C. Pace, and D. P. Stotler, Phys. Plasmas 20, (2013) [84] G. Birkenmeier, F.M. Laggner, M. Willensdorfer, T. Kobayashi, P Manz, E. Wolfrum, D. Carralero, R. Fischer, B. Sieglin, G. Fuchert, U. Stroth and the ASDEX upgrade team, Plasma Phys. Control. Fusion 56, (2014) [85] S.C. Liu, L. M. Shao, S. J. Zweben, G. S. Xu, H. Y. Guo, B. Cao, H. Q. Wang, L. Wang, N. Yan, S. B. Xia et al, Rev. Sci. Instrum. 83, (2012) [86] G.S. Xu, L.M. Shao, S.C. Liu, H.Q. Wang, B.N. Wan, H.Y. Guo, P.H. Diamond, G.R. Tynan, M. Xu, S.J. Zweben et al., Fusion 54, (2014) [87] L.M. Shao, G.S. Xu, S.C. Liu, S.J. Zweben, B.N. Wan, H.Y. Guo, A.D. Liu, R. Chen, B. Cao, W Zhang et al, Plasma Phys. Control. Fusion 55, (2013) [88] N. Nishino, L. Zang, M. Takeuchi, T. Mizuuchi, S. Ohshima, K. Kasajima, M. Sha, K. Mukai, H.Y. Lee, K. Nagasaki, H. Okada, T. Minami, S. Kobayashi, S. Yamamoto, S. Konoshima, Y. Nakamura, F. Sano, J. Nucl. Mat. 438, S540 (2013) [89] L. Zang, T. Mizuuchi, N. Nishino, S. Ohshima, S. Yamamoto, Y. C. Sun, K. Kasajima, M. Takeuchi, K. Mukai, H. Y. Lee, N. Kenimochi, Y. Ohtani, K. Nagasaki, S. Kado, H. Okada, T. Minami, S. Kobayashi, N. Shi, S. Konoshima, Y. Nakamura, and F. Sano, Fusion Science and Technology 68, 768 (2015) [90] N. Nishino, Y. Nakashima, Y. Higashizono, S. Kobayashi, K. M. Islam, Y. Kubota, 41
42 M. Yoshikawa, Y.Mishima and T. Cho, Plasma and Fusion Research: Rapid Communications 1, 36 (2006) [91] Y. Nakashina, N. Nishino, Y. Higashizono, H. Kawano, S. Kobayashi, M. Shoji, Y. Kubota, M. Yoshikawa, M.K. Islam, Y. Mishima, D. Mimura, T. Cho, J. Nucl. Mat. 363, 616 (2007) [92] S.J. Zweben, R.J. Maqueda, D.P. Stotler, A. Keesee, J. Boedo, C.E. Bush, S.M. Kaye, B. LeBlanc, J.L. Lowrance, V.J. Mastrocola, R. Maingi, N. Nishino, G. Renda, D.W. Swain, J.B.Wilgen and the NSTX Team, Nucl. Fusion 44, 134 (2004) [93] M. Agostini, P. Scarin, R. Cavazzana, F. Sattin, G. Serianni, M. Spolaore and N. Vianello, Plasma Phys. Control. Fusion 51, (2009) [94] R. Cavazzana, P. Scarin, G. Serianni, M. Agostini, F. Degli Agostini, V. Cervaro, L. Lotto, Y. Yagi, H. Sakakita, H. Koguchi, and Y. Hirano, Rev. Sci. Instrum. 75, 4152 (2004) [95] P. Scarin, M. Agostini, R. Cavazzana, F. Sattin, G. Serianni, M. Spolaore, N. Vianello, J. Nucl. Mater , 444 (2009) [96] P. Scarin, M. Agostini, R. Cavazzana, F. Sattin, G. Serianni, N. Vianello, J. Nucl. Mater , 669 (2007) [97] M. Agostini, P. Scarin, G. Spizzo, N. Vianello and L. Carraro, Plasma Phys. Control. Fusion 56, (2014) [98] I. Shesterikov, Y. Xu, C. Hidalgo, M. Berte, P. Dumortier, M. Van Schoor, M. Vergote, G. Van Oost and the TEXTOR Team, Nucl. Fusion 52, (2012) [99] I. Shesterikov, Y. Xu, G. R. Tynan, P. H. Diamond, S. Jachmich, P. Dumortier, M. Vergote, M. Van Schoor, G. Van Oost,3 and TEXTOR Team, Phys. Rev. Lett. 111, (2013) [100] E. de la Cal, P. Semwal, A. Martın Aguilera, B. van Milligen, J.L. de Pablos, Z. Khan and C Hidalgo, Plasma Phys. Control. Fusion 56, (2014) [101] M. Agostini, R. Cavazzana, P. Scarin, G. Serianni, Y. Yagi, H. Koguchi, S. Kiyama, H. Sakakita and Y Hirano, Plasma Phys. Control Fusion 50, (2008) [102] R. Cavazzana, P. Scarin, G. Serianni, M. Agostini, F. Degli Agostini, V. Cervaro, L. Lotto, Y. Yagi, H. Sakakita, H. Koguchi, and Y. Hirano, Plasma Phys. Control. Fusion 49, 129 (2007) [103] D.A. Russell, J. R. Myra, D. A. D Ippolito, T. L. Munsat, Y. Sechrest, R. J. Maqueda, D. P. Stotler, S. J. Zweben, and The NSTX Team, Phys. Plasmas 18,
43 (2011) [104] J. Horacek, J. Horacek, J. Adamek, H.W. Muller, J. Seidl, A.H. Nielsen, V. Rohde, F. Mehlmann, C. Ionita, E. Havlıckova and the ASDEX Upgrade Team, Nucl. Fusion 50, (2010) [105] B. Nold, T. Ribeiro, M. Ramisch, Z. Huang, H.W. Muller, B.D. Scott, U. Stroth, and the ASDEX Upgrade Team, New Journal of Physics 14, (2012) [106] B. LaBombard, B. LaBombard, T. Golfinopoulos, J.L. Terry, D. Brunner, E. Davis, M. Greenwald, J. W. Hughes, and Alcator CModTeam, Phys. Plasmas 21, (2014) [107] J.A. Boedo, J. R. Myra, S. Zweben, R. Maingi, R. J. Maqueda, V. A. Soukhanovskii, J. W. Ahn, J. Canik, N. Crocker, D. A. D'Ippolito, R. Bell, H. Kugel, B. Leblanc, L. A. Roquemore, D. L. Rudakov, and NSTX Team, Phys. Plasmas 21, (2014) [108] A.L. Roquemore, S. J. Zweben, R. Kaita, R. J. Marsalsa, C. E. Bush, and R. J. Maqueda, Rev. Sci. Instrum. 79, 10F124 (2008) [109] M. Willensdorfer, G Birkenmeier, R Fischer, F M Laggner, E Wolfrum, G Veres, F Aumayr, D Carralero, L Guimarais, B Kurzan and the ASDEX Upgrade Team, Plasma Phys. Control. Fusion 56, (2014) [110] R. J. Fonck, P. A. Duperrex, and S. F. Paul, Rev. Sci. Instrum. 61, 3487 (1990) [111] G. McKee, R. J. Fonck, M. W. Shafer, I. U. Uzun-Kaymak, and Z. Yan, Rev. Sci. Instrum. 81, 10D741 (2010) [112] D.R. Smith, R.J. Fonck, G.R. McKee, D.S. Thompson, R. E. Bell, A. Diallo, W. Guttenfelder, S. M. Kaye, B. P. LeBlanc, and M. Podesta, Nucl. Fusion 53, (2013) [113] A.R. Field, D. Dunai, Y.C. Ghim, P. Hill, B. McMillan, C.M. Roach, S. Saarelma, A.A. Schekochihin, S Zoletnik and the MAST Team, Plasma Phys. Control. Fusion 56, (2014) [114] S. Zoletnik, M. Anton, M. Endler, S. Fiedler, M. Hirsch, K. McCormick, J. Schweinzer and the W7-AS Team, Phys. Plasmas 6, 4239 (1999) [115] Y. Sechrest, D. Smith, D. P. Stotler, T. Munsat, and S. J. Zweben, Phys. Plasmas 22, (2015) [116] D.A. Russell, J.R. Myra, D.A. D'Ippolito, B. LaBombard, J.W. Hughes, J.L. Terry, and S. J. Zweben, Phys. Plasmas 23, (2016) 43
44 [117] C. Theiler, J.L. Terry, E. Edlund, I. Cziegler, R.M. Churchill, J.W. Hughes, B. LaBombard, T. Golfinopoulos, and the Alcator C-Mod Team, to be published in Plasma Phys. Control. Fusion (2017)]. [118] P.W. Wachulak, Rev. Sci. Instrum. 87, (2016); P.W. Wachulak, A. Bartnik, R. Jarocki, H. Fiedorowicz, Nucl. Instrum. Methods B 285, 102 (2012) [119] B. Landgraf, M. Schnell, A. Sävert, M. C. Kaluza, and C. Spielmann, Rev. Sci. Instrum. 82, (2011) [120] V. Malka, C. Coulaud, J.P. Geindre, V. Lopez, Z. Najmudin, D. Neely, and F. Amiranoff, Rev. Sci. Instrum. 71, 2329 (2000) [121] D. Moulton, Y. Marandet, P. Tamain, Ph. Ghendrih, M. Groth, J. Nucl. Mater 463, 893 (2015) [122] D. Moulton, Y. Marandet, P. Tamain, Ph. Ghendrih, and R.Futtersack, Contributions to Plasma Physics 54 (2014) 575 [123] J.R. Myra, D. A. Russell, D. A. D Ippolito, J.-W. Ahn, R. Maingi, R. J. Maqueda, D. P. Lundberg, D. P. Stotler, S. J. Zweben, J. Boedo, M. Umansky and NSTX Team, Phys. Plasmas 18, (2011) [124] R. K. Janev, W. D. Langer, K. Evans, Jr., and D. E. Post, Jr., Elementary Processes in Hydrogen-Helium Plasmas, Springer Series on Atoms and Plasmas, Springer-Verlag, New York, [125] S. Brezinsek, Ph. Mertens, A. Pospieszczyk, G. Sergienko, and P.T. Greenland, Contrib. Plasma Phys. 42, 668 (2002) [126] U. Fantz, D. Reiter, B. Heger, and D. Coster, J. Nucl. Mater , 367 (2001) [127] S. Menmuir, E. Rachlewa, U. Fantz, R. Pugnoc, R. Duxc, the ASDEX Upgrade team, J. Quant. Spec. Rad. Trans. 105, 425 (2007) [128] V. Kotov, D. Reiter, R.A. Pitts, S. Jachmich, A. Huber, D.P. Coster and JET-EFDA contributors, Plasma Phys. Control. Fusion 50, (2008) [129] K. Behringer and U. Fantz, New J. Phys. 2, 23.1 (2000) [130] U. Fantz, D. Reiter, B. Heger, and D. Coster, J. Nucl. Mater , 367 (2001) [131] D. Coster, J. Nucl. Mater , 367 (2001) [132] P. T. Greenland, Proc. R. Soc. London A 457, 1821 (2001) 44
45 [133] A. Pigarov and S. Krasheninnikov, Phys. Lett. A 222, 251 (1996) [134] R. K. Janev, D. Reiter, and U. Samm, Forschumngszentrum Juelich Report Juel (2003) [135] P. T. Greenland and D. Reiter, Contrib. Plasma Phys. 38, 302 (1998) [136] S. Ma, J. Howard, and N.Thapar, Phys. Plasmas 18, (2011) [137] S. I. Krasheninnikov and A. Yu. Pigarov, Proceedings of the 11 th International Conference on Plasma Physics and Controlled Fusion Research (Kyoto, November 1986), paper IAEA-CN-47/H-III-10, IAEA, Vienna, Vol. 3 (1987), p. 387 [138] R. Marchand and J. Lauzon, Phys. Fluids B 4, 924 (1992) [139] A. S. Wan, H.E. Dalhed, H.A. Scott, D.E. Post, and T.D. Rognlien, J. Nucl. Mater , 1102 (1995); [140] J. L. Terry, B. Lipschultz, A. Yu. Pigarov, S.I. Krasheninnikov, B. LaBombard, D. Lumma, H. Ohkawa, D. Pappas, and M. Umansky, Phys. Plasmas 5, 1759 (1998) [141] M. L. Adams, H.A. Scott, R.W. Leeb, J.L. Terry, E.S. Marmar, B. Lipschultz, A.Yu. Pigarov, J.P. Freidberga. Quant. Spec. Rad. Trans. 71, 117 (2001) [142] D. Reiter, S Wiesen, and M Born, Plasma Phys. Control. Fusion 44, 1723 (2002) [143] S. Sasaki, S. Takamura, S. Watanabe, S. Masuzaki, T. Kato, K. Kadota, Rev. Sci. Instrum. 67, 3521 (1996) [144] Y. Iida, S. Kado, A. Otamoto, S. Kajita, T. Shikama, D. Yamasaki, S. Tanaka, O., J. Plasma Fusion Res. Ser. 7, 123 (2006) [145] D. Nishijima and E. M. Hollmann, Plasma Phys. Control. Fusion 49, 791 (2007) [146] S. Kajita, N. Ohno, S. Takamura, T. Nakano, Phys. Plasmas 13, (2006) [147] S. Kajita, N. Ohno, S. Takamura, T. Nakano., Phys. Plasmas 16, (2009) (Erratum) [148] F. B. Rosmej, N. Ohno, S. Takamura, S. Kajita, Contrib. Plasma Phys. 48, 243 (2008) [149] J.M. Muñoz Burgos, M. Agostini, P. Scarin, D. P. Stotler, E. A. Unterberg, S. D. Loch, O. Schmitz, K. Tritz, and D. Stutman, Phys. Plasmas 23, (2016) 45
46 [150] M. L. Adams and H. A. Scott, Contrib. Plasma Phys. 44, 263 (2004) [151] H. A. Scott and M. L. Adams, Contrib. Plasma Phys. 44, 51 (2004) [152] S. Kajita and N. Ohno, Rew. Sci. In., 82, (2011) [153] T.A. Gianakon, R.J. Fonck, J.D. Callen, R.D. Durst, J.S. Kim, and S.F. Paul, Rev. Sci. Instrum. 63 (1992) 4931 [154] Y. Marandet, P. Tamain, R. Futtersack, Ph. Ghendrih, H. Bufferand, P. Genesio, A. Mekkaoui, J. Nucl. Mater. 438, S518 (2013) [155] A.S. Thrysøe, L.E.H. Tophøj, V. Naulin, J.J. Rasmussen, J. Madsen and A.H. Nielsen, Plasma Phys. Control. Fusion 58, (2016) [156] A. Mekkaoui, Y. Marandet, D. Reiter, P. Boerner, P. Genesio, J. Rosato, H. Capes, M. Koubiti, L. Godbert-Mouret, and R. Stamm, Phys. Plasmas 19, (2012) [157] A. Mekkaoui, V. Kotov, D. Reiter, and P. Boerner, Contrib. Plasma Phys. 54, 409 (2014) [158] R. Jha, A. Sen, P.K. Kaw, P.K. Atrey, S.B. Bhatt, N. Bisai, K. Tahiliani, R.L. Tanna and the ADITYA Team, Plasma Phys. Control Fusion 51, (2009) [159] D. Sangwan, R. Jha, J. Brotankova, and M.V. Gopalkrishna, Phys. Plasmas 20, (2013) [160] I. Cziegler, J.L. Terry, J.W. Hughes, and B. LaBombard, Phys. Plasmas 17, (2010) [161] S.J. Zweben, S.J. Zweben, W.M. Davis, S.M. Kaye, J.R. Myra, R.E. Bell, B.P. LeBlanc, R.J. Maqueda, T. Munsat, S.A. Sabbagh, Y. Sechrest, D.P. Stotler and the NSTX Team, Nucl. Fusion 55, (2015) [162] B.A. Carreras, L.W. Owen, R. Maingi, and P.K. Mioduszewski, T.N. Carlstrom and R.J. Groebner,Phys. Plasmas 5, 2623 (1998) [163] J. Omotani, I. Pusztai, S. Newton and T. Fülöp, Nucl. Fusion 56 (2016) [164] N. Bisai, P.W. Kaw, Phys. Plasmas 23, (2016) [165] T. Munsat and S.J. Zweben, Rev. Sci. Instrum. 77, (2006) [166] Y. Sechrest, T. Munsat, D. A. D Ippolito, R. J. Maqueda, J. R. Myra, D. Russell, and S. J. Zweben, Department of Physics,Phys. Plasmas 18, (2011) 46
47 [167] S. Banerjee, H. Zushi, N. Nishino, K. Mishra, T. Onchi, A. Kuzmin, Y. Nagashima, K. Hanada, K. Nakamura, H. Idei, M. Hasegawa, and A. Fujisawa, Rev. Sci. Instrum. 86, (2015) [168] J.M. Sierchio, I. Cziegler, J. L. Terry, A. E. White, and S. J. Zweben, Rev. Sci. Instrum. 87, (2016) [169] I. Cziegler, J.L. Terry, S.J. Wukitch, M.L. Garrett, C. Lau and Y. Lin, Plasma Phys. Control. Fusion 54, (2012) 47
48 Figure Captions: Fig. 1 - Gas puff imaging (GPI) geometry in a tokamak. The simplified picture in (a) shows a single 3-D plasma edge filament aligned along the magnetic field direction B, along with a schematic illustration of a gas puff cloud [reproduced with permission from Fig. 1 of B. Cao et al, Fusion Science and Technology 64, 29 (July 2013), Copyright 2013 American Nuclear Society, La Grange Park, Illinios]. When viewed from along the local B field direction in the cloud, the 2-D structure of the filament perpendicular to B should be fairly clearly visible (i.e. the blob ). The more realistic image in (b) was constructed using plasma turbulence simulation outputs of XGC-1 and gas cloud outputs from DEGAS 2 [visualization provided by D. Pugmire, private communication]. The yellow filaments are edge density structures near the separatrix in the XGC-1 output, which are aligned along the magnetic field. The gray is the GPI gas cloud shape from DEGAS 2, and the yellow glow is where the filaments intersect the computed gas cloud. The blue box is the simulated GPI camera view, and the tube at the left is the GPI gas puffer. Fig. 2 - GPI images from the NSTX tokamak made near the outer midplane over a 24 cm x 24 cm region using a D 2 gas with a Balmer- filter and a 2.1 µsec camera exposure time [reproduced from S.J. Zweben et al, Phys. Plasmas 17, (2010), with the permission of AIP Publishing]. At the top is a typical L-mode plasma, and at the bottom is a quiescent H-mode plasma later in the same shot. In both cases the raw camera data is displayed using the same false linear color scale (white as maximum and black as zero), with the poloidal direction vertical, the radial direction horizontal (outward to the right), and the magnetic separatrix from the EFIT reconstruction is shown by the dashed line. The data are analyzed only within the orange boxes, since D emission is too small in the low electron temperatures near the wall (right of the box), and also too low farther inside the plasma where the ionization occurs at high temperatures (left of the box). Fig. 3 - GPI images from the Alcator C-Mod tokamak made at two different 6 cm x 6 cm regions using D 2 gas with Balmer- line filter. The imaged regions are shown schematically along with the plasma equilibrium at the time when the image from outboard of the lower X-point was taken [43]. The other imaged region is at the lowfield-side midplane. The four-hole nozzle at the LFS midplane and the single-hole nozzle in the outer divertor target, below the lower imaged region, are also shown. These images are normalized with respect to the time-averaged images of each region to show the structure of the relative fluctuation levels, where white is 1.5 and black is 0.5, and the low signal region well inside the separatrix is forced black. The maximum fluctuation levels are large (±50%) in both locations, and the structures in the X-point region are significantly tilted with respect to the local separatrix. Both discharges are in H-mode. Fig. 4 - A time sequence of GPI images from the TEXTOR tokamak made with camera exposure times of 6 µsec each over a 12 cm x 12 cm region at the outer midplane using 48
49 D 2 gas with a D filter [reproduced from I. Shesterikov et al, Rev. Sci. Instrum (2013), with the permission of AIP Publishing]. These images have their time averages image subtracted to show more clearly the positive (red) and negative (blue) excursions from the mean signal. The polodial motion of one positive structure is shown by the black dashed line, and the last closed flux surface is shown by the green dashed line, with the radially outward direction toward the left. These data are from an Ohmic discharge. Fig. 5 - A time sequence of GPI images from the ASDEX Upgrade tokamak created using a 2-D conditional averaging (CA) technique based on the normalized light intensity fluctuations [reproduced with permission from Fig. 4 of G. Fuchert et al, Plasma Phys. Control. Fusion 56, (2014). Copyright IOP Publishing.]. The GPI data was taken with a deuterium gas puff and D filter with 8 µsec between frames during an inter-elm period in an H-mode plasma, and over a region of ~5 cm x 5 cm just below the outer midplane. The reference pixel is the small cross, the threshold for CA is two times the standard deviation, and 556 trigger events were averaged to produce these averaged images. The positive blob structure shown (red) was born inside the separatrix (dashed line), and on average propagated radially outward (to the right) and poloidally downward over ~50 µsec. The fluctuation amplitude is scaled to a maximum at t=0, and a faint negative (hole) structure is also shown in blue. Fig. 6 - (a) Deuterium Balmer- (656.3 nm) and (b) HeI nm photon emission rate per electron per neutral atom, i.e. f(n e,t e )/n e in Eq. [3] obtained from the collisional radiative model described in the text. The photon emission rate per electron per deuterium molecule is included in (a) for comparison; these contributions are described in Sec. V.D. Fig. 7 (a) Density and (b) temperature exponents n and T as defined in Eq. [5] for the deuterium Balmer- (656.3 nm) data shown in Fig. 6(a). (c) and (d) are the analogous quantities for HeI (587.6 nm). (e) Density exponent variation with respect to n e at T e = 10 ev. Fig. 8 - Comparison between the time-averaged D light emission measured in NSTX and the calculated emission in the DEGAS 2 simulation of the NSTX edge plasma and the GPI view [reproduced with permission from Fig. 4 of B. Cao et al, Fusion Science and Technology 64, 29 (July 2013). Copyright 2013, American Nuclear Society, La Grange Park, Illinios]. The color contours are the DEGAS 2 results and the equally spaced white contours are the GPI results, the leftmost dashed line is the separatrix, the rightmost dashed line is the limiter shadow, and the nearly vertical line is the gas manifold. The 1-D profiles are obtained by normalizing the 2-D data to the sum over all pixels and then averaging over vertical pixels. The horizontal coordinate is mapped to the outer midplane separatrix. 49
50 Fig. 9 - A ~2 msec long time series of ion saturation current fluctuations measured with a reciprocating probe in Alcator C-Mod (blue), overlaid with a GPI signal from a single view within the 2-D array of APD views at outer midplane [reproduced with permission from Fig. 5 of O. Grulke et al, Nucl. Fusion 54, (2014). Copyright IOP Publishing.]. These two diagnostic sample the same flux-tube, but displaced by ~2.8 m along B. It is clearly seen that fluctuation events are observed by both diagnostics, and large-amplitude events especially can be directly identified in both traces. The crosscorrelation amplitudes between the GPI emission and I i,sat of over 75% are found in some cases. A small 1.5±0.5 μs time delay maximizes the cross-correlation between the two time-series. Fig. 10 DEGAS 2 simulations of the D light emission patterns in GPI in Alcator C- Mod assuming a strong poloidal and radial modulation of the electron density [reproduced from D. Stotler et al, J. Nucl. Mat , 1066 (2003), with the permission of AIP Publishing]. The gas nozzle is shown as a black rectangle at the left. In (a) the shadowing effect of the fluctuations on the neutral density is incorporated, and in (b) the shadowing effect has been eliminated using post-processing. The result is that the spatial structure of the emission profile in (a) is smeared out relative to the idealized result shown in (b) and relative to that of the perturbed density. 50

51 (a) b) Fig. 1 51
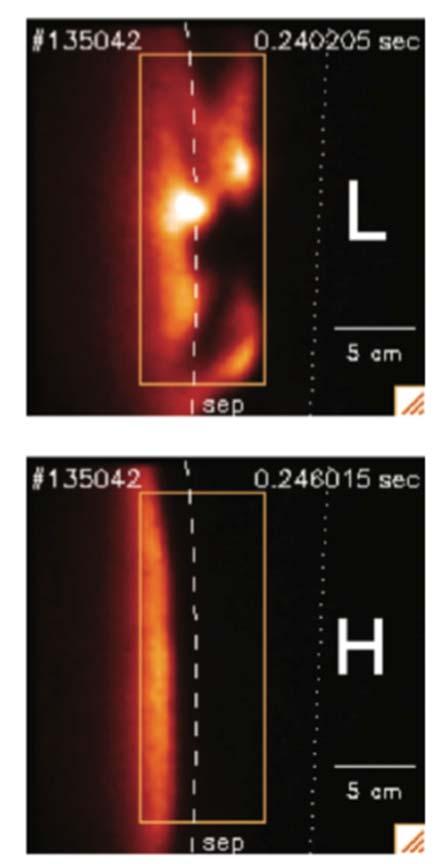
52 Fig. 2 52
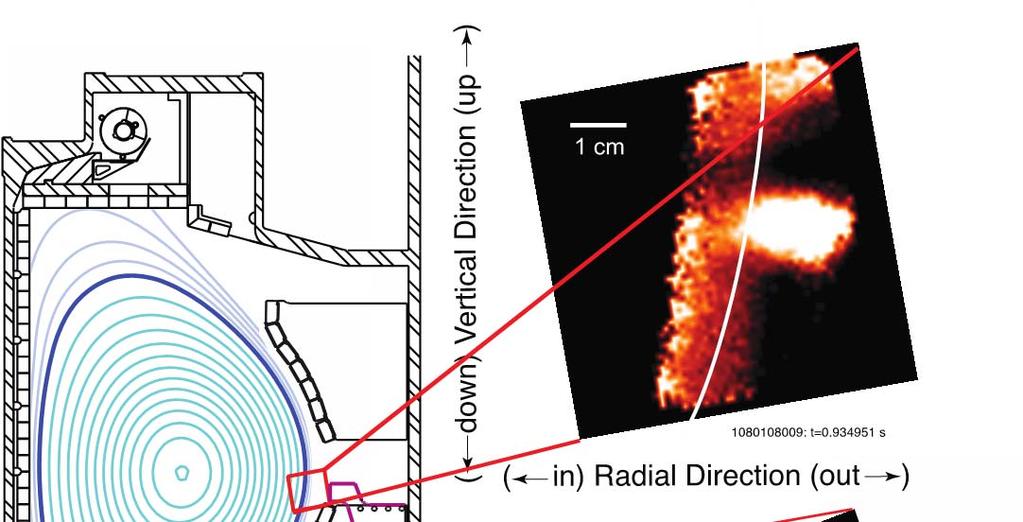

53 Fig. 3 53

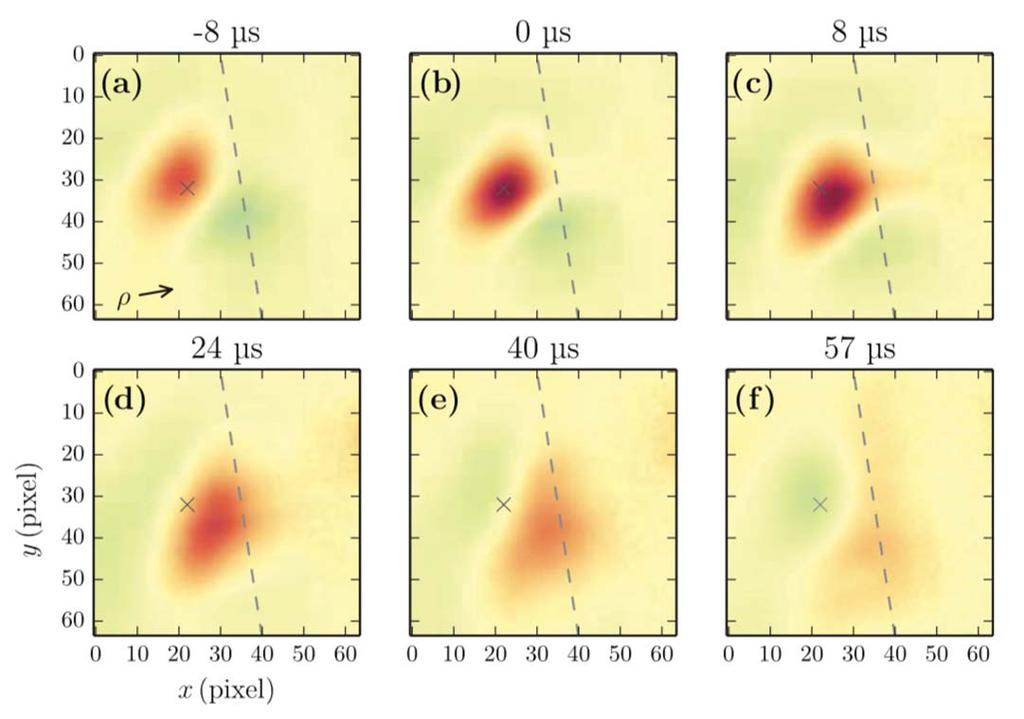
54 Fig. 4 ~5 cm Fig. 5 54
55 a) b) Fig. 6 55
56 a) Balmer- n b) Balmer- T c) HeI nm n d) HeI nm T 56
57 e) Balmer- and HeI nm n Fig. 7 57
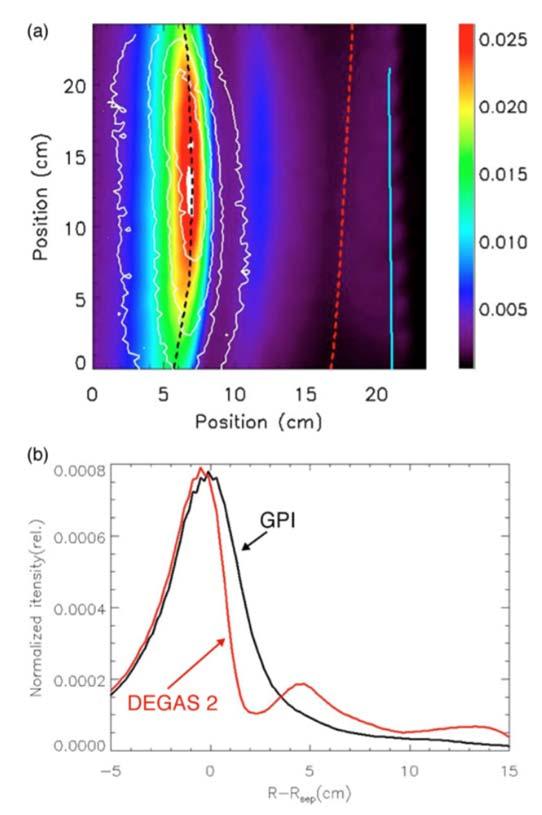
58 Fig. 8 58

59 Fig. 9 Fig
60
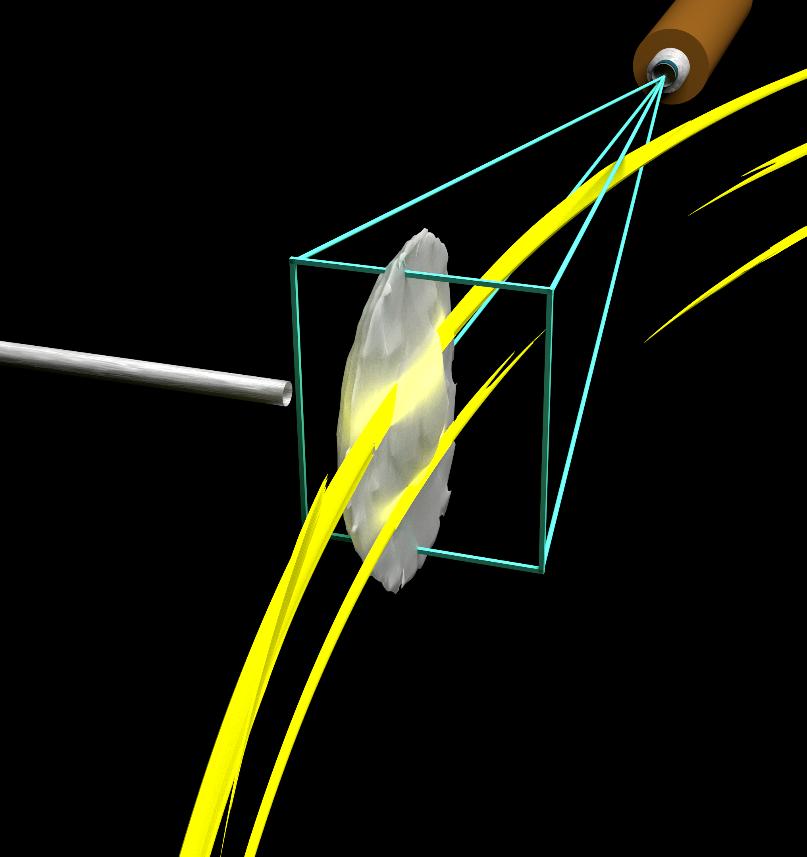
61

62
 1 cm (")
 nozzle separatrix")
63 ( down) Vertical Direction (up ) 1 cm ( in) Radial Direction (out ) nozzle separatrix 1 cm nozzle
64


65 ~5 cm
66 D nm Emission Rate (cm 3 / s) n e = cm -3 n e = cm -3 n e = cm -3 n e = cm -3 Molecular Contribution T e (ev)
67 He nm Emission Rate (cm 3 /s) n = cm -3 e n = cm -3 e n = cm -3 e n = cm -3 e n = cm -3 e T e (ev)
68
69
70
71
72

73 (a) (b) GPI DEGAS 2

74
 -0.075 0.925 0.900 0.875 R (m)")
75 D α Rate (1019 photons m-3 s-1) Z (m) Z (m) (a) R (m) (b) R (m)
Development of a New Gas Puff Imaging Diagnostic on the HL-2A Tokamak
 Development of a New Gas Puff Imaging Diagnostic on the HL-2A Tokamak B.Yuan a,b, M.Xu b,*, Y.Yu a,*, L.Zang b, R.Hong c, C.Chen b, Z.Wang b,l.nie b, R.Ke b, D.Guo b, Y.Wu a,b, T.Long b, S.Gong a,b, H.Liu
High Speed Imaging of Edge Turbulence in NSTX
 High Speed Imaging of Edge Turbulence in NSTX S.J. Zweben, R. Maqueda 1, D.P. Stotler, A. Keesee 2, J. Boedo 3, C. Bush 4, S. Kaye, B. LeBlanc, J. Lowrance 5, V. Mastrocola 5, R. Maingi 4, N. Nishino 6,
Blob sizes and velocities in the Alcator C-Mod scrapeoff
 P1-59 Blob sizes and velocities in the Alcator C-Mod scrapeoff layer R. Kube a,b,*, O. E. Garcia a,b, B. LaBombard b, J. L. Terry b, S. J. Zweben c a Department of Physics and Technology, University of
Edge Zonal Flows and Blob Propagation in Alcator C-Mod P5.073 EPS 2011
 Edge Zonal Flows and Blob Propagation in Alcator C-Mod S.J. Zweben 1, J.L. Terry 2, M. Agostini 3, B. Davis 1, O. Grulke 4,J. Hughes 2, B. LaBombard 2 D.A. D'Ippolito 6, R. Hager 5, J.R. Myra 6, D.A. Russell
Flow measurements in the Scrape-Off Layer of Alcator C-Mod using Impurity Plumes
 Flow measurements in the Scrape-Off Layer of Alcator C-Mod using Impurity Plumes S. Gangadhara,. Laombard M.I.T. Plasma Science and Fusion Center, 175 Albany St., Cambridge, MA 2139 USA Abstract Accurate
ArbiTER studies of filamentary structures in the SOL of spherical tokamaks
 ArbiTER studies of filamentary structures in the SOL of spherical tokamaks D. A. Baver, J. R. Myra, Research Corporation F. Scotti, Lawrence Livermore National Laboratory S. J. Zweben, Princeton Plasma
Investigation of causes for the discrepancy between the measured and modeled helium emissions using a gas puff imaging diagnostic
 Investigation of causes for the discrepancy between the measured and modeled helium emissions using a gas puff imaging diagnostic S. Baek, J. Terry, D. P. Stotler*, D. Brunner, B. LaBombard MIT Plasma
Plasma Spectroscopy in ISTTOK
 Plasma Spectroscopy in ISTTOK J. Figueiredo 1, R. B. Gomes 1, T. Pereira 1, H. Fernandes 1, A. Sharakovski 2 1 Associação EURATOM/IST, Centro de Fusão Nuclear, IST, 1049-001 Lisboa, Portugal 2 Association
Connections between Particle Transport and Turbulence Structures in the Edge and SOL of Alcator C-Mod
 Connections between Particle Transport and Turbulence Structures in the Edge and SOL of Alcator C-Mod I. Cziegler J.L. Terry, B. LaBombard, J.W. Hughes MIT - Plasma Science and Fusion Center th 19 Plasma
Convective transport by intermittent blob-filaments: comparison of theory and experiment
 Convective transport by intermittent blob-filaments: comparison of theory and experiment D. A. D Ippolito 1, J. R. Myra 1 and S. J. Zweben 2 1Lodestar Research Corporation, Boulder, Colorado 2Princeton
Diagnostics for Burning Plasma Physics Studies: A Status Report.
 Diagnostics for Burning Plasma Physics Studies: A Status Report. Kenneth M. Young Princeton Plasma Physics Laboratory UFA Workshop on Burning Plasma Science December 11-13 Austin, TX Aspects of Plasma
Some Notes on the Window Frame Method for Assessing the Magnitude and Nature of Plasma-Wall Contact
 Some Notes on the Window Frame Method for Assessing the Magnitude and Nature of Plasma-Wall Contact Peter Stangeby 4 September 2003 1. Fig. 1 shows an example of a suitable magnetic configuration for application
Alcator C-Mod. Particle Transport in the Scrape-off Layer and Relationship to Discharge Density Limit in Alcator C-Mod
 Alcator C-Mod Particle Transport in the Scrape-off Layer and Relationship to Discharge Density Limit in Alcator C-Mod B. LaBombard, R.L. Boivin, M. Greenwald, J. Hughes, B. Lipschultz, D. Mossessian, C.S.
channel system which covers both sides of the laser line. Coverage on both sides of the spectrum allows for
 Large-Area Avalanche Photodiode Detector Array Upgrade for a Ruby-Laser Thomson Scattering System T.M. Biewer, D.J. Den Hartog, D.J. Holly Department of Physics, University of Wisconsin-Madison M.R. Stoneking
L-mode filament characteristics on MAST as a function of plasma current measured using visible imaging
 1 9/2/16 L-mode filament characteristics on MAST as a function of plasma current measured using visible imaging A. Kirk, A.J. Thornton, J.R. Harrison, F. Militello, N.R. Walkden and the MAST Team and the
Relating the L-H Power Threshold Scaling to Edge Turbulence Dynamics
 Relating the L-H Power Threshold Scaling to Edge Turbulence Dynamics Z. Yan 1, G.R. McKee 1, J.A. Boedo 2, D.L. Rudakov 2, P.H. Diamond 2, G. Tynan 2, R.J. Fonck 1, R.J. Groebner 3, T.H. Osborne 3, and
Plasma Science and Fusion Center
 Plasma Science and Fusion Center Turbulence and transport studies in ALCATOR C Mod using Phase Contrast Imaging (PCI) Diagnos@cs and Comparison with TRANSP and Nonlinear Global GYRO Miklos Porkolab (in
Measurements of rotational transform due to noninductive toroidal current using motional Stark effect spectroscopy in the Large Helical Device
 REVIEW OF SCIENTIFIC INSTRUMENTS 76, 053505 2005 Measurements of rotational transform due to noninductive toroidal current using motional Stark effect spectroscopy in the Large Helical Device K. Ida, a
Study of B +1, B +4 and B +5 impurity poloidal rotation in Alcator C-Mod plasmas for 0.75 ρ 1.0.
 Study of B +1, B +4 and B +5 impurity poloidal rotation in Alcator C-Mod plasmas for 0.75 ρ 1.0. Igor Bespamyatnov, William Rowan, Ronald Bravenec, and Kenneth Gentle The University of Texas at Austin,
GA A22722 CENTRAL THOMSON SCATTERING UPGRADE ON DIII D
 GA A22722 CENTRAL THOMSON SCATTERING UPGRADE ON DIII D by D.G. NILSON, T.N. CARLSTROM, C.L. HSIEH, B.W. STALLARD, and R.E. STOCKDALE NOVEMBER 1997 DISCLAIMER This report was prepared as an account of work
Power Balance and Scaling of the Radiated Power in the Divertor and Main Plasma of Alcator C-Mod
 PFC/JA-94-15 Power Balance and Scaling of the Radiated Power in the Divertor and Main Plasma of Alcator C-Mod J.A. Goetz, B. Lipschultz, M.A. Graf, C. Kurz, R. Nachtrieb, J.A. Snipes, J.L. Terry Plasma
Development of a High-Speed VUV Camera System for 2-Dimensional Imaging of Edge Turbulent Structure in the LHD
 Development of a High-Speed VUV Camera System for 2-Dimensional Imaging of Edge Turbulent Structure in the LHD Masaki TAKEUCHI, Satoshi OHDACHI and LHD experimental group National Institute for Fusion
A novel tracer-gas injection system for scrape-off layer impurity transport and screening experiments
 A novel tracer-gas injection system for scrape-off layer impurity transport and screening experiments B. LaBombard, S. Gangadhara, B. Lipschultz, S. Lisgo a, D.A. Pappas, C.S. Pitcher, P. Stangeby a, J.
Observation of Neo-Classical Ion Pinch in the Electric Tokamak*
 1 EX/P6-29 Observation of Neo-Classical Ion Pinch in the Electric Tokamak* R. J. Taylor, T. A. Carter, J.-L. Gauvreau, P.-A. Gourdain, A. Grossman, D. J. LaFonteese, D. C. Pace, L. W. Schmitz, A. E. White,
Scaling of divertor heat flux profile widths in DIII-D
 1 Scaling of divertor heat flux profile widths in DIII-D C.J. Lasnier 1, M.A. Makowski 1, J.A. Boedo 2, N.H. Brooks 3, D.N. Hill 1, A.W. Leonard 3, and J.G. Watkins 4 e-mail:lasnier@llnl.gov 1 Lawrence
Bolometry. H. Kroegler Assciazione Euratom-ENEA sulla Fusione, Frascati (Italy)
") Bolometry H. Kroegler Assciazione Euratom-ENEA sulla Fusione, Frascati (Italy) Revised May 28, 2002 1. Radiated power Time and space resolved measurements of the total plasma radiation can be done by means
Bolometry H. Kroegler Assciazione Euratom-ENEA sulla Fusione, Frascati (Italy) Revised May 28, 2002 1. Radiated power Time and space resolved measurements of the total plasma radiation can be done by means
Tangential SX imaging for visualization of fluctuations in toroidal plasmas
 Tangential SX imaging for visualization of fluctuations in toroidal plasmas S. Ohdachi,, K. Toi, G. Fuchs and the LHD Experimental Group National Institute for Fusion Science Outline of my talk 1. Merit
Plasma Radiation. Ø Free electrons Blackbody emission Bremsstrahlung
 Plasma Radiation Ø Free electrons Blackbody emission Bremsstrahlung Ø Bound electrons (Z>2) Unresolved, multi-line emission Resolved line emission -- Single Z +n Objective Infer a thermodynamic quantity
L-to-H power threshold comparisons between NBI and RF heated plasmas in NSTX
 Research Supported by L-to-H power threshold comparisons between NBI and RF heated plasmas in NSTX T.M. Biewer 1, R. Maingi 1, H. Meyer 2, R.E. Bell 3, C. Bush 1, S. Kaye 3, S. Kubota 3, B. LeBlanc 3,
Varia%ons in Edge and SOL Turbulence in NSTX
 Varia%ons in Edge and SOL Turbulence in NSTX S.J. Zweben 1*, W.M. Davis 1, S.M. Kaye 1, J.R. Myra 2, R.E. Bell 1, B.P LeBlanc 1, R.J. Maqueda 1**, T. Munsat 3, S.A. Sabbagh 4, Y. Sechrest 3, D.P. Stotler
1 EX/P6-5 Analysis of Pedestal Characteristics in JT-60U H-mode Plasmas Based on Monte-Carlo Neutral Transport Simulation
 1 Analysis of Pedestal Characteristics in JT-60U H-mode Plasmas Based on Monte-Carlo Neutral Transport Simulation Y. Nakashima1), Y. Higashizono1), H. Kawano1), H. Takenaga2), N. Asakura2), N. Oyama2),
SUMMARY OF EXPERIMENTAL CORE TURBULENCE CHARACTERISTICS IN OH AND ECRH T-10 TOKAMAK PLASMAS
 SUMMARY OF EXPERIMENTAL CORE TURBULENCE CHARACTERISTICS IN OH AND ECRH T-1 TOKAMAK PLASMAS V. Vershkov, L.G. Eliseev, S.A. Grashin. A.V. Melnikov, D.A. Shelukhin, S.V. Soldatov, A.O. Urazbaev and T-1 team
Characterization of neo-classical tearing modes in high-performance I- mode plasmas with ICRF mode conversion flow drive on Alcator C-Mod
 1 EX/P4-22 Characterization of neo-classical tearing modes in high-performance I- mode plasmas with ICRF mode conversion flow drive on Alcator C-Mod Y. Lin, R.S. Granetz, A.E. Hubbard, M.L. Reinke, J.E.
Design of New Optical System for Visible Plasma Radiation Measurements at COMPASS Tokamak
 WDS'08 Proceedings of Contributed Papers, Part II, 100 104, 2008. ISBN 978-80-7378-066-1 MATFYZPRESS Design of New Optical System for Visible Plasma Radiation Measurements at COMPASS Tokamak D. I. Naydenkova
Stabilization of a low-frequency instability inadipoleplasma
 J. Plasma Physics: page 1 of 8. c 2008 Cambridge University Press doi:10.1017/s0022377808007071 1 Stabilization of a low-frequency instability inadipoleplasma D.T. GARNIER 1,A.C.BOXER 2, J.L. ELLSWORTH
UPGRADED CALIBRATIONS OF THE THOMSON SYSTEM AT DIII D
 GA A23440 UPGRADED CALIBRATIONS OF THE THOMSON SYSTEM AT DIII D by B. BRAY, C. HSIEH, T.N. CARLSTROM, and C.C. MAKARIOU AUGUST 2000 DISCLAIMER This report was prepared as an account of work sponsored by
EXD/P3-13. Dependences of the divertor and midplane heat flux widths in NSTX
 1 Dependences of the ertor and plane heat flux widths in NSTX T.K. Gray1,2), R. Maingi 2), A.G. McLean 2), V.A. Soukhanovskii 3) and J-W. Ahn 2) 1) Oak Ridge Institute for Science and Education (ORISE),
Highlights from (3D) Modeling of Tokamak Disruptions
 Modeling of Tokamak Disruptions") Highlights from (3D) Modeling of Tokamak Disruptions Presented by V.A. Izzo With major contributions from S.E. Kruger, H.R. Strauss, R. Paccagnella, MHD Control Workshop 2010 Madison, WI ..onset of rapidly
Highlights from (3D) Modeling of Tokamak Disruptions Presented by V.A. Izzo With major contributions from S.E. Kruger, H.R. Strauss, R. Paccagnella, MHD Control Workshop 2010 Madison, WI ..onset of rapidly
Progress in characterization of the H-mode pedestal
 Journal of Physics: Conference Series Progress in characterization of the H-mode pedestal To cite this article: A W Leonard 2008 J. Phys.: Conf. Ser. 123 012001 View the article online for updates and
Optics in a Fish Tank Demonstrations for the Classroom
 Optics in a Fish Tank Demonstrations for the Classroom Introduction: This series of demonstrations will illustrate a number of optical phenomena. Using different light sources and a tank of water, you
Estimating the plasma flow in a recombining plasma from
 Paper P3-38 Estimating the plasma flow in a recombining plasma from the H α emission U. Wenzel a, M. Goto b a Max-Planck-Institut für Plasmaphysik (IPP) b National Institute for Fusion Science, Toki 509-5292,
Characterization of Edge Stability and Ohmic H-mode in the PEGASUS Toroidal Experiment
 Characterization of Edge Stability and Ohmic H-mode in the PEGASUS Toroidal Experiment M.W. Bongard, J.L. Barr, M.G. Burke, R.J. Fonck, E.T. Hinson, J.M. Perry, A.J. Redd, D.J. Schlossberg, K.E. Thome
Astronomy 203 practice final examination
 Astronomy 203 practice final examination Fall 1999 If this were a real, in-class examination, you would be reminded here of the exam rules, which are as follows: You may consult only one page of formulas
TRANSPORT PROGRAM C-MOD 5 YEAR REVIEW MAY, 2003 PRESENTED BY MARTIN GREENWALD MIT PLASMA SCIENCE & FUSION CENTER
 TRANSPORT PROGRAM C-Mod C-MOD 5 YEAR REVIEW MAY, 2003 PRESENTED BY MARTIN GREENWALD MIT PLASMA SCIENCE & FUSION CENTER C-MOD - OPPORTUNITIES AND CHALLENGES Prediction and control are the ultimate goals
Measuring Laser Diode Optical Power with an Integrating Sphere
 Measuring Laser Diode Optical Power with an Integrating Sphere Introduction Characterizing radiant sources like laser diodes accurately depends on the ability to measure their optical power output accurately.
INTERMITTENT TURBULENCE AND COHERENT
 INTERMITTENT TURBULENCE AND COHERENT STRUCTURES IN LAPD AND ET Troy A. Carter Dept. of Physics and Astronomy, UCLA acknowledgments: D. Pace, B. Brugman, R. Taylor, L. Schmitz, G. Morales, J. Maggs, M.
The Levitated Dipole Experiment: Towards Fusion Without Tritium
 The Levitated Dipole Experiment: Towards Fusion Without Tritium Jay Kesner MIT M.S. Davis, J.E. Ellsworth, D.T. Garnier, M.E. Mauel, P.C. Michael, P.P. Woskov MCP I3.110 Presented at the EPS Meeting, Dublin,
Physics of the detached radiative divertor regime in DIII-D
 Plasma Phys. Control. Fusion 41 (1999) A345 A355. Printed in the UK PII: S741-3335(99)97299-8 Physics of the detached radiative divertor regime in DIII-D M E Fenstermacher, J Boedo, R C Isler, A W Leonard,
Alcator C-Mod. Particle Transport in the Alcator C-Mod Scrape-off Layer
 Alcator C-Mod Particle Transport in the Alcator C-Mod Scrape-off Layer B. LaBombard, R.L. Boivin, B. Carreras, M. Greenwald, J. Hughes, B. Lipschultz, D. Mossessian, C.S. Pitcher, J.L. Terry, S.J. Zweben,
Divertor Heat Flux Reduction and Detachment in NSTX
 1 EX/P4-28 Divertor Heat Flux Reduction and Detachment in NSTX V. A. Soukhanovskii 1), R. Maingi 2), R. Raman 3), R. E. Bell 4), C. Bush 2), R. Kaita 4), H. W. Kugel 4), C. J. Lasnier 1), B. P. LeBlanc
Calibration of and Measurements from the C-Mod MSE Diagnostic
 Calibration of and Measurements from the C-Mod MSE Diagnostic Howard Y. Yuh, MIT Steve D. Scott, PPPL R. Granetz, E.S.Marmar, S.M.Wolfe, D.Beals,MIT W.Rowan, R.Bravenec, M.Sampsell, U.Texas Austin Motional
Helium-3 transport experiments in the scrape-off layer with the Alcator C-Mod omegatron ion mass spectrometer
 PHYSICS OF PLASMAS VOLUME 7, NUMBER 11 NOVEMBER 2000 Helium-3 transport experiments in the scrape-off layer with the Alcator C-Mod omegatron ion mass spectrometer R. Nachtrieb a) Lutron Electronics Co.,
Driving Mechanism of SOL Plasma Flow and Effects on the Divertor Performance in JT-60U
 EX/D-3 Driving Mechanism of SOL Plasma Flow and Effects on the Divertor Performance in JT-6U N. Asakura ), H. Takenaga ), S. Sakurai ), G.D. Porter ), T.D. Rognlien ), M.E. Rensink ), O. Naito ), K. Shimizu
Nuclear Fusion Energy Research at AUB Ghassan Antar. Physics Department American University of Beirut
 Nuclear Fusion Energy Research at AUB Ghassan Antar Physics Department American University of Beirut Laboratory for Plasma and Fluid Dynamics [LPFD) Students: - R. Hajjar [Physics] - L. Moubarak [Physics]
STEADY-STATE EXHAUST OF HELIUM ASH IN THE W-SHAPED DIVERTOR OF JT-60U
 Abstract STEADY-STATE EXHAUST OF HELIUM ASH IN THE W-SHAPED DIVERTOR OF JT-6U A. SAKASAI, H. TAKENAGA, N. HOSOGANE, H. KUBO, S. SAKURAI, N. AKINO, T. FUJITA, S. HIGASHIJIMA, H. TAMAI, N. ASAKURA, K. ITAMI,
How does your eye form an Refraction
 Astronomical Instruments Eyes and Cameras: Everyday Light Sensors How does your eye form an image? How do we record images? How does your eye form an image? Refraction Refraction is the bending of light
ARTICLES PLASMA DETACHMENT IN JET MARK I DIVERTOR EXPERIMENTS
 ARTICLES PLASMA DETACHMENT IN JET MARK I DIVERTOR EXPERIMENTS A. LOARTE, R.D. MONK, J.R. MARTÍN-SOLÍSa,D.J.CAMPBELL, A.V. CHANKIN b, S. CLEMENT, S.J. DAVIES, J. EHRENBERG, S.K. ERENTS c,h.y.guo, P.J. HARBOUR,
Experimental investigation of the parallel structure of fluctuations in the scrape-off layer of Alcator C-Mod
 Experimental investigation of the parallel structure of fluctuations in the scrape-off layer of Alcator C-Mod O. Grulke Max Planck Institute for Plasma Physics, Greifswald Branch, EURATOM Association,
DIAGNOSTICS FOR ADVANCED TOKAMAK RESEARCH
 DIAGNOSTICS FOR ADVANCED TOKAMAK RESEARCH by K.H. Burrell Presented at High Temperature Plasma Diagnostics 2 Conference Tucson, Arizona June 19 22, 2 134 /KHB/wj ROLE OF DIAGNOSTICS IN ADVANCED TOKAMAK
Fluctuation statistics in the scrape-off layer of Alcator C-Mod
 Fluctuation statistics in the scrape-off layer of Alcator C-Mod R. Kube, O. E. Garcia, B. LaBombard, and J. L. Terry We study long time series of the ion saturation current and floating potential, obtained
Experiment 3 1. The Michelson Interferometer and the He- Ne Laser Physics 2150 Experiment No. 3 University of Colorado
 Experiment 3 1 Introduction The Michelson Interferometer and the He- Ne Laser Physics 2150 Experiment No. 3 University of Colorado The Michelson interferometer is one example of an optical interferometer.
Pedestals and Fluctuations in C-Mod Enhanced D α H-modes
 Pedestals and Fluctuations in Enhanced D α H-modes Presented by A.E.Hubbard With Contributions from R.L. Boivin, B.A. Carreras 1, S. Gangadhara, R. Granetz, M. Greenwald, J. Hughes, I. Hutchinson, J. Irby,
Effect of secondary beam neutrals on MSE: theory
 Effect of secondary beam neutrals on MSE: theory S. Scott (PPPL) J. Ko, I. Hutchinson (PSFC/MIT) H. Yuh (Nova Photonics) Poster NP8.87 49 th Annual Meeting, DPP-APS Orlando, FL November 27 Abstract A standard
Local Plasma Parameters and H-Mode Threshold in Alcator C-Mod
 PFC/JA-96-42 Local Plasma Parameters and H-Mode Threshold in Alcator C-Mod A.E. Hubbard, J.A. Goetz, I.H. Hutchinson, Y. In, J. Irby, B. LaBombard, P.J. O'Shea, J.A. Snipes, P.C. Stek, Y. Takase, S.M.
Electron temperature barriers in the RFX-mod experiment
 Electron temperature barriers in the RFX-mod experiment A. Scaggion Consorzio RFX, Padova, Italy Tuesday 5 th October 2010 ADVANCED PHYSICS LESSONS 27/09/2010 07/10/2010 IPP GARCHING JOINT EUROPEAN RESEARCH
is the minimum stopping potential for which the current between the plates reduces to zero.
 Module 1 :Quantum Mechanics Chapter 2 : Introduction to Quantum ideas Introduction to Quantum ideas We will now consider some experiments and their implications, which introduce us to quantum ideas. The
Invessel Calibration of the Alcator C-Mod MSE Diagnostic
 Invessel Calibration of the Alcator C-Mod MSE Diagnostic Steve Scott (PPPL) Howard Yuh, Bob Granetz, Jinseok Ko, Ian Hutchinson (MIT/PSFC) APS/DPP Meeting Savannah, GA November 2004 Introduction Previously,
Impurity accumulation in the main plasma and radiation processes in the divetor plasma of JT-60U
 1 EX/P4-25 Impurity accumulation in the main plasma and radiation processes in the divetor plasma of JT-6U T. Nakano, H. Kubo, N. Asakura, K. Shimizu and S. Higashijima Japan Atomic Energy Agency, Naka,
Formation of High-b ECH Plasma and Inward Particle Diffusion in RT-1
 J Fusion Energ (2010) 29:553 557 DOI 10.1007/s10894-010-9327-6 ORIGINAL RESEARCH Formation of High-b ECH Plasma and Inward Particle Diffusion in RT-1 H. Saitoh Z. Yoshida J. Morikawa Y. Yano T. Mizushima
X-Ray Measurements of the Levitated Dipole Experiment
 X-Ray Measurements of the Levitated Dipole Experiment J. L. Ellsworth, J. Kesner, MIT Plasma Science and Fusion Center, D.T. Garnier, A.K. Hansen, M.E. Mauel, Columbia University, S. Zweben, Princeton
Phase ramping and modulation of reflectometer signals
 4th Intl. Reflectometry Workshop - IRW4, Cadarache, March 22nd - 24th 1999 1 Phase ramping and modulation of reflectometer signals G.D.Conway, D.V.Bartlett, P.E.Stott JET Joint Undertaking, Abingdon, Oxon,
On the physics of shear flows in 3D geometry
 On the physics of shear flows in 3D geometry C. Hidalgo and M.A. Pedrosa Laboratorio Nacional de Fusión, EURATOM-CIEMAT, Madrid, Spain Recent experiments have shown the importance of multi-scale (long-range)
MHD-Induced Alpha Particle Loss in TFTR. S.J. Zweben, D.S. Darrow, E.D. Fredrickson, G. Taylor, S. von Goeler, R.B. White
 MHD-Induced Alpha Particle Loss in TFTR S.J. Zweben, D.S. Darrow, E.D. Fredrickson, G. Taylor, S. von Goeler, R.B. White Princeton Plasma Physics Laboratory, P.O. Box 451, Princeton, NJ 8543 Abstract MHD-induced
Current Drive Experiments in the HIT-II Spherical Tokamak
 Current Drive Experiments in the HIT-II Spherical Tokamak T. R. Jarboe, P. Gu, V. A. Izzo, P. E. Jewell, K. J. McCollam, B. A. Nelson, R. Raman, A. J. Redd, P. E. Sieck, and R. J. Smith, Aerospace & Energetics
Electrode and Limiter Biasing Experiments on the Tokamak ISTTOK
 Electrode and Limiter Biasing Experiments on the Tokamak ISTTOK C. Silva, H. Figueiredo, J.A.C. Cabral,, I. Nedzelsky, C.A.F. Varandas Associação Euratom/IST, Centro de Fusão Nuclear, Instituto Superior
Large Plasma Device (LAPD)
") Large Plasma Device (LAPD) Over 450 Access ports Computer Controlled Data Acquisition Microwave Interferometers Laser Induced Fluorescence DC Magnetic Field: 0.05-4 kg, variable on axis Highly Ionized
Large Plasma Device (LAPD) Over 450 Access ports Computer Controlled Data Acquisition Microwave Interferometers Laser Induced Fluorescence DC Magnetic Field: 0.05-4 kg, variable on axis Highly Ionized
Sheared Flow Stabilization in the Z-Pinch
 1 IF/P7-28 Sheared Flow Stabilization in the Z-Pinch U. Shumlak, C.S. Adams, J.M. Blakely, B.J. Chan, R.P. Golingo, S.D. Knecht, B.A. Nelson, R.J. Oberto, M.R. Sybouts, and G.V. Vogman Aerospace & Energetics
Effects of q(r) on the Alpha Particle Ripple Loss in TFTR
 on the Alpha Particle Ripple Loss in TFTR") Effects of q(r) on the Alpha Particle Ripple Loss in TFTR S.J. Zweben, D.S. Darrow, S. Batha, R.V. Budny, M. Diesso, H. W. Herrmann, J. Giarrusso, M. Redi, H. Takahashi, S. von Goeler, R.B. White, and
Effects of q(r) on the Alpha Particle Ripple Loss in TFTR S.J. Zweben, D.S. Darrow, S. Batha, R.V. Budny, M. Diesso, H. W. Herrmann, J. Giarrusso, M. Redi, H. Takahashi, S. von Goeler, R.B. White, and
Initial Investigations of H-mode Edge Dynamics in the PEGASUS Toroidal Experiment
 Initial Investigations of H-mode Edge Dynamics in the PEGASUS Toroidal Experiment M.W. Bongard, R.J. Fonck, K.E. Thome, D.S. Thompson 55 th Annual Meeting of the APS Division of Plasma Physics University
Drift-Driven and Transport-Driven Plasma Flow Components in the Alcator C-Mod Boundary Layer
 Drift-Driven and Transport-Driven Plasma Flow Components in the Alcator C-Mod Boundary Layer N. Smick, B. LaBombard MIT Plasma Science and Fusion Center PSI-19 San Diego, CA May 25, 2010 Boundary flows
Abstract. PEGASUS Toroidal Experiment University of Wisconsin-Madison
 Abstract Measurement capabilities for the Pegasus ST are increasing to support the scientific studies of plasma behavior at very-low A. Global parameters are obtained from equilibrium reconstructions constrained
II: The role of hydrogen chemistry in present experiments and in ITER edge plasmas. D. Reiter
 II: The role of hydrogen chemistry in present experiments and in ITER edge plasmas D. Reiter Institut für Plasmaphysik, FZ-Jülich, Trilateral Euregio Cluster Atomic and Molecular Data for Fusion Energy
Issues of Perpendicular Conductivity and Electric Fields in Fusion Devices
 Issues of Perpendicular Conductivity and Electric Fields in Fusion Devices Michael Tendler, Alfven Laboratory, Royal Institute of Technology, Stockholm, Sweden Plasma Turbulence Turbulence can be regarded
Internal magnetic field measurement in tokamak plasmas using a Zeeman polarimeter
 PRAMANA cfl Indian Academy of Sciences Vol. 55, Nos 5 & 6 journal of Nov. & Dec. 2000 physics pp. 751 756 Internal magnetic field measurement in tokamak plasmas using a Zeeman polarimeter M JAGADEESHWARI
Abstract Submitted for the DPP99 Meeting of The American Physical Society
 Abstract Submitted for the DPP99 Meeting of The American Physical Society Sorting Category: 5.1.1.2(Experimental) Calibration of a Three Path Thomson System at DIII- D 1 B.D. BRAY, C.L. HSIEH, T.N. CARLSTROM,
Effect of divertor nitrogen seeding on the power exhaust channel width in Alcator C-Mod
 Effect of divertor nitrogen seeding on the power exhaust channel width in Alcator C-Mod B. LaBombard, D. Brunner, A.Q. Kuang, W. McCarthy, J.L. Terry and the Alcator Team Presented at the International
Analyses of Visible Images of the Plasma Periphery Observed with Tangentially Viewing CCD Cameras in the Large Helical Device
 Analyses of Visible Images of the Plasma Periphery Observed with Tangentially Viewing CCD Cameras in the Large Helical Device M. SHOJI, T. WATANABE, S. MASUZAKI, H. YAMADA, A. KOMORI and LHD Experimental
Partially Coherent Fluctuations in Novel High Confinement Regimes of a Tokamak
 Partially Coherent Fluctuations in Novel High Confinement Regimes of a Tokamak István Cziegler UCSD, Center for Energy Research Center for Momentum Transport and Flow Organization Columbia Seminar Feb
Model Answer (Paper code: AR-7112) M. Sc. (Physics) IV Semester Paper I: Laser Physics and Spectroscopy
 M. Sc. (Physics) IV Semester Paper I: Laser Physics and Spectroscopy") Model Answer (Paper code: AR-7112) M. Sc. (Physics) IV Semester Paper I: Laser Physics and Spectroscopy Section I Q1. Answer (i) (b) (ii) (d) (iii) (c) (iv) (c) (v) (a) (vi) (b) (vii) (b) (viii) (a) (ix)
Model Answer (Paper code: AR-7112) M. Sc. (Physics) IV Semester Paper I: Laser Physics and Spectroscopy Section I Q1. Answer (i) (b) (ii) (d) (iii) (c) (iv) (c) (v) (a) (vi) (b) (vii) (b) (viii) (a) (ix)
Simulation of Double-Null Divertor Plasmas with the UEDGE Code
 Preprint UCRL-JC-134341 Simulation of Double-Null Divertor Plasmas with the UEDGE Code M. E. Rensink, S. L. Allen, G. 0. Porter, T. 0. Rognlien This article was submitted to 7th International Workshop
The Effects of Noise and Time Delay on RWM Feedback System Performance
 The Effects of Noise and Time Delay on RWM Feedback System Performance O. Katsuro-Hopkins, J. Bialek, G. Navratil (Department of Applied Physics and Applied Mathematics, Columbia University, New York,
GA A26741 SCINTILLATOR-BASED DIAGNOSTIC FOR FAST ION LOSS MEASUREMENTS ON DIII-D
 GA A26741 SCINTILLATOR-BASED DIAGNOSTIC FOR FAST ION LOSS MEASUREMENTS ON DIII-D by R.K. FISHER, D.C. PACE, M. GARCÍA-MUÑOZ, W.W. HEIDBRINK, C.M. MUSCATELLO, M.A. VAN ZEELAND and Y.B. ZHU JUNE 2010 DISCLAIMER
C-Mod Transport Program
 C-Mod Transport Program PAC 2006 Presented by Martin Greenwald MIT Plasma Science & Fusion Center 1/26/2006 Introduction Programmatic Focus Transport is a broad topic so where do we focus? Where C-Mod
Progress of Confinement Physics Study in Compact Helical System
 1st IAEA Fusion Energy Conference Chengdu, China, 16-1 October, 6 IAEA-CN-149/ EX/5-5Rb Progress of Confinement Physics Study in Compact Helical System S. Okamura et al. NIFS-839 Oct. 6 1 EX/5-5Rb Progress
This is a repository copy of Radial localization of edge modes in Alcator C-Mod pedestals using optical diagnostics.
 This is a repository copy of Radial localization of edge modes in Alcator C-Mod pedestals using optical diagnostics. White Rose Research Online URL for this paper: http://eprints.whiterose.ac.uk/539/ Version:
Experiments with a Supported Dipole
 Experiments with a Supported Dipole Reporting Measurements of the Interchange Instability Excited by Electron Pressure and Centrifugal Force Introduction Ben Levitt and Dmitry Maslovsky Collisionless Terrella
Equilibrium Evolution in the ZaP Flow Z-Pinch
 1 IC/P7-11 Equilibrium Evolution in the ZaP Flow Z-Pinch U. Shumlak, C.S. Adams, R.P. Golingo, D.J. Den Hartog, S.L. Jackson, S. D. Knecht, K. A. Munson, B.A. Nelson, ZaP Team Aerospace & Energetics Research
10. Wavelength measurement using prism spectroscopy
 Spk 0. Wavelength measurement using prism spectroscopy 0. Introduction The study of emitted spectra of electromagnetic waves by excited atoms makes for one of the most important methods to investigate
6. ELECTRODE EXPERIMENT
 6. ELECTRODE EXPERIMENT The purpose of this Section is to illustrate how the electrodes for PROTO-SPHERA have been developed. They were the most unconventional items and among the major concerns, when
Density Limit and Cross-Field Edge Transport Scaling in Alcator C-Mod
 EX/D- Density Limit and Cross-Field Edge Transport Scaling in Alcator C-Mod B. LaBombard ), M. Greenwald ), R.L. Boivin ), B..A. Carreras 3), J.W. Hughes ), B. Lipschultz ), D. Mossessian ), C.S. Pitcher